
8.1 – Choosing Calls over Puts
Similar to the Bear Put Spread, the Bear Call Spread is a two leg option strategy invoked when the view on the market is ‘moderately bearish’. The Bear Call Spread is similar to the Bear Put Spread in terms of the payoff structure; however there are a few differences in terms of strategy execution and strike selection. The Bear Call spread involves creating a spread by employing ‘Call options’ rather than ‘Put options’ (as is the case in bear put spread).
You may have a fundamental question at this stage – when the payoffs from both Bear Put spread and Bear Call spread are similar, why should one choose a Bear Call spread over a Bear Put spread?

Well, this really depends on how attractive the premiums are. While the Bear Put spread is executed for a debit, the Bear Call spread is executed for a credit. So if you are at a point in the market where –
- The markets have rallied considerably (therefore CALL premiums have swelled)
- The volatility is favorable
- Ample time to expiry
And you have a moderately bearish outlook going forward, then it makes sense to invoke a Bear Call Spread for a net credit as opposed to invoking a Bear Put Spread for a net debit. Personally I do prefer strategies which offer net credit rather than strategies which offer net debit.
8.2 – Strategy Notes
The Bear Call Spread is a two leg spread strategy traditionally involving ITM and OTM Call options. However you can create the spread using other strikes as well. Do remember, the higher the difference between the two selected strikes (spread), larger is the profit potential.
To implement the bear call spread –
- Buy 1 OTM Call option (leg 1)
- Sell 1 ITM Call option (leg 2)
Ensure –
- All strikes belong to the same underlying
- Belong to the same expiry series
- Each leg involves the same number of options
Let us take up example to understand this better –
Date – February 2016
Outlook – Moderately bearish
Nifty Spot – 7222
Bear Call Spread, trade set up –
- Buy 7400 CE by paying Rs.38/- as premium; do note this is an OTM option. Since money is going out of my account this is a debit transaction
- Sell 7100 CE and receive Rs.136/- as premium, do note this is an ITM option. Since I receive money, this is a credit transaction
- The net cash flow is the difference between the debit and credit i.e 136 – 38 = +98, since this is a positive cashflow, there is a net credit to my account.
Generally speaking in a bear call spread there is always a ‘net credit’, hence the bear call spread is also called referred to as a ‘credit spread’. After we initiate the trade, the market can move in any direction and expiry at any level. Therefore let us take up a few scenarios to get a sense of what would happen to the bear put spread for different levels of expiry.
Scenario 1 – Market expires at 7500 (above the long Call)
At 7500, both the Call options would have an intrinsic value and hence they both would expire in the money.
- 7400 CE would have an intrinsic value of 100, since we have paid a premium of Rs.38, we would be in a profit of 100 – 38 = 62
- 7100 CE would have an intrinsic value of 400, since we have sold this option at Ra.136, we would incur a loss of 400 – 136 = -264
- Net loss would be -264 + 62 = – 202
Scenario 2 – Market expires at 7400 (at the long call)
At 7400, the 7100 CE would have an intrinsic value and hence would expire in the money. The 7400 CE would expire worthless.
- 7400 CE would expire worthless, hence the entire premium of Rs.38 would be written of as a loss.
- 7100 CE would have an intrinsic value of 300, since we have sold this option at Ra.136, we would incur a loss of 300 – 136 = -164
- Net loss would be -164 -38 = – 202
Do note, the loss at 7400 is similar to the loss at 7500 pointing to the fact that above a certain point loss is capped to 202.
Scenario 3 – Market expires at 7198 (breakeven)
At 7198, the trade neither makes money or losses money, hence this is considered a breakeven point. Let us see how the numbers play out here –
- At 7198, the 7100CE would expire with an intrinsic value of 98. Since we have sold the option at Rs.136, we get to retain a portion of the premium i.e 136 – 98 = +38
- 7400 CE would expire worthless, hence we will lose the premium paid i.e 38
- Net payoff would -38 + 38 = 0
This clearly indicates that the strategy neither makes money or losses money at 7198.
Scenario 4 – Market expires at 7100 (at the short call)
At 7100, both the Call options would expire worthless, hence it would be out of the money.
- 7400 would not have any value, hence the premium paid would be a complete loss, i.e Rs.38
- 7100 will also not have any intrinsic value, hence the entire premium received i.e Rs.136 would be retained back
- Net profit would be 136 – 38 = 98
Clearly, as and when the market falls, the strategy makes a profit.
Scenario 5 – Market expires at 7000 (below the short call)
This scenario tests the profitability of the strategy when the market falls further. At 7000, both the call options would expire worthless. While we treat the premium paid for 7400 CE i.e Rs.38 as a loss , we will retain the entire premium received for 7100 CE i.e Rs.136 as a profit. Hence the net profit from the strategy would be 136-38 = 98. Clearly, as and when the market falls, the strategy tends to make money, but it is capped to Rs.98.
Here is the payoff for the strategy at different expiries –
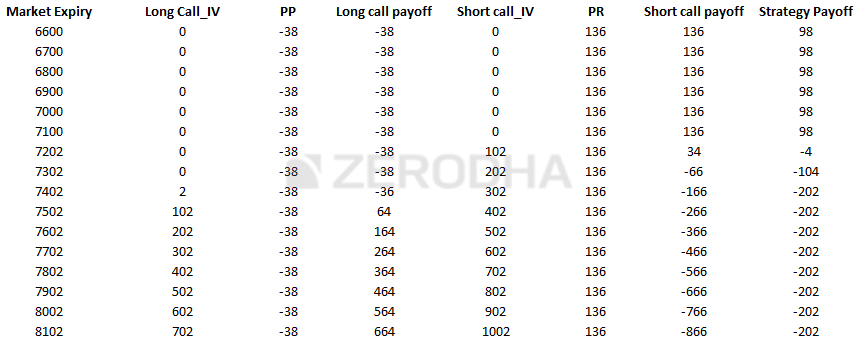
These payoffs can be plotted to get the graph of the strategy payoff –
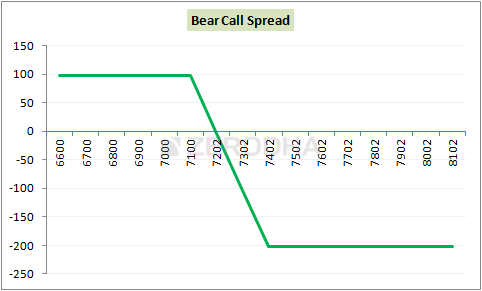
As you can observe, the payoff is similar to a bear put spread where both the profits under best case scenario and losses under worst case scenario is pre defined.
8.3 – Strategy Generalization
Going by the above payoff we can generalize the key trigger points for the strategy –
- Spread = Difference between the strikes
- 7400 – 7100 = 300
- Net Credit = Premium Received – Premium Paid
- 136 – 38 = 98
- Breakeven = Lower strike + Net Credit
- 7100 + 98 = 7198
- Max Profit = Net Credit
- Max Loss = Spread – Net Credit
- 300 – 98 = 202
At this stage, we can add up the Deltas to get the overall position delta to know the strategy’s sensitivity to the directional movement.
From the BS calculator I got the Delta values as follows –
- 7400 CE is OTM option and has a delta of +0.32
- 7100 CE is ITM option and has a delta of +0.89
- Since we are short 7100 CE, the delta is –(+0.89) = -0.89
- Overall position delta is = +0.32 + (-0.89) = -0.57
The delta of the strategy is negative, and it indicates that the strategy makes money when the underlying goes down, and makes a loss when the underlying goes up.
8.4 – Strike Selection and impact of Volatility
The following images help us identify the best call option strikes to choose, given the time to expiry. We have discussed the split up of time frame (1st and 2nd half of the series) several times before, hence for this reason I will just post the graphs and the summary table.
Strikes to select when we are in the 1st half of the series –
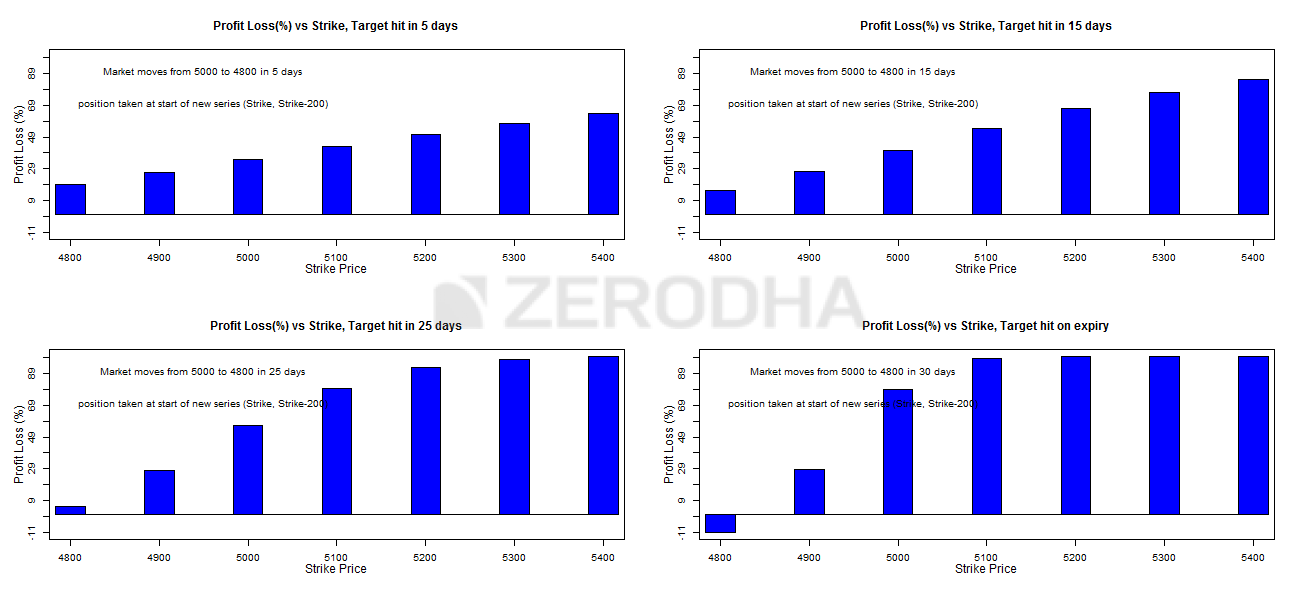
| Expect 4% move to happen within | Higher strike | Lower strike | Refer graph on |
|---|---|---|---|
| 5 days | Far OTM | ATM+2 strikes | Top left |
| 15 days | Far OTM | ATM + 2 strikes | Top right |
| 25 days | OTM | ATM + 1 strike | Bottom left |
| At expiry | OTM | ATM | Bottom right |
Strikes to select when we are in the 2nd half of the series –
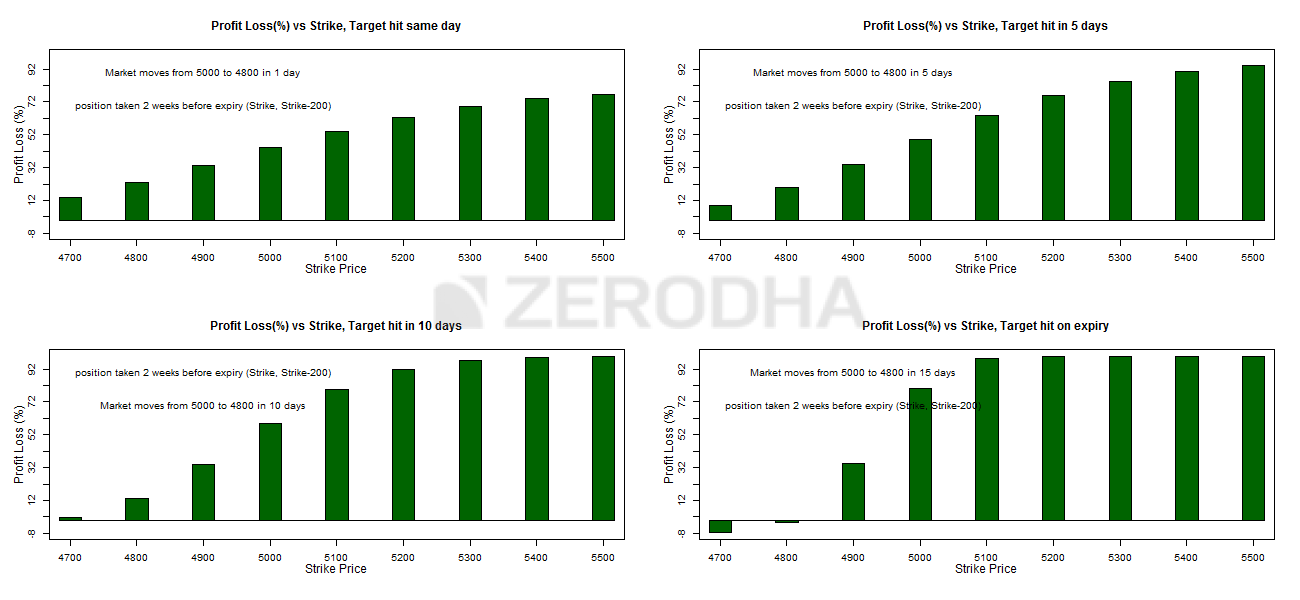
| Expect 4% move to happen within | Higher strike | Lower strike | Refer graph on |
|---|---|---|---|
| 5 days | Far OTM | Far OTM | Top left |
| 15 days | Far OTM | Slightly OTM | Top right |
| 25 days | Slightly OTM | ATM | Bottom left |
| At expiry | OTM | ATM/ITM | Bottom right |
The following graph talks about the variation in strategy cost with respect to changes in the volatility –
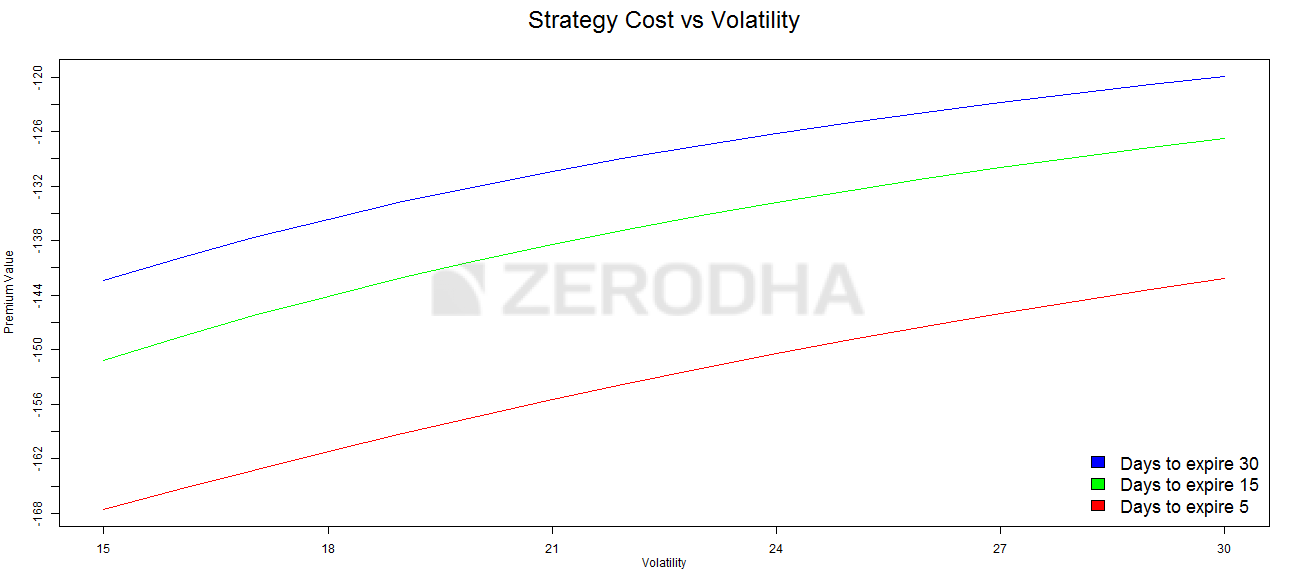
The graph above explains how the premium varies with respect to variation in volatility and time.
- The blue line suggests that the cost of the strategy does not vary much with the increase in volatility when there is ample time to expiry (30 days)
- The green line suggests that the cost of the strategy varies moderately with the increase in volatility when there is about 15 days to expiry
- The red line suggests that the cost of the strategy varies significantly with the increase in volatility when there is about 5 days to expiry
From these graphs it is clear that one should not really be worried about the changes in the volatility when there is ample time to expiry. However one should have a view on volatility between midway and expiry of the series. It is advisable to take the bear call spread only when the volatility is expected to increase, alternatively if you expect the volatility to decrease, its best to avoid the strategy.
Key takeaways from this chapter
- Bear call spread is best invoked when you are moderately bearish on the markets
- You choose a bear call spread over a bear put spread when the call option premiums are more attractive than put options.
- Both the profits and losses are capped
- Classic bear call spread involves simultaneously purchasing OTM call options and selling ITM call options
- Bear call spread usually results in a net credit, in fact this is another key reason to invoke a bear call spread versus a bear put spread
- Net Credit = Premium Received – Premium Paid
- Breakeven = Lower strike + Net Credit
- Max profit = Net Credit
- Max Loss = Spread – Net Credit
- Select strikes based on the time to expiry
- Implement the strategy only when you expect the volatility to increase (especially in the 2nd half of the series)
Download Bear Call Spread Excel Sheet
How do i automate this strategy bear call spread in zerodha kite? I dont know python or any other coding language and i am not of it professional background. I jusr want to remove emotional quotient from this strategy which i have been using since last 2 years but due to emotions always lose in one single trade whatever i earn throughout the year.
Pls guide and help.
Ashwini, maybe you can check this – https://www.youtube.com/watch?v=tD1z8lR0CDE and https://zerodha.com/z-connect/featured/connect-your-zerodha-account-to-ai-assistants-with-kite-mcp.
In the strike selection graphs shown above, which strike does the graph represent lower strike or the upper strike
Lower strike in most cases.
Hi Karthik,
In all the graph, it says \”position taken (strike, strike-200)\”. Does that mean the graph considers higher strike as strike and lower strike value is Higher strike-200 for it\’s P&L calculation?
Yeah, the graph is based on the position taken.
Should we trade in weekly or Monthly expiry of nifty? And if weekly please guide through the strike selection process.
You can stick to Monthly expires Akshay.
I wanted to understand the two tables explaining about how to select strike based on which half of the expiry are we executing our trades whether 1st or 2nd half of the expiry. In the table of the 2nd half the column of target expectation is 25 days, this is something that i don\’t understand. When we are in the second half of the expiry how can we be expecting the target in 25 days when max. days left for the expiry are only 15. And if the expectation is of 25 days shouldn\’t we be working in the next expiry? Please guide.
In 2nd half we dont consider 25 days right? We only look at 10 days and below?
The graph shows correctly. The table for 2nd half of expiry needs correction as it shows 5, 15, 25 and at expiry
Need to double check this, thanks.
Hi Sir,
What could be best strike selection if we have to execute credit spread on intraday basis?
Thanks.
You can stick to 1 strike above and below spot for max liquidity.
Hello sir
I noticed a typo in the “strike selection at the 2nd half of the series” table. The graphs show data for expiries at “same day, 5d, 10d and expiry” but the table has been mislabelled as “5d, 15d, 25d, expiry”.
Thank you for your work sir. The resource you have made is I think the gold standard for beginners to the stock market.
Thanks Aditya. Happy learning 🙂
Hello sir,
I noticed a typo in the “strike selection at the second half of the series” table. The graphs are for “same day, 5d, 10d, expiry” but the table is incorrectly lab
Ah ok. Let me check that and thanks for pointing that out. Cheers.
Hello SIR
Q.1 Executing a trade in the second half of the series means there are only 15 days left for the expiry, then how is
it possible to calculate strike price based on 25 days to expiry in second half ?
Q.2 You said if the volatility is about to decrease then it is better to avoid, but if volatility decreases so does
the premium which will be better as option seller, then why avoid decreasing premium opportunity ?
1) You can, but 25 days is as good as the start of the series, right?
2) Thats right. I think the discussion is from the perspective of the buyer.
Hello sir!
If i sell Bank Nifty 51400 ce at 277 & buy 51800 at 125 as a bear call spread, when the spot is at 51400, the max profit is 2294 and the max loss is 3706. Here the RR is 1:1.6.If suppose overnight the market goes against the spread i tend to make loss, so is there any solution where i can reduce the max loss and try to reduce the RR to 1, as max loss is more than the max profit.
thankyou!
Ah, the only way to deal with the breakeven, RR, and profit caps is by exploring different spreads. Try different strikes on Sensibull, you can visualize.
Which Greek do we consider or balance , for selecting the leg 1 strike price?
Hard to specify as all the greeks matter equally.
Sir,
In Bear Put spread, we have strategy cost as Net Debit and we learnt to take the strategy especially when we are expecting the volatility to increase and avoid the same when the volatility is expected to decrease.
In Bear Call spread, we have strategy cost as Net Credit. Similarly, we have been advised to take this strategy also when we are expecting the volatility to increase and avoid the same when the volatility is expected to decrease.
Now, I would like to know if the decision for taking both the strategies against volatility will be same? Or Am I missing somewhere?
N.B:
As far I could think the following:
1. When there will be Bear Put strategy (Net Debit), we should take the strategy when the volatility is expected to increase and avoid the same when the volatility is expected to decrease.
2. When there will be Bear Call strategy (Net Credit), we should take the strategy when the volatility is expected to decrease and avoid the same when the volatility is expected to increase.
I may have a wrong understanding on this and I would request you to please correct me.
Thats right. But besides this, your decision should also depend on the kind of premiums the options are trading at. If the premiums are expensive (driven by volatility), then strategies with net credit works, else net debit works.
Hello sir,
As mentioned in the earlier model about options you made it clear that with Time the OTM option strikes lose a lot of money then how can we buy OTM even on the expiry? In last options module in the fourth chart it was seen that t
Buying OTM strikes is not favourable when time to move is high.
Maybe it’s me who is having a bit of confusion. It will be great if you clarify it.
Thank you
Buying OTM works well when there is more time to expiry. But not when nearing the time of expiry.
As per this section, it is suggested to to buy 1 OTM Call option (leg 1) and Sell 1 ITM Call option (leg 2). But I was thinking the otherway – buy 1 ITM call and sell 1 OTM call. I was thinking this way because – ITM call: i think market would be bearish and to leverage this I buy 1 OTM call. I have tried this with paper trade and seem to have + P&L. I seem to understand the logic mentioned here but strategy looks really opposite to what is mentioned. This is same for other strategies as well. Kindly excuse if I\’m having some basic understanding issue as i\’m new to Options trading and I\’m trying out virtual trading in sensibull, neostox to validate my understanding of market.
Buying a call and selling a call (of another strike), creates a bull call spread Vijay, and for this to work in your favor, you need the market to go up. The strategy we are discussing here is a bear call spread, for which to work, the market has to go decline. By the way, you can punch in these numbers in Sensibull to see how the payoff looks 🙂
What about the risk to reward? The max loss is 202 and max profit is 98. I believe the example should also reflect the same.
Isn\’t that the risk to reward?
Would love to have your download spreadsheet for Bear Call Spreads but there is a mistake in the Strategy sheet. You have listed Long Call (OTM) and Short Put (ITM). This short put should be a short call, right? I entered numbers assuming it was just a typo but it seems the values come out incorrect also, so there\’s a problem with the underlying calculation. Please fix! WOuld love to use this spreadsheet.
Sure, let me check this and thanks for pointing 🙂
Sir,
For the strike selection second half, i think it needs correction for target achieved within same day, 5 days, 10 days and expiry instead of 5 days, 15 days, 25 days and expiry.
Yeah, will check this again.
Really What percentage of profit we expect from these strategies..
In bear call spread , If we do far out of the money also we get 20% of profit on capital…is it really possible..
Selling 70 premium call and buying 30 premium ce sensibull showing 87percent probability of profit..with this stratagy can i settle my life…
Hi
Can we do this stratagy selling and buying far out of the money..
Bank nifty 3600
Sell at 37500 and buying 38000
You can try, but I\’m not sure about the liquidity.
But in this case risk reward is not favorable sir. There is more loss compared to profit
You need to keep track of the premiums and initiate the spread when you think the premiums are favorable from a risk-reward perspective.
Strikes selection based on days to target and volatility:
Here you have picked 4% move for sake of discussion. Does the same strike selection criterion apply for other moves like (2% or 3% or may be 5%, 6%)?
or do we need any adjustments to it?
Yes, it does. No adjustments as such. It\’s the same procedure.
Hi Karthik,
Thank you for providing great content.
Its good to implement Bear Call spread if we have moderately bearish outlook. But incase if I don\’t have bearish outlook I mean I just believe Nifty will not cross above 16800(till March 17th expiry) it will trade below 16800 for this expiry then which strategy is best to implement..? I tried the strategy as below selling 16800CE(March 17th expiry) and buying 17000CE(March 17th expiry, this is for edging) but the risk reward ratio is not favorable.
+1x 17MAR2022 17000CE – ₹ 75(0)
-1x 17MAR2022 16800CE – ₹ 143.65(0)
Max. Profit ₹ +3,432 (12.73%)
Max. Loss ₹ -6,568 (-24.35%)
If I buy any position(ex:16900,17000,17100 CE\’s) above 16800 as a hedge the R:R is not good If I buy any ITM/ATM the payoff chart is changing.
Request you to suggest how to take edge position with good R:R if I believe that the certain level will not cross(resistance)/break(Support) for that expiry.
If you have a view that Nifty will not cross a certain level, then you can sell naked calls after keeping a buffer range right? You can even hedge the position by buying even higher strike. For example, if stock is at 90, you write strike 100 and buy strike 105. In fact you can sell 2 lots and offset it with 1 lot if you think the chances of market going up is very low.
Sir Forex and commodities markets are open, i mean there price do fluctuate..for about 24hrs but can we trade in them evem after 330 pm?
Currency is open for a little longer hours, Chetan. YOu can trade on NSE (via Kite).
There is mistake I think. correct me if I am wrong.
2nd half of the series, you mentioned 5,15,25,expiry. I think 25 days cant be there for monthly expiry.
Yeah, 2nd half of the series cant have 25 days. But 25 days is possible at the start of the series though.
Hi sir, thank you for your response. Request you to please clarify below points.
1. I am doing trading in index so why physical delivery margin is there, or should I ignore this margin call if I am trading in index?
2. If both the leg are OTM, will I still get the margin call?
3. What is the penalty if I ignore the margin call and hold the trade?
Thank you in advance
Hi sir, why do I recieve the below msg from Zerodha for bear call spread strategy. I do trade in one lot of nifty. Margins required for strategy is 30k and I have extra 10k unused margin available. Still recieved below msg…. please help.
\”EQ margin utilisation for BJ5599 has reached 318.84% of available balance. Add funds immediately on https://zrd.sh/funds. Positions can be squared off if margins are insufficient. -ZERODHA\”
Ankit, one of the positions must have been ITM and attracted physical delivery margin, hence the message.
Hi Karthik,
This line is not updated as i could see \”It is advisable to take the bear call spread only when the volatility is expected to increase, alternatively if you expect the volatility to decrease, its best to avoid the strategy\” which it suppose to be \”It is advisable to take the bear call spread only when the volatility is expected to decrease, alternatively if you expect the volatility to increase, its best to avoid the strategy\”
Thanks, Pradeep, let me review this again.
Sir,in 8.4 point-Strike Selection for 2nd half of series price movement to happen within- \”15 days\” & \”25 days\”,
Sir,how it can be possible ?
Please explain.Thanks 🙏
Have explained this in the comments, Sharad. Request you to kindly check this.
Hello Sir,
Usually this seems to be the case if you write far OTM options.
Such low risk vs rewards are good or not?
This depends on your own risk appetite, Santosh. What works for me, may not work for you.
Hello Sir,
If I go to trade a Nifty position with 300-400 points.
Assume I trade an OTM option, My max gain would be 2000 while max loss would easily be 18000-20000.
Are these trades suitable?
Yeah, so this depends on the actual premiums that are available at the time of creating the spread.
Hello Sir,
Are you saying you keep a 7-8% spread between strike prices??
Isn\’t that a very large amount?
Ah, sorry. I had something else on mind. Yes, 7-8% is largish. If you are trading Nifty, look for about a 300-400 point spread.
Hello Sir,
You usually write monthly expiries correct. It gives you time to adjust your position if you are wrong. Hence you are playing on a directional basis and not theta basis.
Do you keep a large spread like 400 -500 points or a tight spread of 100-200 points?
Also how exactly would you adjust your position if required or completely square off your position?
Spread is usually about 7-8%, Santosh.
Hello Sir,
I am still currently holding onto that 17100 PE sell and 16600 PE buy position.
Currently it looks like there is a correction in nifty. But I don\’t believe nifty will fall below 17100 till next week.
If at all I need to adjust or close the position? How should I do this, I am a little confused caused the india VIX moved from 15 to 17.8 today.
The adjustment really depends on the premiums that prevail at that point. But generally speaking, you can look at adding another lot of 16600PE buy to this.
Hello Sir,
I had written 17100 PE and bought 16600 pe for protection when Nifty was trading at 17400.
Nifty moved up, afterwhich it started to move down.
It has not yet hit 17100 but it may or may not hit. What exactly could one do in this situation??
Nothing, because there is no trigger point yet right?
Hello Sir,
How would I negate direction risk by adding call options? I would sell calls? How far if needed?
You have mentioned that you usually sell monthly options if any case you are wrong you have time to adjust and get out if needed.
But I am really not sure how exactly I should adjust monthly positions and just blankly exit taking a substantial loss.
Long and short (different strikes or different expiries) on the same underlying will negate directional risk right? Instead of adjusting, why don\’t you initiate a spread position where you have much better visibility on P&L?
Hello Sir,
If I am trading using zerodha which has 20 per trade how expensive do the adjustments become?
Assuming I had written 16500 PE and protected it by buying 16300 PE while CMP was 17500. Even though it is a hedged position I would still lose 200- Premium received if the position went wrong at expiry.
Lets say Nifty moved to 16800 and there is still a 5 days till expiry, If I exit my position I would be exiting on the time value as my breakeven would be below 16500.
What kind of way could I adjust this position to reduce my loss? Exit 16500 and sell 2 lots 16300 to make it a put ratio spread ?
I am very confused about this sir?
If its Zerodha, yes, the brokerage is on the lower side, but not with others. But still, these costs add up. Other ways to hedge would be look at the call options to negate the directional risk. Adding more lots may not always be the best bet as in case you take a hit, it will hurt you twice as much.
Hello Sir,
I hope is well.
1) You have mentioned multiple times that you prefer writing monthly index options rather than weekly options correct?
2) Monthly Options don\’t have that time decay as compared to weekly and rely more on change in spot ?
3) I have two scenarios, Let say I have written Nifty 16500 PE September 30th Expiry. CMP is 17400. Suddenly market starts to reverse and go down. It goes down to 17000 which would most likely cause my 16500 to show a loss. Maybe Nifty stays around the 17000 range or maybe it decides to move further and reaches 16500.
3a) What should I do for this? If nifty remains at 17000 there would be no loss at expiry, if nifty moves down further I would face a loss.
3b) How exactly should I adjust my position? Can you mention some methods on how one could adjust option positions in this scenario?
In all your modules you have given all these strategies, but you have never mentioned on what someone can do if the position goes wrong and how one should go about it instead of straight away booking a loss.
Santosh, these adjustments come at very high costs and may not be viable to do. Also it adds a ton of complications, especially while adjusting option strategies. Hence I\’ve refrained from discussing these.
That said, adjusting or hedging a naked position is fairly easy. All you need to do is buy a further away PUT or call.
I can see this strategy is profitable most of the time, but my question is, what if the market starts coming in our direction?
Well in that case can we buy 1 more option but below the ITM strike?
So say I shorted 1 OTM 35500CE in BNF and against that I brought 35700CE, So if I am seeing the market is coming in my direction and started sustaining 35500 levels. Here, because the high IV premium is already buffed, there is no point in closing the position as most of the value is actually time.
So here can I implement 35400CE buy? So in case the market moves above 35500 this option will keep me covered and will cap my losses just in case one bad day doesn\’t wipe out my all profits?
Yes, of course, you can do that but that will increase the transaction cost of your trades. You may want to consider that into your strategy.
Hello Sir,
I have read that when creates a bear call spread in nifty.
It is advisable to set up something like this. Assuming 16000 is a big resistance, Sell 16000 CE buy 16500 CE.
The gap is very large, however if lets say nifty starts to move towards 16000 you could exit 16000 and sell 16200CE or 16300 CE.
Something like this..
Is is worth adjusting your strategy like this?
These are adjustments, Karan. Can get very expensive as it involves constant transactions.
Sir in 2nd half series, same day the HS AND LS are far OTM options why it is sir pls explain
P.S – sir you have written 5 days for same day in 2nd half series🙂
Hello Sir,
Assuming I have placed a bear call spread at 16100 CE and 16300 CE.
Nifty moves to 16060 and closes there. My Position will most likely be in a loss and there is a few days till expiry. Should I exit or wait?
Nifty moves to 16130 and closes there. My position is 100% in a loss currently. Should i just close my position or wait. My max loss would be at 16300.
This depends on how strong your conviction is, Hasan. If you are fully convinced, wait for it. Else just close the position and look for another opportunity.
Hello Sir,
So what should I do? Not initiate bear call spread positions?
You can, but dont try to adjust it. Track how the position moves and take a call.
Hello Sir,
I trust you are well.
1) For a Bear call spread, your main leg is selling an option and you always want to sell an option with less time to expiry to have the greatest chance of success. You have mentioned that there should be ample time to expiry.
2) Assume I calculate the volatility strategy and decide to write Nifty options when 1 SD away when there is 4-5 days before expiry.
Usually, my risk-reward is 0.15-0.18, etc (now that the IV is very low). I could initiate this strategy every week and gain 1000 every week but one bad week and I lose 12-13000 and 10 weeks of effort goes to waste.
What could I do about this?
3) What kind of stop-loss does one initiate for spread positions. Do you place n SL based on the spot or the main leg option premium?
Thats the issue, Hasan. One bad trade set-up can take away all the profits you\’ve made over the months. SL in these cases are hard since these positions are spreads and have a certain degree of protection baked into the position.
Hi, can you give an explanation as to what happens when volatility decreases after executing this strategy? You say that this strategy doesnt work here, but I want to understand how.
When volatility decreases, the premium also decreases, which means you\’d make a loss if you are long option.
I am applying this strategy in Stock options.
What if stock closes above the call I sold and call I bought?
Do I have to settle it physically? Or it will be settled in cash?
What if stock closes above the call I sold but below the call I bought?
Please answer.🙂
If its an index, it will be cash-settled, else physically settled.
Hello Karthik,
I had a question with respect to executing a multi-leg strategy like Bear Call Spread on a trading platform.
So a BCS requires me to sell 1 ITM CE and buy 1 OTM CE right, when I open up the margin calculator on Zerodha and test out the margin requirements by putting in today\’s value for Nifty options (ITM strike = 14400 and OTM strike = 14550) then total margin requirement is shown as 29,000 odd which makes sense since in combination the two positions will place a limit of the loss.
However when I go to implement the strategy on Kite, I can only place order at a time, when I place an order to short the ITM CE, the order gets rejected since the system tells me I need a margin of around INR 1.2 lakh and my account balance needs to be higher.
What is the workaround for this problem? Would I need to have the full margin money for a vanilla short option in order to initiate a multi-leg strategy? Is there some way I can initiate a multi leg strategy which would have their losses capped with a lower account balance?
Thanks!
For this, you need to buy the OTM CE first and then sell the ITM CE. When you execute it in this order, the system will know that you have a hedge against the sell CE and therefore reduce the margin requirement.
Hello Karthik,
I am still confused about the volatility part, please clarify as to what is best for Long CE/PE and Short CE/PE to be considered (how the volatility should be?) and does the volatility outlook remains the same for every situation or it will differ with time to expiry.
I also wanted to highlight that the 2nd series table depicts 5, 15, 25 days and at expiry, whereas it must have been the same day, 5 days, 10 days & at expiry. Please correct me and enlighten me on both the queries.
Juhi, the general thumb rule is that you buy options (does not matter which) when Volatility is low and expected to increase. You sell options otherwise. Let me check the graph again, but I think it is correct.
Dear Sir,
Why would a volatility increase affect bear call spread and bull put spread?
Both these strategies are net credit which means we are selling a higher ITM option.
When we sell options we would like the premium to decrease.
Shouldn\’t an increase in volatility be bad for these strategies?
The easiest way to answer these questions is by adding up the deltas. If the net delta is +ve, that means the overall position is long. For long positions, you want the volatility to increase which will lead to an increase in the premium. If the overall position delta is -ve, then you want the volatility to reduce so that the premium reduces and you profit out of the situation.
WHEN EXITING AN OPTION STRATEGY, CAN WE EXIT THE BUT LEG FIRST ?
Sell leg first to reduce margin.
Sir, I mean the last table the one below the graph with green bars under the heading \”Expect 4% move to happen within\”. It has been listed as 5 days, 15 days , 25 days and at expiry.
This is correct, Zed. We are considering different time to expiry.
On the last table w.r.t second half of the series, shouldn\’t the days to expiry be listed as same day, 5 days, 10 days and expiry.
Hmm, it does right?
Got it! Thanks mate.
Cheers!
Sounds good Karthik. also, the below is the excerpt from call ration back spread:
Red line – This is an interesting, counter intuitive outcome. When there are very few days to expiry, increase in volatility has a negative impact on the strategy! Think about it, increase in volatility when there are few days to expiry enhances the possibility of the option to expiry OTM, hence the premium decreases. So, if you are bullish on a stock / index with few days to expiry, and you also expect the volatility to increase during this period then thread cautiously.
Can you share rationale behind \”Think about it, increase in volatility when there are few days to expiry enhances the possibility of the option to expiry OTM, hence the premium decreases.\”?? I thought it could be either way i.e. ITM or OTM if volatility is increasing?
Yes, but think about it from time expiry perspective. You don\’t want to be in a situation where the option is OTM (due to volatility) and then there is no time for the option to bounce out of it.
No problem Karthik. Can you share your generalised view of volatility on Buy/Sell strategies & premium. Just a few pointers of the correlation please?
In general, for long PE/CE, its good to have volatility increasing after you initiate the transaction. Otherwise for short PE/CE. Of course, you need to look at the time to expiry in perspective for this. With a lot of time to expiry, the impact of volatility is slightly lower, but not so with less time to expiry.
Your below statement around bear call spread sounds confusing to me:
\”However one should have a view on volatility between midway and expiry of the series. It is advisable to take the bear call spread only when the volatility is expected to increase, alternatively if you expect the volatility to decrease, its best to avoid the strategy\”
Bear call spread is primarily a debit/sell strategy. In any sell strategy, one makes money when the premium decreases over time. Also, increase in volatility leads to increase in premium prices which will lead one to incur losses in this strategy if premium goes up.
Please clarify on the above. Thanks.
Hey Rajan, I think I\’ve mixed up the last line. Thanks for pointing that out 🙂
Hello Sir,
If I take bear call spread for a stock option on Monday and if the stock goes into trading ban by Tuesday can I still hold the position and exit on Thursday.
Is it same for any other strategy. If I have open positions with hedging for a stock and if the stock is banned can I exit after many days. Thank you Sir.
YOu can hold the position and you can exit the same. YOu cannot add more to position.
Hello Karthik,
Could you please clarify the part about volatility here in the above comment? Even I feel that, in a net credit strategy, it is better that volatility falls rather than increase. Many thanks.
Vinay, it depends on the time to expiry as well. But generally speaking, its good take the call if the vol is expected to increase. Have explained this in the chapter.
sir , as stock options are physically settled on expiry day
what if we have hedged position and few legs expire IN THE MONEY?
will we get cash settlement or how ?
plz reply karthik sir
This will get offset against each other, as long they are ITM.
Hello Sir,
Can you create some material on adjustment part of bear call spread? What adjustments shall be done if its on losing side though you have created bear call spread above Max pain +5%.
Regards,
Sure, will try and do this.
Dear Karthik,
Thanks for the great lessons !!
I was going through this chapter correct me if am wrong, if Nifty spot is 10900, and I decided to sell call at strike of 10900 @ Rs 104 having Delta of 0.513 . Further bought a call option of strike 11000 @ Rs 61 having Delta of 0.34 , therefore my total delta of -0.173 (Negative). Hence can i conclude if Nifty falls by 50 point on the same day or just next day , i would be earning approximate of 0.173*50 = 8.65 Rs per lot ?
Thanks in advance
Yes, you can conclude that.
I place a buy order for Nifty 23 July 11200 CE at a premium of Rs. 7. I also place a sell order for Nift 23 July 11100 CE at a premium of Rs. 15. While placing the sell order, the margin said was about Rs. 22,000
Is this margin fixed or will it increase as per the market movement. If the market goes up, will additional margin be blocked and similarly while market comes down, will some margin will be released?
If the answer to the above is yes, how will it be reflected in the fund statement – as I think this would be a continuous process of more margins be blocked as per the market movement. Will all of these be reflected in the fund statement. How would anyone see these changes clearly, if at all.
Let us assume that margin availability is more than 1 lakh and so it is sufficient and I am planning on letting this expire (lets assume)
Thanks
Sri
As long as the position is hedged and assuming you don\’t have other position to offset the hedge dynamics, the margins are fixed. But yes, there could be a variation in the margin and you can track this by looking at your margins statement. Check this – https://support.zerodha.com/category/trading-and-markets/trading-faqs/articles/what-is-a-daily-margin-statement√
You can even look at the fund statement on Console. On the funds statement, the previous day\’s margin blocked will be reversed and the current day\’s margin blocked will be blocked.
What is margin required in this strategy if I trade with 1 LOT each
Dhiraj, do check this – https://zerodha.com/margin-calculator/SPAN/
[…] Check this below example of margin required for a bear call spread. […]
Hello,
If I buy CE at higher Strick price and after buying this I will short lower Strick CE then I will get margin benifit or not.
Like in zerodha margin calculator if I add short CE first it will show margin requirement is of about 1 Lakhs and after that if I add buy leg with higher Strick my margin requirement is lower.
But if I do reverse of it that (adding buy CE and then adding short CE) then margin requirement is same there is no benefit shown in margin calculator.
While trading also this remain same that I have to short first and then buy or I can execute order in any way…
Yes, you will. Does not matter which leg is executed first. But you do get a margin benefit when you execute both the trades.
When max profit to max loss ratio is calculated, it\’s higher for bear put than bear call. But at the same time, bear call is net credit strategy. So, should I consider max profit to max loss ratio when I have to choose one of these two strategies?
No, you need to consider the market situation and deploy the right strategy to benefit from it. Don\’t go with the max loss/profit numbers.
Section 8.4 – 2nd table (just above the \’strategy cost vs Volatility graph\’
Hi Karthik, the second table on strike selection.. the \’expected 4% move to happen within\’ items (no. of days) are mentioned incorrectly, please rectify it.
I\’m unable to spot that. Can you please highlight the section number? Thanks.
Hi Karthik. Awesome content. Kudos for the great work. I was looking at the SPAN calculator for taking a Bear Call Spread position. My concern is, the margin required was almost 5x from the maximum possible loss. Can you throw some light on that?
I\’m glad you are liking the content, Tanmay!
Market volatility has shot up quite a bit in recent times, so higher margins is understandable. Btw, I dont think you should be looking at max loss and the margin blocked. You probably maybe be better off looking at max gain versus max loss ratio to get a sense of the risk reward.
Thanks
Welcome!
Cost of strategy means premium ?
Yes, the overall credit or debit of the premium.
Sir
When we are in 1st half of series, you have suggest ATM + 2 strikes to chose lower strike.
What does +2 strikes means ?
If ATM is 1000, then up to 2 strikes higher and lower than 1000 is what I mean. 1000 is just a reference here.
There is no concept of cost in this strategy. This strategy is initiated for a net credit. So the concept of cost of strategy should not exist for bear call and bear put strategies right?
Hmm, yes, ideally no cost. But this depends on the strike and premium as well.
Dear Karthik,
Hope you are doing well.
Karthik would you mind telling why you prefer Credit Spread strategies over Debit Spread ones? Are the former more advantageous or profitable in anyway?
Thanks.
~ Abudhar al Hassan.
Money in hand now is always better than money coming in later 🙂
🙂
True True. .
But please help me understand…
When u short an option is the premium deposited upfront? I always thought we would be getting the premium only upon expiry…or if we close d position in profit…
~ Abudhar al Hassan.
Yes, you will receive the premium upfront.
Also Karthik, I think that none of the option strategies..debit or credit…offer a good risk reward ratio…then why do people choose to go for such strategies? I mean wouldn\’t it be much better to either buy a Call or a Put as per your directional view and just put a stop loss that suits your risk appetite?
~ Abudhar al Hassan.
It does when you implement the right strategy at the right time, Abudhar.
Hey! In the beginning, you have mentioned that this strategy is applicable when \’The markets have rallied considerably (therefore CALL premiums have swelled)\’ & when \’The volatility is favorable\’. But the last para says \’It is advisable to take the bear call spread only when the volatility is expected to increase\’. Isn\’t this contradictory? Or perhaps, I\’m not understanding it correctly.
Thanks in advance!
Sachin, if volatility is expected to increase, then the premium too will increase and when the market rallies, the call premium increases, so both these events lead to the same outcome i.e increase in call premiums.
Okay, thanks for clearing that up, though I still think the two paras are contradictory here.
I was thinking of applying this strategy for January keeping in mind the budget on Feb 1. Will it right to think that during January, market will be volatile and thus the premiums will rise (while at the same time, having a slightly bearish outlook)? Thanks in advance!
Thanks
By drastic increase i think increase of 5 percent or more in a day ?
Yes, that should qualify.
If i am selling ATM call option and buying out of money call option and suppose stock moves upwards which will increase the premium of both tyhe strikes. In that case will i be required to pump any additional margin(suppose all my margins are blocked) which is required in case of naked option selling.
Yes, the premium will increase for both the strikes. You will get a margin benefit at the time of initiating the position, however, in case of a drastic increase in price, you will have to bring in additional margins.
Dear Karthik,
Thanks for the great lessons !!
You told that u can sell call options 1 SD away by selling OTM call options a week from the expiry date and collect the premiums but this strategy comes with unlimited risk..is there a way to make the trade with defined risk ?
Thanks in advance
Antony, defined risk usually comes with a spread or buying options. Buying options is not a great thing when closer to expiry and the spreads are too low around this time of expiry.
One thing with option writing though the risk is unlimited, it also has a lower probability of occurring (as long as you have taken enough care to choose the right strike).
ok. Thanks.Going to try it then
Good luck!
Hi,
Plz correct me if i am wrong . All The strategies explained is valid if the position is held till expiry.
Will this be helpful for intraday traders also? I guess payoff would be different
Yes, that is true. The positions are with respect to expiry. The intraday pay off would be slightly different but certainly not to way too different.
Dear Sir,
Can you provide the strike selection table for weekly bank nifty option ?
Thanks.
I\’ll try and do that sometime soon, Lawrence.
Is the strike selection for Bear Call Spread holds good for Bull Put spreads
Yup, you can use the same technique.
Karthik
Please note I just can not send my comment regarding correction of Excel sheet of Bear Call Spread.
Karthik
The Bear call Spread Excel sheet requires correction. Please advise.
Karthik
In bear call Spread Excel work sheet you have entered Long call and Short put -Please advise if it is a mistake and correct it.
Karthik
In bear call Spread Excel work sheet you have entered Long call and Short put – I believe it should have been long callOTM and short call ITM. Please advise if it is a mistake or some thing else.
Bal, thanks for letting me know. I will check this again.
Karthik
I meant Reverse Call/put ratio spread – mean if we are anticipating market to go up then going on Put back spread – going with Call spread if market is expected to go down.
Nothing on that yet. Hopefully, I can put that up one of these days.
Karthik
Have you got any module on Reverse Back ratio spread?
Have covered ratio spreads here – https://zerodha.com/varsity/chapter/put-ratio-back-spread/ , but this one is Put Ratio spread.
can i take delivery of a shorted nifty put contract and square it off(buy it again) within the month expiry?
Yes, you can do that.
but i need margins for that…..
what are the intraday margins required for shortselling a options contract?
You can use this to identify the intraday margins – https://zerodha.com/margin-calculator/BracketCover/
The max time period you have talked about in all these strategies are 30 days, so does it means we can\’t use this strategy with 60 day call/puts? I know there are options for many different months down the year so I was trying to understand.
You certainly can…you just need to extend the timeline.
hi Sir, there seems to be a mistake in the excel for \”Download the Bear Call Spread excel\”. it states \”Short Put (itm)\” whereas it should be \”Short Call (ITM)\”. Please correct it if it is a mistake. Thanks. people blindly following the excel will get impacted.
Thanks Rajiv, I\’ll check this and make the necessary corrections.
But in any case, loss is limited. Also can I include lesser number of options in the long call leg.
It has to be done is the same ratio. 1:1 in this case.
Hi Karthik,
In the last para you mention
\”It is advisable to take the bear call spread only when the volatility is expected to increase, alternatively if you expect the volatility to decrease, its best to avoid the strategy.\”
But here dominating call is the short one and what i understood from the previous modules we should short the option when we think volatility is expected to increase.
can you please explain it ?
Thanks,
When you look at muti leg option spreads, you should consider the entire strategy as a whole and not look into individual legs of the spread.
Hi Karthik , small confusion
If the volatility is high then the cost of the strategy(bear call spread) is low and vice versa.
AND when volatility is high , that is the best time to implement this strategy . Is this right. correct me if i am wrong.
Thanks&Regards
If volatility is high, then the cost also shoots up (refer to the graph). When Vol is high, its best to avoid initiating this strategy.
Hello Karthik,
I would like to clarify or suggest a couple of corrections in this module: 1. In the last para you mentioned \”It is advisable to take the bear call spread only when the volatility is expected to increase, alternatively if you expect the volatility to decrease, its best to avoid the strategy.\”. Generally it is always gives an edge to you when you enter a credit spread when volatility is high and when you expect it to fall in coming days (i mean this in addition to our view on direction of the market, which is obvious any way) as the premiums will come down volatility drops. So, keeping in view of this i believe its correct to say \”It is advisable to take the bear call spread when the volatility is expected to decrease, alternatively if you expect the volatility to increase substantially, its best to avoid the strategy\”. Please let me know if you think otherwise. (I understand most of the volatility will increase when markets are falling due to fear in the market, but it is also possible market can trade sideways in which case volatility may fall and trader can get profit from that. Any way this strategy need to be applied when one has a mild bearish view or at least stays around current price). 2. This one is about a typo \”Bull Put Spread, trade set up –\” in section 8.2. This should be changed \”Bear Call Spread, trade set up –\”. Bringing this point to your notice as those new to Options strategies should not get confused with this typo.
Thanks so much for pointing these out, the 2nd one is a typo, will fix that. About the volatility part, I will get back to you shortly.
hello sir, when can we have the pdf version (downloadable files) of the strategies.
Will put this up soon!
Hi kartik,
Can you make a chapter on commodities so we know everything about commodity trading
Very soon!
Sir,
In the bar chart where strike price selection is indicated, it will be interesting if Delta of the trade is also mentioned. Total profit and probability of the making profit. Here delta will also indicate the possibility of the trade making profit.
The explanation is as usual perfect. I am waiting for hedged trading strategies to come, where maximizing the profit may be tricky and will need more expert advised.
Hedging is good to limit your loss but I always think how to come out from the trade at the time when profit is optimize?
Thanks
Delta is just a measure of the \’direction ness\’ of the trade. It does not indicate the possibility of being successful. As we go forward, we will introduce few more hedged position strategies.
In the example above you have told to sell 7100pe
instead of 7100ce!! Can you please correct the same
Thanks for pointing, will make the necessary corrections. Please do let me know if you spot it else where. Thanks.
Whil starting the example , you have mentioned \”Bull Put Spread, trade set up\”. I think it should be \”Bear Call spread, trade Setup\”
Will correct this, thanks for pointing this!