
6.1 – Common sense approach
In the previous chapter, we built the Balance Sheet and P&L assumption. Within the P&L assumptions, we dealt with the revenue of the company as well. We did take a rather simplistic approach to estimate the revenue of the company. The approach is ok as long as you intend to build a simple financial model.
However, at times, taking efforts to build a dedicated revenue model of a company pays off. With a dedicated revenue model, you can identify the key revenue drivers and get some granular insights into the behaviour of these revenue drivers.
In this chapter, I’d like to discuss the approach you need to take while building a company’s revenue model. As you can imagine, the revenue model sits within the integrated financial model, just like the assumption sheet.
Think of the revenue model as a sub-model within the financial model.
I’ll take the example of Bajaj auto in this chapter to explain how one can build a company’s revenue model.
A sensible way to start building a revenue model is by asking common sense questions about the company. In most cases, these questions themselves segways into a template for the revenue model. We will take the same approach to build Bajaj Auto’s revenue model.
So here are a bunch of common-sense questions, and the answers to these questions will help us build the revenue model. By the way, the answers to all the questions are in the company’s annual report.
So let us start.
6.2 – Digging data
As a first step, I download the latest annual report (FY 2020-21) from Bajaj Auto’s website. I’d suggest you do the same. Like I mentioned, the annual report is where you will find all the information you’d need.

Usually, from my experience, as the company matures, the annual report also evolves and provides you with all the necessary information you’d need.
Anyway, let us get started with our common sense QnA. We will begin with a fundamental question.
What does Bajaj Auto do?
No brainer, we have seen Bajaj Auto’s bikes and autorickshaws flood the Indian streets. So it is evident that Bajaj manufactures and sells 2 and 3 wheelers. We will cross-check our assumption from the annual report as well.
From their annual report, we can see that our assumption is correct (image above if from the annual report). Bajaj does manufacture bikes and autorickshaws. The bikes are further segregated into different segments.
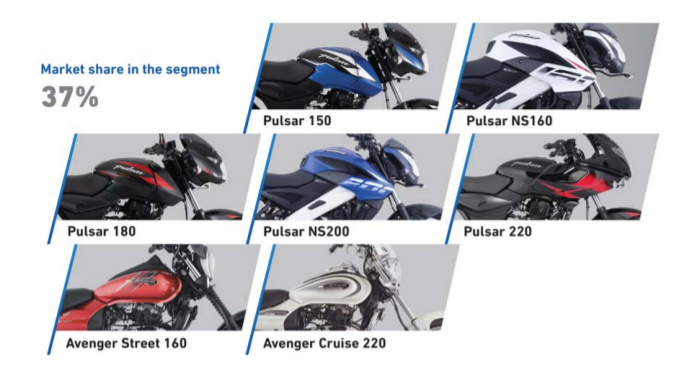
The image below shows the ‘sports segment’ or ’S segment’ bikes. Apart from the S segment, Bajaj has the Milage or M segment, Supersport or SS segment, Pro biking segment, and scooters.
But the point is Bajaj manufactures’ bikes’ or two-wheelers, so let us stick to that for now and ignore the segmentation of bikes.
Apart from bikes, they also manufacture autorickshaws’ Commerical Vehicles’ (CV) or the three-wheeler segment.
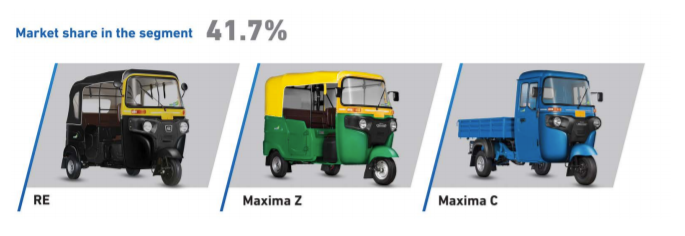
The CV category has different segments: passenger carrier (good old autorickshaws) and goods carrier.
Why are the segments important to a revenue model?
Well, if you know the segments within a category, you can also figure out the segment-wise revenue.
For example, the S segment is a segment within the bikes category, it will interesting to understand how much revenue they make segment-wise, and which are their popular segments, and what drives these segments.
With this information, you can build a granular revenue model. Unfortunately, the segment-wise revenue distribution is not available in the annual report. Hence we will consider revenue for the entire category as a whole, i.e. the two-wheeler (bikes) and the commercial vehicle (3 wheelers).
How much does Bajaj Auto manufacture?
I suppose this is also a straightforward question. As a financial modeller (or even an investor), you need to understand the manufacturing capacity of the company. The reason is simple.
Suppose they manufacture 100 bikes in the year, and if they are selling 60 bikes, then with this information we can interpret the following –
-
-
- The manufacturing plant operates at 60% capacity utilization. Capacity utilization is a simple ratio of how much they sell versus how much they manufacture.
- The company has enough manufacturing buffer to meet future demands
- The company is unlikely to spend more money in terms of CAPEX anytime soon
-
Other perspectives –
-
-
- Why is the company selling only 60?
- How much do their competitors sell?
- Where does the company stand in terms of competition?
- How big is the industry? How many bikes (across all companies) are sold in a year?
- What is the company’s market share? (company sales divided/industry sales)
-
These questions will help us size up the company and eventually help the investors in the valuation process.
Anyway, we will get back to the revenue model. I found this image in their annual report interesting –
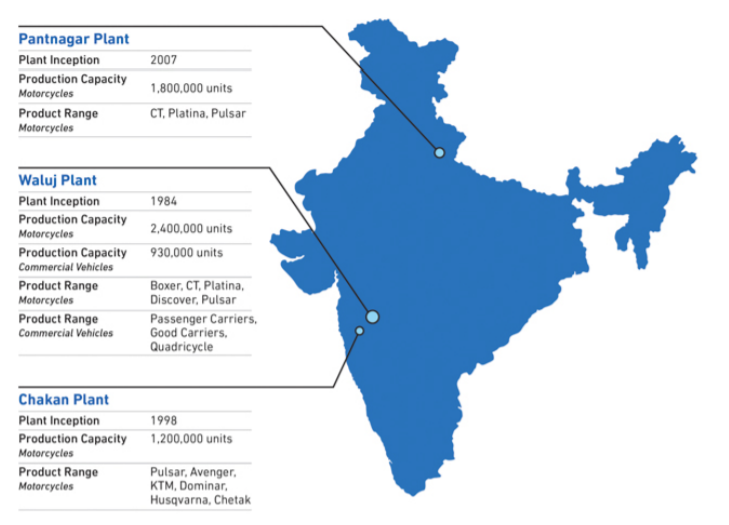
The image gives us all the information in one shot. Let me list down the information for you –
-
-
- The company has three manufacturing units (or plants) in India, located in – Pantnagar, Waluj, and Chakan.
- Waluj is the oldest plant (set up in 1984), while the Pantnagar plant is their newest.
- All plants have been operational for a long time now.
- Pantnagar plant has a production capacity to manufacture 1.8M bikes, no commercial vehicles here.
- Waluj plant has a production capacity to manufacture 2.4M bikes and 9.3L commercial vehicles. Waluj is a super important plant for Bajaj auto since this plant has production of both categories plus this is the only plant to manufacture commercial vehicles.
- Chakan plant has a production capacity to manufacture 1.2M units of bikes.
-
Since all the manufacturing facilities are old enough, assuming that the company has had a similar production capacity for the last few years is fair.
Where do they sell?
The question is to help us understand where their target market is. We have seen Bajaj vehicles across India. But do they sell in other countries apart from India?
Here is an extract from the annual report –
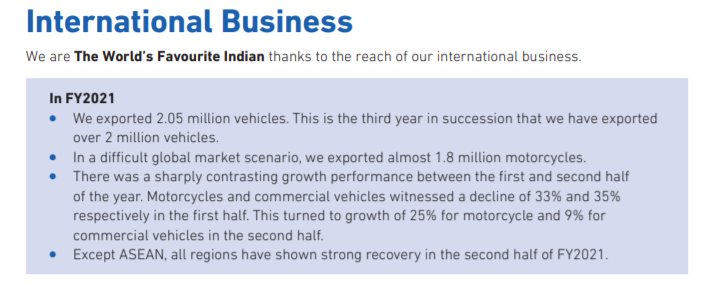
Without reading much into the details, we know –
-
-
- Bajaj Auto sells within India (domestic market)
- Bajaj Auto also sells outside India (international market)
-
From the extract, we can quickly note that Bajaj Auto sells around 2M vehicles in the global market.
How many units of two-wheelers and CVs does Bajaj Auto sell in India and the International market?
Now that we have established that Bajaj has a domestic and international market, it makes sense to figure out how many units of bikes and commercial vehicles are sold in India and in the International market.
From the annual report –
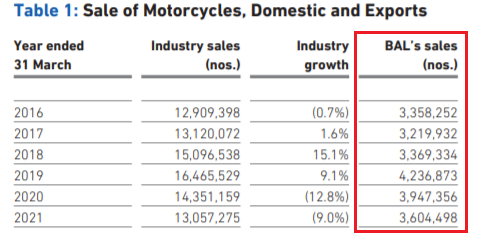
The highlighted data indicates the sale of domestic bikes. For example, in the year 2020, Bajaj Auto sold 3.9M bikes. The break up of 3.9M across different segments of bikes is not available (therefore no segment-wise revenue). But that’s ok for now.
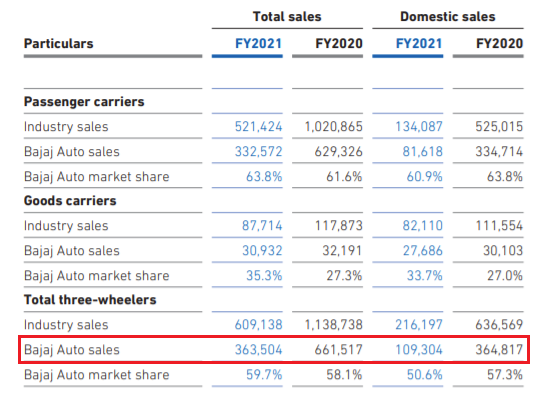
Data for Domestic CV sales –
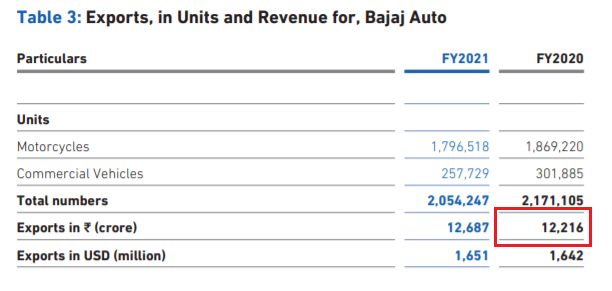
As far as the exports are concerned, here is the snapshot –

The company has only reported domestic sales numbers across motorcycles (bikes) and CV for FY20 and FY21. We will have to dig up the older annual reports for historical numbers.
Ok, a quick recap at this point. So far we know –
-
- The product the company sells
- Places where it manufactures the products
- The capacity of each manufacturing plant
- The geographies in which the company sells
- How many units the company sells across all their markets
That’s a fair bit of information. We now have to steer our way to find out details about how much money the company earns in terms of revenues.
Remember, so far, we collected information by asking ourselves a few common-sense questions. Once we collect all the necessary information, we make the revenue model on excel, step by step.
Let us continue our QnA.
How much revenue do they make?
The most crucial question perhaps 😊
Clearly, when we talk about revenue for this company, we need to figure four essential things –
-
-
- How much revenue is from domestic bikes sales?
- How much revenue is from domestic CV sales?
- How much revenue is from international bikes sales?
- How much revenue is from international CV sales?
-
If we can collect the above information, we are on track to build the revenue model.
But here is where the challenge occurs; the company does not easily give out this information. The information we have is –
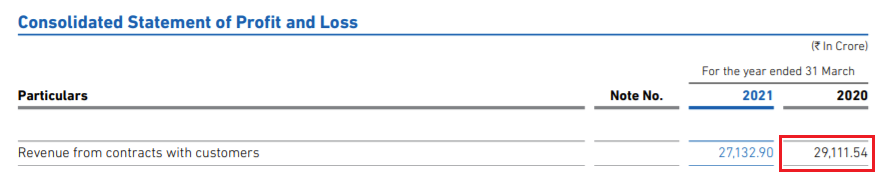
Revenue is a consolidated number, which includes both domestic and export revenue. But thankfully, Bajaj Auto gives us the export revenue –
With both these bits of information, we have to back work the details. For example, for FY 2020,
Revenue =Rs.29,111 Cr
Export Revenue = Rs.12,216 Cr
So Domestic revenue must be –
29111 – 12216
= Rs.16,895 Crs.
Once we have the revenue split from domestic and exports, we can do few other things to set up the revenue model.
6.3 – Connecting the dots
We have now gathered all the info required to build the revenue model. We now have to plug these values into an excel sheet and give it a logical sequence. Please note that if you are doing this yourself, as a first step, you will have to get the historical data from the annual report. In the section above, I’ve highlighted how the data is collected. Hopefully, that will help you accelerate your data collection process.
Given the data in hand, here are the steps that I’ll follow to develop the revenue model. As I have stressed earlier, the steps that I follow make sense to me; if you feel there is a better way, you should explore. Remember, there is no prescribed methods to build a model.
But I hope these steps will give you a good starting point.
Here is the overview of the steps I’ll carry out on excel –
-
-
- Organize the capacity data
- Gather the International sales data, i.e. the number of units of bikes and CV sold
- Gather the India sales data, i.e. the number of units of bikes and CV sold
- Add up the sales data to get consolidated bikes and CV sales data
- Input the historical revenue data
- Calculate the average cost of sale of bike and CV
- Identify the trend in change of average cost of sale
- Project the average price of the vehicle and reverse engineer the revenue data from the average prices.
-
If the steps above confuse you, then don’t worry, we will execute each of the steps, one at a time.
As a first step, we set up our excel sheet with the indexation. I’ve discussed this in the earlier chapters, so I’ll directly post the snapshot for your reference.
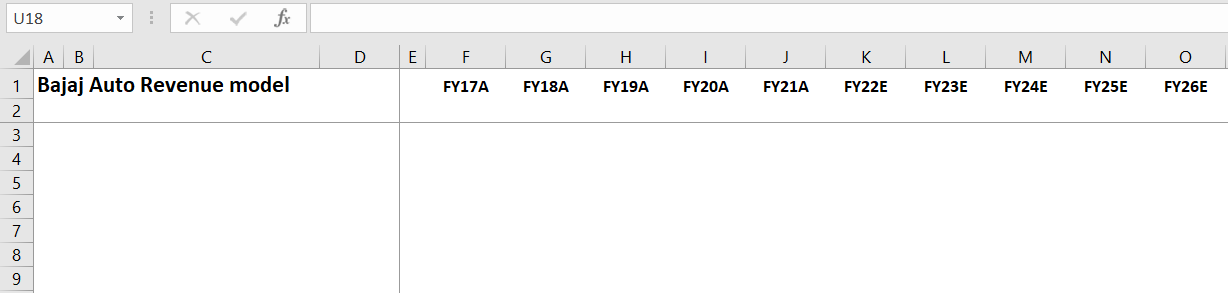
I guess you are reasonably familiar with the layout. Columns A and B are indexed, C expanded, panes frozen at E3. The actual financial years stated from F1 to J1, and the estimated years from K1 to O1.
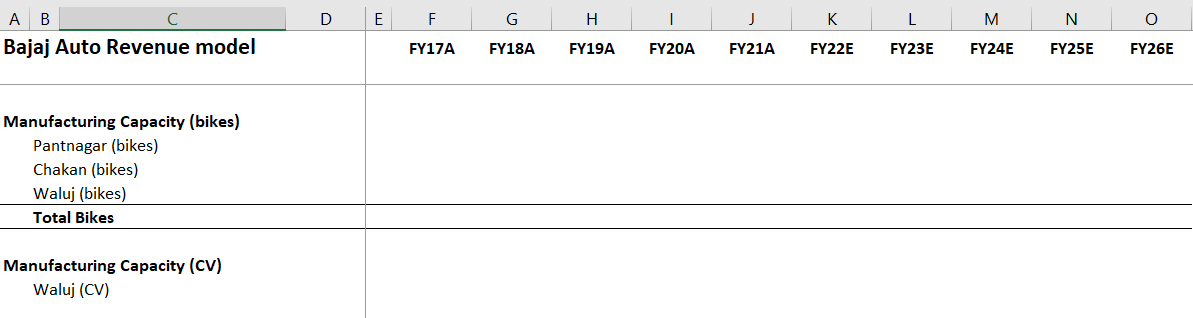
I have organized the manufacturing capacity data. Note I have segregated this in terms of bikes and CV, but you can also arrange the data from the manufacturing plant perspective.
I have populated the manufacturing capacity numbers –
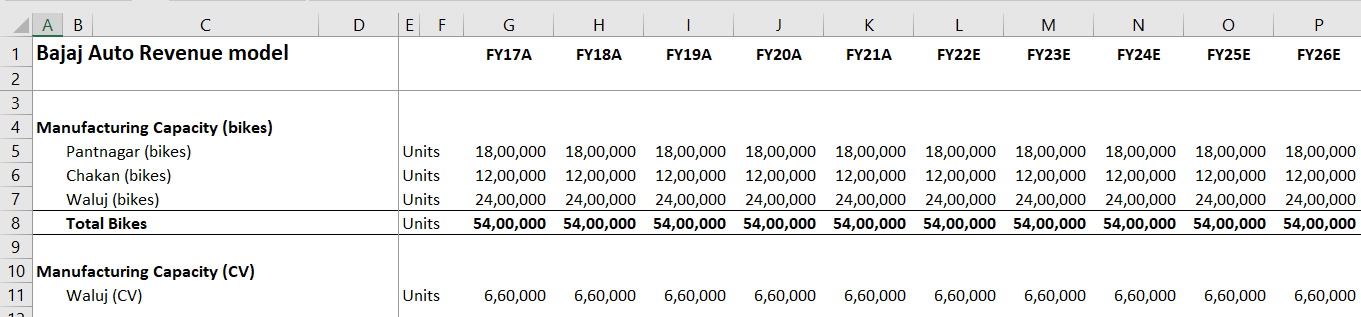
Note, the numbers are constant historically and for the future years as well.
Next up is the sales data. As I mentioned earlier, I’m interested in identifying the bike and CV sales in India and Internationally. Once I have the data, I’m also interested in year on year (YoY) changes in sales data.
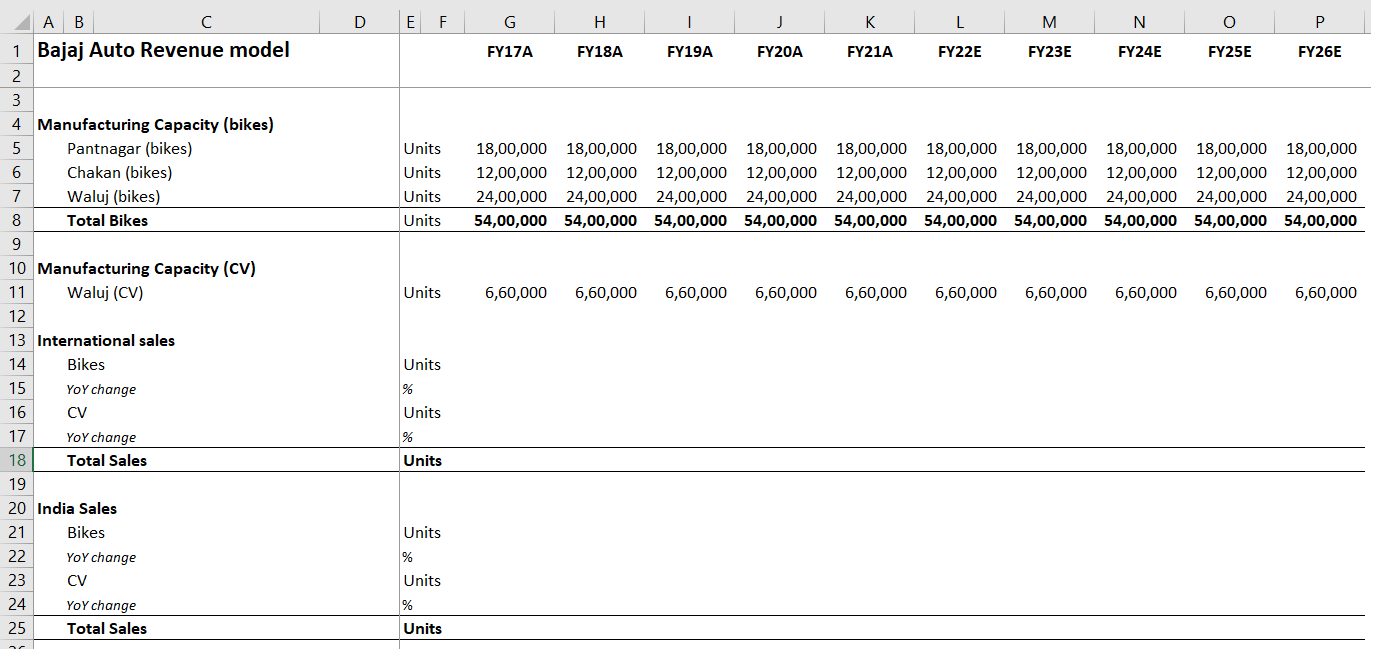
As we saw earlier, most of the sales data is available in the annual report, except for the India sales data for bikes. But this is ok; the company gives us the total bike sales (India + International) and the total international bike sales data.
If we calculate the difference, we get the India bikes sales data. So a bit of number jugglery that you will have to do.
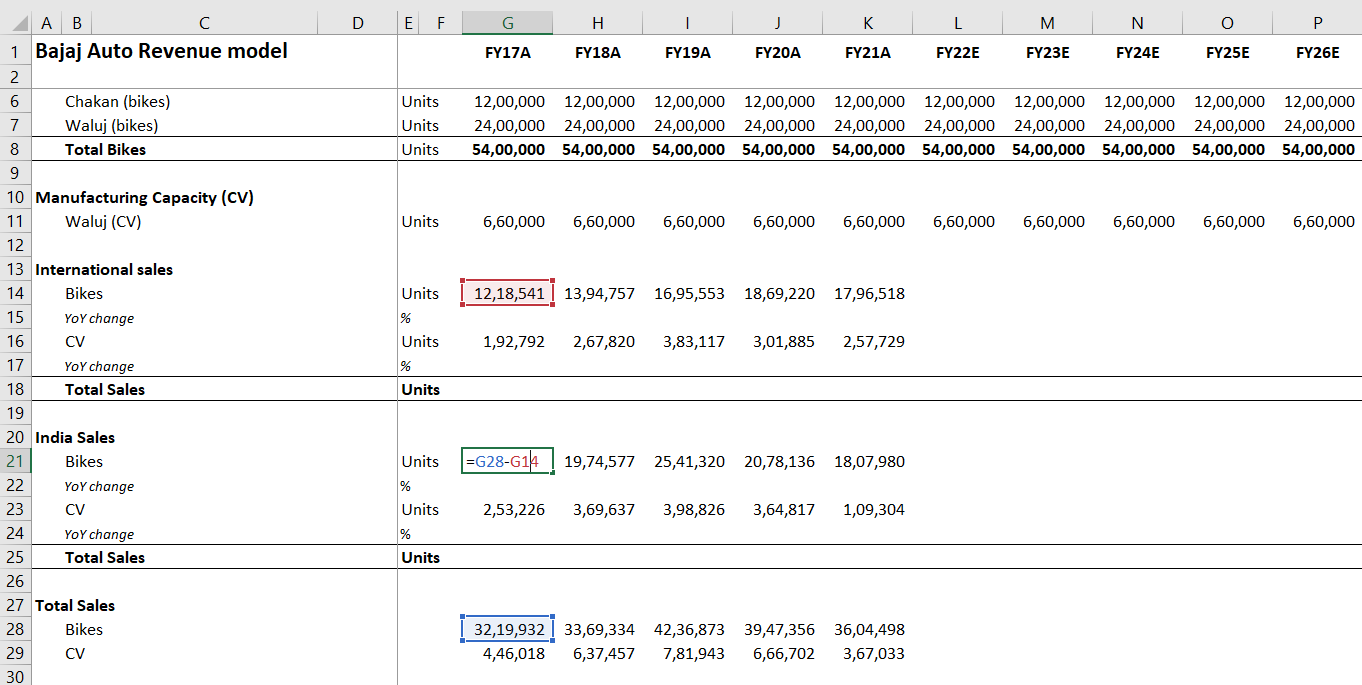
Next, we calculate the YoY change (in percentage) bikes and CV sales in the Indian and the International markets.
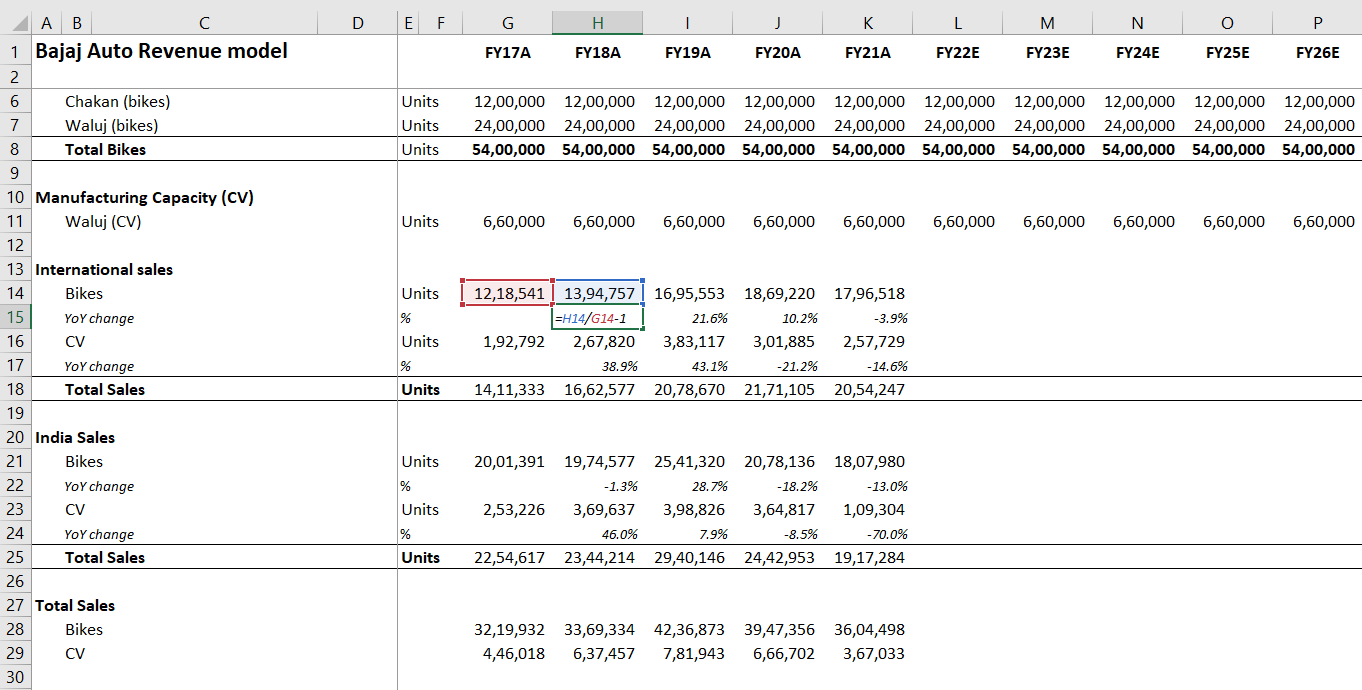
The math is simple for the YoY change –
= this year’s sales data/ previous year’s sales data – 1
= year on year change in sales, expressed in percentage.
The idea of calculating the YoY percentage change is to identify consistent trends if any. But clearly, there is no trend in the data we have.
We could have taken a rolling average of the yoy change and projected for future years if there was a trend. But now, we have to assume a flat YoY change.
I’ll project the YoY change without thinking much (to move ahead quickly), but of course, if this were a serious model (based on which you’d invest), then we would have to spend some time before we make the YoY change assumptions.
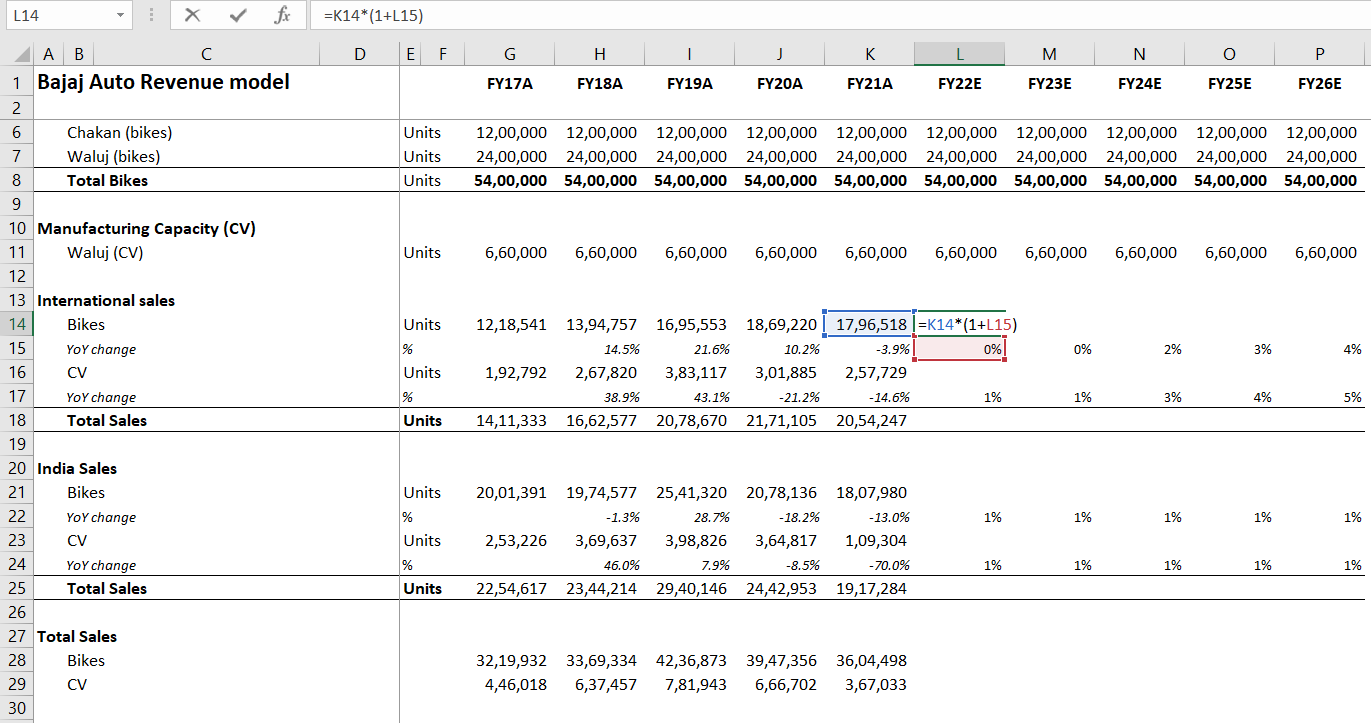
You can see the assumption I’ve made for the sales YoY change in percentage. You can also see the calculation that I’ve made to project the future year’s sale of bikes and CV. I’ve completed the math, and here is how the excel sheet looks –
Please note, I’ve summed up the bike and CV sales from both the Indian and the International markets to get the total sales. For your reference, I’ve highlighted the total sales of bikes for FY22E.
In the next step, we move our attention to the revenue data. I’ve taken the revenue data (India and International) from the annual report.

Below the revenue numbers, I’ve set up excel to calculate the average sale cost for vehicles (bikes + CV) across the Indian and the international markets. To calculate this, we need to divide the India revenue number by the India vehicles sold data.
Let me do this math for FY 17 –
Revenue from India (FY17) = Rs.14,815 Cr
Total vehicles sold in India (bikes+ CV) = 22,54,617
Average selling price of a vehicle = 14815*(10^7)/2254617
= Rs.65,709.61/-
If you wonder why I used 10^7 in the math above, then it is to get the revenue number in Crores.
Here is how it looks on Excel –

I’ve calculated the YoY change in average cost of sale as well. I hope at this stage; you can figure what to do next. If you do, then I’d be happy to know that my notes are helping you think ahead 😊
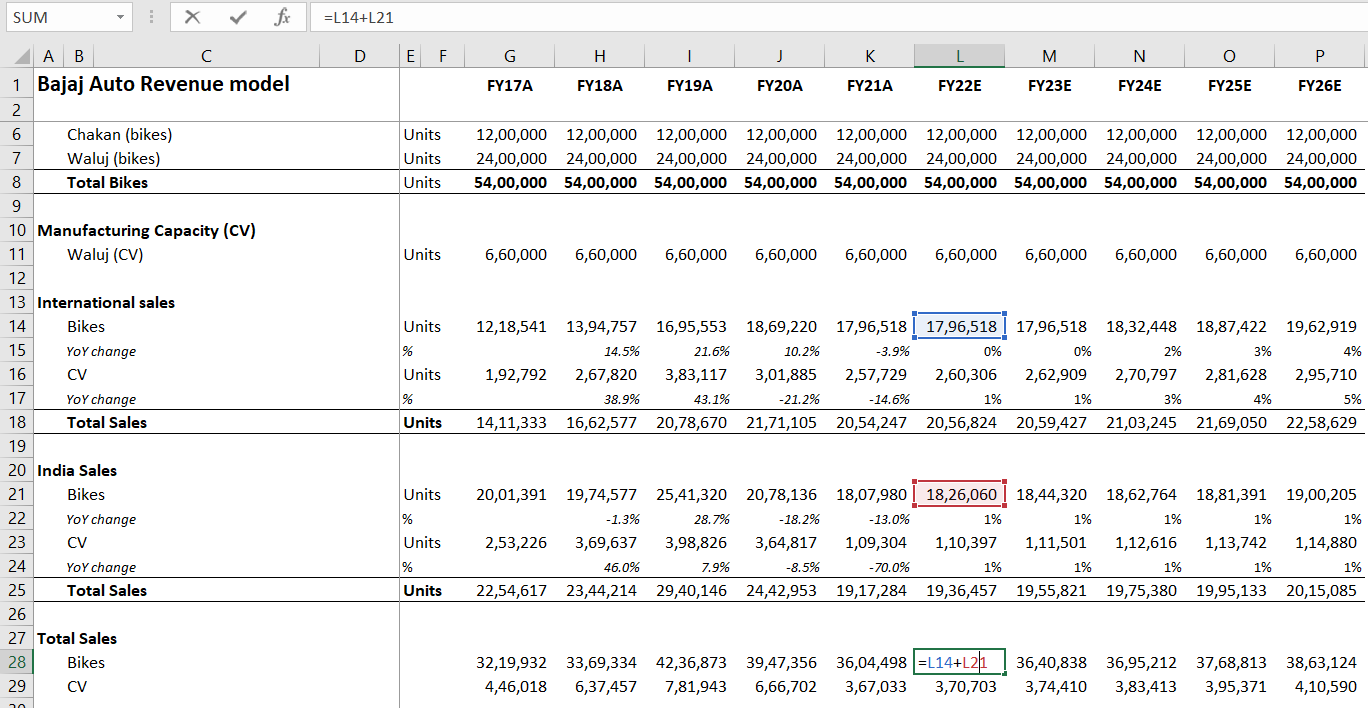
Anyway, here are the last two steps to complete the revenue model.
-
- Assume a YoY change for future years, it could be a rolling average, or it could be a flat assumption
- Project the average cost of sale in the Indian and the International market
- Multiply the avg cost of sale and the number of vehicles sold to get the revenue in the Indian and International market
- Sum up both to get the total revenue.
I’ve executed all the above steps in excel, and here is how it looks –

I have highlighted both the cells so that you can see the formula I’ve used.
Here are few other things that you can do with the revenue model –
-
- We have the total bike and CV sales data. Compare this with the production data. Ensure the company is not selling more than what it is making. If yes, then our model may be wrong and needs some tweaking
- If the vehicles sold are close to manufactured, the company may have to invest in a CAPEX cycle. This is valuable information from an overall financial modelling perspective
- Calculate the capacity utilization, i.e. number of vehicles manufacture versus the number of vehicles sold.
- Calculate the market share. You can get the industry bike/CV sales data from an industry report (guess even the annual report contains this), contrast this with what the company has sold, and get the market share number.
I guess this has turned into a lengthy chapter; I’ll stop it at this. But I hope this chapter has given you a sense of how you can develop a company’s revenue model using a common-sense approach. Always remember to start your revenue model by asking few basic questions.
The revenue model we have built here can be used for other auto manufacturing companies like Hero Motors, TVS, MRF, Maruti, Tata Motors, and even Tesla!
You can download the excel used in this chapter here.
Key takeaways from this chapter
-
- The revenue model is a sub-model within your primary model
- You can build complex revenue models by starting with simple common sense questions
- All the data needed to make a revenue model is usually available in the annual report of the company
- Use the revenue model to extract other information like capacity utilization, CAPEX cycles, and industry market share.
Sensei, above you explained that \”if company is manufacturing 100 bikes & selling 60%,it has a 60% capacity utilization rate\”, but that\’s not what capacity utilization is. Capacity utilization is suppose there is a factory which can make 100 bikes due to how large the factory is & how many machines there are etc.,but for various reasons such as demand & company\’s own working capital etc.,it is only making 60 bikes. Then it has a 60% capacity utilization rate. Do correct me if I am wrong though.
Yes, capacity utilization is to what extent the factory capacity is being utilized for producing goods. A company can have the capacity to manufacture 100 bikes, but it sees demand for 50, they may manufacture 60 (which is the capacity utilization), but if the manage to sell only 45, then that\’s a different situation.
Hi Kartik, to calculate the capacity utilization of the company we usually divide the sales in units/production capacity in units. However to gain more granular details can we divide the actual no of units manufactured/production capacity in units. This will also give us the capacity utilization right?, assuming that we are provided with the data of total number of units produced in a year as units produced in an particular year may not be same as units sold. Kindly guide for the same.
Yes of course. Eventually you need to measure –
1) What is the maximum installed capacity?
2) What was produced?
3) How many of the produced were sold?
4) Sold over how many days.
This will give you a complete sense of capacity utilization.
Sir i have the data of Total Sales volume of the particular year and total manufacturing capacity of that particular year
i have done sales volume/ total manufacturing capacity = its comes like 70% (what does it represent is it helpful to calculate it??
This is an indicator of capacity utilization versus sales.
Good evening Sir, While Making the Annual report of Maruti Suzuki I got Some Problems..
1.I have got the production capacity of Maruti but only overall not segment wise (like PV and LCV)
2.While Taking out the data for sales volume I have got that kind of data:
Domestic Sales volume were bifurcated (like sales of PV , LCV and sales to other OEM all data is given )
but when Comes to Exports(international sales only overall data is given i have also searched across annual report too..)
i have come up with an idea that i will calculate that how much % does PV is of total Domestic sales like 90%
and then i will calculate for exports like i will put 90% of total exports of PV and likewise other is it good to do ???
I have got the other data.. But confused about what to do with it…
1) Did you check the notes under revenue? It will be mentioned somewhere in the annual report. Do check the director\’s report as well
2) Yeah, same with Bajaj too 🙂
That seems like a good approach.
go and checkout on fada federation of automobile dealers association and vaahan govt registration authority
Hi Karthik,
Thanks for the lucid explanations.
In this revenue model of Bajaj Auto, we are not able to find the No of vehicles manufactured directly.
If this is the case, could we use the below formula ?
Capacity Utilization = Manufactured value in Crs(Fy21) / Revenue in Crs(Fy21)
where,
Manufactured value = Finished Goods FY(20) in Crs – Finished Goods FY(21) in Crs) + Revenue(FY 21)
For capacity utilization you can directly check what is the capacity of the plant and how many units were actually manufactured at the plant. Dividing one over the other should give you the capacity utilization.
Sir i want to buid financial model of deepak nitrite,but they dont state there sales volumes so how should i build revenue model of this company
One way to do this is to check what drives the revenue and model those variables. Eventually the sales has to be a function of different metrics right?
Hi karthik,
Was trying to create a revenue model for an auto ancillary company (SONA blw).I wasn\’t able to find the unit sales of each product, the total sales of the products(to find market share) or the capacity utilization (to derive units produced).
I then checked for two other auto anc companies, if they gave these details and could not find it in either of their annual reports as well.
Am i not looking thoroughly or is it possible that these details are sometimes absent in annual reports.
PS: I checked the investors section in their websites as well and couldnt find anything
Thanks for the help as always
Ah, its strange that the company is not giving the revenue split. Have you checked the notes associated with the revenue? Usually thats where the details are.
if we Can\’t take the assumption as incertain no this model might be wrong so that how to find that percentage for forcasting.
Assumptions are inherently uncertain right? Thats why its called an assumption.
\”if this were a serious model (based on which you’d invest), then we would have to spend some time before we make the YoY change assumptions\”. What to do in case of a serious model?
Yeah, you will have to deliberate and develop rational reasons for every variable in the model.
Hlw sir, i am working on preparing financial modelling of Ashok layland but i couldn\’t find manufacturing capacity and international sales.
Have you checked their Annual Report? Usually the section of Management Discussion and Analysis has capacity and capacity utilization details mentioned.
why we calculate average sale cost what is the meaning of this term ?
Have explained in the article/comments. Request you to kindly check.
Thank you very much for your revert…I will surely do this but I am requesting to you that, if possible, can you give one example with latest one?
Sure, let me look for one. Will share if I find anything meaningful.
I did not understand the assumption for international sales bike in FY22E, FY23E is 0% respectively & FY24E, FY25E, FY26E is 2%, 3%, 4% respectively.
Again for international CV sales in FY22E, FY23E is 1% respectively & FY24E, FY25E, FY26E is 3%, 4%, 5% respectively.
The assumption for india sales of abike & CV it is 1% respectively for each projected year.
It is flat assumption for YOY change. Because past data is not linear to calculate rolling average.
But why 0%,1%,2% & all?
Which factor you have considered or should be considered to arrive for above mentioned assumption?
Avinash, these assumptions are based on management guidance + historical trends. Not just for this company, but I\’d suggest you do this for all the companies you model..i.e look at past trends and correlate that with management\’s guidance and make an assumption.
Sir,
We have the data regarding the manufacturing capacity of the plant, is it best to assume that the company manufactures automobiles equivalent to their manufacturing capacity. Because we don\’t have any data regarding the no. of automobiles the company manufactures.
They do give capacity utilization data right? That should give you a perspective.
Hello Sir,
In most of the cases you can\’t see a trend in the no. of units sold or the average cost of sales, so we have to go by the assumptions of constant rate throughout, so my doubt is, what is the rationale behind the constant rates you are assuming. For example, cost of sales increase at 2 %, Indian sales in no of units at 1 %. I can\’t understand the logic behind each of these assumptions\’ sir.
Thank you.
So if the percentage is fixed, it gives you some predictability, which is what we are trying to look for here.
Hello Sir, I absolutely love your content and the hard work that you are putting in for all of us!! I have one small query, what if the company I select doesn\’t give their individual products\’ revenue and production-related data in their Annual Report? How Should I make my Revenue model in such a scenario?? Should I extract such data from third-party websites, are they reliable? what do you recommend?
Thats a possibility, in that case you only have to take the overall revenue and model the trend 🙂
Thank you very much for educating us in such a rich way.
Happy learning!
I just realised my mistake, no need to answer the question😅
Sure, happy learning 🙂
Sir, why have you considered the units sold of CV for only 3-wheelers and not other, wouldn\’t the exports mentioned for same include all 3 but the no. for domestic sales taken up is for only 3-wheelers
Sir, I was working on Relaxo Financial Model. They have significant revenue from footwear but some minor revenue from wind power also. So in that case how to incorporate that into the revenue model?
If its minor, you can just add that bit in the assumption sheet itself.
In the revenue model explained above we did found out the factors driving the revenue of the business,However the sales reported in P&l and the bifurcation which we did are however not related though. Shouldn\’t it be that the P&L values bifurcation reflected in the revenue model.Do guide for the same.
Thanks in Advance.
Paras, not sure if I understand your query fully. Are you talking about the example used here? If yes, they are of two different companies.
Sir I\’m currently reading your financial modelling series. Noticed that the pdf version is not available. I kindly request you to make it available if you can. Thank you sir.
Ah yes, we need to put that up. Will do.
Hi Karthik Sir, Wonderful work…
Few Questions
1. Why is it called Cost of Sales ? By the computaion is it not avg sale value per unit of vehicle sold ??
2. Capacity utilization – Is it not No. vehicles manuf/Total Production capacity ?
How is it Sales/Vehicles Manf ??
Am I missing something ? Can you help me understand ?
Thanks
1) I guess this was mentioned in the description?
2) Thats right. But another way to also look at this to figure how much was sold out of how much was manufactured. But in general – No. vehicles manuf/Total Production capacity is the correct one.
Hi Sir, Could you please enable download as PDF option
Will do in a bit.
Sir, I got it. I was being silly to even think employee expense in a revenue model.
Yeah, also, do check my previous response.
Sir, in TCS annual report they havent mentioned a single product and the revenue they are getting from it or the cost incurred to build it. But what they have mentioned is they have hired 100000 employee in the last FY And they intend to do more hiring. So I derived that the more the hirings , the more the product and then more revenue. In the above example you have bikes as a cost driver but in TCS annual report I cannot find anything other than employees. what to do then??
Animesh, so TCS\’s revenue is directly linked to the number of employees deployed on active projects multiplied by the dollar billing rate, and this is because they are in software services. You need to think along these lines.
Sir, I have trying my hands on making financial model of TCS which is service based org. I\’ve gone through the balance sheet figuring the operative items to include to make a revenue model. I figured as the service based industry are employee intensive so will it be okay if I only include the employee benefit expenses in the revenue model. The employee benefit expense accounts to more than 50% of the revenue and more than 70% of the operating expenses in TCS. Do you think the assumption is alright??
Animesh, why do you want to take expenses in a revenue model? Its better to stick just to the revenue and its sources right?
Sir, A small query. What should we keep in mind when assuming growth rate in sales, if there is no particular trend from past data (Like in our Bajaj Auto revenue model)?
One thing that you can do is to take industry averages.
Sir,
figured it out to my aforementioned question on Segment revenue.You deducted International Revenue segment from the first line Sales from Statement of Profit and Loss.
For Year 2017-Sales 22694-7878.93(International segment page 212,you took 7880)= 22,694
2018:25098-9703 = 15395
2019:29567-11845.44=17721.56 and so on….
Apologies for not digging deeper
Hey no problem, I remember putting a line of explanation, it is just that I dint remember it on top of my mind 🙂
Dear Sir,
I carefully perused The Annual Report of 2017,2018,2019,2020 and 2021 to get the revenue numbers i.e, for India and International.I couldn\’t find the Indian and International numbers that you had listed i.e, example for 2017 you had listed 14,815 and 7,880 respectively.I know by your usual MO you had taken Operating Revenue but how did you do the split?I am stuck at this part
I had checked page 212 AR 2017 which states \”Segment revenue: External sales and other income (India)16,431.33 (Rest of the World)7,878.93 (Consolidated)24,310.26\” are these correct splits? but this for consolidated Revenue as opposed to Operating Revenue!
PS:Thank you for all that you have done for educating us Sir I wish you were my teacher in my formative years and have we seen the last of Zerodha Varsity with Financial Modelling?!
Vishnu, I think I must have done some reverse engineering to get this number 🙂 I need to go through this chapter to figure 🙂
Sir, What if Every Company Is not Providing details about their Units sold? Is there any other Medium where we could find it?
Any listed company is supposed to give this information. Worst case, you can try and derive it from the annual report.
Hello Sir,
The figure for CV international sales for fy19 is 378,777 in the annual report but in the module it is 378,117
So kindly check
Ah, could be a typo. Will check, thanks for pointing!
Hello Kartik sir,I wanted to know if capacity utilization is more than 100%,is the model wrong?
Yup, because capacity utilization cannot be more than 100%.
Total sales classification, I should say.
Yeah, just a minor rectification required in terms of sales classification , as mentioned above, to make it more precise and clear.
Understood, will try and do that.
Sir, in the model , total sales have been mentioned frequently. That confuses a lot as to which is the actual figure for Total sales as the figures are completely different in each subheading, which is creating ambiguity. Like, total Sales can be further bifurcated into \”TOTAL INDIAN SALES\” under Indian Sales subheading and \”TOTAL INTERNATIONAL SALES\” under International Sales subheading, instead of \”TOTAL SALES\” as mentioned. I hope you are getting me, right Sir?
Thanks for the feedback Sumit. No one really has raised that question in comments. Let me check this again.
for calculating the change in avg. cost (Indian market 2.00%) you kept it constant and did the same for the international market as well so its just a flat assumption or you came up on it by using any formula
It was just a flat assumption.
should we take the gross revenue or the net revenue (for calculating avg. cost of sale) as in the annual report of the company which I have taken they have written only the gross revenue in their income statement and the net revenue is not calculated anywhere in the report in their income statement, but while looking on sites like moneycontrol and ticker tape they have taken net revenue
Please take it as its reported in the annual report, its the best source rather than depending on 3rd party websites.
Hello Karthik Sir,
Can u Please provide me the source from where I can learn Financial Modelling becoz Varsity may take more 5-6 month for complete module and I will be looking for job in 2 month in Equity research Firm… Any book or source from where you learned ..if told would be really helpful.
I think there are few firms that will teach you this at a cost of 20-25K, guess you will have to ask around 🙂
and the sales data its not given separately anywhere everywhere its written that the company \”produces and sells\” about this much
Hmm, lots of ambiguous information. Please check analysts reports if its available for more details.
I am having one more problem with the manufacturing capacity is that the data is not provided correctly like for the annual reports there are three different data given every timefor manufacturing and selling capacity eg. in the snapshot its written (68.5 million cases produced and sold) then somewhere its written (company produced and sold around 80 million cases for the year) and then somewhere its written (company produced and sold 70.5million cases for the year) \”what should I do\” and this is the case with all the annual reports the data is given three time and very time its different
Ah, the numbers being inconsistent is a problem. But check the revenue number and see what kind of sales will make up the sales data, for example for revenue of Rs.X, if 70.5million units sold makes sense, then go for that.
can I use the \”forecast\” function in excel for forecasting the data of upcoming years
I\’ve never really used that, Shivansh. So cant really comment on that.
Integrated Financial modelling is not available in the app version of zerodha varsity. How to get certificate in integrated financial modelling? I really like this subject
Thank you sir for providing us with this powerful content.
Are you planning something for crypto as well? Really excited about upcoming chapters and modules!
No crypto yet 🙂
Thank you so much sir.
So it\’s possible that I can pledge my liquid fund for 4-5 years too.
Sharad, I don\’t know if you can pledge that for so long. I\’d suggest you speak to the customer desk once to get clarity 🙂
Sir , I want to ask that I have pledged axis liquid fund in zerodha. For how long I can pledge my liquid fund?
Is there any interest charge on pledging of my liquid fund?
There is no time limit as such. For charges, please do check this – https://support.zerodha.com/category/mutual-funds/about-coin/articles/can-i-pledge-my-mutual-fund-investments-to-get-margins
and ya! one more question that if we can increase the production capacity of the company steadily like from YEAR 1- 70M , Year 2- 70.5M…. then what will go wrong if we decrease the production capacity YOY of the company as what\’s happening in this case
You can if you think the company is hitting a bad sales cycle. But eventually, you need to get a sense of impact on the profitability, cash flow, and valuations. All of these we will cover in this module.
and should I do the same with selling capacity also
Yeah, you can do that, based on sales trends.
Hello Sir,
When will you talk about all the financial ratios such as PEG, Enterprise Value, Ebitda to EV etc.
Ratios that you have missed talking about in the fundamental analysis chapter.
In the next chapter, I\’ll discuss the Asset schedule. Eventually, I will cover these ratios as well.
ok! I will do as you say but by doing this, will it not tell that the production capacity of the company is constantly increasing but the truth is that its constantly decreasing
Shivansh, what I suggested was a technique, you can plough in the numbers in a manner that makes sense. The actual numbers can be lower, good enough to ensure that it fits in line with the production capacity.
I didn\’t understand could you please tell it again in a more elaborative way
Year 1 – 70M, Y2 – 70M, Y3 – 70.5M, Y4- 72M….like that.
if I take average which is 82.1 million constant for every year then for the year 2017 the sales will be more than production capacity or can I do this that I take the production capacity for year 2017 as 90million and for the rest of the years I take an average
Take it on the lesser side for the initial years and then marginally increase it over the final years. See if this fits well.
and as we do the avg. of the above data its 82.1 million
Have commented above.
yes the sales matched up to it, I think its because every year they are selling there one or two manufacturing facilities and many of their manufacturing facilities are dormant and from the annual reports I can tell that there production capacity is constantly decreasing as there production capacity is as follows:-
2017- 90 million
2018- 78.5 million
2019- 81.58 million
2020- 79.75 million
2021- 70.71 million
so what should I do in this case
Declining production results in declining production (as can be seen), in this case, you need to look at the management discussion and analysis to figure what exactly the management envisions. If there are no statements addressing this, then perhaps you should look at taking an average or a constant 70.71 number with maybe an increase in the last 2 years of projection.
the \”average\” production capacity is coming 82.1 million but for the year 2017 alone the production capacity was 90 million so what should be done in this case
That seems like a case where the product was above average. DId the sales match up to it? This is something you need to check.
the company which I have chosen doesn\’t have a fixed manufacturing capacity every year it has a different manufacturing and selling capacity. So, should I take a average or I should just write what\’s given
Yes, average in this case works.
Sir ye wala bhi chapters hindi me translate kare. Bahot help hoga.. Hum log ko.. Pls. Sir..
Will do it once the module is complete.
as earlier you told me to dig around the analyst call section for the export data if not given in the annual report, so where can I find analyst calls
Try looking for it in the investor section of the website.
Sorry, the actual sales numbers for motorcycles is from (Table 1: Sale of Motorcycles, Domestic and Exports), which is fine. However, the domestic sales for CV is picked from (Table 2: Three-Wheeler Sale, Industry and Bajaj Auto (in numbers)), but not the international sales.
Let me double-check this.
Good piece, Karthik! However, is there a reason for choosing 301,885 and 257,729 as \”International Sales\” numbers for \”FY20A\” and \”FY21A\” respectively? I see in the AR that these are export numbers from (Table 3: Exports, in Units and Revenue for, Bajaj Auto). I would think that export numbers should be greater than or equal to the sales number. I also see that you\’ve picked the actual sales numbers for motorcycles from (Table 2: Three-Wheeler Sale, Industry and Bajaj Auto (in numbers)), which have the sales numbers for CV as well.
Anil, these numbers are in units, as in the number of units they have sold. Have mentioned the narration in column F.
and yes the company is involved in exports
Cool, then please take a look at the analyst\’s coverage if any.
what do you mean by analyst calls
Calls that the management makes with the investor community to discuss quarterly/annual results.
the company I have chosen is a spirits company and there are two questions which I am unable to obtain form the annual report of the company and they are:-
1. The production capacity of the company and in spirits company case no. of distilleries they have and what is their production and utilisation capacity
2. The revenue generated from the exports and domestic as in their annual report they have not given it separately anywhere
These details should be mentioned in the annual report. If not, you may want to dig around the analysts calls for these details. As far as the revenue from exports are concerned, double-check that they have exports before taking it into consideration.
Respected sir,
It would be nice to have a module on IPO. How to invest, how to read DRHP etc…
Here you go – https://zerodha.com/varsity/chapter/the-ipo-markets-part-1/ , but please focus just on the flow and don\’t dig too much into the numbers 🙂
Hello sir, Namastey
Pls tell us that if it is a Service provider company then what will be the thought process to make a revenue model ?
Quite the same, Harsh – What service do they provide? Whom do they cater to? Where are their clients located? How do they charge (billing methods)? How much do they charge?
Sir
Can we build a revenue model for any other sectors business like fmcg, agriculture etc?
Yes, the approach will remain pretty much the same, Rahul.
Can u cover real estate modelling. It\’s a whole lot different.
No expertise there 🙂
Sir
Production capacity of waluj(CV) in annual report is 930000 but it is 660000 in your model
Correct me if am missing something here?
Thank u for this chapter.
Oh my! That\’s a stupid mistake. Thanks for correcting that. Luckily I\’ve not used that number anywhere else, so none of the calculations changes.
Respected sir,
It would be nice to have a module on IPO. How to invest, how to read DRHP etc…
Noted.
The change in Fixed Assets of a company should be the best indicator of capex in the company. High capex costs would weigh on future margins and are generally stated in the annual reports as well.
That\’s right. I Will be dealing with gross block in the next module, hopefully, this will add more perspective.
Yes finally, thank you sir.
Sir, how do calculate CAPEX of a company?
Also what are some future modules you will cover after financial modeling?
Thank you.
I\’ll be taking up the gross block in the next chapter, hopefully, that will help you understand this part.
Yeess…finally after 33 days …Thank You 🙂
Apologies for the delay 🙂