It’s the economy, stupid! The markets must be crazy!
We love IndiaDataHub’s weekly newsletter, ‘This Week in Data’, which neatly wraps up all major macro data stories for the week. We love it so much, in fact, that we’ve taken it upon ourselves to create a simple, digestible version of their newsletter for those of you that don’t like econ-speak. Think of us as a cover band, reproducing their ideas in our own style. Attribute all insights, here, to IndiaDataHub. All mistakes, of course, are our own.
The money tsunami that’s drowning the markets
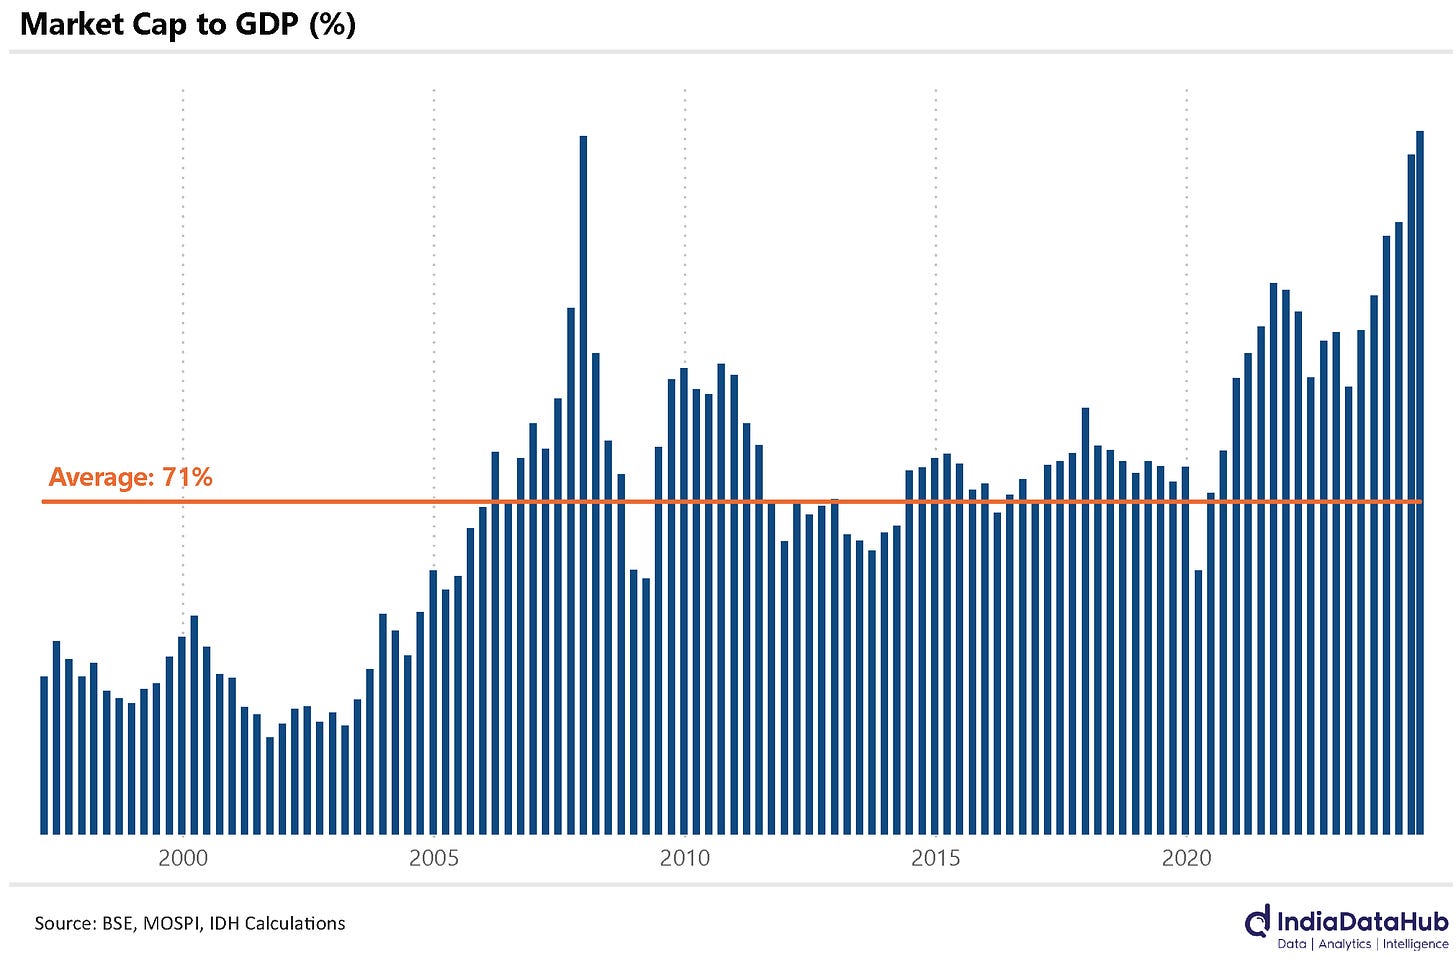
By a generous estimate, no more than half of India’s economic activity happens in its ‘formal sector’. Of all its formal sector firms — roughly 1.7 million in number — just ~8,000 firms are listed publicly. And only a small fraction of these are actually on investors’ radars. So, when the stock markets value these 8,000 firms at one-and-a-half times the size of India’s GDP, you have to wonder if we’re all going a bit crazy.
See, India’s equity market capitalisation — the total value our stock markets place on all the companies listed within them — has hit ₹465 trillion, or $5.6 trillion. This is ~150% of our GDP. Just last year, it was at two-thirds that figure. There’s no way these companies grew their businesses so much in the last year that they’re worth an extra trillion-and-a-half dollars. Is everyone just going mental?
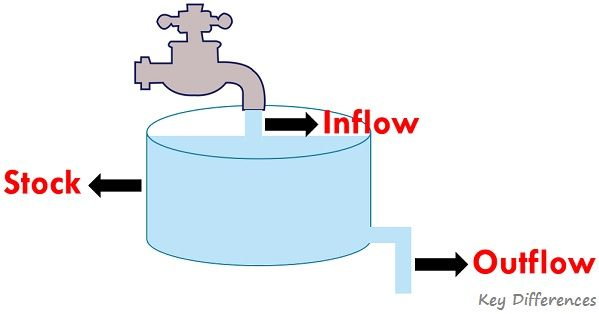
Before you panic too much, there’s a caveat: the comparison between market capitalisations and the GDP breaks down pretty quickly. Market capitalisation is a ‘stock’ measure — it’s a measure of the total value that investors place on India’s listed companies. GDP, on the other hand, is a ‘flow’ measure — it looks at India’s economic activity in a specific period. This is a little like comparing all of someone’s money with someone else’s salary package. The stock measure will always look bigger by comparison.
But even considering that, this is a useful comparison to make. The GDP, if nothing else, is an extremely large number, which is tied to the size of India’s economy. Perhaps comparing a GDP figure to market capitalisation tells us nothing concrete. It is, however, a rough thumb rule to see how expensive stocks are. And right now, the answer seems to be: “very”.
Want to know the last (and only other) time valuations were this high? December 2007. And you know what happened after that.
Foreigners warm up to Indian debt
Foreign portfolio investors bought $2 billion worth of Indian debt in August. That might sound like a lot, but honestly, it’s almost been par for the course, this year. FPIs have bought roughly the same amount of Indian debt every month since October last year, save for a sudden and sharp fall this April.
Why is everyone suddenly interested in our debt? It’s probably no coincidence that this sudden and sustained influx began last October, a mere month after JP Morgan announced India’s addition to its emerging market bond index from this June. That was a near-guarantee that every month, going ahead, a large amount of foreign money would automatically be allocated to Indian government bonds. Of course investors rushed to capitalise on this.
The results are clear: in the last nine months, Indian debt securities have pulled in a net of US$ ~17 billion. In total, FPIs now own ~US$ 65 billion in Indian debt, with just this year’s additions making for almost a quarter of their total Indian debt holdings.
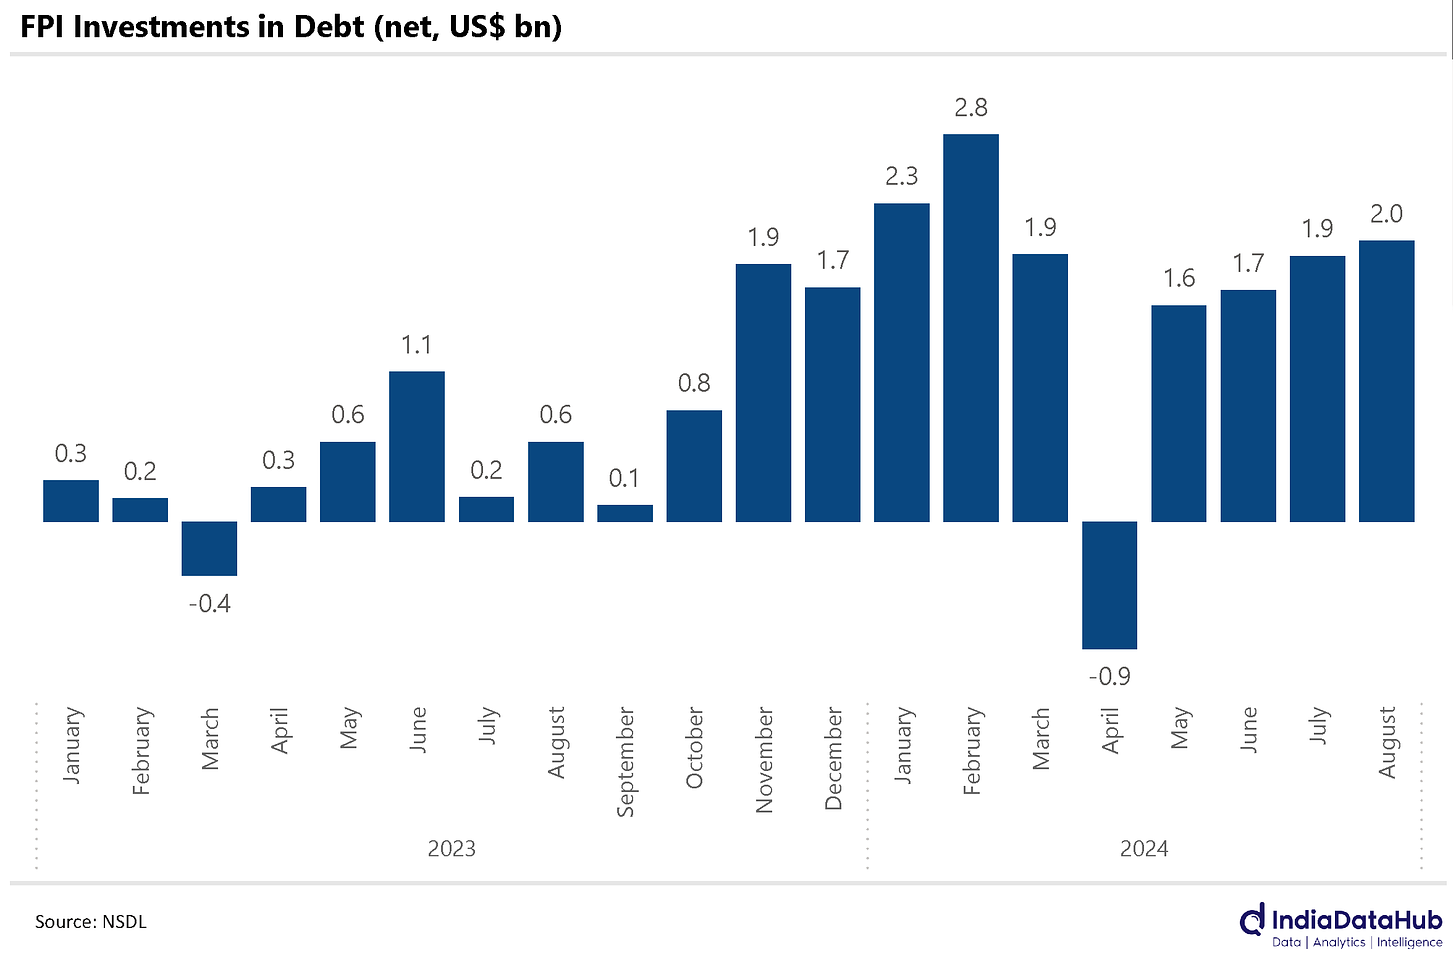
I know, that sounds like a lot. This is still tiny compared to equities, though. As of August, foreign investors hold US$ 900 billion in Indian equities — one whole order of magnitude larger than their debt holdings.
Energy usage declines (and that’s probably not a bad thing)
This August, Indians used a lot less energy than last year:
- Indians used 2.6% less petroleum than last year. More specifically, our consumption of Diesel, Naphtha and Bitumen went down 2.5%, while Petrol and LPG consumption moderated.
- India generated 5% less electricity than it did last August. This is the biggest drop since June 2020, when India was under a strict COVID-linked lockdown.
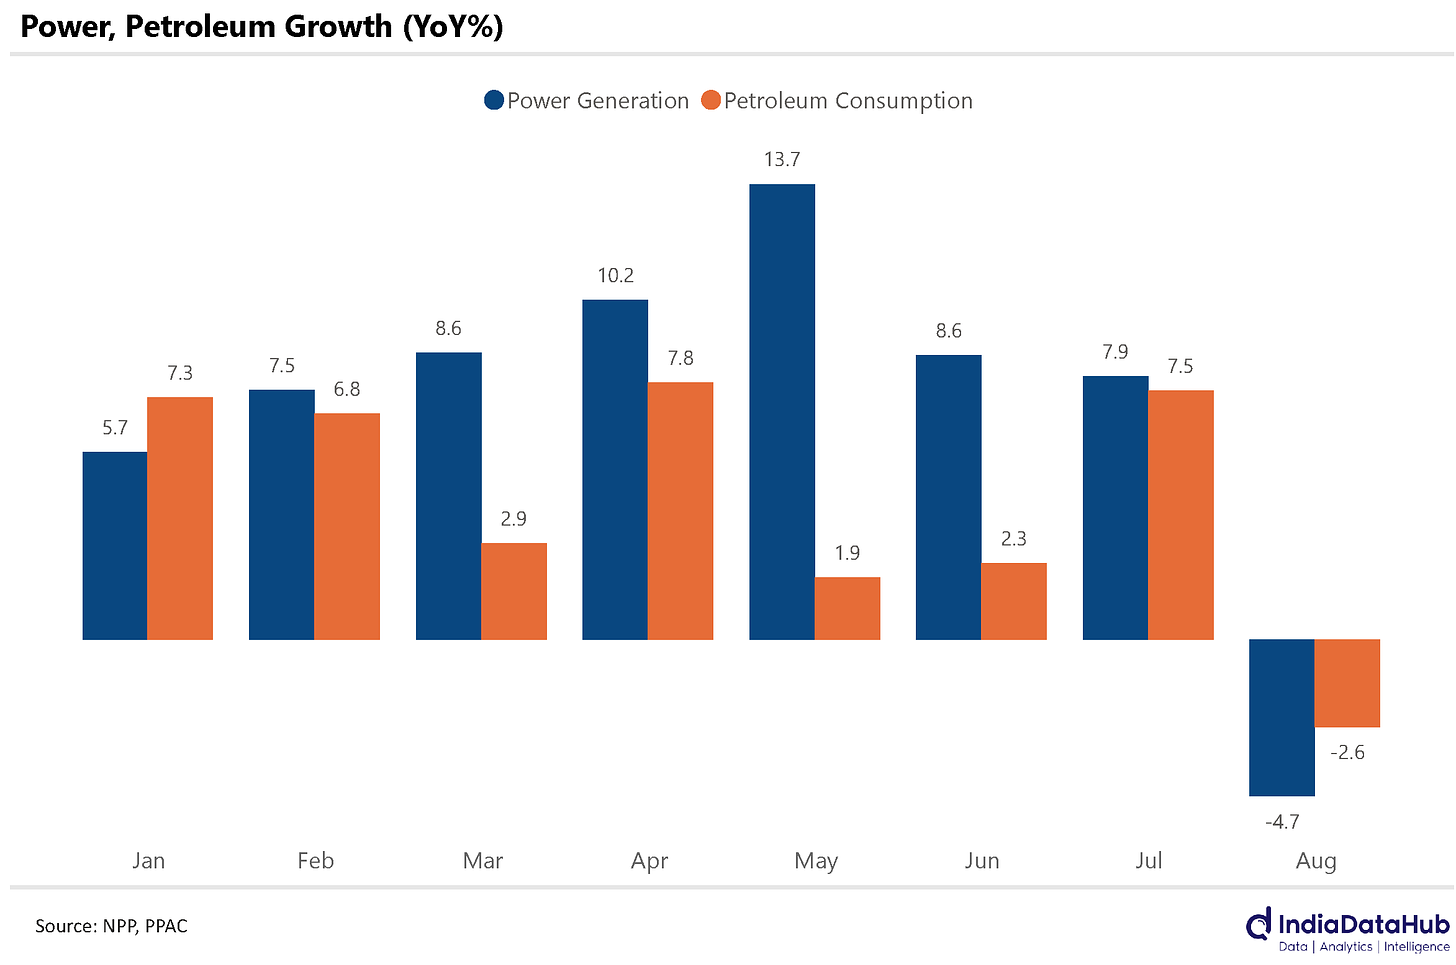
Declining energy usage is generally a bad sign for the economy. Since all economic activity takes energy, when less energy is used in the country, one can assume that there’s been less economic activity as well.
But there’s an important difference between this year and the last, which could explain a lot of the currently decline. See, last August, the monsoon was terrible — the worst it had been in 15 years — while this time around, it’s been pretty decent!
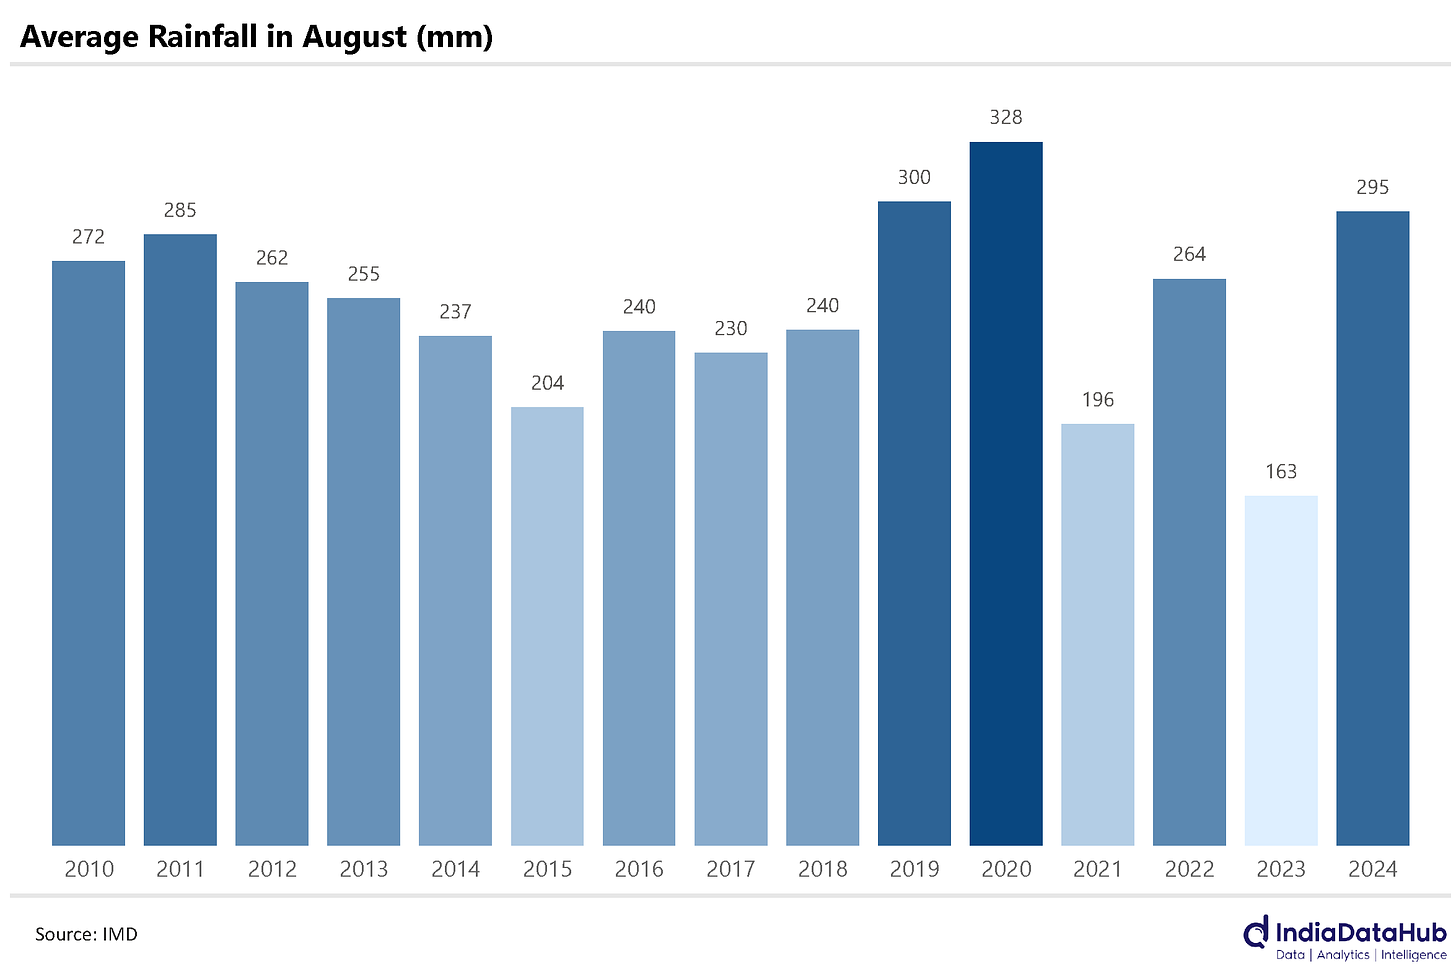
The rains make a lot of difference to an economy. Consider a few possibilities:
- When there’s less natural rainfall, farmers have to rely on motor pumps to irrigate their crops — which drink up diesel or petrol.
- Rains makes construction difficult, so a good monsoon sees construction activity grind to a halt.
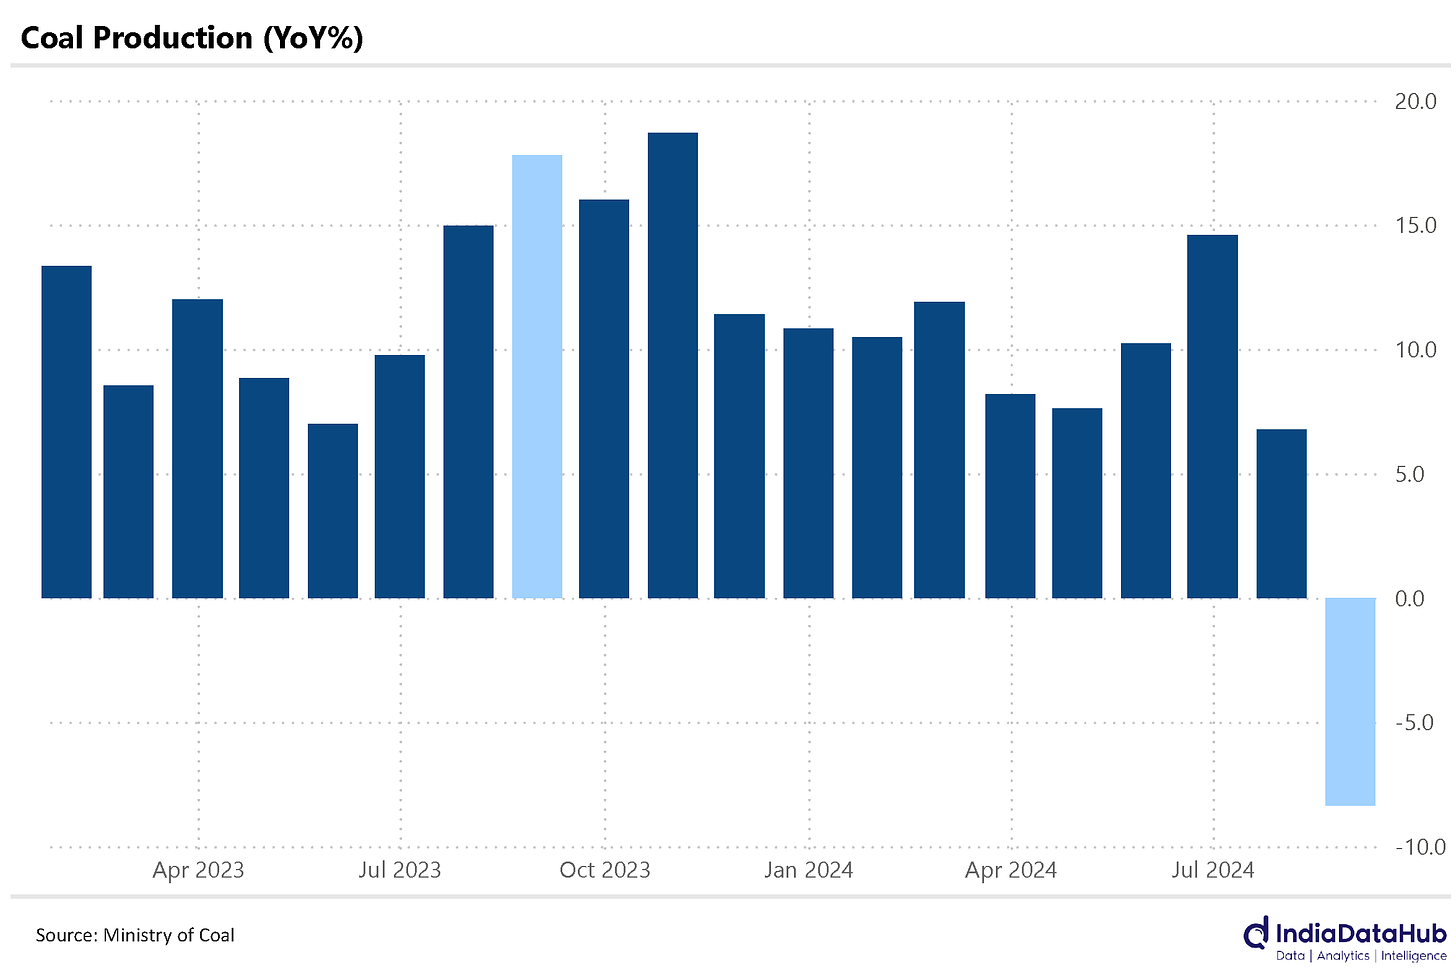
- Rains tend to fill up mines and queries — after all, they are just holes in the ground. So mining is usually hit hard by the rains.
Last August, for instance, coal mining shot up by 20% over the preceding year, possibly because the rains were non-existent. This time around, in contrast, the fell 8% — probably because of a much better monsoon.
So, was there less economic activity in August? That answer, tentatively, seems: ‘yes’. But does that mean India’s medium term prospects have grown darker? That is less likely. If anything, good rains result in good harvests. If anything, you should expect the rural economy to do well in the medium term.
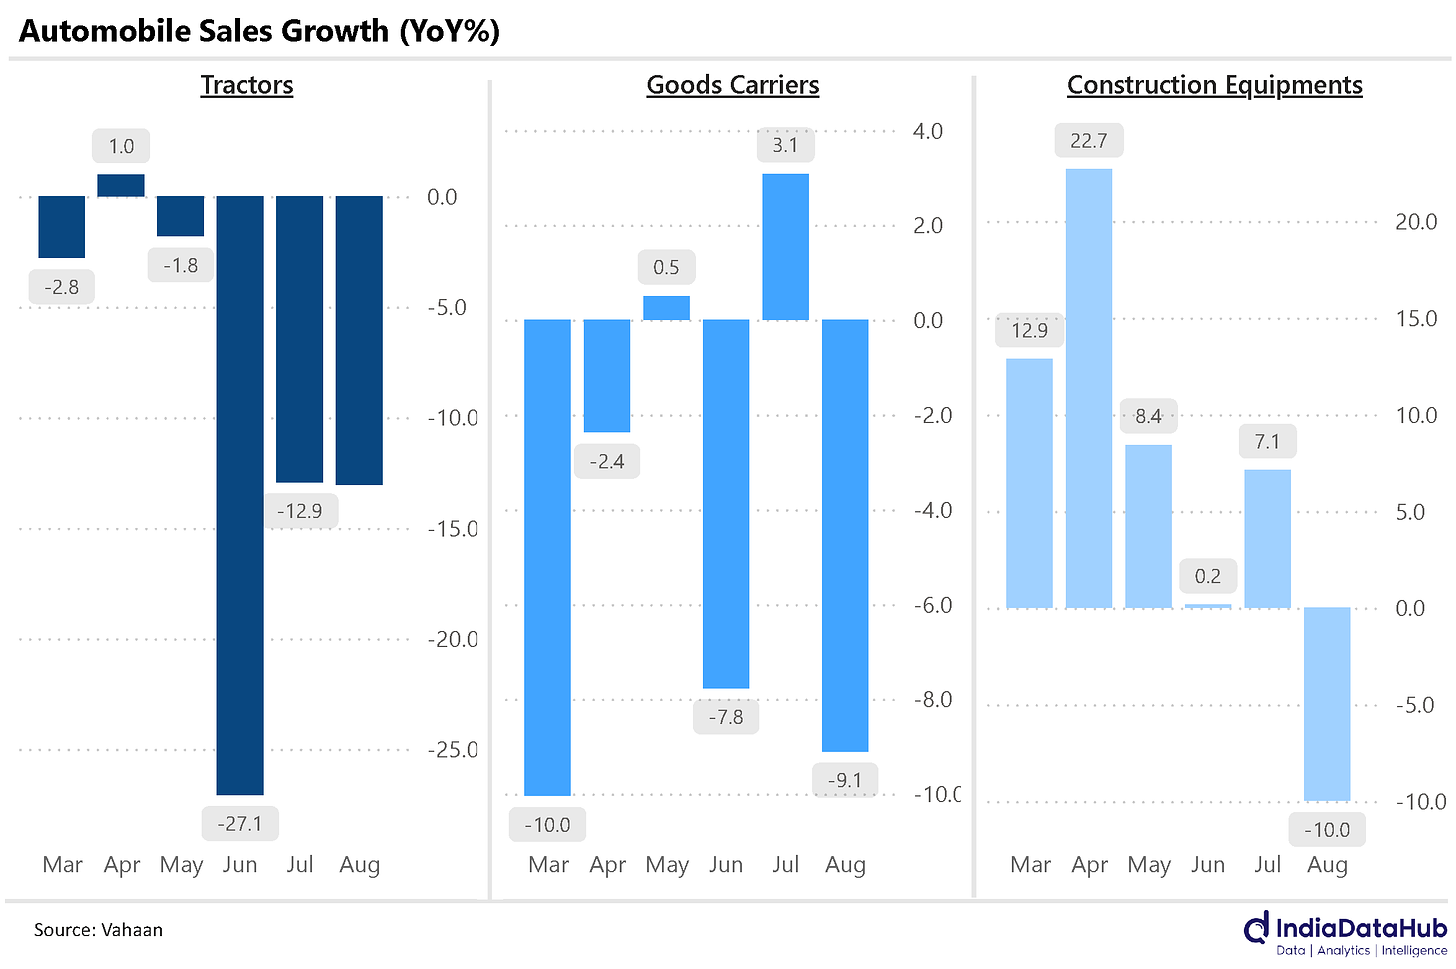
Automobile sales weaken
August also saw automobile sales take a hit. Here is a quick round-up:
- Two-wheeler sales were the only bright spot, going up 6% year-on-year.
- Car sales declined 4% year-on-year.
- Tractor sales were weak yet again: with year-on-year sales declining in the double digits for the third straight month. That’s the one head that’s genuinely worrying.
- Commercial vehicles — goods carriers and construction equipment — saw a 10% decline in sales.
Make America work again
India’s central bank, RBI, is tasked with keeping inflation in check. In contrast, America’s central bank — the United States Federal Reserve (affectionately, “Fed”) — has two jobs: keeping prices under control and ensuring maximum employment.
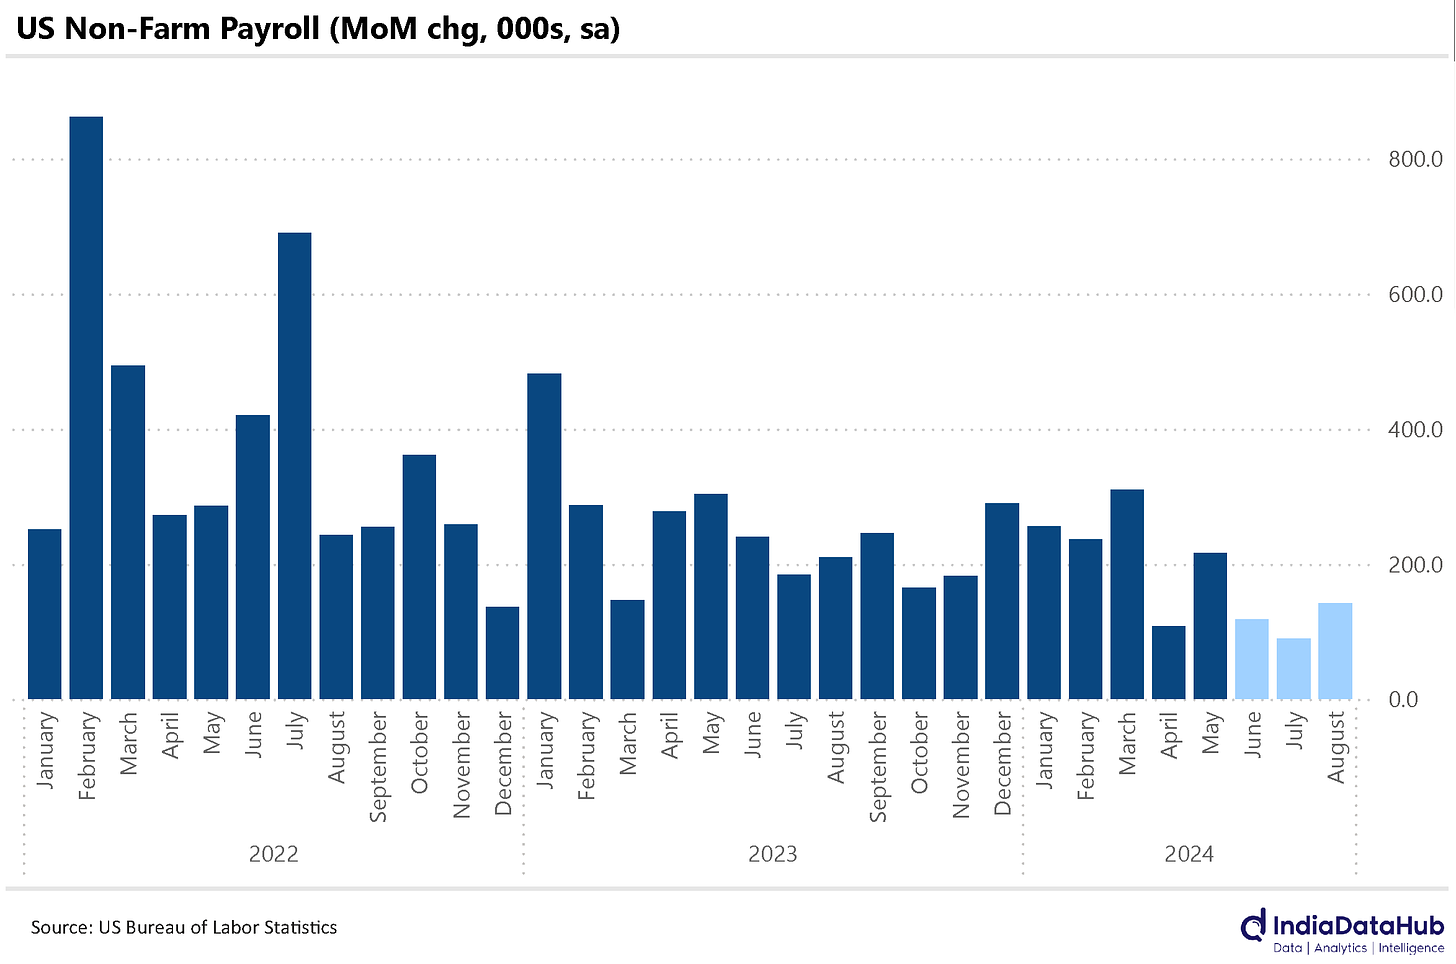
Because of this extra task on its hands, the Fed’s usually glued tight to news on American jobs. And off-late, that’s been a whole lot of bad news. We had already pointed to some discouraging data from last month, when American created less jobs than expected, while its unemployment rate climbed to pandemic-era figures.
It’s posted another bad performance this month:
- Through August, the US added 142,000 non-farm jobs, well below the expected 164,000 jobs.
- Older data on job creation over June and July, too, was pushed downwards.
With that, the last three months look like the worst patch the American labour market has seen in a few years.
So, what should the Fed do? At its next meeting, later this month, a rate cut is almost a sure bet. The markets give a 100% probability to a 0.25% rate cut. There’s also a decent chance — 30%, per the markets — that the cut will be as big as 0.50%.
People don’t expect the cuts to stop there, by the way. The markets think there’s a 90% chance that rates will be 1% below where they currently are by the end of the year. The Fed will only meet three more times this year. Even if two of them see 0.25% cuts, if the markets are to be believed, you’ll at least have one 0.5% rate cut this year. That’s big.
Why, though? Well, because rate cuts are like a meaningful glance on garba night. They signal a lot more than is said out loud. Monetary policy decisions involve a central bank defining the cost of money, sure. Behind that decision, though, are a lot of small, unsaid indications about how it views the economy. Dario Perkins is only being slightly tongue-in-cheek in this post: