
Volume plays a very integral role in technical analysis as it helps us to confirm trends and patterns. Consider volumes as a means to gain insights into how other participants perceive the market.
Volumes indicate how many shares are bought and sold over a given period of time. The more active the share, the higher would be its volume. For example, you decide to buy 100 shares of Amara Raja Batteries at 485, and I decide to sell 100 shares of Amara Raja Batteries at 485. There are a price and quantity match, which results in a trade. You and I together have created a volume of 100 shares. Many people tend to assume volume count as 200 (100 buys + 100 sells), which is not the right way to look at volumes.
The following fictional example should help you understand how volumes add up on a typical trading day:
| Sl No | Time | Buy Quantity | Sell Quantity | Price | Volume | Cumulative Volume |
|---|---|---|---|---|---|---|
| 01 | 9:30 AM | 400 | 400 | 62.20 | 400 | 400 |
| 02 | 10.30 AM | 500 | 500 | 62.75 | 500 | 900 |
| 03 | 11:30 AM | 350 | 350 | 63.10 | 350 | 1,250 |
| 04 | 12:30 PM | 150 | 150 | 63.50 | 150 | 1,400 |
| 05 | 1:30 PM | 625 | 625 | 63.75 | 625 | 2,025 |
| 06 | 2:30 PM | 475 | 475 | 64.20 | 475 | 2,500 |
| 07 | 3:30 PM | 800 | 800 | 64.50 | 800 | 3,300 |
At 9:30 AM there were 400 shares exchanged at the price of 62.20. An hour later, 500 shares were traded at 62.75. At 10:30 AM if you were to check the total volume for the day, it would be 900 (400 + 500). Likewise, 350 shares at 63.10 were traded at 11:30 AM, and upto 11:30 AM, the volume was 1,250 (400+500+350). So on, and so forth.
Here is a screenshot from the live market highlighting the volumes for some of the shares. The screenshot was taken around 2:55 PM on 5th of August 2014.
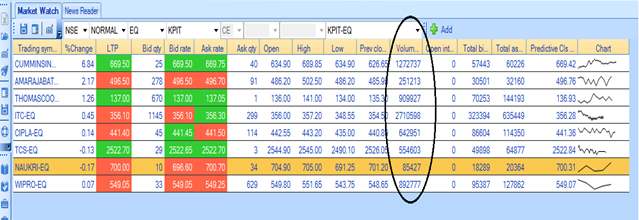
If you notice, the volume on Cummins India Limited is 12,72,737 shares. Likewise, the volume on Naukri (Info Edge India Limited) is 85,427 shares.
The volume information that you see here is the cumulative volume. Meaning, at 2:55 PM, a total of 12,72,737 shares of Cummins were traded at various price points ranging from 634.90 (low) and 689.85 (high).
With 35 minutes left for the markets to close, it is only logical to expect the volumes to increase (assuming traders continue to trade the stock for the rest of the day). In fact here is another screenshot taken at 3:30 PM for the same set of stocks with volume highlighted.
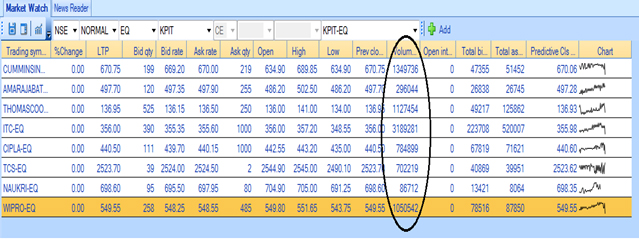
As you can see, the volume for Cummins India Limited has increased from 12,72,737 to 13,49,736. Therefore, for Cummins India, the volume for the day is 13,49,736 shares. The volume for Naukri has increased from 85,427 to 86,712, making 86,712 shares as the volume for the day. You need to note that the volumes shown here are cumulative.
12.1 – The volume trend table
Volume information on its own is quite useless. For example, we know that the volumes on Cummins India are 13,49,736 shares. So how useful is this information when read in isolation? If you think about it, it has no merit and hence would actually mean nothing. However, when you associate today’s volume information with the preceding price and volume trend, volume information becomes more meaningful.
In the table below, you will find a summary of how to use volume information:
| Sl No | Price | Volume | What is the expectation? |
|---|---|---|---|
| 01 | Increases | Increases | Bullish |
| 02 | Increases | Decreases | Caution – weak hands buying |
| 03 | Decreases | Increases | Bearish |
| 04 | Decreases | Decreases | Caution – weak hands selling |
The first line in the table above says, when the price increases along with an increase in volume, the expectation is bullish.
Before we understand the table above in detail, think about this – we are talking about an ‘increase in the volume’. What does this actually mean? What is the reference point? Should it be an increase over the previous day’s volume number or the previous week’s aggregate volume?
As a practice, traders usually compare today’s volume over the average of the last 10 days volume. Generally, the rule of thumb is as follows:
High Volume = Today’s volume > last 10 days average volume
Low Volume = Today’s volume < last 10 days average volume
Average Volume = Today’s volume = last 10 days average volume
To get the last 10-day average, all you need to do is draw a moving average line on the volume bars, and the job is done. Of course, we will discuss moving averages in the next chapter.
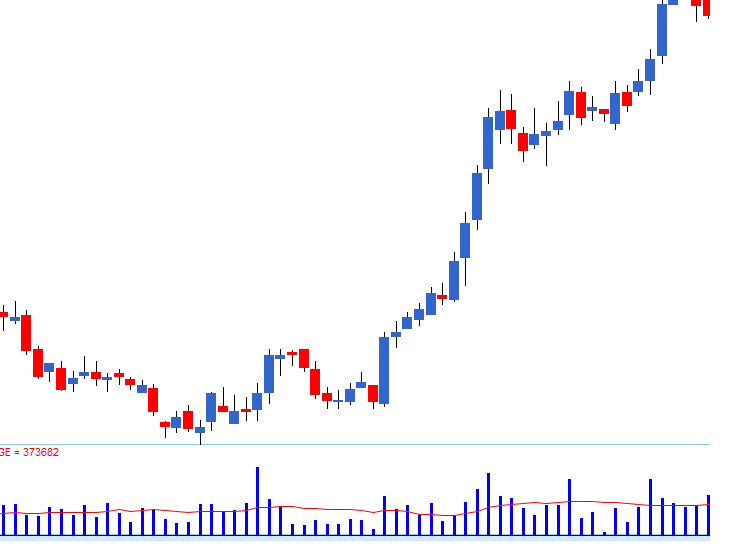
In the chart above, you can see that volumes are represented by blue bars (at the bottom of the chart). The red line overlaid on the volume bars indicates the 10-day average. As you notice, all the volume bars that are over and above the 10-day average can be considered as the increased volume where some institutional activity (or large participation) has taken place.
Keeping this in perspective, I would suggest you now look at the volume – price table.
12.2 – The thought process behind the volume trend table
When institutional investors buy or sell, they obviously do not transact in small chunks. For example, think about India’s LIC; they are one of India’s biggest domestic institutional investors. If they would buy shares of Cummins India, would you think they would buy 500 shares? Obviously not, they would probably buy 500,000 shares or even more. If they were to buy 500,000 shares from the open market, it would start reflecting in volumes. Besides, because they are buying a large chunk of shares, the share price also tends to go up. Usually, institutional money is referred to as “smart money”. It is perceived that ‘smart money’ always makes wiser moves in the market than retail traders. Hence following the smart money seems like a wise idea.
If both the price and the volume are increasing this only means one thing – a big player is showing interest in the stock. Going by the assumption that smart money always makes smart choices, the expectation turns bullish, and hence one should look at buying opportunity in the stock.
Or as a corollary, whenever you decide to buy, ensure that the volumes are substantial. This means that you are buying along with the smart money.
This is exactly what the 1st row in the volume trend table indicates – expectation turns bullish when both the price and volume increases.
What do you think happens when the price increases but the volume decreases as indicated in the 2nd row?
Think about it on the following terms:
- Why is the price increasing?
- Because market participants are buying
- Are there any institutional buyers associated with the price increase?
- Not likely
- How would you know that there is no meaningful purchase by institutional investors?
- Simple, if they were buying, then the volumes would have increased and not decrease.
- So what does a price increase, associated by decreasing volumes indicate?
- It means the price is increasing because of small retail participation and not really influential buying. Hence it would help if you were cautious as this could be a possible bull trap.
Going forward, the 3rd row says, a decrease in price along with an increase in volume sets a bearish expectation. Why do you think so?
A price decrease indicates that market participants are selling the stock. Increase in volumes indicates the presence of smart money. Both events occurring together (decrease in price + increase in volumes) imply that smart money is selling stocks. Going by the assumption that smart money always makes smart choices, the expectation is bearish, and hence one should look at selling opportunity in the stock.
Or as a corollary, whenever you decide to sell, ensure that the volumes are good. This means that you too, are selling, along with the smart money.
Moving forward, what do you think happens when both volume and price decrease as indicated in the 4th row?
Think about it in on following terms:
- Why is the price decreasing?
- Because market participants are selling.
- Are there any institutional sellers associated with the price decrease?
- Not likely
- How would you know that there are no meaningful sell orders by institutional investors?
- Simple, if they were selling, then the volume would increase and not decrease.
- So how would you infer a decline in price and a decline in volume?
- It means the price decreases because of small retail participation, and not really influential (read as smart money) selling. Hence it would help if you were cautious as this could be a possible bear trap.
12.3 – Revisiting the checklist
Let us revisit the checklist and evaluate from the perspective of the volume. Imagine this hypothetical technical situation in a stock:
- The occurrence of a bullish engulfing pattern – this suggests a long trade for reasons discussed previously
- A support level around the low of bullish engulfing – support indicates demand. Therefore the occurrence of a bullish engulfing pattern near the support area suggests there is indeed a strong demand for the stock, and hence the trader can look at buying the stock.
- With a recognizable candlestick pattern and support near the stoploss, the trader gets a double confirmation to go long.
Now along with support near the low, imagine high volumes on the 2nd day of the bullish engulfing pattern, i.e. on P2 (blue candle). What can you infer from this?
The inference is quite clear – high volumes and a price increase confirm that large, influential market participants are positioning themselves to buy the stock.
With all three independent variables, i.e. candlesticks, S&R, and volumes, suggest taking the same action, i.e. to go long. If you realize this is a triple confirmation!
I want to drive across the fact that volumes are compelling as it helps the trader confirm a trade. For this reason, it is an important factor and therefore, must be included in the checklist.
Here is how the updated checklist now stands:
- The stock should form a recognizable candlestick pattern
- S&R should confirm the trade. The stoploss price should be around S&R
- For a long trade, the low of the pattern should be around the support
- For a short trade, the high of the pattern should be around the resistance
- Volumes should confirm to the trade
- Presence of above average volumes on both buy and sell day
- Low volumes are not encouraging and hence do feel free to hesitate to take a trade where the volumes are low
Key takeaways from the chapter
- Volumes are used to confirm a trend
- 100 share buy and 100 shares sell the total volume 100, not 200
- The end of day volumes indicates the cumulative volume across trades executed throughout the day
- High volumes indicate the presence of smart money
- Low volumes indicate retail participation
- When you initiate a trade to either go long or short always make sure if volumes confirm
- Avoid trading on low volume days
How can we identify whether the volume is due to institutional buying for long term or day traders/short term?
Simple If the low of that candle is not taken you can than assume it is long term. Or if its taken out price should immediately close above within in few days like 3-5 days.
Also long terms is very vague here for you long term might be 2-3 years,for some other guy long term might be 6 to 12 months. For mutual funds long term might be 5-6 years
Hi really liked your module but there is no video explaining volume module anywhere so can you please tag or share the link for the volume and other missing modules as it\’s better and easy to learn from module along with video explanation.
Everything related to TA is here – https://youtube.com/playlist?list=PLX2SHiKfualH_xMbGM-3zWC47s9gUjGR_&si=0ucsaBtez_x0kYgn
But it doesn\’t have volume module video in it!
Ah ok, let me check. Maybe I can figure if it can be made sometime now 🙂
In the second row, \”price increase and volume decrease\” if the retail participation is happenning , then no of shares that are bought will increase, then volumes also should increase right? my doubt is how do volumes decrease when no of shares that are bought are increasing? please answer this sir.
You are basing this against institutional buying. While the number of retain participants could be very high as compared to institutions, the value is largely different and skewed towards institutions.
Hi Karthik,
When you say \”High volumes indicate the presence of smart money\”, does this mean we have to check \”Today’s volume > last 10 days average volume\”? And Should the line be Simple moving average?
Hi Karthik,
Can we place Support and Resistance using the Normal Distribution as you explained in the Options & Futures Module ?
https://zerodha.com/varsity/chapter/volatility-applications/
Why not, do give it a try.
Thank you for all the knowledge that you share via the platform. I recently came across something called \”Deliverable quantity \” that\’s available on nse website , which separates the intraday noise and provides the actual number of shares that were taken home that day. So isn\’t the \”Deliverable quantity \” more reliable volume data than the traditional vol data seen on the charts? How effective are the nse data when compared against vol data on the charts?
The only issue is that this deliverable quantity also includes people doing buy today, sell t\’row kind of trades. Which is basically short term in nature.
Thank you for your response. So what is the most reliable Volume data ? The vol data we see real time on the charts or the deliverable quantity on nse website?
You can consider both, but if you are taking the deliverable quantity, then be aware that it may have some portion of BTST trade.
What if volumes are high on the day doji candlestick is formed?
It just means that there were more transactions on a day when there was more confusion 🙂
How does the price increase when the volumes decrease? I mean if we go by the demand supply rule the price should not increase at all if there is a drcrease in market participantseven if it is a smart money or retail participants.
When volumes are low there is not much liquidity so prices can move based on how the orders are flowing in.
This is indeed very helpful
Why don\’t you provide average 10 days volume for the stock in your kite app ?
You can easily plot it on the chart, right?
Yes it can be done using charts to check the trend. However, at times an absolute number display helps
I think charts allows you to add the legend display on top that gives you the absolute number.
I dont understand what is rightwith price increase
Volume increase
Delivery increase please clear
Not sure if I fully understand the query, but its bullish when you both price and volume increases.
Dear sir , thanks a lot for this valuable content in free.
Sir I have a question-
In the EOD chart , there is a gap up opening and has a red candle with closing higher than previous day\’s closing which was also red candle. IN This situation, volume bar is red . By definition , it should be green bar because candle closing is higher than previous day closing.sir its very confusing.
Plz clarify about red and green bar in volume.
I know its confusing, for this reason, I dont really check the colour of the volume bar. It does not matter. What matters is if the volume is above or below the last 10 day average.
Thanks a lot sir ❤️❤️
Happy learning!
What would be the total volume if\”the buy side is 450qty and sell side is 500qty how one has to commute this?
Qty on both sides should be equal. In this case volume will be 450.
Hello sir.
I want to ask one thing. When I open any index’s spot charts in tradingview, what does volume there represent? For example, in nifty spot charts, what does volume in those chart represent? Is it nifty future’s volume? Or volume of all 50 scrips combined and formulated to some sort of average? Or something else?
Its most likely Nifty 50 fut volumes. Please do check with the support desk to reconfirm.
When u say that the vol needs to be high, what do u mean by that? What i mean is that we can check vol ideally post market closure. ( or i assume that is the way to see), so if i want to trade on a particular day should i see vol of the previous day to meet the condition you mentioned .
Yes, you can reference to the previous day. But do check how the vol is trending during the day. A quick check on ViX should give you that perspective.
Hello Karthik,
please clarify,
1. If there is a morning star formation,so the P3 candle\’s volume bar should be above the average MV of 10 days. Simply, which candle is entry decision candle that candle volume should be above mv.please correct me,if I\’m wrong.
2. I have another query, in back testing I found sometimes mv line is too high, even good volumes bar compared to previous volumes also could not touch the line.so what we should in this case, Can we consider if the volume bars is bigger than previous 2 to 3 volumes bars or draw trend line from previous volume bars then decide on break in intraday as an alternative of mv?
In summary, any candle formation, the entry candle should touch the mv line,if mv is far can we compare volume with previous volumes 2 to 3 bars…or can we draw trend line with previous volumes if the current volume bar breaks the trend line can we consider for trade?
1) Yes, the volume on the candle you trade on should be higher.
2) Yes, this is also ok. But the only issue is – how do you quantify?
Hello Karthik,
As you asked in the above response that how do I quantity – I am thinking like if the volume of the entry candle reached 1.5x times than previous 2to 3 candles then I consider as confirmation for an entry…is this fine?…I have a query, your lecture is 1day timeframe perspective..I am day trader, so in my case too the mv line of volume should be 10 days or any changes need to be make for mv line value of volume for day trading.
Yes, 1.5x means at least 50% more volumes than usual, so you can consider taking the trade. Even for day trading, 10 moving average day is good enough.
You cannot trade in index spot you always trade in index futures. Example You never trade in simply Nifty 50, you trade in Nifty 50 fut(which is future) or Nifty 50 options CE/PE
Hi ,
How do we figure out if high volumes are because of High frequency trading ? because that can be quite misleading for a retail investor
But volume is supposed to capture just that 🙂
Hey Kartik,
Already you have answered at many places. Still I am not clear about how to add 10days moving average over volume panel. I have already displayed volume panel. Thanks
Garima, in this case I\’d suggest you call our support desk and speak to them once. They will guide you step by step.
Thanx a lot
Happy learning!
I think ,this worked for me
Your answer to previous query
Open the chart and select the Day timeframe.
Under Study, select Simple Moving Average. In the popup menu that will open up, under Source, select Volume from the drop down.
Once the average line is added to the chart(replacing the candles). Click on the line and drag it to the Volume panel.
Great! Thanks for sharing 🙂
Go to indicator section and add volume , once you add the volume you will find gear symbol now click and you will find a new window , you will find input ,style & visibility now select / tick volume MA and now AVG. volume horizontal line will get added in your chart
Hi Karthik,
Besides bulk or block deals, when FIIs sells, DIIs buy and vice versa in the open market. Does it happen coincidently or how? Thanks!
Yes, a trade happens when a buy matches a sell.
Dear zerodha, please in Forex, what does it mean when a red volume bar is formed under a green candle stick.. I use mt5 and it\’s been difficult understanding volume this way.. Thank you…
I hope you do know that these platforms are unregulated and should not be used for trading. The useage of candles is same as explained here.
Hi Karthik,
I have a question regarding off-market transactions.
I believe that a seller with a large number of shares should be available for a bulk or block deal, which falls under off-market transactions. These types of transactions cannot happen at any time simply at the request of the buyer or seller. Therefore, there should be a pre-deal agreement or discussion that takes place before the actual transaction occurs. Could you please clarify this for me?
Hi Raja,
Yes, these deals are pre-negotiated and happens through what is called a ‘deal making process’. Typically there is an information flow through an institutional broker who has intel on who wants or who maybe interested in buying/selling a particular stock, at a particular price. So the deal maker ensures all parties agree. Once agreed, the deal itself happens via the exchange. Please note, the price reference for all these deals is the price that we all see on the exchange. So its not like Asian Paints is trading at 2450, but a deal is happening at 2400.
Thanks so much for the info. Satya!
Hi, I am not understanding price increase and decrease is relative to what and which price(open,close,high or low) we take for that?
It depends on the time frame you are looking at. For example, if you are looking at EOD chart, then the reference is previous day\’s close. If you are looking at the 15-minute chart, then the reference is the previous close of the 15-minute candle.
I am re-posting someone\’s question as I could not find answer for this
Vivek singh says:
November 28, 2018 at 12:47 pm
In in kite platform inside market depth.. There is showing bid and offers… If in any stock bids quantity is increasing.. Say its double the offer quantitie… Inspite of this stock price is not going up. Rather going down… Why sir… Does demand and supply theory doesn’t work in stock market….. Price of stock should go up Na… If bid quantity is greater… Plzz reply sir… This is a heavy confusion
Plzz reply sir
Karthik, I found the answer! Thank you. I believe the chronological order of questions and answers in the comment section was much better previously. The way recent comments are displayed now has created confusion, forcing me to scroll back to the first comment to gain clarity, which was unnecessary before. While I understand that people prefer new comments to appear first, I don’t see the logic in this approach. The core concept remains the same, and it doesn\’t matter whether comments are old or new when it comes to addressing doubts.
We are going to rework on the comments section soon to make it easier to see the latest comments 🙂
Stock prices will go up only when demand and supply match. One-sided bid/ask will not drive the price unless there is a matching quantity.
Can you explain it in more detail.?
Sure, but please share full context.
Information about the volume is good. Thank you. Suggest how to choose stocks.
Stock selection depends on various criteria. You need to take a call with what you are comfortable with – TA or FA.
Dear sir I want to ask what it means by saying that volume decrease with increase in price ,
means will it not increase to some extent remain same as previous or not in 2nd row
Means volume can increase due to buying or selling
How come decrease??
Or correct me please if I am wrong
It means that the prices are going up on lesser trading activity, Krishna. Which is not a great thing for establishing a longer term up trend.
Sir Is there any indicator that tells average volume of last ten days as you have an average line on your volumes, or I have to calculate it manually?
You can drop a simple moving average on the volume bar to get this information.
Sir In the beginning of the module you wrote 3 rules one of them was Be flexible can we apply same with the volumes?
Hmm, no. Volume is very specific data point.
Hello all, I have a query related Demand and supply zone. How can we see this particular zones in kite app.
The easiest way to do this is by plotting a support and resistance line. I\’ve explained this in the next chapter.
Hello sir, if the fundamentals & future prospects of a company is good but the trading volume of its shares is consistently very low, is it okay to consider such stocks for long term investing.Whether low volume should be considered a redflag?
Not really. Some good stocks can just have low float. Pay more attention to the business fundamentals.
Hi Karthik,
I am Sandeep.
I am trying to find the indicator for volume with moving average, but couldn\’t able to set it in the chart, bcos I see only volume indicator and there is no option in the setting to set the moving average (10day or so) in this particular indicator.
Could you please let me know how to set this indicator (Volume with moving average).
Sir,
Is it important to look after the color of volume bar, whether Green or Red? what it signifies ?
Not really, in my opinion just look at the volume in comparison to the previous day/weeks volume. That should suffice.
Hello sir
while using volume for intraday what period of SMA is preferable if we are using 5 mins timeframe?
You can use the same period SMA for 5 mins as well.
I had a Doubt for 3rd scenario. where price decreases and volume increases, we are saying that institutions are selling and thats why volume increased but volume is a transaction where buy and sell both happen meaning that if volume is high during price decrease , it will also mean that there are buyers as well who bought these many share. so how do you define this?
Yes, thats the reason why we look at the price along with volume and not volume in isolation.
Do these volume quantity include volumes of futures and options trades.?
If yes,is there any way to evaluate cnc,btst or intraday volumes from them.
No, each segment reports its own volumes. They are not combined.
Sir i have a doubt.
I understand the volume is increasing mean the transction happen.But how volume decreasing. Here decreasing meaning is the volume is decreasing from the 10 days average volume or what. And again help me to understand volume increasing or decreasing meaning. The standard point from which we look to evaluate volume is increasing or decreasing.
Here are the steps –
1) Plot an average line over volume. This could be a 10 day simple moving average.
2) Compare today\’s volume over the average of last 10 day.
3) If today\’s volume is higher than the last 10 days average volume, the consider today\’s volume as high.
4) If today\’s volume is lower than the last 10 days average volume, the consider today\’s volume as low.
Hope that gives clarity 🙂
Hello sir
Is there any way to apply average volume line in kite.
Thank you.
Yes, you can drop the simple moving avergae line down to the volume bars instead of the price.
Please explain the up volume and down volume.
Its explained in the chapter itself, Ansh.
Which indicator we should use to see volume bar as given above in the chart.
Please give a specific name
N how to draw a SMA over it
A SMA over volume bar is good enough for this, Shweta. I\’d suggest you speak to the support agent to help you with this.
so if today\’s volume is more than yesterday\’s it\’ll be green, is that what it means?!
does it not have anything to do with the price movements of the stock?
in the module you gave a table in which buy and sell qty were equal (400 and 400, 500 and 500 and so on), so i was asking what the volume would be if they were not equal,
The colour of volume does not really matter. You just need to see if today\’s volume is higher than say last 10 days volume.
hey Karthik, appreciate the blogs. pls clear this doubt for me:
1) what do green and red colored volume bars suggest? does it depend on the price of market (ie, bullish is green and bearish is red) or is it something else?
2) also, in the module, you explained the volumes when both bullish and bearish activities were equal, what if bullish activity is like 300 and bearish is 200, would the volume be 300 here or their average, ie 250?
Hey Aadi, the colours indicate in volume in comparision to the previous day. Your 2nd question, I\’m not sure if I fully understand. Can you add more context?
How will we know that specific days\’ volume beforehand to make the trade?
You wont know the exact volume figure for the day until the end of the trading session. But if you know what the previous day\’s volume is, then you can continuously compare volume at specific points during the day and check if today\’s volume is equal, more, or less compared to the previous day.
What if the price is in a sideways trend and the volume is also in a sideways trend?
Then you expect no major movement 🙂
Where can I read the price vs volume live chart, while trading sir?
You can check the charts on Kite.
I have seen a senario, (Stock – ITC, Day – 9/05/2024, 1 candle representing 1 day movement), Indicator RSI shows that the reletive price movement will be going upwards, and the indicator combo of EMA 25 and 50 are crossing eachother showing that the price movement will be upwards, and volume is reasonably above the average volume in the last 10 days, everything is showing great that the bear market will turn out to bullish (Market reversal), but the last 3 trading days forms a clear evening star, so in this senario what can be understood or determined by an agressive trader?
Guess I answered your query in the previous comment.
Hi Yantesh,
In any stock, if one person sells 100 shar3s, and another buys those 100 sahres, then how do the price move? Like if there were total 1 lakh orders, it means 1 lakh shares were sold to buyer who bought 1 lakh shares. Then how do price move up or down?
Price moves when the buyer quotes higher price and the sellers are willing to pay that price. And when more and more such trades happen, both price and volume increases.
I have seen a senario, Indicator RSI shows that the reletive price movement will be going upwards, and the indicator combo of EMA 25 and 50 are crossing eachother showing that the price movement will be upwards, and volume is reasonably above the average volume in the last 10 days, everything is showing great that the bear market will turn out to bullish (Market reversal), but the last 3 trading days forms a clear evening star and a huge red candle, so in this senario what can understood by an agressive trader? (Stock – ITC, Day – 9/05/2024, 1 candle representing 1 day movement)
I\’d go with the evening star. I\’m not a fan of RSI, and EMAs can be choppy in sideway markets. So you need to consider these things as well.
Hi Karthik,
Can you please explain how VWAP works in analyzing price moments. I heard that its good indicator to learn.
VWAP I\’ve explained in \’Other indicators\’, chapter.
hi
first of all i want to thank u and u team for such insightful content that u guys gives us 🙂
And i want to ask that suppose the price of the stock is decreasing and the volume is increasing so is it necessary that we consider it as a bearish signal why we cannot assume that it a positive sign as buyers are interested in buying the stock at this price.
Please help me understand this concept.
Thank u team Varsity 🙂
The only explanation basis price action – of price falling and volume increasing is that its bearishness. Think about it, if there was buying interest with high volume, the price would increase right?
Karthik sir Good morning. Sir you are great because of your hard work today I am able to understand the abc of stock market .
Sir I want to know what is bull/ bear trap, please explain it.once again very very thanks
Thanks for the kind words, Virendra. Any of these traps is basically a situation for you to buy or sell into a stock thinking that a bull run or a bear run is about to take off. But in reality, the market quickly takes a U turn and continues its previous run.
Hello,
I have a couple of questions on applying average line on volume chart on zerodha kite.
1) Do I apply simple average or exponential ?
2) I do not understand the \”offset\” field under edit settings for moving average.
Would be grateful for a reply.
Regds
1) Yes, simple moving average works for volumes.
2) You can ignore that till you get comfortable with using moving averages.
As you spoke about the double or triple confirmation with the candlestick pattern , support and the volume , when do we enter the market , what is the stoploss or is there no stoploss , and mainly what is the target , like u said go long but what should be the target and how do we prevent more loss and what is the stoploss
Tanish, we have discussed all these things and more in the TA module only, right?
If Mr A sold 500 shares to Mr B in a particular time, so volume is 500 of that particular time but what if Mr.B sold that same 500 share to Mr. C ( in same particular time) in that case is volume still 500 or 1000?
That would be 1000.
Thank you for Varsity!
On the Volume bars, should we draw an SMA or EMA line as a beginner in the stock market?
SMA is good enough, Bikas.
Referring to the Volume bar, how do I know whether smart money is involved int he volume or not? Basically, what is the benchmark/ threshold level that indicates the involvement of the smart money in the volume?
Example: If Price i increasing and so is the volume doing, what is that threshold level of the volume based on which I can understand that smart money is involved in the volume?
Thanks,
Pankaj
One quick way to figure this is by checking the avg volume over the last 10 days. If today\’s volume is greater than than the last 10 days volume, then that is an indicator of the presence of smart money.
Hi Sir,
T had a doubt.
Can I analyze volume on premium chart instead of futures chart?
Please give me right suggestion.
Thanks in advance
Hmm, you can do that, but for the larger picture I personally prefer checking the volume on spot charts.
Hello Sir,
Sir from the volume charts I can infer whether there is some institutional trade that has taken place or not. I just wanted to know how these FII and DII trade.
Do they invest in individual stocks, or they invest a lot of money on a prospective sector (So that all stocks in that sector grow). Because I thought given their size, scouting for individual good stocks would be difficult. So, they find out a sector which has good growth and invest in it. Can you give some idea on their mechanism of investing. Or is there any varsity module or content that I can refer to.
It really depends on the institutions. But yes, lot of them directly invest in stocks as well. But every action is caught in the volume bar and we have discussed all there is to volumes here itself 🙂
Thank you!
Hi Karthik,
I have the following queries:
i) what is the indicator that i need to use in Kite for increase in volume? Is it \”Volume Oscillatory\” or just plain volume with mean graph?
ii) In volume oscillator, going by your theory, should i input short length as 1 & long length as 10.
iii) 1 & 10 – is it generally recommended for all timeframe of trading – i.e intraday, weeks, months?
Please clarify.
Best,
Shambhavi.
1) Just plain volume should do.
2 & 3) I\’ve not used volume oscillator, so cant really comment.
sir what is the sufficent volume requried,to trade in options and stocks in intraday
It should have volumes good enough for your capital. For example, if the daily traded volume is 100000 contracts and if the quantity I wish to trade is 100, then thats good enough volume. But at the same time, if your quantity is 50,000, then 100000 may not be a great volume.
my doubt is that if a day is green, why did people sold stocks that day?
They could be booking profits, Salman.
sir,
I observed that some stock price is increasing well but the volume is less than 50000 k but the same time some other stock is up and moving done slowly even though their good volume is 1 cr or 1.5 cr etc . Why?
Depends on the overall liquidity, Sathish.
Sir, can you pls tell which time frame to use for intraday,short, Swing and long term derivative option trading?
I\’d suggest you used EOD regardless.
Thank you Karthik. I will call your support folks. 🙂
Please do, wishing you the best.
I have the candle volume in candle format. What I am looking for us, within the candle image numbers of the volume displayed. For instance:
2,35,767
68,007
3,89,657
1,89,433
All these volume numbers in real-time, within the candle.
What I am trying to accomplish by this, is to see the volume numbers in real-time to get better clarity for gauging the trend.
I am sorry if I am not being clear with my question. 🙁
Sheryl
Ah, you want the volume overlay (printed) on the candle itself? Is that what you are looking for? Why dont you call the support desk and ask them to connect you with someone who can explain chart settings well, maybe they can help better. I\’m not sure if that option exisit, but its better if they clarify it 🙂
Hey Karthik,
Crystal clear explanations above. Thank you.
I am looking at candles where the volume numbers by the second appear on the charts, within the candles. Do we have this capability within the kite app? (To understand my question better, just imagine a candle and within the candle the volumes traded by the second are displayed) I could have shared a picture here, but I don\’t see an option for an attachment.
Can you help? 🙂
Sheryl
Thanks Sheryl, yes, there is something called \’Candle volume\’, that gives you this information. Do check that 🙂
Hello karthik,
Since we are to consider volumes above 10 days average, should we ignore candlestick bullish/bearish patterns formed with volumes being below 10 days average ?
Ideally yes, as volume would be a key trigger to initiate trading positions.
If suppose I am looking at a 5 year old chart. What is the average I should be looking at? Last 10 month moving average? If yes, how can I calculate it?
You can consider a 100 or a 200 day moving avergae as these capture the broader trends in the market.
Hi Sir,
I have a Doubt on the volume Table…so u said that when Price decreases and volume Increases its a Bearish signal…But what if the smart money keep on Buying when Retailers Selling so that they Accumulating that stock…In this Scenario too Volume will Go Up while Price Falls Right??? Correct me if im Wrong Sir…So in this Scenario its Actually Bullish as Smart Money is Accumulating, Isnt it??? And Vice-Versa for Bullish Signal…Am i right, Please Clear My Doubt Sir…
Siva, usually the retail selling does not cause the price to move.
sir if price is not going up but there is a big volume showing in volume indiactor what would be the major reason for this can you explain any logic behind this
It just means that there is a lot of trading in a narrow price range.
Sir I have few doubts coz recently I tried some volume techniques to trade in intraday.
I shared my process of trading in Intraday please correct me if I am wrong in any side.
I trade on stocks only
Here is my process of trading
👇
1.I plot Pivot point standard on stocks
2.I look for first 5 mints candle and look if it\’s break any pivots and closed below/ above this
3.Then look in the volume bars
4.If price fall and volume bar showing increasing volume then I wait for the volume bar to be decreased (So I identify that sellers are now weak )and search a form of a buying candle pattern at any pivots then I go for Buy trade
VICE VERSA FOR THE SELL TRADE
Please correct me if I am wrong at any point????
Animesh, there is no right and wrong process. You only need to improvise on what is a starting point. Start with what you have and see how the results are, then improvise to enhance the results. You can use https://www.streak.tech/home for all sorts of backtesting.
sir
how i can plot moving averaages in volume bar
Please call the support desk for this. They will help you with this.
Dear Sir,
Is there any tutorial available on the operation of the Kite-Zeroda app.
I just have opened an account in Zeroda. I want to learn, how to place an Intraday / long trade with Target & stoploss. Also wnat to learn how to trail stoploss.
Pls hepl me out.
Regards
Rajesh, can you call the support desk for this? They will help you with this.
How to plot volume graph lines in groww\’s technical analysis chart ?
Not sure, please do check with their support team for this.
How do i plot volume indicators in the technical analysis graph ?
You can load this at the bottom of the price chart. Do check with the support team for details.
Hi Karthik sir,
Are there any FREE zerodha PI like ticker-reading software in today\’s world for day trading ?🙂
You can use Kite for pretty much anything trading related 🙂
Dear ma\’am/sir
My doubt is which time period I should use in volume moving average based on chart time frame
Ex.
I want to trade in 5 minutes chart so which time period I have to set in volume moving average???
Kindly share me all time frame of chart with relation to all time fram of volume moving average
Thanking you in advance !
You can use end of day time frame for this, Milan.
I am not sure whether anybody from Zerodha is still responding to the queries on this forum .
My query is regarding the colour of the volume bar. What does the red and green colour of volume bar indicate ??
I tried to correlate with the previous day\’s volume , average volume etc but couldn\’t. Please advise ? Thanks
Here you go, Rohit –
1) The volume bar will be green if the candle\’s closing price > the previous candle\’s closing price
2) The volume bar will be red if the candle\’s closing price < the previous candle's closing price
moving average i am not able to chart on the volume chart how to do it in zerodha and how to read volume profile
Hmm, not sure if I understand your query fully. But maybe you can call support desk, they will help you with this.
Dear sir ,
Why is my volume bar (volume chart) in Zerodha Kite mobile app red and green instead of blue?
You can customize these colors to your preference, I guess.
Sir, what should one do when the stock is in an all-time high or low region? We can\’t draw resistance or support. So what should one do, if one wants to go long or short? What aspects should one look for?
Thank you, Sir, Varsity is helping a lot!
Hi Karthik,
Thanks for your hard work to make the knowlege freely avaiable.
Want to know your view, if we are using VWAP, is it required to check SMA on Volume or both provide similer information
Its good to check SMA on volume, just to keep an eye 🙂
Are institutional deals more often than not Off the market transactions? If so, would it not impact adversely the credibility of volume data?
Block and Bulk deals are off-market, but these transactions do get reported to the exchange and added back to volume.
If total buy = 150 and total sell = 100, what will be the volume?
Buy and sell will be equal when a trade occurs. What you are looking at is bid and ask, which can differ.
Baroda Rayon Corporation Ltd
This particular stock remains a confusion to me. I saw the volume chart after going through the article. I was surprised to see there was no seller of the stock. Only the buyer.
Everyday it opens on Upper Circuit and it\’s already given returns of 2700% in just 4 months. How the new buyers are purchasing this stock when there\’s sell volume?
Finance also looks week at least to me. What am I missing? Anyway to check the volume of traded stocks if it\’s small quantity, say 100-500?
Its just that right at the open, the stock is getting bought and there is no activity for the rest of the day. Quite common with stock which hit the upper circuit. Finance is not complex, we have tried to make it simple here. Do give it a read 🙂
Sorry Sir, I didn\’t get the answer of second question: \”The color is largely basis the previous day volume\”.
If I try to find the answer form your answer then result might be as follow for me, but the doesn\’t fit in volume chart.
1. Today\’s volume >previous day volume = green color and vice-versa.
OR
2. color of volume depends on color of candle.
My bad, on Kite (ChartIQ) –
1) Volume colour = green if today\’s close price > the previous day
2) Volume colour = red if today\’s close price > previous day
Hello Sir,
https://www.tradingview.com/x/pXcKoGD6
In above link of TATA steel, their piercing pattern has formed & volume is 10 days above MA. Even though market has red candle for next 3 days in day chart.
Can you guess the market ideology for such movement. This chart is of previous week from 22 to 26 august.
2. if 100 buy & 100 Sale is 100 volume, then how zerodha is calculating growing & falling volume. As growing has green color & falling as red color.
For example: today\’s TATA Steel volume is 5,98,95,805 qty
calculation: Buy 59895805 & sale 59895805 = volume 59895805. it is a green color volume
so here how we decide red color volume or green color volume here.
1) Ronak, these patterns only enhance the probability, but there is no guarantee as such. So patterns can fail and you need to be prepared for this. However, the good thing is that in case the pattern fails, you also know the stop loss price and the price at which you can exit the trade.
2) The color is largely basis the previous day volume.
sir what should be the delvery volume percentage(above 50% or 70 %) to consider entry for swing trading?
Higher than the average volume of 10 days.
Zarodha is fooling gived no volumes for nifty n bank nifty looks hands in glooves.
No 🙂
Nifty and bank Nifty in the spot has no volumes. Only futures has volume and OI.
Can I get every 15minutes breakout in zerodha when intra day timings?
Not sure what you mean, but if its 15 minutes charts, then yes, you can.
Yes.
I was analysing Volume on intraday basis more than Overnight.
Thank You Again.
Thank You Karthik.
Hello Karthik,
I hope this link of the chart screenshot is visible.
https://www.tradingview.com/x/LR2geiIM/
On this chart :
MA on Volume is 20.
Resistance ( Orange line ) : 16690.25
13.40 Candle breaks this Level with 90.6k Volume ( which greater than 75.56k of MA ).
13.45 Green Candle with 238.9k Volume
13.50 Green Candle with 136.5k Volume ( MA is 86.59k )
but…
13.55 Red Candle which however does not breaches the above level downwards but it has Volume of 91.25k which is greater than MA of 87.35k.
1. Now should I squre off my trade considering :
1.a)that Smart Money will be booking profits as this 13.55 Red candle Volume is above average?
1.b)that this Red Candle’s volume is greater than 13.40 Green Candle volume ( the one which had broken the Resistance ) ?
Or
2. I should continue to hold my PE sell considering that 13.55 Red Candle Volume i.e 91.25k is still lesser than the “recent 13.50 Green Candles” Volume which is of 136.5k ?
Karthik,
3 Where will you exit seeing the chart ?
4. Does the First Volume bar holds any significance ? First 5min candle’s Volume bar ?
Thank You.
And…the same link for these queries :
https://www.tradingview.com/x/e06SNXST/
With respect to :
“4a) Not necessary. When breakout happens, it usually is on high volume, so don’t compare just on the basis of the previous candle. Look at the average”
And
“4c) Look at the price movement. Is it surging with a big % price change?”
Above…
Q1. Ain’t any candle with Volume above it’s MA is High Volume candle ?
Q2. At 10AM MA is 188k, Volume is 140k. Then there is contraction in MA is seen. At 11.45AM, MA is 46k, Volume is 130k. Now how will this 130k volume be taken as…High Volume or Low. ?
a) As it is lower than Previous Volumes like 140k at 10AM so Lower?
b) Higher cos it is greater than its MA i.e 46k ?
Q3. How much price surge will be treated as actual surge ?
—-
1) No necessary. Breakouts can also happen backed by low volume.
For the rest of the queries, hopefully my previous response will give you an answer.
Kathik,
Here is the link for these queries :
https://www.tradingview.com/x/LR2geiIM/
On this chart :
MA on Volume is 20.
Resistance ( Orange line ) : 16690.25
13.40 Candle breaks this Level with 90.6k Volume ( which greater than 75.56k of MA ).
13.45 Green Candle with 238.9k Volume
13.50 Green Candle with 136.5k Volume ( MA is 86.59k )
but…
13.55 Red Candle which however does not breaches the above level downwards but it has Volume of 91.25k which is greater than MA of 87.35k.
1. Now should I squre off my trade considering :
1.a)that Smart Money will be booking profits as this 13.55 Red candle Volume is above average?
1.b)that this Red Candle’s volume is greater than 13.40 Green Candle volume ( the one which had broken the Resistance ) ?
Or
2. I should continue to hold my PE sell considering that 13.55 Red Candle Volume i.e 91.25k is still lesser than the “recent 13.50 Green Candles” Volume which is of 136.5k ?
Kathik,
3 Where will you exit seeing the chart ?
4. Does the First Volume bar holds any significance ? First 5min candle’s Volume bar ?
Thanks, Hemant; please ignore my previous comment. I can see the chart and your queries.
1) So volume as a concept is more applicable for overnight trades than EOD. Dont spend too much time on volume analysis if you are intraday trading. If I were you, I\’d hold the trade and base my decision to sell (or, for that matter, buy trade also) based on price behavior. Also, the difference in volume here is hardly anything, so don\’t worry too much about this
2) Exit depends on a few things – do you have a target in mind and has it been achieved? What is the stop loss? Is it intact or has it been hit? Is the stock exhibiting momentum after you took the trade? If yes, do you want to trail the profit and hold on to the trade? So think on these line for planning an exit rather than just volume analysis.
Good luck.
Karthik,
Here it will open :
https://www.tradingview.com/x/1S5zOsUE/
Thank You.
Hello Karthik,
https://kite.zerodha.com/chart/ext/tvc/NFO-FUT/NIFTY22JULFUT/13756162
Is there a way to share the screenshot ?
Or
Please tell me a way to share the link…as I tried opening the link from another ID but it was not opening there as well.
You can upload the chart\’s screenshot on Google drive and share the link here. That will work. But when you do, please compile your queries again, so that I can see the chart and your query in the same comment and respond. Thanks.
With respect to :
\”4a) Not necessary. When breakout happens, it usually is on high volume, so don’t compare just on the basis of the previous candle. Look at the average\”
And
\”4c) Look at the price movement. Is it surging with a big % price change?\”
Above…
Q1. Ain\’t any candle with Volume above it\’s MA is High Volume candle ?
Q2.
a) Say on the first 2 hours MA on 5min chart was 200k. So every 5 min candle above 200k in those 2 hours will be counted as high volume no ?
b) Say after 2 hours…MA contracts to 100k. Then candles with Volume like 120k/130k/190k will be treated as high Volume? Or it will be treated as low volume since it is still lesser than the 5min \”high candles\” from the first 2 hours candles ?
Q3. How much price surge will be treated as actual surge ?
Karthik,
Why am I flooding you with questions because I have not been able to ride the trend like many traders do. All cos the concept of Volume which has been amalgamated in my brain stops me from doing so.
As after \”a breakout any Red Volume candle greater than MA\” I take it as Smart Money has done the profit booking even though it is still above Resistance and I exit. There is something to it which others have caught it well but I am yet to catch it.
Also
A1.
Say at a resistance a Green Candle it tries to break with 230k Volume which is above MA but fails.
A2.
And it tries again after half an hour but with lesser volume say 120k and fails this time too. MA 110k.
A3.
But on third attempt it breaks it but with just 100k Volume, MA at 90k.
A4.
And the very next candle after it gets 200k Green Volume candle.
Where will you enter ?
If :
1. At A3 : then ain\’t the Volume at A3 where it actually got the BO is lesser than in the previous 2 attempts ? Should not this be called a Fake Breakout as Smart Money was more in previous attempts?
2. At A4 : Then reason is it that after A3 you were waiting for more confirmation with Volume since it was lesser in previous two attempts that\’s why after A4 you will enter ?
Thank You.
Like I mentioned, the chart is not visible 🙂
Hello Karthik,
Thank You for taking all the queries and coming back with detail replies. Thanks Alot.
I did\’nt knew that we can share charts link also.
Link :
https://in.tradingview.com/chart/ZvXSEGpu/?symbol=NSE%3ANIFTY1%21
On this chart :
MA on Volume is 20.
Resistance ( Orange line ) : 16690.25
13.40 Candle breaks this Level with 90.6k Volume ( which greater than 75.56k of MA ).
13.45 Green Candle with 238.9k Volume
13.50 Green Candle with 136.5k Volume ( MA is 86.59k )
but…
13.55 Red Candle which however does not breaches the above level downwards but it has Volume of 91.25k which is greater than MA of 87.35k.
1. Now should I squre off my trade considering :
1.a)that Smart Money will be booking profits as this 13.55 Red candle Volume is above average?
1.b)that this Red Candle\’s volume is greater than 13.40 Green Candle volume ( the one which had broken the Resistance ) ?
Or
2. I should continue to hold my PE sell considering that 13.55 Red Candle Volume i.e 91.25k is still lesser than the \”recent 13.50 Green Candles\” Volume which is of 136.5k ?
Kathik,
3 Where will you exit seeing the chart ?
4. Does the First Volume bar holds any significance ? First 5min candle\’s Volume bar ?
That link is not working, Hemant.
Hello Karthik,
Also how to read the first Volume bar of the day on 5min chart ?
Does that signifies something?
Thank You.
It is the volume for that 5-minute duration, which will complete after the 5-minute duration ends.
Thank You for this quick 🙂
With respect to ..
3) It broke 16500 but Volume bar was less than its MA line. But on the next candle it did broke 16525 that too this time with Volume bar greater than MA line. So I thought that the first breaking of 16500 was fake. In this case when will you enter seeing the Volume ? After it breaks 16525 ? or 16500 itself ?
4) Say MA line is at 130k. It broke a resistance with Green candle say Volume 140k. I entered into the trade. Say just after this a red candle appears but with Volume 135k ( MA is still 130k) – Four Scenarios :
4.a) If this red candle with 135k Volume is still above resistance but Volume is more than MA line but lesser than above Green Candle\’s volume ( i.e 140k ) so this is pull back ?
4.b) If this red candle with 135k Volume is breaks down the resistance but Volume is more than MA line but lesser than above Green Candle\’s volume ( i.e 140k ) so will this be a pull back too ?
4.c) If this red candle comes with 145k Volume is which is more than previous Green Candle\’s volume but it is still above resistance so what do we understand by this ?
4.d)If this red candle comes with 145k Volume is which is more than previous Green Candle\’s volume but this time it breaks down the level…then this should be clear cut case of BD. Right?
Please elaborate.
1) Probably 16525 since the volume is more convincing
4a) Not necessary. When breakout happens, it usually is on high volume, so don\’t compare just on the basis of the previous candle. Look at the average
4b) Same as above
4c) Look at the price movement. Is it surging with a big % price change?
4d) Perhapse
Btw, imagining these situations in comment is very difficult with no context. Best if you ask these by sharing link to chart, only then i can respond with clarity.
**
a) A green candle with Volume less than MA crosses 16500 ( P is +, V is -)…but after this another green candle but with Volume greater than MA ( P is +, V is + ) crosses 16525 ..so should one take the trade here ?
Hello Karthik,
This is wrt to this comment : \”Also, always make sure you compare real-time volume (on intra day basis) with the previous day volume to get the bigger picture.\”
1.Please share the visual example as to how do we compare it with PD\’s volume for intraday.
2.By default setting of MA on volume is 20. So should we keep it to 20 or change ? What factor decides what could be the appropriate MA on Volume?
3. Say 16500,16525,16550 are the resistance…
a) A green candle with Volume MA
( P is +, V is + ) crosses 16525 ..so should one take the trade here ?
b) If Yes then please elaborate…as the first breakout at 16500 was fake..without volume ?
4. Say MA line is at 120k. It tries to break a resistance say 17000 with Volume of 130k but it returns back. Again after few minutes it again tries to break but with Volume 125k (lesser than previous attempt & MA line is still at 120k) but it does not comes back after this all throughout the day. How to read this scenario as ? As in first attempt it did with 130k but came back…but in next did with 125k..succeeded?
Hoping to get the answers of these.
Thank You.
1) Load the EOD chart during market hours with volume and compare today\’s volume with the previous few sessions
2) YOu can change it to anything that you think makes sense, I prefer 10
3) I\’d take the trade. How is the 1st break out at 16500 fake when the price is at 16525?
4) This is a typical pull-back situation that happens. Do check the volume when the price declines, it should ideally be on low volumes
Good luck.
SIR LET\’S TAKE AN EXAMPLE IF THERE ARE 100 BUYING QUANTITY AND 200 SELLING QUANTITY VOLUME THEN WHAT IS THE ACTUAL VOLUME?
That cant be right, reported volume should match selling and buying volume.
Banknifty option chain OI change kese hota hai or kitana time me update hota hai
Its real time, Manoj.
because result of both the impacts are similar .i guess
These are two different things –
1) When there is equal buying and selling pressure, price does not move.
2) When transactions happen via bulk and block deals, price is not impacted.
But how to recognize that which one is happening and when between above two points.
1) Yes, usually results in doji or spinning top
2) Yes, since its off-market only volume gets reported
Also please clear my doubt sir, i understood that on volume bar i have to plat 10 or so on SMA to check current vol higher or lower than last days volume, i come to know that how to plot but please i dont know where to see and how to see is there any number to watch that todays volume is higher than last 10,20 … days MA plotted on vol bar or vice versa. because i have plotted SMA on vol bar but how to analyze and recognize my today vol is high or low than previous average , means i am not able to get the data of that, however i know only how to plot sma on vol bar but not able to get data from where to know todays vol high or less than previous last days average .. please explain sir.
For that, compare today\’s volume bar with the moving average latest value, you will know.
But above you said we should check volume compare to previous 10 days moving average, if vol is higher than previous MA vol than current vol will be higher, and vice versa
Yes, 10 days moving average of the volume.
For swing trade which moving average is better to use for SMA over volume , is 10 day SMA is good or 20 SMA is good or else default 50 SMA is good as select in field source. Also suggest for intraday and F&O both. Means suggest days for compare volume over ;last moving average.
Hard to say 1 MA is better than others, you need to select what works for you.
Thank you for your reply sir, not sure how to use trading view, but the way I found to get the 10 days avg volume line , was to select \” Show MA \” under \” volume \” settings.
Earlier we had to select \” Field \” as \” Volume \” under \” MA \” settings, as mentioned by you in earlier comments. Please can you elaborate a little about trading view, Thank you.
Ok. No problem. Let me know if you need any further clarity on this.
Sir,
First of all thank you so much for all the info, you have provided.
I think kite has evolved over the years, some info that were true earlier now seems to have changed.
For example.
After having the volume chart visible in kite , I want to apply the SMA to volume but in \” Source \” of SMA there is no option to select volume?
So how can I get the 10 days average volume line superimposed on the volume chart?
Ah no, its still pretty much available, Bhasakar. Try using Tradingview.
one of your reply of my query was \”Ah, it just means that there was a lot of buying and selling activity, but the price dint move much, which further implies that the bulls and bears had an equal impact on the stock price.\” the query was there is high volume but price didnt move much. you said bulls and bears had an equal impact, but on my another query you said that it may be block/bulk deal by institution due to which price didnt move much .
So i want to ask which one response is correct in between them.
These are two different things –
1) When there is equal buying and selling pressure, price does not move.
2) When transactions happen via bulk and block deals, price is not impacted.
\”1) Yes, I’d do that myself. Check volumes on spot and then take action in F&O
2) It makes sense to check spot volume, its available on Kite.\”
what is the meaning of above two points, and what is the meaning of spot market and spot volume.
Please dont mind for this back to back long questions sir , As i m fresher and eager to get deep knowledge .thanks
\”Check volumes on spot and then take action in F&O\” means??? this comment is yours sir.
For example, if there is infosys spot and Infosys futures, then to trade futures, I\’d refer to the action on the spot chart and then basis that trade the futures. It may sound a little complex until you get the nuances of the futures and spot.
Also want to ask that how to know the volume confirmation after confirming the pattern and price, because there is sometimes one long volume bar after that some lower than previous again some low again some higher, mean to say that how to confirm the volume at last like one single long high volume bar is created but after that some fluctuation created in the bars some are high some low means not exact measure some long some short . so should we consider only first long candle and can make confirm that its going long,
means how to read volume bars because there are multiple bars formed after confirming high single bar
If today\’s volume is greater than the last 10-day simple moving average, then consider today\’s volume as good. Else, don\’t.
one more query sir, one of the above comment you mentioned \”. The green indicates an increase in volume and the red indicated a decrease in volume – both compared to previous day.\” but in my query you told me that color of the volume bar we should ignore ,and if color of volume bar is red and green that does not mean green is high volume and red is low volume. Because i think color is depend upon previous close, means if volume bar is green color that means that volume bar is higher than previous bar cloase ,and if vol is red color that means vol bar is lower than previous vol bar ,according to you . is it right? So now getting confused by your above comment that green means high volume and red means low volume,. please explain sir
Neeraj, the thing is that we need to compare the volume of today with at least last 10 days to get a sense if today\’s volume is high or not. One way to do this is to compare today\’s volume with the 10-day simple average. Given this, the color of the volume becomes redundant.
very very thank you sir for responding all my queries in such a easy and nice manner .
And if they trade on market via exchange like as normal retail traders , so this should impact price . and also they always take trade in huge quantity or transactions and block/bulk deals are also huge transaction so can we say both are same types . I mean to say both the transaction done by institution are in huge quantity either block/bulk deals or via exchange like retailer. so what is the difference between both that why they do off market transaction instead of on market txns trading platfrm.
Yes, transactions are usually huge. If done on exchange, it will impact the price. So exchanges has the provision to route it off market.
sory for back to back rubbish queries sir last one doubt that if there is bullish engulfing pattern at bottom of prior downtrend means the may be we can take trade long,also S&R matched ,also volume bar is higher than previous 10 days average and long but that volume bar is red in color, all 3 checklist are matched but confusion is volume bar is red but also long high volume, so please tell me should i go long for that trade because doesnot matter that either volume bar is red color aur green color its just only about high or less volume,because color of volume bar is basically depends on previous close bar ,if todays bar is higher than previous close then color of volume bar will be green and if less than previous close than it will be red, only just to see volume density and ignore color , and take the trade accordingly..AM I RIGHT ?? please answer all my above queries as a point… thankyou so much
You can ignore the colour of the volume bar. The only thing that you need to check for is today\’s volume versus the previous few day\’s volumes. If the volume is high, then that\’s good enough.
Also above mentioned institutional investor is smart money when they buy it will be huge amount,so volume should increase price should increase,but in some cases volume increased but price still same not move much then you said it will be block/bulk deal thats why price moves not that much or still about same.but please tell me that block/bulk deals also taken by institutional investors as smart money then why price not moves not much, it should move up or down na? because block/bulk deal are happened by only those institutional buyers /sellers
Block and Bulk deals are off-market transactions, Neeraj. So these transactions won\’t impact the price. Only if the price is impacted by volume is when you can take trading action. Since bulk and block deals are off-market, they should not impact your trading decision.
because as you mentioned above we can make confirm the trade after high volume bar as checklist rule.
Yes, but like I mentioned, high volume should match with a price move as well.
thanks a ton for replying sir. Ok so that means ,it is not necessary that price will move upward or downward if there is high volume bar is there at bottom, right? which means we cannot make sure to take the trade or not make it confirm about to take the trade long or short if already high volume is there. because i thought if high volume is there in chart, there will be some opportunity to take trade may be long and short according to above table of volume and price. i thought we can make sure or confirm to take the trade after seeing high volume (red or green) or confirm the trade after seeing high volume bar. is it? please explain sir.
Thats right, Neeraj. The price should confirm with the volume for you to take any trading action. Just volume without any price action is no good for a trade.
No sir, i didnt mean it, actually i opened the RIL chart and i want to ask that there is one long red volume bar which means high volume at that point, but there is no much price change , please could you check https://chartink.com/stocks/reliance.html which you told me,in this same at last end from the right please see there is one long red volume bar what does it mean,it should be high volume, but according to this price didnt change as much. please elaborate me what is the effect of that long red volume bar in price chart. i am not able to attach the chart of RIL
Ah, it just means that there was a lot of buying and selling activity, but the price dint move much, which further implies that the bulls and bears had an equal impact on the stock price.
Hi sir,i am not able to attach file,please elaborate if there is one EOD chart in trading view of reliance industries there is one red volume candle at bottom in volume bars which is very long as compare to other bars which shows high volume having selling pressure but there is no downward movement showing in candle stick patterns.there is some upward movement at some points thenafter it becomes downward after somedays ,i am confused because at long volume red candle it should be downward movement.please suggest
Neeraj, are you talking about how the chart appears for RIL? Why don\’t you log into Kite and check? Else you can check here as well – https://chartink.com/stocks/reliance.html
I have a confusion. That if there is big volume spike on a particular day and price increases..How could it point out to take long call as investment while there is only say less than 30% delivery volume?
Shouldn\’t we only rely on delivery volume for taking long call as intraday volume doesn\’t make sense(as it makes no sense after day close) for buying stock for swing trade. I am confused that why delivery% is not focused upon for swing call and how could just trading volume which has major portion as intraday helps to take swing trade. Kindly help me understand.
Delivery volume can be misleading. For example, even if I do a BTST trade, it will show up in delivery volume but the intention is to sell the stock t\’row. So I\’d rather use EOD volume.
What we can say in other words is increase in volumes indicates that buying and selling has subsequently increased on large scale as compared to last 10 days average.
However as volumes indicates equal buying and selling we cannot decide the direction based on only volumes.To validate volumes we need to combine it with price action.i.e an increase in price indicates although buying and selling were equal,demand is huge for buying hence price is shooting up.
Similarly in case of decrease in price indicates although buying and selling were equal,supply is huge for selling hence price is falling down.
Is this more precise now?
Do confirm
Thanks in advance!!
Yes, this is exactly what I\’ve tried to convey as well.
1 buy and 1 sell indicates 1 volume.
The differentiating factor to go long or short is the combination of volume with the increase or decrease in price,An increase in volume with increase in price indicates that buying has been preferred on large scale,however selling has also taken place with same numbers only the buying was heavily preferred than buying and vice-versa in case of selling.
Is this explanation right?
Do confirm
Thanks in advance!!
Yes, and you can substantiate that with the increase in price. Hence you need to combine both price and volume, Paras.
Volume bar above average line
And if it is bullish bar
Should we buy? Becase whenever we buy seeing huge Volume in upside And also seeing candlestic pattern like bullish engulfing we see it goes down, so how to use volume as it show smart money why it goes down And what Strategy we Should adopt seeing huge volume in upside or downside
Kamal, don\’t rely just on the volume bar. Use it as a supplement to the candlestick. Do review the checklist given in later chapters. Go with that flow.
Is it better to exit the trade if the volumes are below MA10?
In case, If we have already entered the bullish trade based on Marubozu candle, But don\’t know when to exit?
can we depend on volumes to exit the trade?
Nope, I\’d suggest you trade basis the pattern. Use volumes as a supplementary analysis tool and not the main tool for decision making.
Hello sir,
First of all thanks for explaning in such a wonderful way..
I have one doubt sir about price change.
Suppose in 5 min TF. If volume increased but price do not. Actually, price change like the candle open at 200 and went till 205 but closed at 201 so what that means price changed or not as it move till 205. What we should consider this the first scenario or second.
Or we should see candle body or only price after closing of candle.
It just means that a lot of transactions occurred in that TF but it had no real impact on prices, so it will be hard to call the direction. By the way, don\’t read too much into the volume change in these short ultra-short timeframes.
How to find Institutional investors or FII are buying some stake in the company officially
How to find Institutional investors are buying some stake in the company officially
Keep an eye on the bulk and block deals, Arun.
Hello Karthik ,
Last question with regards to the topic
When you say color of the candle does not matter you are talking about candle color or volume bar color ?
Many Thanks
Shaan
I\’m only talking about certain candles like spinning tops and dojis. Every other candlestick colour matters 🙂
Thank you Karthik ✌
Happy learning!
Hi Karthik ,
Just to clarify
if assuming current Trend is up & price has corrected to support zone(LH) forming a Hammer with Red High volume candle – so in this scenario whom to we consider more strong Buyers or Sellers because volume suggest sellers are strong so how do we trade in this scenario
Regards
shaan
If the hammer is backed by high volume (hammer formed after a brief sell), then do look at long opportunities. By the way, the colour of the candle does not really matter.
Thank You Karthik for your prompt response , just wanted to get a clarity on the below
Assuming the trend is up & the price has corrected and currently at or near a major support Zone – Previous candle was a bearish candle with high volume and closing on or near the support Zone .
So is it like this –
if seen a hammer forming with high volume on this support zone or near to it which means both bulls/bears are at equal force n there is indecision in the market , so enter a long trade on the conditions depending on risk taking or risk averse trader
if seen a bearish candle with high volume on this support zone or near to it means bears are still going strong which means price is still correcting breaking the current support zone & wait for the price to reach next support zone to enter the trade(Assuming trend is still upwards)
Regards
shaan
A Hammer at the end of a downtrend is bullish, right? This implies that bulls are in control. So it\’s a one-sided trade.
As you have mentioned that take only those trades whose volume is higher than 10 days average but how we know that today\’s volume will be higher than 10 days average at the commencement of the day ?
I hope that you have understood that what I am trying to say.
Thankyou
Keshav, you can do two things –
1) Check the previous day\’s volume and get a sense of how the volume is compared to last 10 days.
2) Track intraday volume and see how if it\’s moving higher than the average of the last 10 days.
Hello Team ,
Could you please help me with this – When you say increase or decrease in price from the volume & price perspective what would be your input for the below scenarios
Assuming we have a candle which can be doji or spinning top on Support or Resistance Zone with high volume – What do we think of price in this scenario
Assuming we have a candle which is a hammer or a shooting star on a Support or Resistance Zone with high volume – What do we think of price in this scenario
Regards
shaan
1) Doji/Spinning top near S&R with high volume indicates heavy-duty action by both bulls and bears with no conclusive outcome. The value of S&R increases here, as in I\’d trust the level higher
2) Again a good sign to base your trade on.
Sir , will we use previous day volume to trade tomorrow ?
The previous day\’s volume is used as a reference for taking a decision on today\’s trade. Just to give you a perspective on the volume trend.
As you have written in the last point that do not trade in low volume. But how would we know that that todays volume is low or hight because we know the volumes at the end of the day
You can compare today\’s volume with respect to the last 10 days\’ volume by taking an average and then figuring if the day\’s volume is high or low.
S & R points act as SL POINT ?
Yes, very much.
In 2nd and 4th, volumes are decreasing in comparison to last 10 days volume average?
Am I correct
Perhaps, but take the average volume under consideration.
Jaise Aapne bataya tha ki Bearish Marubozu mein risk taker trading period ke end mein short karta toh usko phir same day hi short position ko square off karna padega ?
Yes or no
Jitne shares sell kare kisine Utne hi shares kisine buy bhi toh kiye honge.
Toh phir price down kyo hua ?
Isliye hi Toh nahi ki traders ko future expectation mein down dikh raha tha
I.e they sold the shares at low price ?
Keshav, price is a function of demand and supply. If demand goes low, the trades also happen at a lower price. Likewise for price moving upwards.
which type of M.A. is best for intraday for time frame 5min or 15min . on candle charts.
hello sir, as you suggested : use SMA on volume charts (any time frame like- 5min or 15min)
can you also suggest us, which moving average we can use on candle sticks on intraday chart of time frame 5min or 15min.
and how we can make decision on trend by observing that M.A. either to look for buy or sell.
Manish, you use use a simple 10 day average on volume that will help. Volume is considered high if the volume bar is higher than the average and less otherwise.
Hi,
Is there are any way to Bid and Ask Price in a live market through scanner for specific list of stocks.
Thanks & Regards,
Veera
YOu can pick any stock, please a bid and ask for 1 stock to see how it works 🙂
If no share transactions for buyer n seller are same then What does colour of volume bar indicates.
It indicates the relative strength wrt to the previous day, Hemant.
How do we know that volume is high or low? What I mean is that should we see volume with respect to total shares e.g if the volume of stocks of some company is 1000, and the total shares of the company are 2000, then it seems to be a good volume. But it total shares of the company are 1,00,000, then 1000 volume seems to be very less. Am I right that whether we should compare current volume w.r.t total shares or something else?
Amit, one easy way is to check the current day volume and compare it with the last 10 average volumes. That gives you a sense of how high or low the volume is.
Kindly tell me difference between Ask Quantity and Bid Quantity and what are their significance if bid quant. is more or less than ask quant?
Also how ask and bid quantity is different from volume?
These are the quantity available for sale and purchase. It makes no real difference, unless you are an HFT trader. Remember you see this on the market watch and these numbers change constantly. Here is an example – I may come to the vegetable market to buy 5kgs of beans. But if the vegetable seller has only 3kgs, then the transaction happens for just 3 kgs. Here buy quantity was 5, sell quantity was 3, and volume (a transaction that took place), is 3.
Hi Sir, Greetings!
I have a doubt that let\’s suppose if the institutional investors have a huge number of shares to buy or sell then why would they do it in such
a way that it would reflect in the volume indicator since the retail investor will catch their activity with the help of Volume Indicator.
So my question is that can they not buy or sell in such a quantity that the indicator won\’t be able to capture the exceptional quantity if yes then how retailers will get to know something like that have happened?
Sonu, every market participant should comply with the regulations. No one can trade outside the regulatory framework. So all trading activities of all the players will be captured by volumes.
And what it means if lot of trades are buying at same price
It means, that the transactions are happening at a constant price.
Hi Karthik thanks for replying to each and everyone with lot of patience
I have observed 4 following things and hopefully u can help me with that
1) volume is huge candel is big
2) volume is huge candle is small
3) volume is small candle is big
4) volume is small candle is small
Thanks for your time
Rajeev, yes, these are all different possible situations that occur in the market. I have summarized this and explained it in the chapter itself. I\’d request you to please do take another look.
Sir my simple query is if I buy 100 share of any stock and it ll immidiately reflected on last 20 traded positions so would be on blue side or on red side on zerodha app?
Buy is blue, sell is red 🙂
Hi pls tell whether we need to check high volumes even in intraday or is it just for swing trading ?
Thanks
Yes, it is always safer to check for volumes Rahul.
How to set an alert in Zerodha based on volume? For example , the volume traded > 10*(avg volume of last 15 days)
Check this – https://sentinel.zerodha.com/
Sir
In intraday trading meaning scalping.So you tell me the idea how I buy. And which Risk reward ratio. Like you briefly tell us about positional trading in last chapters.
Like an example
First you see a candle formation in 50 stocks then s&r then volume and then wave theory perspective then indicator then risk to reward ratio. In which you get 3- 4 stock but for intraday trading proccess in lengthy fo 15 minutes chart. Why because candle formation goes on
So tell me for scalping/intraday process
Vishal, it is the same process, except that the time frame reduces. The method to evaluate the trade opportunities remains the same.
i have heard some people say that you should only trade after this time when market opens.
like most common is that dont place a trade when the market has just started
what is your view on this?
I believe you should trade when the opportunity is right, everything else is secondary 🙂
Sir,
1. I have seen, some times volume candle drastically increase with no big change in price.
2. Some time volume and price increase, then the next day come to notice that some big investers exist.
3. Some time volume increase and price decrease, then after EOD come to know some big investers bought shares.
Can you help me.
Yes, this is possible. Sometimes a lot of trading happens at the same price, without impacting the price. Given this, all these 3 situations are possible.
when adding moving averages i don\’t see any option called volume..even after adding volume chart..there are few other options like close open high low ochl/2 etc.
Siddarth, I\’d suggest you call the support desk, they will help you with this.
Hi, how do we check the volume on a kite that previous day volume is more than 10 days average volume, do we check if the average curve on the volume chart is increasing then we can make sure previous day volume is more than 10 days volume
You can plot a simple moving average over the volume, Sarvesh. Volume higher than the average indicates more volume and vice versa.
महोदय आपके हिसाब से \”ट्रेंड\” समझने के लिए एक उपयुक्त इंडिकेटर कौन हो सकता है।
Trading volume not shows under the live candles, is is closed or not shown my chart
Please check it
Jiyash, this is available. I\’d suggest you speak to the support desk about this.
What\’s the difference between between sma, ema, wma etc.
MA = Moving avergae.
S= Simple
E = Exponential
W = Weighted
Sir
How can be bid quantity more than ask quantity and viceversa? l think every buyer should have a seller,therefore buy quantity equal to sell quantity.
For a trade to happen buyer\’s quantity and price should match the seller\’s. But otherwise, there is no need for the quantities to match.
Hello sir,article is only available to subscriber of Business line, kindly post it in varsity.
http://www.thehindubusinessline.com/features/investment-world/market-watch/sold-for-a-penny/article7216585.ece
I think it\’s a free artcile.
Is it possible that buy rows shown only.
Sorry, dint get that.
Sir, same stock listed in BSE and NSE can create different types of candlestick pattern?
Here HINDALCO on 30 March 2020,
In BSE created RED candlestick-https://www.tradingview.com/x/jEvri10M
In NSE created Green candlestick- https://www.tradingview.com/x/wWhX0s91
Is this differences are normal sir?
Not really, but I\’d suggest you take the exchange where the volume is high.
Sir Please clarify,While drawing average line on volume bar, we should draw a SMA OR EMA??
In comment one place you told SMA and in another place EMA.
—————————–
Your comments
Karthik Rangappa says:
June 21, 2017 at 4:46 am
1) I generally prefer SMA
Karthik Rangappa says:
March 2, 2018 at 11:38 am
I personally like the 10 days EMA on volumes.
Sorry, I mean SMA 🙂
Thank you sir
***Reffering the chapters fictional Example of volume***
Karthik sir,
If i\’m watching EOD volume bar of the above example i will see the cumulative volume of the day i.e 3,300.
In the above example Around 3.30pm highest number of shares are bought/sold i.e 800 at 64.50 RS.
\”Is it possible to know in \”WHCIH PRICE POINT HIGHEST BUYING/SELLING\” happend?\”
I saw some people using something like volume profile/ Market profile tools to find that…
Is it necessary. what is your opinion sir?
You can look at the 1-minute chart to identify this. Look for the highest price point in 1-minute chart and you will know when the trade happened.
Hello sir …the teaching which you are giving is priceless….thank you for helping…I just wanted to know that ..how to apply or see volume bars in trading view chart on bank nifty or nifty or on any stocks … please help ….thanks again
Thanks, Vishal. I\’d suggest you call the support desk for this. They will help you over the phone.
and yes I am talking about the candlestick patterns forming near support and resistance
Got it, please do check my previous comment.
hello sir,
there have been many instances with me when I have recognized a very good buying opportunity (a very clear candlestick pattern) but did not take it as the volume was not above the 10-day average volume.
I have seen those opportunities when there is a very clear Candlestick pattern which is a good signal for me but I did not take it as the volume didn\’t confirm.
Sir, please suggest what should I do when I come across this situation next time as I do identify the opportunity but the volume does not confirm.
I understand, so whenever you see a very compelling trade, but one of the factors don\’t comply, then you can still go ahead a take a trade but ensure you trade a much smaller quantity. YOu can do this for few trades and then take a call on how to deal with it.
Hi Sir,
How about PMS Managers buying and selling ?
Regards
Deepak
Via a trading account, just like the way you and I do.
Hi karthik,is it important to check deliverable along with price and volume for the market expectation??
Not really, Muhammad. It is ok to skip that part.
Hi Sir,
If you meant block deals are off the market transaction – how do you spot this in volumes in chart analysis ?
Are all spike in volume shown in daily graphs from retail investors only ?
Can you suggest any website – which shows – the daily buying and selling of mutual fund managers and PMS fund managers,
I understand if you search bulk or block deals in bse/ nse / monecontrol etc- you get some data – but not all data of these fund managers buying and selling.
This get reported in the daily market volume, Deepak. Daily buying and selling of MF are not disclosed, as its reported once a month.
Please help me with some videos to understand the topic
Noted, hopefully soon.
how to track the nifty 50 and how options traders find the trend in nifty and banknifty because there weighted by other stock and there is no volume
The easiest way is to look at the chart of Nifty 50 and get a sense of the trend.
hii kartik sir , i m using money control site to check graphs , there in indicators there are many options for volume i:e
volume oscillator
net volume
price volume trend
on balance volume
but none of it show me volume on bar . plz help
I\’ve not used Moneycontrol, so can\’t comment on it. But this feature is easily available on Kite. I\’d suggest you speak to the customer desk about this.
Why aren\’t volume data given for various indices in the zerodha portal. We have a hard time to take note of these from NSE website or marketsmith india website at the end of day. Can zerodha too provide this data at the end of the day. Especially for all the sectoral indices too. If we have this, this would be the most comprehensive of platforms as we have candlesticks + volume data of indices for the first time in India probably on a single platform. Marketsmith doesn\’t give the traditional candlestick though it gives volume.
Prathap, indices are not traded. It\’s the futures of the indices which are traded, the futures volume data is available on Kite.
What does green and red volume bars indicate.
Volumes + price. I\’d suggest you ignore the colour of the volume.
Hi Sir,
What is the significance of Green and red candles of volume if each share sold and bought combined gives one share volume?
Thanks in advance
I\’d suggest you ignore the colour of the volume, just look at the value of the volume.
Hi Sir,
I have a question on block deal. If the block deal transacts outside the market by institutional player, we could see the spike in volume and not the price. In this case how do we conclude increase in price and volume to go long and follow the smart money?
The idea is to track the intent of smart money, if they have bought, then the intent is to hold, with a hope the prices will increase. Hence, you can go with the flow 🙂
Thanks for the modules sir, I have one doubt regarding stock picking, how to select a stock which is above the sma from NSE, there\’s is n number of stocks listed on NSE, how to select among them.
YOu can overlay this with another SMA to check for crossovers, Manoj.
The volume table of High, low and Average will that show the high possibility of institutional money flowing in and out of stock?
for confirming volume any other indicator needs to be added into our analysis ?
Usually, institutional flow is associated with higher volumes, so in a sense yes.
How many times should volume surpass the moving average line in order to be sure of the bullish & bearish trend?
At least once, Rahul.
Hi,
It firstly mentions 10 day moving average. Why 10 days and not any other number such as 5 or lets day 20?
Additionally, this pattern has to be seen on what time frame?
Also, how many times should volume surpass the 10 day moving average line in order to be sure of the bullish & bearish trend?
Rahul, you can use any timeframe to calculate the average, depends on the trading frequency. For example, I can use a 50-day average if my trading frequency is for few months…or I use 9 days for super short term trading.
Sir, Thanks for the explanation.
Considering stock price closes at 95 and has resistance at price 100. Next day if prices opens at 98 and crosses 100, say 103 within 2 hours then comparing volume of previous day to current day will definitely be low as we have more than 4 hours to trade. In this case should be compare volumes in lower time frame?
P.S: As I traded a stock based on lower time frame and on 15 mins chart volume was double the average volume and entered the trade but eventually stock prices fell and during closing day\’s volume are lower than previous day. Can\’t we trade based upon volumes in Intraday? If yes please do let me know how to do the same.
Praveen, that\’s right volume will be lower. But you can get a sense of how the market is heading looking at the 2-hour volume trend. For example, if the market has covered already 50% of volume in 2 hours, then you can be fairly certain that the volumes will surpass the avg volume.
I see, Your indepedent value is always \’Institutional investors\’ like u referred LIC. you are saying to follow the insitutonal move most of the times. If price decereases and volume too even. Are you Sure, Institutional investors do not do Intra day or Same day trading ?. are they not buying and selling lakhs of shares on intraday or day to day basis?…..
Institutions like AMCs and Insurance companies dont indulge in intraday trading. These guys have the largest funds. Trading firms do.
you might have missed impt things..
if Price increases and volume decreases . It does not always signify the \’weak hand buying\’. If you look at the concept of Upper circuit and Where sellers are not ready to sell the stock Or want to sell at higher rates, It also increases the price still, There is little Up movement in the volume…
But can you generalize this to all stocks and assets? May not be right?
in my zerodha account, i try for volume bars but could not able to fix volumes bar in chart.
please guide how to get volume bar in charts
For trend reversal which indicator to use
In candlesticks patterns itself you can find out reversals.
This is the trading volume. Delivery volume will be different and quite less. How to use that?
Delivery volume is quite deceptive. Cant depend on it much.
Sir,
I often see delivery of x% shares is taken in DMAT where x is always less than 100. But even in case of intraday, as an individual squares off position means somebody is buying the shares. So in any transaction if someone is selling, there has to be somebody buying. So ideally delivery should be 100%, isn\’t it?
Please kindly correct me if I am interpreting the terminology incorrectly. Apologies in advance, if it is foolish question!
Even the buy could be a intraday square off for someone who has shorted during the day. So these trades don\’t really count.
Dear sir,
I have query about delivery percentage.
1. How much delivery percentage is considered as significant ? Means how much threshold
2. If price is decreasing, volume is more than 10 day average and delivery percentage is increasing what it is signify
3. What is significance of delivery percentage what it indicates
4. How much is its reliability
5. Apart from price change, volume change what other factors should be look in conjunction with delivery percentage
Thanks in advance
Roshan, one cannot really rely on delivery % data as this data also includes BTST volume, which is short term in nature.
How to create an average line on the volume chart in a kite platform?
Select the field as volumes.
Juniorbees\’s chart shows Open-354.80, High-414, Low-354.80, Close-410.12 for 8th Jun 2021. However, when see chart with hourly activities, the opening value is 411.43 and during no part of the day it went down to 354.80, instead it appears the low was 407.
Am I missing something?
The hourly charts could be slightly different compared to the end of day charts. I\’d suggest you look at EOD charts.
Hi
Is Samco and Zerodha the same?
Reg, Sunil ( 9746207103
No, we are two different brokers.
If stock in Upper circuit, and there are pending buy orders, then how to know the quantity ordered (Volume) to buy?
Its not possible since the trades arent happening.
For every buy, there should be a sell. So if I buy 100 share there is some one selling. Y is the volume not considered as 200 then???
The exchange will treat this as 200, Prabhas.
How can we apply volume in the chart so as to know when to buy share ie at what point of time we need to buy share according to the volume.
When you drop down the MA from studies, select the field as the volume instead of price.
Hello Sir,
For intraday trading which wold be the best MA period for volume analysis. Usually I see larger volumes around 9:15-9:30 or 3-3:15 PM. Does this mean that we should avoid intraday trades if vol MA(for ex 50 MA vol) is above current vol?
I could generate profit obviously loss too when i do intraday with vol below 50 ma. Pls recommend a vol trading setup for intraday.
Thanks!
Try the 9 and 21 MA cross over, based on the results you can improvise.
As explained in the volume table row no. 3 it said that when a price is decreased and its volume is increased how is it expected to be bearish if the volume is increasing..?
Hmm, the logic is explained in the chapter itself, RObinson.
Hi
How to draw a 10 day average volume line.
Please select the moving average from the studies drop-down menu and use it.
How can we set MA and SMA on mobile kite aap
You just have to load it via studies, Ajesh. Please call the support line and they will help you with it.
Sir, I am unable to find average volume indicator in Kite, please help me or suggest any alternative way on the same app.
I\’d suggest you call the support, they will help you with it.
Thanks Sir
Good luck!
Sir,
in this lesson we know that we have to take last 10 days average volume to consider high, low & average volume. But in zerodha app when I am trying to put MA on volume bar (like u told), in pop up in period column it is by default it is taking 50. So my question is what is this 50. Is it showing last 50 days average volume? please let me know. Then how can I get last 10 days average volume?
YOu need to change the value from 50 to 10.
Does volume in equity volume chart, shows the data including the transactions of future trading?
No, both have different volumes.
What do you mean by recognizable candlestick pattern?
A candlestick patter that one can recognise, like a Marubuzo or doji or bullish engulfing.
I want to ask, as we have kept criteria of 10 days average volume to determine above average volume(to know involvement of smart money). Shall we keep 10 days average volume for all stocks / sector?
YEs, that works, Roshan.
Dear sir, I have doubt about 10 days average volume.
Is the 10 days average volume is same for every industry shares? Or it is 15 days / 5 days depending upon shares. Thanks in advance.
Not sure if I get your question fully. The average volumes change for every stock, it won\’t be the same.
Karthik sir, Is Color of the Volume bar Matters?
Most of the time color of the volume bar is same as candlestick. but in rare situations volume bar have different color than candlestick.
here is the example for color difference between calndlestick and volume bar
https://drive.google.com/file/d/1Z1RagZnNmwlQiuCnttM4xW_emAQVm_Fs/view?usp=sharing
sir, please clear my confusion.
Not really, I usually tend to ignore the volume colour.
Sir how would you interpret that volume is decreasing but percentage of delivery is rising with decrease in the price ??
probably, weak hands getting out of stock, hence the low volume?
What do you mean by a decrease in volume? As written in the text, the volume is calculated cumulatively, so however much small the volume of trading, the total volume should increase so why are you suggesting a decrease in comparison to the last 10 days\’ moving average?
Volume can vary on a day to day basis. For example, the volume can be less on a dull day.
Why 10 period moving average for volume is being taken?
To get a perspective on how the volume is moving over the last 10 trading days.
Wow, how did I not think about it. Thank you sir. It really helped.
Good luck, Nikhil.
I mean increased volume activity in the last 10 days, sir.
Got it, Nikhil. Please check my previous response.
Sir, suppose there has been an increased price movement in the last ten days, so switching to 10 days over 20 wont give me a clear picture of the recent data? Your thought on this, sir.
But the increase in recent 10 days will anyway be captured in the 20-day average as well right? Yes, I agree 10 days will be a lot more reflective of the increase.
Sir normally we view 20 days average of the volumes, if I were to set it below that what should be the requirement? Faster price movement?
You can opt for 10-day avg, but why do you really need to do this?
Hi Karthik,
I have read through the candlestick patterns.
My doubt is can these patterns be used in zerodha streak?
for backtest or in live trading
Or we will have to sit and analyse charts ourselves.
I don\’t think you can backtest CS patterns on Streak. I\’d request you to please check with them once.
Thank you, sir.
Good luck!
Sir, what is your take on volume candlesticks? I personally find it vague.
Yeah, I\’m not too comfortable with it.
Sir, by looking at a high volume doji is it fair to expect a uptrend?
No, on its own doji does not convey much info.
Wow, wonderful sir, I am understanding it now. Sir but a high volume doji is better than a low volume doji?
Yes, higher the volume, better 🙂
Sir, I meant how can a doji be formed when there is such good volumes? Should I deduce from this that not all. High volumes lead to a price hike?
Thank you.
High volume trade in a tight range 🙂
Yes that\’s what doji indicates but higher volumes means the candle become bigger, right? I need your explanation on this sir.
Not necessary. The candle can be short but still have a high volume. This happens when there is a lot of buying and selling within a tight trading range.
And a high volumed doji indicates buying pressure or selling pressure? Thank you.
Neither, since doji conveys indecision.
Sir, is it possible that a doji has a high volume?
Yup, entirely possible.
Hi Karthik,
Thanks for all the efforts made by you and your team for such an excellent write up.
I have added volume as underlay and now I want to draw a 20 day moving average on this (underlay) volume as underlay. Is it possible in kite?
Thanks,
Soubhagya
Yup, select the field as the volume when you pick volume. Do call support for this and they will help you with it in case of difficulty.
Hi Karthik,
How to identify block deals in zerodha kite?
Not possible for now, Varun. Most of the block deals are off market.
Dear Sir,
If there is increase in volume alongwith increase in price, however if there is no increase in delivery % (mostly volume surge due to big institutional traders which square off their position on same day), then should we consider it as bullish pattern and take position?
Or while taking position based on smart money, we must watch out for delivery volume as well?
I\’d suggest you don\’t look at the delivery %, it can be misleading. The delivery % includes trades done on BTST basis as well.
Karthik sir, I jus wanted to thank you.U hv explained complex things in such a lucid way that when i start a chapter can\’t stop without finishing it big thanks to u.
Happy to note that, Jeetu. Happy reading!
Ok, karthik ji. I just wanted to let u know that you have been doing quite a phenomenal job helping us. I earnestly request u to continue doing this. Thanks a ton.
Will do, thanks for the kind words 🙂
No karthik ji, I understand prices n volumes increasing is definitely a different trend evolving but deceased price and volumes could signal a new momentum building,right?. Can it n
not be construed like that? I hope you r following me.
Thank you.
Perhaps, Nikhil. I\’ve never thought about it on these lines. Need to spend more time on it.
Wonderful suggestion. Hmm don\’t mind but I hear people saying it sometimes could mean a shift towards a price hike. You don\’t think so?
Thank you for all the help, karthik ji.
Hmm, not sure how. If there was action, volume and price should both indicate.
I just thought this actually signifies a change in trend ahead.
Thank you.
Ok, then what should my position be when both volumes n prices are down? Both volumes n prices down signify lack of stock movement?
Thank you.
I\’d suggest you take cues from the candlesticks patterns which are the representation of price action.
It was a good explanation, karthik. Just one doubt. If the price is decreasing n volume also decreasing, does this mean the buyers are about to take charge?.
Thank you.
Not really, if that was true, then volume should also increase.
Hi Karthik
What if the trading volume increase but the price remains stable?
Consider it as consolidation at the price.
Is there any way to identify smart money move? Because by the time we see bulk orders from any site at the end of the day already price would go up or down? How to identify when institutions punch bulk order? Is there any source we can refer live data?
Once bulk order punched, generally how long the rally would continue?
This is tricky since bulk/block orders are off-market and gets reported by EOD.
How can we identify volume is more on buy side or sell side
For ex: some institution buy 100000 hcl shares and another institution sell 200000 hcl shares at price of 845. How to interpret this? There is 100000 difference.
Plz explain little confused
There cant be a difference. Remember 1 sell against 1 buy is when a trade will go through.
Hi Karthik,
I was observing the day chart for ICICI bank today at 12:OO PM. In the bottom where you show OHLC, total buy quantity was around 10L and total sell quantity was around 19L. However total volume was around 1.77 Cr. Shouldnt it be the min of buy and sell? How come volume is so much more than the buy and sell quantity?
The buy/sell Qty is for the moment, keeps changing as and when demand-supply situation varies. The 1.77Cr is the cumulative volume of the day.
Hello. Can you please explain how we can chart a moving average line on the volumes chart on kite desktop? I found an average line but it seems to be a simple average one, instead of the moving average curve that\’s depicted here.
I\’d suggest you call the support for this. It should be easier to explain over the phone.
I am unable to draw ma line on volume chart. please guide.
Request you to please call the support line for this.
Sir, while planning for swing trade, to check volume whether should I open daily chart or hour, minutes chart ?
I prefer daily volumes.
Respected Sir,
First of all I am thankful to you.
My question is, Does sectoral indices trend is important or not?
means I heard something like, When there is trend in sectoral indices one should not go against the sectoral indices while taking stock from respective sectoral indices.
Excited to hear from you….
Thank you.
Respected Sir,
First of all I am thankful to you.
My question is, Does sectoral indices trend is important or not?
means I heard something like, When there is trend in sectoral indices one should not go against the sectoral indices while taking stock from respective sectoral indices.
Exited to hear from you….
Thank you.
That matters too, for example, there is no point shorting a stock which belongs to a sector which is trending up.
Valuable lessons
Dear Karthik,
Thanks for the useful guide. it is really helpful and easy to understand.
I have one doubt, The volume graph has either red color [for selling qty] or green color [for buying qty] but how it is decided that at the end of day or on any other time frame it would be green or red ? is it plotted on the basis of number of buy or sell qty!
let suppose A sold 100 sh and B buy 100 share than volume would be in green or red?
Could you please refer any good book for technical indicators so that i study advance level of technical analysis [just like you explained in simple language]
Regards,
Shubham Bajoria
I\’d suggest you ignore the colour of the candle, it does not matter. Look at the magnitude of the volume along with its average. Draw conclusions based on the average volume over the last 10-12 days.
Hi Please suggest, how to place moving average on volume chart in Trading view
You simply select volume as the indicator, Gaurav.
Hi Kartik,
Does volume factor really matter in Intra day trading ? A smart investor may not change his mind in every 15 minute right ?
Regards
Ishwar
YOu need to consider the previous day\’s vol to figure what is happening, more from a holistic approach.
Hi Sir, I am new to market and I have heard and read at multiple places that operators are making some stocks move up and down. Is there any way to identify whether an increase in the volume is because of smart money or operator\’s money? Pls suggest.
You will have to follow TA for this. This usually happens in stocks which have low liquidity.
Hi Kartik ji,
Good Morning. Thank you for your Step by Step guide and explination.
Kindly have a look at the attached picture.
https://drive.google.com/file/d/1Dc8cA19eK5ZSa8vi8p0Y9va5lsSEteVI/view?usp=sharing
(1) The volume on 28th Sep is 1.1 Million. How to find out Average volume of last 10 days ? if you hover mouse over red line it doesn\’t show any number.
(2)Why simple moving average of volume displays over share price candles instead of volumes? I don\’t think we can drag and drop it over volume.
(3)Whats the significance of SMA of Volume moving above the share price candles ? I mean what is the co-relation between volume/SMA line and Share price candles ?
(4) I beleive the Y axis for SMA Volume and Price candle is different so how to make conclusion ?
Regards
Ishwar
1) You can drop an SMA line on the volumes itself, that will give you the average volume for x number of days
2) You cant drag and drop, but you can choose to drop the average on the volumes directly
3) You need to match the volume with the share price to get a perspective. On its own, the volume offers very little information
4) If its two different panes, then you will get two different y axis.
Dear Karthik
Can you suggest how to identify break out in volumes using candle stick pattern, is it size of the candle stick or is there any indicator to identify it.
You will have to match both the price and volume to identify breakout, just by volume itself is not possible.
How to find Europe market movements to get affect on Indian market please reply ?
Meaning? All markets are interconnected, with each one bearing influence on the other.
Hello sir
I want to set volume with its average on my zeerodha aap
Plz guide me to set it
Thanx in advance
Amit, I\’d suggest you call the support desk for this, they will help you with it.
Hi,
In the kite chart volume profile is coming left side how can change down side there is any option for that
Down side? Are you looking at just volume or volume profile? Its its volume profile, then I dont think the position can be changed.
Hi Karthik Sir,
Can you plz tell me the volume bar we see on the chart of any stock shows the volume of deliverable shares or just shares traded until that time (not taken delivery).
No, these are just traded shares.
Volume Price Indicator is not there at Zerodha?
Are you talking about this one? – https://tradingqna.com/t/how-to-use-volume-profile-charts-on-kite/4213
Want to see live volume counts on each volume bar on .
Selected volume profile–on y axis we will red colour horizontal bars for each price.I want to see live volume count on each bar. Is there graph available in kite for this requirement?? Please help Karhik
Nagappa, I\’m not sure if this is possible.
Hey Karthik,
Request you to answer my below queries :
1. What is ATR (Avg.true range)
2. Does bulk deal affect EOD volume and price of a particular stock ?
3. Does block deal affect EOD volume and price of a particular stock ?
4. While drawing SMA line on Volume bar, what should select in following column –
a. Value in offset column ?
b. What should enter in panel column ?
c. Show as underlay or not ?
d. What should enter in Y axis column ?
Thanks in advance.
1) ATR is explained in this chapter – https://zerodha.com/varsity/chapter/supplementary-notes-1/
2 & 3) Not really as these are off market transactions
4) Offset – 0, keep everything at default.
Is there any rule that a 10 day average for volume should be considered before making a trade with the other checklist?
I am not able to understand what would be benefit 20 day average is used instead?
There is no such rule, Dinesh. You may as well use 20. The idea here is to ensure that today\’s volume is higher compared to the last few days average volume.
Sir, using the trading view application and i am not able to Plot the moving average line on the volume bars for the 10 Day Avg. volumes. So, please help me out with this and are there more volume indicators that i can use?
Mohit, this is easy, why dont you call the support desk, they will help you with it.
Hi ,
Thank you for creating a resource of information presented in a manner which is easy to understand even for beginners. I have read a lot of blogs here and there, but i dont have any specific blog in mind for reference. But I always have Zerodha Varsity. This is the 3rd time i guess i am reading, as I dont remember. I liked it.
When we say, sellers are selling o the prices are falling, or buyers are buying o the prices are rising. But why do we say this way statement. When Sellers are selling, there are buyers who buy. So what is the logic behind saying ppl are selling so prices falling, etc.
Thank you
Happy to note that, Kiran!
The thing is that the sellers are selling at any given price, they are not being demanding in that sense that they want to see at a particular price only. They are selling because they want to get rid of it. Like wise when buyers are buying, they buy at any given price, with the objective of just buying. Both these situations lead to one way price movement.
If the pattern is a hanging man and the candle is red candle, in volume chart the candle is showing in green colour and it is below 10 day SMA. For shorting the stock should volume be higher or lower.
I\’d suggest you ignore the color of the candle, but focus only on the magnitude of the volume. Ensure the volume is higher than the last 10 day average volume.
Hello karthik,
Great articles and very much helpful for self learning things
May i know what should be the period for Moving Averages, the default period that comes is of 50. should i change it into 10 as 10 days comparision is considered as wisest option ?
Yes, please change this to any value that you think makes sense. I generally prefer the 9 day over 21 day MA when look at EOD charts.
01 9:30 AM 400 400 62.20 400 400
What if buy 200, sell 400 , what is the cumulative volume here.
Sorry, this data is not clear. Can you give more context?
Hi sir,
In the above chapter it is mentioned \’volume decrease\’, what does that mean?
Is it implies less volume compared to average?
That right, it implies lesser volume.
If i\’m a risk taker, what\’s the best time for me to buy the stock? at the closing of P2 (after confirming the support, candle pattern, and volume)? or at the opening of P3?
Yes, the closing of P2 is what you need to target.
hi sir. im from phl. let\’s say the P1 and P2 formed a bullish engulfing candle pattern. the low of the candle is around the support. and the volume on P2 is higher than the 10day volume.
what should be my indicator on P3 to buy the stock?
should I wait before P3 volume hits the P2 volume?
Or should I buy it (at the opening of the market) even though I dont have any idea on what will be the outcome of Volume on that day (P3)
Best case is on P3 close –
1) It is a bullish day, so P3 close is higher than P2\’s close
2) P3 volume is as much as P2
3) P3 close is not too far from the support and P1 low.
Sir My question is how to identify that volume is increasing or decreasing over certain interval of time. (Like 30min or 1hr)
You can plot a simple SMA over volume.
Thanks Sir For Great Efforts for Great Contents.
Sir I have just one question that how can I use volume indicator for intraday trading. So that I identify that volume is increasing or decreasing.
You need to develop a generic view on volume. You can do this by plotting the 10 SMA over EOD volumes. If today\’s volume is higher than 10 days AVG, then its considered high volume.
Should we also trade (swing trade) in all nifty 50 stocks whose avg. daily volume is less than 10 lacs ?
I\’d avoid low volume stocks.
Which moving average to use for volumes when lower time frames like 5mins and 15 mins are used? 20, 50,100 EMA which one to use?
In my opinion, I\’d suggest you use 10 day SMA for volumes.
Hello, Karthik sir
I am writing this comment because it is very much important to appreciate your efforts. I recently developed interest in learning about stock market, i was scared at first because it seemed so vast. But the way you have explained it here it feels easy and very interesting .
Also the way u have put it together, awesome….. the language is simple to understand. Words wouldn\’t be enough to explain it all but i really appreciate your work and thank you for that . I see you as my MENTOR sir. Thankyou, very much. 🙂
Very happy to note that 🙂 I hope you continue to read and relate to the content here. Happy reading!
hello sir , Sir sometimes i observed that price candle formed is bullish but the volume candle following it is bearish , why ?
I\’d suggest you ignore the colour of the candle itself, Rajat. Look at the candle + how high or low the volume is compared to the previous candles.
Hello Karthik
I only trade in Index. The past few days I have noticed that even after confirming the trend with the volume BN have been reversing after giving a bullish or a bearish signal. For example, the price increased and there was above average volume which indicates institutional player but still after giving a bullish signal with the volume confirmation BN reversed after that.
This rarely ever happened in the past 3-4 months but this is happening a lot these past few days.
Can you explain me what might be the reason for this?
Well, it is not only hard but nearly impossible to lay down a rational explanation for these things. Uncertainty is the name of the game 🙂
Sir
The volume is calculated when buyer and seller both have transaction.. my doubt is that why does some of the stocks,in which there are only buyers or only sellers, show volume even though there is no transaction happened in them..
Sir, In case of doji and spinning top, volume again should be minimum equal to or above 10 days average volume quantity.
Higher the better, Rajat.
Is volume also important for intraday at 15 mins candle ?
If yes, should I use 10 period moving average on intraday 15 mins chart(like you stated for daily chart) or some other moving average ?
For intraday, you can give the volume a bit of less importance Hemant. The bulk of the focus should be on the price action.
Sir, Zerodha provides pivot points option for finding out support and resistance. Is it reliable or I should draw it by own.
I personally prefer to draw it on my own. Anyway, the calculation is accurate, to use it or not is dependent on you.
sir, when looking at the volume (10 day moving average line) confirmation after candle stick pattern confirmation. For long/buying, volume confirmation should be green or red also fine. Similarly, for short/selling, volume confirmation should be red or green also fine.
I\’d suggest you ignore the volume bar colour, look at the volume to be higher or lower than that average. This will suffice. The colour does not really matter.
Hi Karthik, As you said volumes indicate how many shares are bought and sold over a given period of time. The more active the share, higher would be its volume. if I\’m a day trader, how would I know whether the stock is trading in higher volumes say at 12pm?
You can always look at the average historical volume and take a call based on that.
Hi Karthik,
Thanks! So the volume chart is not a volume of quantity traded as we read in the varsity document above? I was reading the volume bar as for example: Green bar means more quantities traded and price is up, and next volume bar bigger than prev green bar means even more quantities traded and price further up. Then if next volume bar is the biggest so far and red, it means highest quantities traded and prices are falling due to sell?
Can you kindly clear my doubt? How is it related to candlesticks as you explain above please? One more time, sorry!
Kalpesh, I personally don\’t like to associate any colour to the volume. Look at the volume as a number. If today\’s volume is higher than last 10 day\’s average its high volume, else low. That\’s about it 🙂
Hello,
Thanks for a simple explanation of markets terms and experience.
Could you please clarify, for volume chart on Kite page it has 2 bars Up volume and Down volume. When it says Up volume does it mean buyers volume more than sellers hence green bar. And when green bar lowers it means buyers volume coming down. Similarly, when it says Down volume does it mean sellers volume more than buyers hence red bar? and when red bar comes down it means sellers volume going down?
Thanks!
Kalpesh, red volume bar means that the close (LTP) price of this candle is less than the close of the previous candle, and the green volume bar means that the close (LTP) price of this candle is equal or higher to the close of the previous candle.
Thank you Karthik.
Welcome!
Hi Karthik,
What did you meant by \”split your orders across few trades\”
Are you saying that I will have to split the 10000 shares of a scrip into 2000 shares per trade thereby placing 5 orders in intraday?
or 5000 into 2. Check this – https://support.zerodha.com/category/trading-and-markets/margin-leverage-and-product-and-order-types/articles/what-does-the-error-rms-rule-check-freeze-quantity-for-fo-including-square-off-order-mean
Hi Karthik,
I have few more doubts,will be glad if you can give some clarity to it.
1.Firstly,does the colour of the volume bar represents bullish/bearish signal?
2.Secondly,do we need to plan our trades according to the index ..for e.g. if the bank index is on negative side so do i need to place a sale order for the scrip e.g. SBI bank or we can place the order according to the candle stick pattern of the scrip chart and Bank index ?
3.I have noticed that in MACD indicator if it is showing a buy signal but in scrip charts the candle stick pattern shows a sell signal then what should be the call from my side?
4.And lastly,How many shares can I buy/sell for placing an order for a scrip ,I have heard that if we place order for larger quantities like 10000 or more then I will incur losses as there could be manipulations as placing high quantities might get highlighted and eventually my order may get noticed?
1) No, look for the candlestick instead for bullish/bearish signals
2) If the index and scrips are aligned, then the odds working in your favour is higher
3) Go by the candlestick
4) You can buy as many as you want, ensure u split your orders across few trades.
Dear sir,
1. is it right to trade with that stock which influence by institutional investors.
2.is that correct that goverment use lic for speculate in market.
1) Not sure what you mean by this
2) Nope, not true.
Thank you Karthik for your guidance
Good luck!
Hello,
Firstly thank you for this wonderful delight for beginners as well as versed trader. The modules are quite easy to understand and immensely helpful.
I just have a doubt regarding placing an order, Assume there is no recognisable candlestick in a downtrend but the support is near the low of the last candlestick and the volume confirms the trade (in favour), but there is a doji slightly breaching the support level in the next candle, so should one still take a long position? and does this mean the support might not be honoured?
Thanks, Deepankar. I\’m glad you liked the content.
No harm initiating a trade, perhaps with half the quantity and a tighter stoploss.
Thank you Karthik.
I have a doubt in this scenerio,assuming in a 15 min chart a hammer pattern is formed after a downtrend and also volume has confirmed for a trade and in the next candle I placed a buy order as it looked like it was going to form a green candle but at the end of 15 min a doji/spinning top pattern has been formed and the volume didn\’t cross over the 10 day average then what should I do?
Volume once formed cannot retract, but the candle can, which is exactly the problem if you are trying to place a trade on a developing candle. Hence it is best to look at the candle which has already formed.
Thank you Karthik for your response however can you let me know how to identify highly liquid stocks .As you have mentioned in one of your chapters that those stocks that crosses the 5 lakh mark volume are liquid stocks so can those stocks be termed as highly liquid stocks?And secondly are the colour of the volume bars signifies bullish and bearish sentiments?
The easiest way to identify the a liquid stock is to look at the bid and ask prices and the difference between the two. Higher the difference, lower is the liquidity and vice versa. Start by looking at a RIL or Infy, these are highly liquid stocks, then compare the liquidity of the stock you are interested in, this will give you a perspective.
Hi Karthik,
First of all I would like to thank you for all the knowledge that you are giving us regarding trading and honestly I am learning a lot.I have few doubts and would be glad if you can give some clarity to it.
1.As I have started analysing intraday trading I found out that If I want to place buy/sell order by observing volume bar which is above the 10th day average on 15 min charts but the pattern is yet to form on candle stick,so should I wait for the pattern to form or just place an order at the time when volume crosses the 10th day mark?
2.Secondly for placing an buy/sell order for intraday should I place Market order or a Limit order?
I have also observed that on 15 min charts the stoploss is usually thrice i.e 1:3 so in order to make 500 bucks I need to put a risk 0f 1500 rs.Whereas on 5 min charts the SL are quite less?So can you please suggest which one I should go for it?
1) Pattern leads the volume, hence your trading que should come from the candlestick (which is essentially price action), the volume is a supplementary add on
2) A market order is fine for highly liquid stocks/index, otherwise, limit order.
Hello,
Volume increase will happen when the transactions of institutional investors have already taken place. Which may mean that the price of the stock is already influenced due to these transaction. Then is it not that we have already missed the opportunity? Please clarify
Thanks!!
True, but the expectation is that because a strong hand has entered, it would attract more buyers, hence the rally will continue.
Again, Thank you for the reply Karthik.
Just one more thing that will I be plotting a simple moving average on the volume chart? or the exponential moving average on the volume chart? (or any other that you would suggest)
(P.S I AM ASKING FOR THE VOLUME CHART)
Thank you, again.
A simple moving avg will suffice.
Thank you for the quick reply.
I just trade Nifty and Banknifty and I plot the moving average on the VOLUME. So I\’ll have to plot the volume on the Banknifty/Nifty futures and then place the simple moving average on the Banknifty/NIfty futures. Right?? (As we don\’t trade in the Index)
Please correct me otherwise.
Thank You
Thats right, only for the index though.
Hi Karthik,
Can you suggest me what time period should I use for the MA on volume chart for Nifty and Banknifty futures?
I am getting confused as these expire every month and I can\’t figure out how much days to take into consideration for that current day\’s volume?
Should I compare today’s volume over the average of the last 10 days volume for confirming the as you mentioned above or should I take more days into consideration? If more then how many days? (P.S I am specifically asking for Nifty and Banknifty Futures)
Thank You.
You can look at the 10-day volume for this, on the underlying and not on the futures itself. Remember, your analysis should be on the spot for you to take action in derivatives.
Thank you
Hi Karthik,
As a risk taker trader we have to check the volume for previous day & as a risk averse we have to check the volume for present day. We have to wait till the volume bar reaches the moving average line to take the trade….is that correct sir…???
Thank you.
Thumb rule is to consider the volume for days you\’d take action.
Hi Karthik,
Kindly let us know from which website the screenshot of volume data on 5th of Aug 2014 has been taken .
And also which volume indicator is best for intra day trading
I\’d suggest you use Kite for this, Tapas.
Thank you sir…☺️
Welcome!
Addition to my previous quires…as mentioned in the module
As a practice, traders usually compare today’s volume over the average of the last 10 days volume. Generally the rule of thumb is as follows:
High Volume = Today’s volume > last 10 days average volume
Low Volume = Today’s volume < last 10 days average volume
Average Volume = Today’s volume = last 10 days average volume….
In rule of thumb… today's volume is cumulative volume…???…if yes then do we have to wait till the volume bars reaches the moving average line to take the trade…???
Yes, its the end of day volume.
Hi Karthik,
Please confirm is this the right example for high and low volume…
1. SMA for 10 days from 05/05 to 05/18 is 53.10 ( AVERAGE VOLUME )…on 19/05 volume is 74.75 EOD…on 20/05 cumulative Volume is 30.1 during market hours…is this consider high volume on 20/05 ???
2. 1. SMA for 10 days from 05/05 to 05/18 is 74 ( AVERAGE VOLUME )…on 19/05 volume is 53.10 EOD…on 20/05 cumulative Volume is 19.33 during market hours…is this consider low volume on 20/05 ???
Thank you in advance sir…sorry for inconvenience if you have to repeat it…i am newbie and started learning this…
1) 74.75 is high compared to 53.1. However, we cannot comment on the volume during market hours as you\’ll never know at what point the volume may come in the markets
2) Yes
Hi Karthik,
Please help with the example of:-
1.High Volume = today\’s volume greater than average of 10 days volume.
2. Low Volume = today\’s volume lower than average of 10 days volume.
3. Average volume = today\’s volume equal to average of 10 days volume…
Thats right.
Hi Karthik,
1. how to confirm red or green candle day as a risk averse trader ???….2. do we have to wait till the volume bar reaches moving average line to take the trade ??
You need to wait till the end of day to get a sense of the direction of the day and then take a call on this.
Thanks a lot for the prompt response – is there any other way we can use volumes to judge the strength of the index movement?
The best way is to look at the volume data along with the price. Volume on its own does not mean much.
Hi Karthick,
If I want to judge whether the index (Nifty) is moving up / down on higher or lower volumes (and hence conviction), what volume can I look at? Should I be looking at the cumulative DELIVERABLE volumes of the 50 stocks making up Nifty50 (derived from stock-wise volumes sheet on NSE)?
Thanks in advance.
Hmm, I\’ve not used the combined delivery volume of the stocks as an indicator. Not sure if I can comment on it without using it 🙂
If market moves on the basis of \”Demand and Supply\”, then what causes the market to have gap openings? Similarly there are no trades taking place during the market pre opening, then what causes the market to fluctuate ?
Demand and supply again 🙂
Dear Sir,
After applying MA over the Volume chart for average 10days volume how to interpret?
The redline with value?
how to identify that 10days average volume is higher or lower than present present day volume?
Volume is high if the average is higher than today\’s volume, low otherwise.
as you said in order to compare the price with volume, we should compare today\’s volume with average volume of last 10 days but which price should be considered,, today\’s price with average price of last 10 days or any other???
Today\’s price + today\’s volume (compared to the last 10 avg volume).
Hi Kartik,
I used to see the volume bar graphs below the actual chart in the chart view of a stock/option in Kite. But now I seem to have disabled it somehow and can\’t seem to find it in \’display\’ dropdown menu. Could you please guide me as to how to enable it again?
Thanks
Load volume from studies and specify that it is not an overlay on the price but rather a separate overlay. You can do that in settings. This will help.
hi karthik sir,
how can we apply the concept of volume in derivatives maket?
in respect of buyer and seller and option writing and buying.
Yes, but also look at OI along side for F&O.
Hi Karthik
One of the checklist item recommended is, validate our POV with the S&R. I presume if it is futures and options, you have suggested to map S&R based on 3-6 months daily data. How would you suggest that we identify S&R for intraday trade? what is the appropriate period data we should be analysing?
For intraday look at the 10 mins candle for at least 5 trading sessions.
1. how can we apply the concept of volume in derivatives maket?
hello sir,
Is there any use of relative volume in technical analysis. if so where can i find it in Kite?
Thank you.
Ah, you will have to check in the studies, Rahul. I\’m not sure about this particular one.
For example
On 24th April, Nippon India Life India asset Management Ltd. reached its lowest value in this month, and the volume increased to 13.65 million from an last 10 day average of 2.77 million.
Yes, like I said you have to look at both price and volume in perspective.
Hello sir
With reference to section 121.1, when price reduce and volume increases, the expectation is Bearish. But according to Dow Theory (in accumulation phase) this is the point where \”smart money\” comes into play. How to differentiate the volume is increasing due to selling or buying.
We cannot hence we associate the price to draw some inference on the price movement.
Dear Karthik Sir
According to checklist rule no 2 low or high for Stop-loss must be near by support or resistance price zone
But if low or high is not near by support or resistance price zone ,and other conditions satisfied,like identify candlestick n volume increase etc what should we do? Even though should we consider lowest low or highest high as Stop-loss as recommended in candlestick patterns . In reference with P1 n P2
It depends on a case to case basis. Do look at the chart, market condition and take a call, Hitesh.
Dear Sir,
Could you please tell a min volume that shows the presence of an institutional buyers?
Unfortunately, that cannot be quantified, Saurabh.
Thank you Karthik… Does the kite have any tools… Like febonassi retracements calculations etc., … Let me know… Thank you…
Yes, all of it is there in Kite.
Can you please let me know how to set up volumes moving average in Pi software… Screen shot may be appreciated well… Thank you
Vaka, its been ages since I used Pi. Why don\’t you shift to Kite? It is much better 🙂
how do we add moving average over volumes to check the 20 day moving average volumes just like in trading view
Select the field as volumes instead of price.
Hi Sir
In case of short selling, in which we sell first and buy later, what happens with volume ? Does the short selling quantity get added into the cumulative volume ? , even though there is no buy quantity
It adds up like it normally does.
I can\’t find display and studies option in chart…how to add those
Can you speak to support once, they will guide you over the phone.
Sir,
Can this volume concept be applied on week/months intervals also?
you have taken 10 day average in the example.
Yes, you can do that Abhinav.
hello sir,
where can we find average volume in kite ?
or we have to go through nse or moneycontrol for avg volume ( 5 day or 10 day ?
thank u
You plot a any period moving avg on the volume and you get the avg of the volume.
Sir
You said that institutional money is \”smart money\” since institutions are considered wiser than retail investors. I would like to draw your attention on Nirav Modi – PNB scam. At that time, in PNB, the major investor was LIC and after the Nirav Modi episode, PNB stock prices nose dived which incurred huge loss to LIC. In this situation, would you consider that institutional investors are always wiser than retail investors ? More over, retails investors like Warren Buffett, Rakesh Jhunjhunwala, Vijay Kedia, Dolly Khanna and so on …… all are retail investors, much wiser than institutional investors.
Regards
You will have to look at it from an overall perspective. Yes, you will always have isolated cases like this, cannot generalize it though.
sir, Is EOD voume and volume u told us to watch ( cumalative one in upper example ) are same? if not where to find it on charts ? and does it also means during market hours the volume we see include only disclosed quantity and eod ( i.e end of the day) volume include every stock traded on that day?
Yes, its the same. The volume you see live represents the trades that happen on the exchange, disclosed qty does not matter.
Which indicator is used to display volume along with 10 day VMA??? I am not able to check this condition.
Its a regular simple moving average plotted on the volume.
HI SIR, love the way u explain…..do volume show the original volume of the stock trading for the day? means there is a option of disclosed quantity while buying and selling. so if i bought 5000 and disclosed only 1000 , the volume will show 1000 i think. or i can the opposite also , buying less and disclosing more . so how accurate are the cumalative volume on the charts? and do they include the data of every share trading on that day?
Gurpreet, EOD volumes show the entire volume for the day, even the disclosed quantity.
Hi sir,
We can download previous trading session data from NSE.
I mean to ask, how to get real time quotes in excel. Please guide me.
Real time is not possible, Raghu.
Thank you very much. I\’ve learnt something new and extremely useful for my trading skills.
Good luck and happy learning 🙂
Hi Sir,
Tutorials are amazing and very easy to understand.
I have a small doubt. How to get the stock prices in excel sheet?
You can download the same from NSE website/historical data in excel format.
Very well explained sir.
Is there a concept of fake volumes?
If yes we would like to hear more from you.
Thank you.
Nope, I\’ve not heard of fake volume, Maajid.
vol(20) 20.61 M 23.52 M.(written on top left corner of the chart) what does it mean
can you explain this also please
thanks
Vol(20) means 20-day moving average. 20.61, is the value of the volume.
Mr Karthik
volumes on chart , it is depicted by red or green line. why is it in two colors since volume is number of shares bought and sold so it should be one color. getting confused since volume is in green and above the MA line and price increasing. and somewhere vol is in red and above MA but price decreasing
also it is written vol(20) 20.61 M 23.52 M. what does it mean
can u clarify pl. thanks
Vikas, depends on the candle. If closing is high, vol bar is green, else red.
Why don\’t Zerodha provide order flow analysis chart like the Bell-tpo.
Or partner with the same and provide?
How to identify which stocks has higher number of buy bids compare to sell bids.
You\’ll have to track the market depth for this. By the way, the 20 depth feature is quite helpful in this regard, check this – https://zerodha.com/varsity/chapter/supplementary-note-the-20-market-depth/
\”You will have to select the moving average indicator and select the filed as ‘volume’ instead of price\”
When selected MA indicator and tried changing the source to \”Volume\” but that option is not available both in Zerodha and in TradingView. Am I missing something
Let me recheck. Meanwhile, next to the Volume (top right), click on the settings icon and select show MA. This should work too (on TA).
Another question on Volumes is that volumes are changing suddenly within minutes. For example, if we noticed that volumes are below 10 days average we should ignore the trade even though other checklist points are met right? But after sometime suddenly the volumes increase and we may lose a good trade and vice-versa. How to deal with such sudden surprises?
Volume changes and increases through the day. You can set up an alert on Sentinal for this http://sentinel.zerodha.com/
Hi Mr Karthik,
Trying to relate your point related to Volume i.e. \”To get the last 10 day average, all you need to do is draw a moving average line on the volume bars\”
What does it mean? Do we need to draw manually in the MS Paint or MS Excel etc or is there any indicator we can select which shows this?
You will have to select the moving average indicator and select the filed as \’volume\’ instead of price. This will plot the moving average on volumes.
I\’ve spotted it at many placed. For instance check 10 min chart of BOB on 26 December 2019 at time 13:35. I\’m seeing on the Zerodha app.
Hi,
When I used the Volume Candle chart on the app it shows Green Red and White candle. I understand green and red but what does a white candle indicate?
Where did you spot this? The colour code is actually dependent on the charting engine.
Hi Kathik,
if that\’s the case why do we need a volume chart at all if it only signifies price close higher or lower, the bar chart is doing the same right. what is volume bar chart significance here. can you kindly explain with an example..
Thank you
Easier to interpret if its colour-coded right?
As you have mentioned above:
In Kite Volume chart
When the volume is higher than the previous candle\’s volume and the price is higher – Up volume
When the volume is higher than the previous candle\’s volume and price is lower – Down volume
So what happens following cases:
When the volume is lower than the previous candle\’s volume and the price is higher
When the volume is lower than the previous candle\’s volume and the price is lower
Hi Faisal,
Thanks for the reply. but my doubt is only related to volume bar charts. so do you mean a volume bar chart is green if price closed higher than previous candles close and red if price closed below previous candle close..
Yup, thats right Praveen.
The colour of the candle is green if the closing price of the candle is higher than the previous candle’s closing price and red if it is lower than the previous candle’s closing price. It does not compare the volume change.
Hi Karthik,
Thanks for the reply. My doubt is still not completely clarified. kindly clarify..
1.so a red bar in volume chart tells, sold volume compared to yesterday.. so if we go to lower time frame for e.g 15 min at 10.30.. the current red bar in volume chart is in comparision to last 15 min bar i.e 10.15..correct me if I am wrong. This is my understanding.. a red bar in volume chart represents sold volume in comparison to previous bar..
2. so if see a green bar higher than yesterdays red bar in day chart does it implies more buying happened than yesterdays selling..
Thanks for your time..
– Praveen-
Hello Karthik,
1.When we plot volume chart it shows green and red. what doe the color signify here…
2.in the example you gave above, the volume chart is of one single color, I tried to set the color but it shows bars with green and red border.
Kindly clarify. thanks in advance..
– Praveen-
1) Its colour coded. Higher and lower volume compared to the previous day
2) It is software specific. Kite has the colour code, which is good.
Hello Karthik Which Is volume in this case Total Traded Qauntity/2 or Number of trades ??
Symbol Series Date Prev Close Open Price High Price Low Price Last Price Close Price VWAP Total Traded
Quantity Turnover No. of
Trades
RELIANCE EQ 20-Sep-2019 1,179.05 1,187.95 1,269.90 1,174.30 1,254.35 1,254.35 1,238.40 2,20,19,674 27,26,90,67,451.95 3,92,062
RELIANCE EQ 23-Sep-2019 1,254.35 1,274.15 1,281.00 1,235.00 1,236.35 1,239.20 1,249.95 98,79,751 12,34,92,37,345.35 2,18,447
RELIANCE EQ 24-Sep-2019 1,239.20 1,243.60 1,298.80 1,242.75 1,277.50 1,278.70 1,282.47 1,59,82,067 20,49,65,60,837.95 3,78,923
RELIANCE EQ 25-Sep-2019 1,278.70 1,284.00 1,295.00 1,268.85 1,280.60 1,279.55 1,284.48 83,16,894 10,68,28,57,321.35 2,13,332
Tota traded quantity is volume. No need to divide this by two.
hi sir, how can we know the maximum safe intraday quantity that can be traded in an particular stock?
Nation wants like you people sir ,I can\’t express my gratitude to you in my words,I want to touch your feet in my life
Manoj, thanks for the kind words. I think we as a team will be more than happy if you and many others reading the content here can make an independent, informed financial decision, that\’s our objective 🙂
Sir,
Is there any way to import Fno Stocks to zerodha watchlist.??
Thanks Sir
Import from other sources? Nope, thats not possible.
hi guys !
asking a basic questions, maybe it is a little silly.is there some place in zerodha where we can see delivery volumes and percentage delivery ? real time data available? thanks a lot
Udhay, while we give out the volume data, % delivery is something we don\’t publish.
Hello Sir,
I am unable to plot the \’Volume Moving average\’ in the \’Kite\’ Candelstick chart. So, please tell me how to plot it, if the facility is available in the \’Kite\’.
Thank You.
Punit, I\’d suggest you call our support desk for this. They will help you with it. Thanks.
Sir,
How do we know people are buying or selling stock on the basis of volume and price?
Note: Request to All smart trader too please keep your valuable reply to clear my doubts.
Highly expected.
Pitambar, the logic based on which people trade will never be known. I mean if that was true, then there would be no edge for anyone in the market right 🙂
Sir
I am not getting any option of volume in Moving Average\’s Field option.
How would I draw volume average line ?
Hmm, I\’d suggest you speak to the support desk, they will help you with this.
Sir,
What is the use of Market depth during day trading.
Note: Request to All smart trader too please keep your valuable reply to clear my doubts.
Highly expected.
Pitambar, the market depth gives you a sense of how liquid the stock is. This is particularly useful when you are placing market orders.
Sir,
I am new trader and so confusion in Volume and Open interest.
I think volume is a key to analyse only equity stock deliverable qty.
And Open Interest for Future stock open contract Qty.
Am i right sir.
Note: Request to All smart trader too please keep your valuable reply to clear my doubts.
Highly expected.
You are right, I;d suggest you look at just the volume for equity and not really the deliverable qty. Looking at OI for F&O helps.
Please explain differance in volume for…
Cash market and derivative (option chain) market
Volume is the same, the underlying does not matter.
Sir,
Thank you for the quick reply. Yet, I need some more guidance.
1) Should I look at Delivery% or not.
2) If I should look at Delivery% also, do we have a general rule to follow to take up a position. (Example: You say if the volumes are greater than 10 days average then it is a good indication)
1) Good to know, but not mandatory
2) Nope
Sir,
I understand that along with Volumes it is very important to see the delivery % also. Then why this delivery% is not given any importance/say in your module on \”Volume\”.
Somewhere in this blog you mentioned => 60% delivery% is good. Today I found Britania (Green Candle) volumes above 10 days average but delivery% is 42.36%. Other check points are OK. Shall I refrain from taking a position because delivery% is far below 60%. Please give a thumb rule to follow while observing Volume & delivery%.
The delivery volume is (or is supposed to) indicative of the long term interest in the stock. For example, if today\’s delivery volume is 75%, then it implies that of all the trades, 75% are delivery trades, which is good as it shows a strong long term interest in the stock. However, this data cannot be trusted because this data captures BTST trades, which is short term in nature.
Ok. Will do so. Thanks for the reply.
Good luck!
I am not able to view volumes for equity indices (nifty, bank nifty) in any time frame on Kite. I tried it on Chrome as well as Firefox, be it Chart IQ or TradingView.
Thanks
I\’d suggest you get in touch with the support team for this, Prashanth. Thanks.
Sir
Greetings
I had applied volume tool with moving average of 10. After applying tool,some Volume candle appear green & some appear red.
What does the color of volume candle signifies ?
Bharath, I\’d suggest you look up the comments section, its explained there. Thanks.
Ok , Thank you Sir .
sir ,
what is constant volume bar ? I read in some other forum that constant volume bar more helpful than time based chart
Hmm, I\’m not sure, Nitin. Need to research a bit on this.
how do we understand the demand and supply for particular stock based on volume, and is it useful to consider the Greencandl and red candle volume as separately to find trend change
Yes, you need to understand and analyse both the candle and volume.
The latest Kite does not have Volume profile (the horizontal volume corresponding to the price). I tried searching for the indicator section, I am not able to find it. Any idea if its supported or not?
Rajesh, this indicator is not available on the Trading view charting app, I\’d suggest you look at ChartIQ for this.
Q: What is the time period for the Volume Profile indicator in Kite? Is that reflecting the previous day volume or of how many days?
Ah, I need to check this Ramesh. Will get back to you on this. Thanks.
Hi,
Is it possible for a sudden volume INCREASE due to \”smart money\” SHORTING in a trade.
Yes, quite possible.
Sir thank for the reply but confusion is there becoz as bidder gets shares he replaces the offered quantity that was traded by him so Total offer quantity can be constant forever but varies y
I\’m a little confused now, can you please explain with an example, Suma? Thanks.
hi, i was checking Biocon chart it had created a new low, today the chart show bullish engulfing pattern , good volume buying and also the price have increased , but the chart didnt showed support . is it right time to buy the shares ?
The presence of support is great but is not always required. If you are convinced with the pattern formation, then you should go ahead with the trade.
Sir, one more doubt is it possible to get bid volume and offer volume on live if so where
Yes, when you click on the market depth, you can get to see the bid-ask volume as well.
Sir, just assume total bid quantity as some 100,and total ask quantity some1000. At mutually matched equal price, suppose, 10 shares bought by bidder. So bidder gets 10 shares and asked one leaves his 10 shares. Now from total offer quantity 10 shares should be reduced. And now bidder as he got shares should become seller means should be joined in offered group as he maintains some stop-loss which is nothing but indirectly gives an offer at that stop-loss price. So bidder becomes as seller, the total offer quantity could not vary, but occurs. How? Please reply sir
As and when a price is matched a trade occurs and the quantity gets traded, Suma. The same has to happen for the next set of the bid and asks.
Talking about volumes, if the number of shares bought is equal to the number of shares sold, how does the concept of bears and bulls fit into this? I mean, if number of shares bought and sold is equal, the bears and the bulls should hold equal power right?
What matters is the price at which the transaction occurs and not really the number of shares.
Thanks Karthik,
Just wanted to ask will it be possible for me to download this in an excel sheet at any particular point of time during live market.
Regard
Rohit
Hmm, maybe through PI you can, Rohit.
Hi Karthik,
Is it possible in Zerodha kite web platform to get \”Total Bid Quantity\” and \”Total Ask Quantity\” for all the stocks.
Regards
Rohit
This is there in the market depth, Rohit.
so I won\’t be able to use volume to confirm a trade using the checklist, let\’s say taken after the bullish engulfing pattern if I want to initiate the trade in the first hour of P3 as the volume will always be low at the beginning of the day
Hmm, you can always check the volume of the candle and compare it to the previous ones. This will give you a perspective.
Karthik Sir, in the first hour of any intraday the volume will always be lower as compared to previous 10 days average volume, isn\’t it so? ( I think I just missed something)
Yes, this is because the volume keeps increasing as the day progresses. So volume at 10:00 AM will always be lower compared to volume at say 11:00 AM.
Hi Nithin,
When will be session volume available as an option in Zerodha volume profile? Currently we have visible range which is very difficult to use since it keeps zooming in and out. Do you have any plans of making it available is kite or PI?
Anu, will pass this feedback to the charts team.
Also are multiple candle stick patterns valid for intraday?
How to load volume bars on the chart?
Parita, Volume bars are loaded by default on all charts on Kite. If you don\’t find it, you can add it by adding Volume under the Studies dropdown.
Thank you.
Hi,
I have a few doubts
1. What exactly should be the time frame for candlestick pattern when am looking for intraday and otherwise when looking for short term trades.
2. Can I short sell even in short term trades ( not intraday)?
1) I\’d suggest you look for at least 5 days of 10 mins chart for intraday and at least 30-45 days for swing trades
2) Yes, but futures only. Shorting in the spot is not permitted
Please tell me whether ChartIQ can we save our study using indicators? If so, how many scrips and how to save it?
Indicators can be saved, drawings are autosaved for 10 scrips at a time.
Hi,
While using Kite/Pi, please advise as to how to get the last 10 day average
onto the chart on the volume bars ?
You just have to specify the field as the volume when you select the indicator.
Thanks.
Hi Karthik,
Thanks for the content on volumes, they are very useful.
I have a query on the big bars that are either bullish or bearish.
Lets say there is a volume of 100k in one of the bullish bar, my understanding has been that the 100k volume is a combination of both buy and sell that has taken place.
Is my understanding correct, if yes is there a way we can segregate out of the 100k how much buying and selling has happened, ex say 60k for green and 40k for red.
Thanks,
Pandi
Thats right, its a combination of both buys and sells
Can Volume traded in a day be greater than total number of shares of a company(that are there for trading) . Eg. suppose a company has 1 share. And this 1 share is traded. Person A holds this share currently, A sells this to B , then B to C, then C to D. Does Volume traded in this case be 1+1+1 = 3??
Company has 1 share, 10 people bought and sold, so volume will be 10.
Sir , Ref Kite – Volume profile on Y axis , right hand side – How to use it for trading . Also how it is calculated ? Does it change with time frame selected ? Also pl share any useful link that can be used for better understanding . Thanks
Will try and put up a note on this, Rajendra.
sir, how can i know the volume continuously up from two or three days in daily chart
Plot the volumes at the bottom of the chart and you\’;; get to know the avg volume.
THANKS A LOT I HAVE DONE IT. THANKS FOR REPLY SO EARLY
Welcome!
How to load volume bars on the chart?
We request u zerodha to introduce on chart trading,,,
Placing orders with click of a mouse and adjusting stop loss, take profit, drag and dropping them with the mouse,,,
We want trading easy,,,
though we appreciate ur changes to logging in,,,
Logging in made easy does not make winning trade,,,,
The ease of placing orders do,,,
I\’m not sure what you are reffering to, but I think Kite is probably the most user-friendly platform ever created. Is there any specific issue you face while trading?
Hi Sir,
In this chapter u mentioned that while we go for long or short, we must confirm the volume . It should be above 10 day average.
For this we can use moving average.but while we use moving average it shows in candle chart and not in volume chart.how can we see that today volume is higher then 10 days average volume.
Thanks.
Sunil, to do this, when you load the volume, select the field as volume. When you do so, the moving average will appear directly on the volumes.
Thanks a lot sir.
Is it possible to translate varsity by zerodha whole blog in Bengali language?
In volumes, given in charts of Zerodha, some are green bars and some are red bars. What does that indicate? Help me with this.
The colour of the volume bar is green if the closing price of the candle is higher than the previous candle’s closing price and red if it is lower than the previous candle’s closing price.
Greetings to the varsity team to make complicated things in a simplified manner, the level of simplification is awesome. i am a fresher in the market it is easy to read the market jargons as the order of your contents, Thanks again zerodha team.
Today while reading about volume and its comments i have one doubt, clearly understood the volume color will be green if the price close above the previous day and vice versa, So what will the be color of volume bar on the very first day ? i noticed some of the stocks ,everything is in green bar., So my question is how it would be green? because there is no comparison of yesterday. Plz expalin.
I never thought about what would be the colour of the volume bar on the first day, maybe its set to green as default 🙂
Where have you observed only green volume bars? Is this in Kite? Can you please share the scrip name? Thanks.
yes sir, i am using kite only, go thorough the TCS, BHARTI AIRTEL, and BATA INDIA stocks on a Daily time frame., on the very first day the color of volume bar is green only even if the script made a red candle. thats why i was asking why it is in green color?
Must be a default setting since there is no reference to the previous candle.
Thank u sir ☺
Where we check the volume of shares & their prices of specific co.
You can do this by logging into Kite.
Ok thanks
Welcome!
Hello… Is there any way that we can put filter w. R. T volune
Like stocks with today\’s volume greater than 10 days avg. Volume
You can do that with this – https://sentinel.zerodha.com/
Hello Friends,
Candle is big with low volume bar and another candle is small but has a big volume bar both are green candles.
what does it mean and how to read whether it is a fresh position building or people are clearing position?
https://tradingqna.com/t/how-to-read-volume-bar/51250
The 2nd candle may have a bulk/block deal which is an off-market transaction, wont really affect the price, but the volumes will shoot up.
Hi Karthik!
Volume increases when quantity is traded i.e. for every buyer, there is a seller. So if volume increases with increase in price, won\’t it also mean that an institution is selling (since for each buyer, there is a seller)? In fact, it might also be the case the retail investors are showing sudden interest and an institution is quenching that thirst of retail investors, so smart money might in fact be selling.
How do you differentiate between institutional buying and selling since both have high volumes?
Also, if an institution is building a position since last 10 days, then the 10 days average would automatically be higher. This would distort the average and subsequent actions. How to go about it?
Thanks.
If the whole thing is backed by volumes, then yes, institutional investors are involved. However, its hard to figure out which side they are on unless you take cues from the price.
Yes, you also need to see the aggregate position in the stock, maybe over the last few days to figure out how the institution is building the position.
In in kite platform inside market depth.. There is showing bid and offers… If in any stock bids quantity is increasing.. Say its double the offer quantitie… Inspite of this stock price is not going up. Rather going down… Why sir… Does demand and supply theory doesn’t work in stock market….. Price of stock should go up Na… If bid quantity is greater… Plzz reply sir… This is a heavy confusion
Plzz reply sir
Hi Sir,
How to put moving average line on the volume bar as everytime I select MA its gets drawn on the candle sticks. ?
Thanks. 🙂
Select the MA understudies (in Kite) and select volume in field.
Hi Sir,
can we say that bid volume is buying volume and ask volume is selling volume?
Yes, Shyam.
Sir, there is a section \’Total\’ given beneath bid and offer section. That represents the total buy quantity and the total sell quantity I believe. So as per my understanding, whenever the selling quantity is more there should be more of a selling pressure on the share and its price should fall while if the bid total i.e. buying quantity request is more then there should be buying pressure on stock and its price should rise. But this doesn\’t always hold true. Please let me know the reason for it.
Remember, these are just order placed, does not mean they will get executed. I can place an order to buy a million shares, but in the market, only 100 shares are available on offer, then I will get 100 shares and 9,99,900 shares will remain pending!
Hey Prof.,
If that is the case, how can I determine whether there is excess demand or excess supply?
Does excess demand or supply refer to a specific price range and at a given time?
Can I identify whether a stock is in excess demand or excess supply by simply looking at the buy and sell quantities?
Yes, tracking buy-sell quantity gives you a sense of the changing demand and supply situation.
Hi Karthik Sir,
Sometimes in charts, we see a considerable difference between open and close, but the volume candle is short and conversely,
the difference in open and close is small but the volume candle is high as shown in the screenshot below. So how does this phenomenon take place and how to comprehend it?
I have highlighted the candles.
Link: https://drive.google.com/file/d/14q5cCB0sPPkTRpalPBAXWrZuviJNXj3p/view?usp=sharing
Thanks.
Think about this, stock open at 100, and I place a sell at 105 and a buyer comes in to buy this. No other trade happens after this. In this case Open is 100, Close is 105, vol is 1. Likewise imagine open @ 100, close @ 101 but lots of ppl buying and selling. This form a short candle, but tons of volume.
Ah, Yes! Should\’ve got this!
Sorry to take your time.
🙂
Not a problem!
Hello Sir,
Please see below link
https://drive.google.com/open?id=1vh4L2zU5iZ3cmDYBKl66gDxO3N-EgyC2
Here if you look at the bid ask qty for hdfc bank it is insane. I mean sellers are almost 12 lacs and buyers just 1.7 lacs.
Though sellers were huge the stock didnt fall that much as i was expecting but bank nifty did fall after 2.30 pm.
Does this mean traders have initiated shorts in hdfc and so we can expect more fall in bank nifty in coming days?
Shyam, the bid-ask that you see is quite transitory and changes every second. I would not consider this very seriously unless you are looking at scalping, where liquidity really matters.
Hi sir,
can you please tell me where to find volume price table in kite.
Thanks,
Manish
Manish, can you elaborate what you are looking for? Volume-based charts or an indicator?
Karthik sir,
Sometimes in nifty option pe/ce, Price decrease with Volume decrease, weak hand selling but pe/ce Rs.225 to came Rs.25.
My question is: Price decrease with volume decrease means bearish ?
This means the market has cracked quite a bit, hence this is the effect of the delta.
Sir/Madam,
How to draw the last 10 days average volume line in the volume panel in PI software?
Open the chart and select the Day timeframe.
Under Study, select Simple Moving Average. In the popup menu that will open up, under Source, select Volume from the drop down.
Once the average line is added to the chart(replacing the candles). Click on the line and drag it to the Volume panel.
thank you sir, helped a lot
Hi Karthik Sir,
Today, on the AdaniPorts chart, there was a candlestick, open and close and the difference between the two was that of Rs. 2.45 however, strangely, the volume showed zero. Does this mean that trading in that particular stock didn\’t happen for the day? How can the volume be 0 and still there would be a formed candlestick?
Chart: https://drive.google.com/file/d/1Z0ZoDT2Wech-9P74R0_omzFilm3Um2q5/view?usp=sharing
Can you please check this again, Apurva? Thanks.
Sorry, I didn\’t clearly indicate the candlestick and date. The following day it formed a doji without shadows.
What exactly did you want me to look for?
Please take a look at the screenshot below:
Link: https://drive.google.com/file/d/1v2wIQmED1uV_pi5qBMP6LSK-FP2TdOjg/view?usp=sharing
Ah, you must be looking at an intraday chart, maybe at that frequency, there were no trades, hence no volumes.
Right. Thanks, Sir.
Sorry, but then how do I still explain the price difference between the open and close?
Thanks.
You can attribute that to the overnight news flow.
how can volume decrease ?( if it is cumulative )
if someone is selling then isnt that obvious that someone is buying so how can the volume decrease?
Volume is cumulative, cant decrease during the day. However, you can compare today\’s volume with y\’day to get a sense of where the volume is.
Hi Sir,
I have a question about the volumes in the Futures market. In the spot market, 1K volume means 1000 shares have been traded.
In the example, let\’s say a stock in the future\’s market has a lot size of 1,000. What does 1K volume in the futures market mean for the stock?
Is a single lot of the stock traded or are there 1,000 lots traded?
I hope the question is clear.
I was a little confused so thought it was better to clear out the doubt.
The volumes are reported as multiples of single shares, hence you will have to divide this by the lot size to get the future volume.
Hi,
2 doubts
1. Can I use exponential moving average for volume, will it add acccuracy for my trade set up
2. In Kite I am able to draw SMA for volumes but not able to figure out in pi.
thanks in advance
1) Yes, you can. I personally prefer SMA 🙂
2) I\’d suggest you speak to our support desk for this, they will help you.
Volume bars are presented in green and red on zerodha kite. I have noticed that it does not always match the color of the day\’s candle. What does the color of volume bars signify ?
The colour of the volume bar is green if the closing price of the candle is higher than the previous candle’s closing price and red if it is lower than the previous candle’s closing price.
I am confused a bit here
How would you know that there are no meaningful purchase by institutional investors?
Simple, if they were buying then the volumes would have increased and not decrease
If institutional investors were buying, then is it not possible that volumn decreases (as there might not be enough supply)?
Please comment.
But the volumes will reflect this anyway, the assumption is that the institutional investors will but in greater volume, which will eventually show up.
Hi Sir how do we exactly know which side of the transaction are the institutional buyers in case of high volumes i mean do we just see the trend and support/resistance bands to recognize it also I have read that retail investors react to news shocks pretty well and this creates huge volumes involving institutional buyers to be on opposite side of the transaction(by opposite side i mean if it\’s a bull with higher volume institutional traders might be selling or going short on the stock) (since institutional buyers are more bayesian and rely on fundamentals than retail buyers who react to news very easily and involve in trading )
Yes, eventually the support and resistance levels show the price action, but unfortunately, the volumes alone does not convey which side of the trade the institutional investor is on. You need to infer this by associating it with the price.
How to add 10 day volume average in the kite. As in Moving average volume option is not in kite
Open the chart, click on studies, and then select the moving averages from the drop down.
\”For a long trade, the low of the pattern should be around the support
For a short trade, the high of the pattern should be around the resistance\”
Could you please elaborate this statement ?
Each CS pattern comes with an inbuilt stop-loss mechanism. For a bullish candle, the stop loss is the low of the candle. For a bearish candle, the high of the candle is the SL.
Hello Karthik,
I. Have.a Doubt. Regarding. The. Purchase. Of. Shares. By. Institutional. Investors. You. Are. Saying. That we can identify. Institutional. Investors by. Looking. At. Volumes. But. Can\’t they hide. Thier activity in. Any. Way so. That their. Buy /. Sale is. Not. Reflected in market?
Eventually, the volumes will capture this data and becomes evident.
Hi Karthik Sir,
In a recent chart of IDEA I saw that the candlestick for a particular session was red, however, the volume candle was green.
If the opening price > closing price then already there\’s more selling than buying, right, and the volume candle shows that buying is more. So how to decipher this?
Link: https://drive.google.com/file/d/1GAQtX-qVlzuFkIgVAJfAj8HB-NjvSqlf/view?usp=sharing
Thanks.
The colour of the volume bar is green if the closing price of the candle is higher than the previous candle’s closing price and red if it is lower than the previous candle’s closing price
Is there any way to segregate Retail & Institutional Trading Volume on Kite or Pi?
Nope, this is not possible.
Hi Sir,
1.In what way bulk and block deal affect the volume of a stock in a day?
2.I have read somewhere that the Bulk deal take place in normal window and so it will affect the volume and price of the stock in a day.Is it true?
3.Block deal take place in a separate window and so it doesn\’t affect the volume and price of a stock in anyway.Is it correct?
4.If so is block deals are more like a trades ( intra day and swing trades) between HNI ,FII and DII and Bulk deals are like investment made by HNI,DII and FII?
5.What is the difference between FII and FPI ? Is FPI is a single person, whereas FFI is a institution?
1) These are off-market transactions but under the regulator\’s purview. So does not really affect the price during market
2) No
3) Yes
4) Not necessary, the difference is in the volume/value of the trade
5) FII in now called an FPI.
kartik ji
do fund manager of any mutual fund do intraday ?
if so then can we trade those stock daily becoz those stocks are choosen by fund manager ?
sir which fund’s share traded daily
debt fund
liquid fund
equity fund
arbitrage fund
from which fund portfolio we can pick the stock for intraday.
kartik ji thank you.
What if a person purchase a share at Rs100 and it moved to Rs 105 for intraday trading and wants to sell now at 105, but unable to get a seller and price drop around 103? What will happen now?
Well, in this case, you missed the opportunity to sell due to lack of liquidity, hopefully, you get an exit @ 103. 🙂
This happens rarely or its common situation?
how to avoid this?
Liquidity is a real issue. This does not happen with Nifty 50 stocks, but outside the Index universe, there could be stocks which have really low liquidity.
Hi Karthik,
sometimes I see volumes in 2s. I mean in Zerodha Kite candlestick charts, there are volumes in M (million), K (Thousand) and are in 2. What does 2 mean?
Ritesh, will check this and get back to you. Thanks.
Thank You Kartik!
Hello Karthik,
Is there any way to depict the delivery percentages out of total volume traded(any time period) either in kite or pi. Plus an imposing MA of the delivery figures.
No, this will not be possible, Rabindra.
Does Zerodha provide Volume at Price (VAP) bars ?
You can use the Volume Profile indicator in Kite
Hello Karthik,
Are the big institutional traders always long term traders? What if these big traders are trying to make money through scalping. We the retail investors would be under the false guise of an uptrend at a time when these big traders are offloading and a false sense of a downtrend when they are buying coupled with the fact that there is always a time gap between what they are doing vis a vis what a retail trader would be doing. Correct me pl if I am wrong.
In general, most of them come with \’patient capital\’, which is meant for long-term investing. However, there are institutions which trade actively. By the way, there is no way to ascertain what these guys are doing. Volumes, like I have mentioned in the chapter is only an indication of what is happening, that too when associated with price.
Hi Sir,
As you have explained, Volume traded is equal to the amount of buying and selling of shares in a day.
Could you please explain this in the context of ONLY BUYER and ONLY SELLER situation.
If there is \’only buyer\’, then who sells the share? and vice versa.
thank you
A trade is considered done only when the price matches between the buyer and seller. Given this, it is in the context of both buyers and sellers.
sir how to draw a moving average line in volume bar
Hiten, select moving average from the Studies dropdown. In the popup, under Field select Volume.
Dear sir,
Like we have volume indicator chart or screener.
is there a screener or indicator that shows number of order .
example volume might be 3 lac traded today but order screener will show it might be just 30 orders that trader today .
No, I don\’t think this information is published anywhere. However, I need to double check this.
What percentage of average volume (10Day/15Day/20Day) should be considered institutional volume/trade on 1min or 2 min chart. E.g. If ACC has 20Day average volume of 300,000 shares and is trading at 1500 and there was a trade between 10:00 AM & 10:02 AM with the volume of 6000 shares which is 2 % of average volume and produces turn over of around 1 Crore, should it be considered institutional? If not, what should be the percentage of average volume which is considered institutional?
Quite tricky but yes, anything more than twice or thrice the average volume can be considered high, although tough to call it institutional.
Can you please explain the checklist with Infy\’s current position (Friday, April 20) as an example? Going by what I understood, the stock is on the rise.
1. No clear discussed pattern.
2. Stock is at resistance level of the last 2 months
3. Large volume with a steep price increase
2 and contradict each other. Which of them gets a higher weightage? (Ignoring all other checklist items that are yet to be discussed)
1) Perhaps there is a subtle breakout from a range?
2) Hmm, sort of but I think its kind of breaking out of the resistance level
3) Quite typical of a range breakout.
You will have to see how the trading pans out over the next 1-2 days to make a call on this.
Hi Karthik,
One point from the checklist – \”Volumes should confirm to the trade\”. This means that we can execute a trade based upon candlestick patterns only at near end of trading day right? Because we can confirm the volume check only at a time near the market end time.
Also apart from this, in general, all the trades discussed in these modules are to be executed either at the candle forming day itself at around 3:20PM or next day after confirming Rule 1 again at around 3:20 PM only.
Does this mean that trades based on TA (going long/short) can be executed only when the markets are about to close for the day?
(I am not talking about trades that trigger when stop loss is breached or when the target is hit)
Yes, especially if you are a risk-averse trader. Again, yes, this is to ensure you have a certain amount of confirmation before taking the trade, works well for the risk-averse trader. If you are a risk taker, then go ahead and initiate the trade much earlier (as explained in the chapter).
Hello,
I am little confused with this statement. The price increasing, because market participants are buying.
Buying and selling happens at same time. Then how can we say buying increases the price and selling decreases, because at the same time some participants are also selling. Then why the prices are increased?
Markets participants are buying in this context means that there are more buyers (more demand) than sellers. So the demand is more and the supply is less and this is what leads to an increase in the price. Just like how Onions used to cost around Rs.100 /kg in some instances in the past due to more demand but very less supply. Eventually, as the supply increased, the prices of onions decreased and reached an equilibrium level (where demand = supply)
Agreed. But the increase or decrease in price depends upon the price at which the buyers and sellers transact. When demand is high, buyers are willing to buy at given price, hence the price tends to increase. Likewise, when the demand is low (desperate times), the sellers would want to sell it any given price, hence the price moves lower.
Hi,
Why I am unable to see any volume related Data/Charts on the Zerodha Webapp?
In the Studies section, there are multiple Volumes related Charts, but none of them, really work when selected.
Also, I really wanted to appreciate the new Webapp, its absolutely amazing.
Thanks
Dave, all the volume related studies seem to work fine with no issues both on Web and Mobile. Can you point and specific issue/bug you found?
Hello, karthik sir,
My query is that – \” if on a particular day , volumes are not above average, however the volumes have been above average or touching peak point at some day(s) within previous one week, can this trade qualify for buy rating , subject to other checklist points complied.
Not too comfortable if the volumes do not support. However, I would suggest you take this on a case to case basis and take a call based on the overall sentiment in the markets.
Thanks for reply, however i just want to know that if i am swing trading for 4-5 months , and volumes were high 2-3 days back but i missed the opportunity to buy, it still conveys that smart money is pouring in. Then in that case, i can buy the stock assuming that volumes have complied [and other checklist also complies].
My second question is in continuation to above point that does the candlestick pattern holds relevance if i am buying stock for 4-5 months after checking MACD, EMA crossover, RSI , S&R levels , Volumes [in past week] etc other indicators. Because as per my observation, even if i buy today based on bullish pattern , the stock may rise and fall over next few months many times but primary trend should be bullish and based on that i want to swing trade. Pl correct me.
I would be grateful if you could solve these doubts.
Ashish, frankly there is no hard and fast rules. These things are expected to improve the odds of being profitable – you are always free to experiment. In fact, this is how you find your edge. So go ahead and try this and see how the trade pans out, make your observations and improvise.
As a thumb rule, the relevance of a candlestick pattern starts to diminish after about 4 -5 trading days from the pattern formation date.
HI SIr,
If we are looking at weekly chart and if the volume for it has to be high , what about the weeks which have trading holidays?(1 or more trading holidays – eg. this week).Isn\’t it obvious for the volume to be low comparatively , since there are trading holidays?In this case what to be done for trade based on weekly chart?How to find whether smart money has entered or not in those weeks?
Very true, for this reason, you will have to have at least 6 months of data to get an approximate estimate on the average volumes.
Does bulk deal causes sudden increase in volume in kite charts. As sometime before in one minute candle of sbin there was 10 times the average volume candle and also the price had moved in any direction. Also the time of that volume candle was same as the Time in which bulk deal took place. This confused me as I thought that bulk deals are off market transaction and should not cause increase in volume traded.
Bulk/Block deals are carried out as OTC trades at prices matched by markets. So it does not really affect the markets or the charting systems. The volume spike you are talking about is quite common in the market.
Hi Sir,
Suppose in a swing trade, if we have missed the support point (our SL) since because of huge market movement, that lead to a huge loss and if the price now has reached near to the next support point and RSI is also below 30( oversold region).Then can we wait and check if the next support level could give some up move and so that we can reduce our loss?Or should we need to close our position what so ever without waiting for the next SL level(even if the price is near to that level)?
Once your SL (or target for that matter) has been triggered, then its advisable that you close the position instead of creating new SL level. In my opinion, chasing new SL will only complicate the matters.
Hi Sir,
Have few doubts.
1.It is explained that , \”Increase in volumes indicates the presence of smart money\”. Does this mean that Institutional investors/big payers also trade on intraday and swing basis. !! I have heard that those big players only invest for a long term.If so they invest for a long term then how come volume increase and decrease frequently in indraday charts and EOD charts.I suppose that volume should only increase once in a while.
2.In a bullish engulfing pattern can the P1 red candle be a spinning top? or it should only be a weak red candle with significant price fall?
3. Can a hammer be considered valid pattern if it is formed in a downtrend with a gap up opening? Or else for a hammer pattern to be valid ,the opening should always be less than the previous day?
1) Yes, few institutional players trade the markets on a short-term basis
2) P1 should be a weak red candle
3) It\’s best if the opening is below P1\’s low/close.
Can you name a few Institutional players who trade in short terms or how can we know the funds which deal in short term trading. Also would you advice to invest in those funds if it is possible.
All AMCs also take up short-term trades – in fact, look at any MF which has an arbitrage scheme and they would be doing short-term trades.
kartik ji
do fund manager of any mutual fund do intraday ?
if so then can we trade those stock daily becoz those stocks are choosen by fund manager ?
sir which fund\’s share traded daily
debt fund
liquid fund
equity fund
arbitrage fund
from which fund portfolio we can pick the stock for intraday.
kartik ji thank you.
It is unlikely, but if at all, then probably the fund managers running Arbitrage scheme may execute few trades on an intraday basis. I\’d suggest you read more about Arb funds here – https://tradingqna.com/t/ask-me-anything-about-arbitrage-funds/40190
However, you cannot really pick stocks looking at MF portfolios. The thought process and reasoning for stocks being picked can completely different from our understanding.
What stance must a trader take when when the candle forming is a doji or spinning top candle after a bullish marubozu but the volume is much higher than the average? Should we go with the volumes or the candle?
I\’d always give the candle more weigtage over anything else. Rememebr, the candle represents the price action.
Sir, When applying MA to volumes should we apply it with 10 days EMA or 50 Days EMA? which one fits in for identifying volume?
I personally like the 10 days EMA on volumes.
What is \”consumer Anticipated Index\”.
How Can I actually Anticipate this?
Not sure about this, need to figure this out myself. Can you share the link, please? Thanks.
http://www.bseindia.com/bsecmieindices/consumer.aspx
Guess this just reflects the appetites of the consumers. Higher the index, better for FMCG and vice versa!
I have seen a Line on BSEINDIA website. can you tell me what does it mean?
\”Median Response Time ( µS ) Equity : 2 Derivatives :6 Currency : 3\”
That I guess refers to the latency of ticks. Useful if you are into HFT strategies.
Hello,
Varsity is amazing . It helped me a lot in clearing Basics. But Now, I feel Stucked. I want to learn more. So, Can You Guide me about any Books, Blogs or Any Source from where I can learn More about Trading, Market & Economy.
Simply, I want to ask the Pattern Of Learning The market. Now, where should i Focus On.
Aditya, I\’d suggest you read through the entire contents of Varsity. It has a lot of information and content to hand hold you in the market. It is also structured well – to ensure you get all the information in one single place.
I am slightly confused Regarding Volume.
Suppose, A stock closed forming a Red Candle With Very High RED Volume Bar. But the Closed Stock Price is In GREEN(Closed price of Day is Higher than previous day Close)
THAN HOW SHOULD I ANTICIPATE This Red Volume Bar.
Check this – https://tradingqna.com/t/why-does-the-color-bar-chart-and-volume-bars-show-wrong-color-sometimes/14543
I don\’t understand the answer written in the article. So, Can you Write the Answer In more simplified Way.
Will try and do that, Aditya. Please give me sometime.
Sir EMA is not getting overlay on Volume in PI . First i Add EMA on chart then click on source and then following eq Volume.
Despite EMA is not overlaying on Volume.
please help with snap shot.
Arjun, seems to work fine. Check this screenshot out where I have an EMA Volume Chart and Price chart open in the same screen
Sir EMA should be overlay on volume Bar not over price chart to interpret average traded volumes are above or below average of last few days.
EMA should move according to traded Volume .
In single window on same chart but in screenshot after applying volume chart 2 different window opened.
Yes, to assess the volume, the EMA should overlay on volume. You can open two different window panels in the same view, not an issue.
Hi Karthik,
A lot of time in market depth I have found very high numbers towards bids side say more than 10 lakh and quite less numbers towards offers side comparison to bids say around 2 lakh but still prices fall and vice versa. One thing i understand we see only best 5 orders in market depth which may not reflect order positions well but how to tackle such situations and/or what to understand from such kind of market depth from volume point of view.
Bid and Ask is transient in nature – meaning it keeps changing and the market depth goes beyond the top 5 bids and ask.
Iam Not Able use Zerodha Chart,Can\’t Edit,Draw.What To Do ? Padmanav Tripathy Zerodha ID-YA3973
Padmanav, please do not share your client id in public form.
Are you using the Kite charting? Check this – https://www.youtube.com/watch?v=ekh_BOvaqwQ&index=13&list=PLkxTRam6E2V-okv6gwQlt6dLTsn0v6CD1
Dear Karthik Sir,
Is it possible to use Ask volume and bid volume in intraday scanner ?
If yes then how to use it
Traders use this information to identify price spots which have maximum liquidity. Identifying liquid price points is very crucial while trading intraday.
how reliable is the intraday volume data during a live trading session? I have heard that since there is this “disclosed quantity” option while placing trades many traders actually do not reveal the real quantity traded which results in inaccurate display of volume data during live intraday sessions?
The data is streamed from the exchanges, hence highly considered clean.
In Kite, when I select volume studies, I see volume bar in Green and Red colour. Is it important to consider the colour of the volume bar in accordance with the strategy given in this article?
Thanks,
Sreejith
Hmmm, I would not pay much attention to the volume colour. I\’d rather prefer to look at the overall volume trend.
If there is sudden increase in price with high volume candle and then there is very low volume. What does it means.
And also after this increase of price with very high volume candle the price becomes stable and volume chart forms very low volume bars for certain time period.
It kind of indicates a consolidation of the price.
If the low volume is associated with a significant price action, then I guess you can ignore the price action.
What do you mean by long trade and short trade? It is little confusing in volumes and S&R chapter
Long is when you buy first and sell later. Short is when you sell first and buy later. Check this out – https://zerodha.com/varsity/chapter/commonly-used-jargons/
You have mentioned the following
In the chart above, you can see that volumes are represented by blue bars (at the bottom of the chart). The red line overlaid on the volume bars indicates the 10 day average.
How to get the red line in either pi or kite. I couldn\’t find the option. Only volume is coming.
Ok found it. I should select moving average and select field as volume.
Yes.
In kite only the overlay works. In pi I couldn\’t find an option to overlay the red line over the volume bars
In the list of studies, click on Moving average and select the field as volume. However, before you do this make sure the volume chart is loaded below the price chart.
In kite it works.
But in Pi. Under study, there is no moving average option. There are separate simple moving average and exponentioal moving average and moving average envelope. If I try simple moving average and select volume it only opens a separate chart
Yes, it will open up a separate chart. You can, however, open one chart for the Price and another for the moving average volume and view both of them on the same screen. I\’ve illustrated the same in this screenshot.
Check this video on how to add multiple charts on the same screen
hi ,
what is he color of the volume Bar indicates ?
regards
The colour of the candle is green if the closing price of the candle is higher than the previous candle\’s closing price and red if it is lower than the previous candle\’s closing price
Hello Sir, thanks for initiating such wonderful service at free of cost.
My question is, when the volumes are less than average volume level and the stop loss has been hit should i exit the position or wait for the smart money to come into play.
Hmm, I\’d suggest you get out of the trade if SL breached.
HI,
I just have one very basic question. What does nifty volume or rather any index volume suggest? You cannot directly trade in nifty rather you can only trade in future or option, so what does nifty volume refers too?
Indices don\’t have Volume(or you will see it as Zero in charts and market depth.
You might be looking at volume charts of the future contracts traded on the index
Sir,
Who are weak hands? How one to be cautious when they buy/sell?
Weak hands refer to traders who prematurely book profits/cut losses. You can be cautious by following the general rules of the trading system you follow.
Hi Sir,
If the stoploss is hit with a low Volume should we need to close our position or can we wait?
Hmm, tricky. Maybe sell half qty and wait?
Hi Sir,
I would like to know that, if i am a risk averse trader, then should I look for the volume to be higher on the P2 day also (say P1 is a Marubozu ) or is it enough if the volume be higher on P1 day alone ?.
2. if the volume on P1 is low and P2 is high, can I go on with the trade ??
1) Both P1 & P2 is desirable. But P1 is required.
2) I\’d not be too comfortable. But I guess, you can.
Hi Karthik,
Could you please share the Pi code to scan scripts trading at day high with volumes > 10 day average.
Check this – https://zerodha.com/expert-advisors/
Hi
I tried but i not able to find the suitable one.
You could probably email this Sreeni – [email protected]
Hi Sir,
We can see 5 bid and 5 Ask price while trading or investing. So If i want to buy 100 pcs. of SBI at Rs. 335 and place my order and if it is the highest price then i can see my price at the top of the bidder. At the same time if i want to sale 100 pcs. of SBI share at Rs. 330 then i will come under the Ask group and can see my price. This is clear to me.
But my question is when i go for short a stock (example – SBI 100 pcs.) then how it will show in the Bid/Ask price? Is it just opposite to that above mentioned concept? It means as it is short a stock , so 100 pcs will show in Ask group first and when i will close the position or buy it at lower price then that price will show in Bid Group?
YEs, Biwajit. THis is the exact opposite. Explained in detail here – https://zerodha.com/varsity/chapter/the-trading-terminal/ , section 9.6.
Hello karthik,
I have a query
In volume underlay option in kite, there are green and red volumes.
So when red volume bar is big, does that mean volume is high but there is selling pressure OR when green volume bar is small the buying sentiment is lacking ?
Also kindly let me know which time frame is better for judging volume bars.
Thanks.
Check this, Mehul – https://tradingqna.com/t/why-does-the-color-bar-chart-and-volume-bars-show-wrong-color-sometimes/14543/2
Hello,
Does a candlestick give out any significant trend for volume?
Does a long candle indicate higher volumes traded?
Thank you in advance.
Candlesticks on its own do not give out info on volume. Long or short candle only indicates the range. You will have to track the volume separately.
Dear Sir,
When we say people are buying and that\’s why price is going up,
But, I could not get the point ? They buy from whom ?
It\’s always… Someone to sell… Do number of buys and number of sales would remain the same!!!
Please clear!!!
It goes up not just because people are buying, it goes up because people are willing to buy at any given price!
Hello Zerodha Team,
I am new to trading and a beginner rather learner at this moment. Your Varsity blog is amazingly useful. I really love the way complicated topics have been explained with simple examples. Simple language, good info, all at one place. Thank you.
You reply to all queries and your support team is also very supportive. I don\’t really know the story who started this company but I have a feeling that a bunch of good people working as a team. More power to you guys! Keep it up. 🙂
Thank you.
Thanks for the kind words, Ruchi! We are a team driven by passion to empower our clients 🙂
Please answer
1.) Volume is higher of a share whose CMP is low, Consider share of a company whose CMP is 5 Rs. and consider another company whose CMP is Rs. 1000. If one has to take position based on volume it may mislead ?
2.) Is it good idea to compare volumes of different stock, like people compare share price % increase in a day ?
3.) Where to check DII and FII buy sell quantity at EOD.
This is generally true, to be doubly sure you may also want to check for the traded value. I dont think you can compare the volumes of two stocks, it won\’t be a fair comparison. You get the DII/FII number on NSE\’s website.
Dear sir,
In Zerodha kite, PI or any other terminal when you are giving order for any thing there is one option DISCLOSED QTY.
1. What does it mean.
2. Whether it effects volume shown in market depth.
3. How reliable is info shown in market depth.
4. Can you make any strategy on basis of info available in market depth (offer price, bid price, volume)
5. I have seen some people trading on such platform where there is no chart only info available is best offer price, best bid price, LTP and some others and still they make profit. I have tried to ask them how they do it but no avail. can you help in this
THANKS
Check this – https://tradingqna.com/t/what-are-the-advantages-and-disadvantages-of-disclosed-quantity-in-equity-intraday-trade/459
Dear Sir,
I am little confused with volume indicator. I was observing a stock\’s volume in equity, future and option trade.
I observed that no two are alike. whether it means:-
1. Volume shown in one is for that only i.e. traded volume in equity is in equity only and same way option in option (in multiple of lot size) and futures in future only.
2 They do not add up.
This is because all three are different instruments. They are all traded separately.
Hi I need some clarity on the simple moving average line for volumes. If I am on 5 min candle stick chart and I select simple moving average of volume with period as 10, what does that mean. Is this moving average of 10 days or 10 mins or 50 mins
The MA would be applied on the last 10 candles of 5 mins each.
Hi Karthik avare ,
Kindly explain this in layman words with an example as how to Trade with this in Kite/Pi –
Price Volume Trend
PriceVolumeTrend(Vector) PVT(Vector) = The Price and Volume Trend index generally precedes actual price movements. The premise is that well-informed investors are buying when the index rises and uninformed investors are buying when the index falls. TREND(PVT(CLOSE)) = UP TREND(PVT(CLOSE)) = UP
I\’m a little confused with the query myself 🙂
Iam confused with green and red volume bars sir.How I have to take if it is a red candle day and below the candle there is a red volume bar above the 10 day moving average???If there is a candlestick pattern,Can I take trade??
sir pls reply
Check this – https://tradingqna.com/t/why-does-the-color-bar-chart-and-volume-bars-show-wrong-color-sometimes/14543/2
Hi Karthik,
I can find only approx 88 studies in Zerodha Pi where as there are around 120 in Kite.
I sent an email to support and they replied that \”we use different charting libraries for both, so the difference\”.
But when I tried in Pi many simple charts like Moving average, Volume profile, Alligator etc not available in Pi. [SMA and EMA available as separate chart though]. Does this mean Kite is superior to Pi?
Even after dragging I can\’t find a way to directly put SMA over volume bar. Any helpful video link or article link please?
Btw thanks a lot for the simple way of explanation. Also please let your colleague (I suppose he is) Hanan Delvi know that his sound is amazing in the YT videos.
Hanan, will be happy to hear this, I\’ll convey the message to him.
Meanwhile, I\’ll suggest you write to – [email protected] , he will help you with Pi.
Karthik Sir,
This is regarding the volume confirmation of a trade.
1) For multiple candlestick patterns should volumes confirm on all candles or only on the last candle (Risk trader) and for Risk averse trader should the volumes confirm even on the confirmation candle that is formed after the pattern?
2) For single candlestick pattern should volumes be confirmed on both pattern formation day and the next confirmation day for Risk Averse traders?
Thanks Sir.
1) Ideally, for all but necessary for the day you intend to take a market action
2) Yes
How can we set volume chart with red line for 10 days average in kite.?
i have set volume chart under studies in kite is it correct?Volume chart is green and red what does it indicate ?
Yes, that is correct. Load the volume chart from studies and opt for the color you want from the color palette. The green indicates an increase in volume and the red indicated a decrease in volume – both compared to previous day.
Sorry for the lame question but I am a newbie
I had a question I am not sure if that is related to volumes part.
1)Suppose if I buy say 800 shares of some X company on day 1 and the somehow the target price which i thought initially would take few days triggered the same day.. and I then put the order to sell it will it be considered as intra day trade?
2)I was placing the limit sell order seeing the current market price has reached the expected target but it was not being executed , is it because there was no buyer available at that price? but then how cum the market price was still the same as my target selling price?
I was just wondering that if the chart is showing Y Rs. as current market price and I put a order to sell at Y Rs. price is it still possible that the order will not be executed? Am I missing something? is it the number of shares I am selling creating that problem? I am using kite trading terminal..
1) Yes, if you buy and sell the same day, then that would be considered an intraday trade
2) It could be because the price may not have hit your limit price
3) Yes, the price can very well move quickly and your limit price could be held pending.
If the current market price is at Rs. Y price, then how should I decide it is good to sell at that price I mean what should I look for that the stock is trading at that price long enough for my limit price to trigger and execute the order.
Liquidity is one key criterion. If the stock is not liquid then there are possibilities of intraday gaps, which means the risk of SL not triggering is high.
Sir , How much volume required to buy or sell share to avoid slippage , like 5000 volume in 15 mins timeframe ..can I buy or short 500 shares
This depends on the liquidity of the contract or the scrip, Nitin. Higher the liquidity, lesser is the slippage.
Hello Karthik Sir,
In intraday 15 min chart, if the volume crosses the avg in 6 or 7 minutes(pattern also confirmed), shall I enter the trade or shld wait for 15 min to get over??
Thanks
If your trade is based just on volume, then you can go ahead and place the trade as the volume is cumulative and only increases during the day. However, double check your strategy to make sure you know your strategy well.
How to place volume chart as shown above with average line between them at kite platform zerodha?
When you select the average line, opt for the volume plane. This feature is available on Kite. Suggest you give a call to support if you find it difficult to spot this.
Are the volumes of currency pairs shown in lots in kite??
If it is so, then if the volume of a 10 min candle is shown in USD / INR pair as 60k, then does that mean that in 10 min, a total of 60,000 lots were traded or 60 lots were traded??
Yes, it\’s in terms of contracts. Volume is cumulative in nature, so volume only increases during the day.
What is the maximum position size (in terms of % of average daily volume) that I can trade in a particular stock comfortably without actually moving the market? for example, the average daily volume of stock XYZ is 10 million, so for intraday trading purpose, what is the maximum no. of shares I can buy and sell at a given moment ?
Check chapters 11 – 14 – https://zerodha.com/varsity/module/trading-psychology-and-risk-management/
Dear Sir,
I have a small and very basic question:
1. Some time I have noticed that candlestick (5 / 15 min) and volume bar are of different colour. Does it signifies any thing.
2. Whether trading in F&O also adds in volume.
3. If yes , a lot of 1000 adds as 1 or 1000 volume.
Regards
1) Not really
2) It adds to open interest
3) 1000 … you can always divide the total volume by lot size to get the number of contracts trades
Karthik
1. Should volume be checked as one of the criteria in the checklist when trading in nifty index options and futures like we do for spot market?
2. If yes, where do we find the average 10 days data for options and futures? Pointers please.
Thanks,
Ash
1) Yes, I\’d do that myself. Check volumes on spot and then take action in F&O
2) It makes sense to check spot volume, its available on Kite.
Guess you didn\’t get my question Karthik. There is not spot market for Nifty 50 Index right.
I am asking about trading the Nifty 50 \”Index\” itself. Should we check the volumes of say Nifty 9800 PE when we buy it or like should we check the Open Interest (OI) when we trade Nifty 50 Index future?
The thumb rule is to check the underlying\’s spot volumes while trading its derivatives. Since Nifty Index has no volume data, perhaps check the futures volume. I\’d not pay too much attention to OI.
How do I check the underlying volume (cumulative volume of 50 Nifty Index Stocks)? Please do reply.
You will have to check for each stock. Or if you want, you check the Nifty futures volume as well. Checking Nifty futures will give you a sense of the volumes of the futures instrument only.
Sir, I did not read all the comments as there are many Can you just tell me that do both long Candle and high volume mean the same. I mean to say that does a long candle signify high volumes? Or is there no correlation between length of candle and volume?
Long candle means the range for the day is high, does not imply high volume.
Sir, then what is the difference between high activity and high volume? You had previously said that long candles signify high activity and vice versa.
Dear Umar,
High activity may be speculative (intraday), to confirm the point that the high activity is supported by volumes or not, you can crosscheck the delivery percentage for the day.
If high activity and high volume are supported by high delivery percentage it means more paticipants are hopeful about price action in future,but if the it is not supported by delivery percentage then both activity and volumes are speculative.
Kartik sir please correct if I am wrong
Regards
Its desirable if both delivery volume and price can confirm the same.
Long candle plus a heavy volume makes one believe that the outlook is bullish. Volume on its own does not really convey information.
hi
can any one guide me how to draw 10 day moving average on volume in kite ,
sorry for the repeated Question , found the answer
Have answered it earlier in Q&A.
Sir, I have started studying your educational modules after suffering huge loss in trading since last 3 years. your articles are so simple and nice that i feel very interesting. Basically I was doing intraday trading. I have convince that it is impossible to make money in intraday trading. After going carefully through the articles in TA of your versity I feel swing trade may be the best option. pls I need your advice in this regard. Also pls can u tell me about volume chart in studies of chart in kite zerodha trading portal.
By volume chart, I\’m simply referring to volume data plotted below the price chart. Anyway, please do take your time, get back to markets only when you feel confident. Remember, markets will always have opportunities for you.
hello sir,
how to plot 10-day moving average in volume chart….
I\’ve answered this earlier somewhere in the comment section. Request you to look up for it.
Hello Karthik!
I have gone through the content, Simple and Perfect!
How do we interpret if Price is flat and volume has increased?
Sorry if this is a repeated query or covered in the content.
Regards, Arjun
Thanks. In such cases, I\’d look at the prior trend and make an assumption that the volumes are in line with past trend.
Sir, can you pls explain this a little elaborately? Thanks.
Sure, but please share the context.
Someone asked a query as follows: \’\’What does it mean if the price is flat and volume has increased?\’\’ and you answered that I’d look at the prior trend and assume that the volumes are in line with past trends. I am asking you to elaborate on your answer to this. Thanks.
Suppose the past trend is bullish, and now, the volume has increased, but the price has not moved; then it most likely indicates a doji or spinning top. While it\’s hard to consider the direction, I\’d be inclined to think that when the move happens, it will most likely continue to move in the same direction as the previous trend, i.e. bullish.
hello sir
how to plot 10-day moving average in volume panel ?
Hi,
Studies -> Moving average -> In moving average settings -> Field -> select volume. This will automatically plot on the bottom volume panel.
Regards, A
Check this – https://tradingqna.com/t/how-do-i-add-a-moving-average-overlay-on-volume-in-kite/13565
the quantity of share shown in technical analysis software is mixed quantity of both buy and sell or the neutral amount
We have both buy and sell qty in market depth.
How much volumes one can consider as good?
Above 10-day average is considered good.
Hi Karthik,
When we consider volumes, are FUT volumes and EQ volumes are different or volume will be sum of both ? I am trying to co-relate it with open interest. In OI chapter. When we talk about volume in IO, I believe that will be no. of lot * lot size. I am bit confused here. I see there is some strategies based on OI and volumes. In such cases do we need to consider the FUT volume ?
Future volumes represent the number of contracts trades and EQ vols represents the number of shares. I\’d suggest you consider Futures volume.
Karthik, I heard a lot about \”Supply and Demand zone Trading Strategy\” …Does it work all the time? Can you please do a course on it.
It\’s the same as support and resistance if I\’m not wrong.
Also, which Volume Indicator (Volume underlay, volume Oscillator etc) is good to club with other indicators for Day trading
I;d prefer volume underlay.
hi,
can i transfer funds to my zerodha account from nri or nro account
Yes, you could. Suggest you speak to our NRI desk for more information.
Karthik,
Why is is difficult to get the \”Volumes\” involved with a stock\’s \”Buy\” only? i mean, can\’t the NSE/BSE segregate the volumes by \”Buy Volumes\” and \”Sell Volumes\” that way we can know how the market is trending?
Also, Can you give a quick Overview of Stochastic and which is better Fast or Slow Stochastic for Day trading, and what should be the boundaries used as a cue to go long/short?
No where on internet its explained well like the other indicators are explained in Z-Varsity..Honestly!
That would not be possible Ravi, think about it….just by looking at volumes, how can we if it was a buy or a sell volume. Ex:100 shares bought and 100 sold, how do we distinguish? That\’s the reason traders associate price with volume.
I\’m not a big fan of Stochastic, it tends to give way too many signals. But between the two, I\’d watch out for the slow one.
Thanks for the kind words, Ravi 🙂
Happy learning.
Thanks Karthik!
Hi Karthik
On the BHEL daily chart for august 11, there is a hammer formation at the bottom of a downtrend, the volume is above the 10 day sma line. It is sell volume. The next day the stock does goes up. So in this case there was a bullish candle stick pattern, the volume was also large but in the bearish direction(it was sell volume). Can you explain what is going on? I have seen this happen in many setups.You have said that a recognizable candlestick pattern + large volume is a good trade. I thought the volume doesnt support this trade but the price still went up over the next few trading sessions. Would you say that the volume supports this trade or does it indicate the very opposite direction? what could be done in such situations?
Thank You.
Also thank you so much for this very coherent and accessible guide to the markets and the varsity initiative. This has been extremely helpful and we are very grateful for all your hard work and guidance.
It\’s hard to distinguish the volume as a sell or a buy volume. Volume does not really have a character. Remember, if I buy 100 shares and you sell 100 shares to me, then the volume is 100. It\’s very hard to call it a buy or sell volume. For this reason, we associated volume with the price to give it a character.
So, my primary decision-making tool will be the candlestick, backed by volumes.
Dear sir,
Could you elaborate the meaning of series like EQ , BE, P1 , P2 etc. in nse delivery data archieve. Link for the same is below:
https://www.nseindia.com/products/content/equities/equities/eq_security.htm
Regards
Check this – https://tradingqna.com/t/how-are-the-stocks-classified-by-their-groups-i-e-group-a-b-c-in-nse-where-can-i-see-the-list-of-these-groups/322
Dear sir,
there is not clear idea about the series on the link provided by you.
Please elaborate if you could?
Which series?
P2-series
Karthik, I have been trading based on TBQ Vs TSQ in relation with the candle stick patterns for the last few days…. I made some profit as well…. Do you think I just got lucky and this is not ideally a good method for intraday trading?
I cannot really comment, Abhi. I\’ve not had great success trading based on TBQ vs TSQ, but this does not mean others can\’t figure a way to do this 🙂
Hey , it\’s Sahil Jain
Stock buying and selling is simultaneous process so why stock price increase or decrease .. you said that 100 share bought by someone but meanwhile 100 are also sold by someone , so Why .??
Sahil, I\’d suggest you check out section 6.3 here – https://zerodha.com/varsity/chapter/the-stock-markets/
Its more of a Supply/Demand question…. That\’s how the economy works!
Hey, Karthik sir
Can you please suggest me the book that writtened on the volumes. Because I found that the volumes is the best way to find professional institutions activity on stock..
I want to learn it more deeply. Can you suggest me some books…
Thanks….
There is no book on Volumes as such. It is usually a small section within a book dedicated to TA.
Dear karthik sir,
All of sudden on a particular price a huge volume traded like 15L on a particular price and total volume of the day is 20L…stock price didnt move much with that huge bid took place, what could it mean…smart money or something else?…even the stock price didn’t move much in next enitire week…kindly if possible plz light on this.
It could be a bulk/block trade, Arun.
How to identify swing periods of high momentum and high volatility in advance?
For this you need to study the chart with at least 6 months of data.
DEAR SIR,
I am a bit confused about the ananlysis of market depth in intraday, means What is the importance of market depth data while taking a position?
My confusion is due to the fact that, sometimes sellers are five times the buyers, but the price still oscillates, I mean when sellers are more than buyers, the price should go down?? Is not it?? And vice versa.
My concern is – What role does market depth plays ??
And Second one sir, market depth data is combined of both the exchanges or only of NSE or BSE, if it is not combine should we look at the market depth of both the exchanges.
Regards
Market depth helps you understand how liquid the instrument is. You can assess the following with it –
1) Bid-Ask spread – the narrow the spread, the higher is the liquidity.
2) Higher the liquidity, higher is the loss owing to impact cost when you place market orders
3) It also gives you a sense of how many shares you can buy or sell at a given time – particularly helpful while placing large orders
Market dept is for single exchange.
Dear Sir,
Thanks for your guidance, Your experience and opinion both matters for me, I think you are a \”virtual mentor\” for thousand of market participants, but, why I am buttering you is because you changed my perception towards market, I am able to make small but consistent profit only because of you.
Now coming to the question above, Sir What I want to know, as per your experience,
Can we guess price movement on the basis of the total ask and bid quantity ?
Because, generally what we think is more the number of buyers, more the chances of the price to move up, but as I observed in intraday, the sellers price is five times the buyers, but the price is still fluctuating, in second case the sellers are higher in number than the buyers, but the price is still going up. (I am talking about total quantity).
I want to know your opinion.
Regards.
Thanks for the kind words and encouragement, means a lot to all of us at Zerodha 🙂
It would be very hard to estimate the price movement based on total bid-ask spread and total buy sell quantity. Remember, if more number of buyers have to buy then there is an equally large sell order. Its best to look at the price trend and make an assessment on the overall direction of the market.
Good luck.
Dear sir,
the market depth show total number of buy and sell orders, top five, is this data included with stoploss and target order (say BO) or it includes only the main order i.e one order either buy or sell.
e.g.-
say i have placed a BO for buying a stock, literally it is three in one order, in this case market depth will treat it as only one buy order or one buy order plus two sell order.
By the way \”HAPPY INDEPENDENCE DAY \” sir………..
Happy Independence day to you too!
Yes, the market depth shows the top 5 orders that are placed in the market.
Dear sir,
you have answered my question, what I want to ask is \”Does the market depth considers stoploss and target orders or it only considers the main order buy or sell (for example I have placed a BO order).
Regards
No, the market depth cannot distinguish between SL and target orders. It will list all the limit orders that come into the exchange\’s system.
See when the volume increases with price……how do you say that the stocks bullish ….for all we know its only increase in traded volume…it could be institutional investor selling to a large number of retail investors, right ?
Volume and OI analysis is empirical. No definite science here.
Sir,
Can we apply the concept of volumes to options trading also?
Yes, you can. You can apply volume theory on spot and take a position in the options market.
Hello sir
I have a very big confusion at least i assume it is. I am sorry as it is going to be a bit longer paragraph.
Based on the checklist we can have simple vanilla \”stock\” trade, i.e buy low sell high. But as you taught us Fut contract gave leverages. You also told that impact cost of stocks were higher than that of index. In this situation we are left with the best option to trade in either Index Fut contract or option. For a moment we leave the option contract. But the problem is how can one get the directional view of index, the underlying? As index has no volume record & we know volume is a vital organ of TA. Also it is very different entity than a stock.
So, my question is- How can one get the directional view of index so that one could trade its Fut contract as it mimics the underlying?
I would like to add just one more confusion.
If the future contract directly mimics its underlying then why is it necessary to look for the volume of the contract?
Thank you 🙂
Varsity student
Yes, for index there no volume, but you can always look at the Futures contract and check its volume information.
But sir, my question is still unanswered. I want to know how we can apply TA on index to trade its Future contract.
You can apply TA on the Index future\’s price action. You can also look at the Index spot chart for TA patterns.
Hi,
In the volume graph, I see 4 colours (when I see the candle stick graph for more than 1 day). I see additional green and grey bars. Can you please educate what these candle colours indicate?
Where do you see this, Phani?
Hi Karthik,
Did you see the screenshot link I left here. It\’s at https://drive.google.com/open?id=0BzSt4405pqmiSV81d3MwclNmVkE
Can you please fill me in on the context? Thanks.
Hello sir
You described the importance of volume in TA. While browsing the technical indicators in Kite i came across volume profile. Later i googled it and got some fragmented but important information regarding volume profile. Well i learnt about it from random sources but it would be better you write about it. Frankly speaking i am addicted to your writing. I think volume profile is as important as the volume chart based on time .
Varsity student
Thank you 🙂
Thanks for your kind words Kumar, I will try and write about it sometime soon 🙂
Hyy,
Could you explain this line. \”if the institutional investors were selling then volume would increase and not decrease\”. But in reality it has to be the other way round only na??
No, institutional clients transact in large quantities, hence the volume would be quite high.
How can I find out average volume of last 15 days on Zerodha Kite?
Easiest way is to plot an average on the volume indicator.
Thanks Karthik! Really well written.
Cheers!
Hello Sir,
In intraday 15 min multiple candlestick pattern, suppose if the volume is high for the first candle and it is low for the second candle, can we go for it or should we refrain from it?
Really depends on the pattern.
sir,
can you explain little bit about prior trend as i am confused that is there any fixed given percentage to define a prior trend? May be 4-5% in a week ?
Yes, a movement in price amounting to at least 5-8% would qualify as a prior trend. Of course, the numbers could vary based on each individual\’s trading experience, I\’ve mentioned what works for me.
sir,
total volume data is given on the end of the day and you have written on all of your pages that either you are a risk taker or averse, you have to buy the stock after conforming at 3:20 pm .
so according to you, we have to buy the stock around 3:20 pm confirming the volumes, patterns and s&r.
Remember volume data is given out during the day…and it only increases through the day. So if it has crossed the previous day\’s or say last 10 days average volume, you will easily know.
Hello Sir,
How do these big DII and FII invest money in Indian Stock Market ? As you said if LIC will do from open market, it will impact the price then how they do it ? And with continuation of previous question, the TCS said that it will buy back shares worth Rs 16000 crore to benefit retail investor, then will it buy back from open market ?
Thanks
Buy back is from open market, but the procedure is different. Buy backs if done right, certainly has a huge impact on the sentiment of the stock. Btw, DII and FII also use the open markets…and depending on the size of the trade, it can either be a bulk or a block deal.
Hi Kartik,
I am attaching the JPG file of jackson investments a penny stock.Pls download the file frm the below link
https://drive.google.com/file/d/0BxpxOUxrE_YbMHF5TlI3SDV4dUk/view?usp=sharing
I see the buy qty is over 19 Lakh and the sell qty is 0…How is this possible? Also this stock is forming higher high and higher low..with massive volumes. It is also breaking all pivot resistance levels .Does this indicate smart money accumulation or is this some kind of retail participation?
TA works best on liquid stocks. This one looks like its operator driven and attracts sporadic liquidity. I\’d avoid.
Given this, from the looks of it – no smart money here.
Hi sir,
In checklist you mentioned that Ensure above average volumes on both buy and sell day
but my doubt is how can I confirm the volume while buying because we will get to know actual volume at the end of the day.
Do you mean confirming yesterday\’s volume with last 10 days average volume,where the pattern formed.
Regards,
Chandrashekhar
Usually, if today\’s volume is greater than the average of the last 10 days, then it considered as good volume.
Is there any freely available tool which will calculate various candidate of option stock and suggest the stock best deal ?
I had experienced that, while doing various calculation and to come to conclusion, The price of option became changed . and reached to different level
I\’m not sure of any good websites.
Yes, options are quite dynamic and price changes are quick.
sir, how will we add moving average line on volume bars in pi? And will it be 10 day SMA?
You can drag and drop the MA on volumes. YOu can set it to any time period.
sir, when i m dragging 10 day or 100 day SMA from chart to the volume bar , it settles near the very bottom of the volume bar. How am i supposed to know 10 day average volume? thank u.
Why don\’t you try creating the SMA directly on the volume bar by choosing to have the overlay directly on the volume? This should work.
sir,
if a marubozu is formed with low volumes, is it better to avoid the trade and
if a marubozu or like morning star is formed or like bullish engulfing pattern is formed with good volumes is the better opportunity to buy?
Yes, volumes do play an important role.
Sir,
1)what is best way to select stock for intraday trading for buy?
2)what is best way to select stock for intraday trading for sell?
3)what is best way to select stock for short term holding( for 7 to 15 days holding time) not futures so only for buy?
Check this chapter – http://zerodha.com/varsity/chapter/finale-helping-get-started/
Hi,
Does this technical analysis using volume trends have any significance for trading Nifty index futures?
Yes, volume does play an important role for traders.
but from where can i get the open interest data. kite does not provide it i have checked.
Its available on Pi/NEST.
Kartik,
How does it differ if LIC is buying 500k shares resulting in vol. rise vs 50 small retail investors buying 1k shares each… volume should increase in both scenarios, right?
Yes, it should. When an large institution buys, then along with volume, the sentiment also increases.
if so, how would we know the price increased due to big firms/small retailers? I still dont understand how come price increase when volume decrease. please explain
Large volumes generally indicates that the an institution is at play. These are general observations, nothing in markets is set in stone.
Hello, I am unable to plot the moving avg line for the volume on various free sites likes yahoo finance, moneycontrol, chartink, and paid applications like edelweiss. Does these do not have this feature or I am not able to find it.
It is a basic feature, I\’d be surprised if its not. Guess you need to explore more to figure this out.
Hi Karthik,
1. When would the price volume chart be practically applicable? As in which situations and to do which kind of check?
2. Assuming I\’m doing positional trading, to decide on whether today is a good day to trade, is it good to wait till about 3 pm to get a sense of today\’s volume w.r.t last 10 days\’ avg. volume, unless there\’s a trend already visible ? Asking since it shows cumulative volume..
1) You can look at it along with any candle pattern
2) As soon as today\’s volume crosses the previous average. This could happen any point during the day and not necessarily at 3:00 PM.
Dear Sir,
Pls help for intraday trading how do I check live sharp surge in price, Pls recommend site, etc.
Please follow 5/10 mins charts.
sir as you\’ve given many examples to trade(short/buy) at 3:20. m confused what do you mean by that, cause market doesn\’t take orders after 3:20
Who said so? You can place trades till 3:30PM.
Sir,
Is it necessary to have volumes in the range of 100000 for any stock to be considered active intraday & or its based on the average volume over the 5 or 10 days range??
Always take the average for last 5 or 10 trading sessions.
Sir how to calculate volume in trade tiger(sharekhan)? sir please guide me
I\’ve never used Sharekhan\’s platform, Ramesh, so I\’m afraid I cannot help.
However, you need not have to calculate volume. Volume data is streamed from the exchanges, which is displayed on the charting engine.
Sir…in zerodha chart volume are are represent in bar chart but what represent green and red color ?
They indicate the price action, higher volume + higher price, compared to previous day = green bar. Lower volume + lower price, compared to previous day = red bar.
Hi Karthik,
Can I take 1)\”buy quantity = sell quantity\” and 2)\”(Buy quantity+Sell quantity)/2 =Volume\”.
But I can see \”buy\” is not equal to \”sell\” and \”Volume\” is far greater than Buy,sell quantity.
End of the day the buys should match sell, only then a trade is said to be complete. The discrepancy you notice is in the number of orders…for example there could be 100 guys willing a total of 1500 shares but on the other hand 1 guy could be selling all these 1500 shares. In such a case, number of buyers appear higher than the number of sellers. However, the shares traded remains at 1500, which is the volume for the day.
So Buy/Sell \”Quantity\” means \”Number of people\”.
Thanks for the explanation.
Yup.
Hello sir,
i m trying to learn trading from last one year and come to know that volume is leading indicator.But i have doubt why volume decrease??? whenever transaction happened either buy/sell ,its should be increment.Yes i agree that OI increase or decrease as per scenario but i think in every condition \’volume\’ should always increase in number…then why its showing volume decrease…its based on previous day data or why its happening sir???? i observe that OI increased but volume decrease….but my personal vies that Oi increase/decrease its pssible but volume should always + number…plz let me know sir why volume is negative value???
You estimate the increase/decreased in Volume based on what happened previously. For example, if there were 10 trades yesterday and only 5 today then clearly the volume has decreased.
For intraday, how to predict with volume. For ex, let say share x was going down from open price 1100 to 1050 with increase volume, but at 2:30 stock start recovering from low to 1080 at close , so if i place trade at 2:25 seeing it is going down but it return back to up level. How to interpret this situation and avoid trade in such situation.
Its hard to rely on volumes for this. On a day like this, its natural to expect high volumes. The decision is mainly from a price action.
Suppose Let say X share (actual share trading ) , their is open at 1091 close at 1083…. but i look at volume it is 10 lakh ….. but when i look more closely it recovered from low of 1055 …. so do u suggest institutional buying is der or not ….made a high of 1102 … so what is your view on this … how should i look volume now ….
You should compare today\’s volume with the last 10 or 15 days average trading volume to get a sense of how high or low today\’s volume really is.
Wonderful articles. I glad that i chosen a good company. I do have a question about Support and Resistance line. For day trading how many days should i consider for drawing support and resistance line. I face lot of difficulties drawing those lines.
For day trading, I\’d suggest you look at at least 3-4 days of 5 mins charts.
What does 3-5 day of 5 min chart mean, can you explain in detail?
You take a 5 mins chart and look back for 3-5 days….so its 5 mins chart for 3-5 days.
Dear Karthik
Could you pls tell me how is the volume data is updated for volume bar in Zerodha Pi and Kite (source of data)…. I was viewing the EOD chart for ICICI Bank Ltd. and observing the trend of volume. And I realised the volume traded displayed in NSE / BSE website is completely different from what is shown in volume bar in Pi…. Also, certain other platforms suchs as Chartink.com ;
Investing.Com; Icharts.in etc. give a different quantity
We get the data from the exchange. I\’d suggest you shoot an email to [email protected]
Sir, I am new to this share market So, please clarify my doubts.
1) If I want to short sell the group B, XC, XD, XT, Z stocks through product type as cash and carry and I’ll hold it for next 2-3 days. Is it possible to it hold for next 2-3 days of that particular stock??
2) If I want to short sell or buy group Z stock today and tomorrow I want to buy back or sell it but there is no volume in that particular stock. What will happen (whether my buy back or sell order is executed or not)?
1) No, you cannot short sell in the spot market and carry the position forward. You will have to deal with Futures to short and carry forward the position
2) Its advisable you do not do BTST with Z category stocks. Check this first – http://zerodha.com/z-connect/queries/stock-and-fo-queries/btstatst-buyacquire-today-sell-tomorrow and then this – http://zerodha.com/z-connect/queries/stock-and-fo-queries/consequences-of-short-delivery-nse-bse
Thank you for your reply sir.
Welcome!
Sir what are these Z category stocks??
Check this – https://tradingqna.com/t/what-are-a-b-t-and-z-category-stocks-in-bse-how-to-classify-them/1415
Dear Karthik
Till now, I have got three perspective for looking at a graph – TA pattern, S&R & volume. Now my query is if I want to trade in Nifty options, I can refer Nifty 50 (underlying) for pattern and S&R (correct me if requited) but confusion is with volume. Shall I refer particular option volume/OI or Nifty future as Nifty 50 can\’t have volume figure.
Regards
You should be looking at the Nifty Future volume as its indicative of the overall market. When you look at the option volume, its just the volume for that particular strike.
Thanks a lot Karthik
Welcome!
Thank you sir for your prompt reply……..it helps me a lot.
Welcome!
Is it possible that volume become zero at any particular time during intraday trading? What will happen in that case if anybody is in intraday trade with target and limit stop loss?
Nope, volume starts with 0, but can only increase during the day.
Thank you sir.Actually I have some confusion regarding my one particular trade.On 24-11-16,I was short in SILVERMICNOV F (MIS) at Price Rs 40166 [ S/L Rs 40266, TAR RS 39966 ].At 18.06 Hrs my S/L hit although I have seen the price around RS 40170 and there is no spike at all.In which circumstances it may happen.?………..Thanks.
Check this – http://tradingqna.com/2492/placed-order-which-executed-price-charts-amibroker-other-chart
How can i check for stocks for which volume is doubled compared to previous day?Is it possible to check that info in kite or nseindia??if so please forward link..
I guess moneycontrol has this feature – http://www.moneycontrol.com/stocks/marketstats/index.php
I Hv one Question about some script like krishna fabrics rate and volume. i want to sell 123 qty urgently.
Please check the details on NSE website or directly on Kite (or web based trading platform).
i\’m very confused that why to buy in case of bullish trend.
As, if the price is getting high then one should try to sell.
Please clarify me ?
The whole point of TA is to identify the current trend and profit by it by trading the trend. So it does make sense to stick with the trend.
Thanks Karthik.
Welcome!
Hi Karthik,
I am a PI user, in snapquote, TSQ 432000, TBQ 268500, still the price is moving up, i am confused, what might be the reason
Regards,
MSP
The bid and ask quantities are transient and changes every second in the market. It does not really convey the market bias.
Hi Karthik,
Please correct me, if i am wrong, we shouldn\’t follow these numbers, and better to ignore it.
Regards,
MSP
Volume is important, better not to ignore it 🙂
Hi Karthick,
I’ve another query about the stock market price driven depends on supply and demand. But, if I place a limit buying order higher than the current price or selling order below the current price, this will act as good as market order.
And I know, if I want place buy order above the current market price, it is only option stop buy order and likewise if I want place sell order below the current market price, it is only option stop sell order.
Then, how to price increase and decrease on the market depth and how to manipulate the price by the insider?
Yes, it acts as good market order. For you move markets then the quantity you trade in must really be large.
Thank for your reply.
Firstly, Price Time priority and then volume get priority. Am i right karthick?
All the three matters equally 🙂
Hi Karthick,
However, the nifty 50 constituents are traded in the market. So, in this case right for use the cumulative of all nifty 50 constituents stock volumes at related to the timeframes. ex: if I use nifty 50 chart on 10 min timeframe for intraday trading and the nifty 50 constituents stock volume added and shown on nifty 10 min chart., is it right for use as volume of nifty index? I think the chartink.com and in.investing.com act as the same way I mentioned. Am I right? If any wrong means. Please correct me.
If the way is right means why didn’t you also follow the same on pi and kite?
Thanks in advance.
You cannot add up the volumes of all 50 stocks because the weightages change for each of the 50 stocks….you will accordingly have to scale the volume information.
Hi Karthick,
I\’ve one query related volume. The Indices (Nifty & Nifty Bank) have not any volume information on pi and kite. But, the volume information of indices available in some websites charts. Ex: chartink.com and in.investing.com.
Please, show some light on the volumes of indices.
Thanks in advance.
There is no volume for Indices as they are not traded, however their respective futures are traded and we show the volume information for these contracts.
Thanks kartik
I haven\’t reached that chapter on Dow. I\’m practicing as I\’m learning.
Great!
Good luck and stay profitable 🙂
Hello Kartik
Based on what i have learnt from the previous lessons I today shorted Tata steel at 366.4.with a stop loss of 376.3 because the stock had opened Gap down of two previous days and also had opened in the red in the first hour of today\’s session.
However the stock ended in the Green and breached the stop loss causing a trade loss.
Where did i go wrong .
2.Similar thing happened with Hindalco which i shortedat 139.4 with SL at 143.1 based on similar situation as tata steel.
Here too i had to book a loss .
The volumes on both the stocks were good
Please guide me where i went wrong and what additional precautions and parameters i must look for.
thanks
Volumes alone should not be the \’only\’ criteria. Did the trade comply with the checklist that we have discussed here – http://zerodha.com/varsity/chapter/dow-theory-part-2/
The volume in yes bank, IDBI, Adani power and IOB are more than 20 day average on September 9 2016 . But still there is no investment from any financial institution or FII. Could this be the retail participation?
Yup, it could be retail. Also, it is difficult to rule out that its not from institutions.
If it is financial institution participation. It should be displayed either on block or bulk deal?. Please correct if i am wrong
Not necessary, they can buy shares which are less than the stipulated amount for bulk/block deal.
If there is an financial institution participation (buy or sell) will that information be available in block/bulk deal?
Yes, it would be reported and made public. Check this – http://www.moneycontrol.com/india/stockmarket/statistics/blockdeals/11/24/NSE
Thanks for your reply, i feel to know a particular stocks volume since 9:15 to 3:00PM like 9:15 AM vol 1000, 9:16AM 1100 like that, if i add volume column on the pi means it will show current volume, but want to know addition of deduction of volume in every minute on the live market, if a pop up brings volume like 9:15 AM. 9:16 AM etc, So i can try to predict something
The volume displayed is cumulative, I\’d suggest you reach out to [email protected], he maybe able to guide you.
Hi kartik
Can i track volume in every minute for particular stocks in the live market, for example Bharti Artl at 9:30AM volume 11000, 9:31AM volume 12000 9:32 AM volume 10000 for futures, if i can track on PI please let me know menu. thanks
Yes, just add the volumes column on your market watch.
What does a green and red volume indicates below the charts?
Some are really long candles and some are short. But I specifically want to know what does the color of candle mean?
Gree means today\’s volume is higher than y\’day and red indicates that today\’s volume is lesser than y\’days.
In ur Dec 22\’15 comment : \”Abhilash – the volume bar turns green if the closing price of the stock is higher than the previous day’s closing.\”
Now ur above statement is Contradictory…. I am confused. Plz clear my confusion..Thanks
Sir i got it:
The volume bar is green if the closing price of today is greater than previous day closing and not if the volume of today is greater than previous day volume…
Am i right sir????
Yup!
Hi Karthik, Is it possible to throw some light on volume spread analysis or have a separate chapter on that?
Will try and do that Rajesh.
Sir as you mentioned \”traders usually compare today’s volume over the average of the last 10 days volume\”.What about price?
Should we consider average of last 10 days price or just previous day price for comparison with today\’s price????
In fact you can compare the price as well. This is exactly what the Simple and exponential moving averages does….it compares today\’s value versus the time frame selected.
Hi,
All check lists are giving entry,but next day there are some events like IIP data,CPI. should we take entry after results announcement even if others give entry and sholud we follow these events,regulatory statements regularly?
Its best to avoid TA signals when you have such major economic events around the corner.
Hi,
Volumes are increasing but Open interest is not , even other check lists give entry. In this case should we consider open interest to rise with volume?
Volume represents the number of trades…whereas OI shows the tally of new position creation. Both OI and volume increase indicates extreme market activity.
Dear sir,
In one of ur previous comment u have said that If u buy 1 share from A and A sell 1 share to u then total volume for the day is 1 and total no of trades is 2. And here u said volume represents no of trades.I am a bit confused. Plz clear my confusion.
Secondly where can i get to read about open intrest in varisity. I have heard 2-3 times abt dis term in above comments.
Thank u
Volume is the number of shares transacted in. Open Interest = https://zerodha.com/varsity/chapter/open-interest/
Hi,
I looked at the news some analysts are saying that at 7900CE and 8000CE fresh writing is going on so Nifty would not go above 8000 by expiry. is this assumption right or wrong?
We are not even half way through to the expiry, hence I would not really believe what this analyst says!
Hi,
Until the volume confirmation even if other check list gives entry should not we take entry?
few days back Nifty bounced back at 7678 next day previous days hammer\’s high also broken but no 10 days average volume confirmation but open interest increased (3%)
in this case what\’s your opinion ?
Volume matters, however if every other condition matches but the volumes dont, then I would be willing to buy half the usual quantity. Higher the volume, higher is the conviction.
Hi,
I want to know about Nifty, Is it UP trend now? if we buy based on TA can we hold the position for few days?
Yes, you can hold for any time frame you wish to.
Hi,
which volume we should consider in NIFTY, Nifty future or Nifty Underlying?
Underlying.
Good day Sir,
I have recently joined Zerodha.
Would you please explain me the following in regards to Volumes :
1. What is meant by Up volume & Down Volume in the Kite Platform? &
2. How to draw a 10 SMA or EMA on Volumes in Kite?
Thank You.
Regards!
Up volume is when the volume is higher than the previous candle;s volume plus the price is higher. Down volume is when the volume is higher and price is lower. For your other query I\’d suggest you speak to one of our support executives.
Thank You Very Much Sir !!!
Welcome!
With the aid of a chart can we predict the impact of an event that is occurring out of the blue…like court orders,eg.revoking licence of coal and 2g, war break out,act of gods etc…or what could be the precautions undertaken to prevent sudden moves…
With the aid of a chart you can only guess more intelligently. It does not guarantee results, but the probability of you being right increases. Spread positions help in managing your down side risk better.
their is no channel trading concept sir,
It is there but we have not discussed the same in here.
Technical Analysis finished.. Practicing now a days … Going through fundamental Analysis, very easy to understand and simple language too … eagerly waiting for Commodity sessions…… Nice to link with Zerodha ..
Good luck and please stay tuned for more content!
Thanks Karthik. I guess like this, many people placed an order ( Sell / Buy ) that not yet executed. Still that count for Buy side and Sell side. Sorry if it is wrong …
True, all orders placed will feature in the bid ask, provided the rates are within top 5.
Hi , Can you please explain how these difference comes in BUY ans SELL volume.
BUY : 1,95,750 and SELL : 2,11,805
The information that you see represents the transient markets. At that particular point there were 1,95,750 buyers and 2,11,805 sellers…the next moment it could be different. There is no rule that they need to be equal.
The only thing, just to check the Volume is above 10 SMA and the appropriate Candle patterns/trend @ that time, right ?
Absolutely!
Thanks Karthik …
Hi Karthik, I\’ve been watching VOLUME Bars with 10D SMA. Let\’s assume a Volume BAR opens in Green, but some times at the end of the Volume Bar closing time it suddenly changed in to RED bar and vice versa. We think the Bar is a Green BUY signal but the change happens within 1 or 2 seconds of time.
Hope all the Buyes becomes Sellers ( or) is it any other precise answers ? , why it is happening like this. Just uploaded an image to clear my question…
Thanks
Abhilash – the volume bar turns green if the closing price of the stock is higher than the previous day\’s closing. However what you need to observe is the \’volume\’ itself. If today\’s volume is higher than previous 10 SMA the consider it as good volume and ignore the colour of the volume bar.
I want to ask you one question regarding the colour of Volume bars. You said in your comment that colour of the volume bar depends on the previous bar\’s close, if it closes higher than previous candle\’s price it creates green volume then why some volume bars changes its colour when I toggle to Heikin Ashi candles???
Ah, this was more with the candlesticks Kunal. Not an expert in Heikin Ashi. Let me check this.
Hey I solved the puzzle. its same concept. If HA close is higher than previous HA close it changes the HA volume bar into green despite of normal candle is opposite in colour. Thanks.
Cool, thank for letting us know 🙂
Hi Karthik, I have got the MA in Volume indicator. Thanks.
Most welcome! Good luck.
Sure , I will
Hi Karthik,
I have mailed to Zerodha support and I got a call from them. I have explained about the requirement. They told me that Article was about PI Software, not about KITE. They want me to search the same is available on PI software too. I had a look on Pi but I couldn\’t find that indicator in Technical Analysis drop down list. Please do have a look on the image.
Ok, can you please email [email protected] directly? I\’m sure he will be able to address this. Please do keep me posted as well. Thanks.
Hi , I am using Kite of Zerodha. How can I draw Moving average on Volume ?
Can you please email our support for this, thanks?
Dear sir,
All of sudden on a particular price a huge volume traded like 15L on a particular price and total volume of the day is 20L…stock price didnt move much with that huge bid took place, what could it mean…smart money or something else?…even the stock price didn\’t move much in next enitire week…kindly if possible plz light on this.
Ok Karthik. I would be thankful for u, if u can help in this. Basically I am looking for L2 market depth data which is seen in snap quote.
Pradeep can you touch base with tsiva at zerodha dot com ? He knows better on these aspects.
Hi Folks, Is there any way we can get the snap qoute programatically @ regular intervals. Say every second I would like to fetch the snap qoute automatically via a script or any other code. Is it possible to do this ?
Pradeep honestly not sure, maybe possible with Kite…I will get back to you on this.
sir, plese clarify my doubts
if iam trading in 3rd day, then can i consider 1st day OI and VOLUME, And how to consider? please explain
I\’m assuming you are referring to a candlestick pattern where the pattern has been triggered on the 3rd day….in such a case yes, you can consider volumes on 1st and 2nd day.
How to consider – just look at the average volume or OI and compare it to present day (3rd day) volume and OI and you will have a reference point.
Dear Prof. Karthik,
Attached is the screenshot of of today\’s chart. I have used SMA for the last 10 candles and in this I have noticed that 2 of the 10 candles are outliers (marked as 01 and 02 in the volume chart). Is there any way I can eliminate these two outliers for the SMA of the last 10 candles ? Or is there any other alternative/indicator to SMA that factors in the outliers?
Thank You.
Pavan – I\’m not qualified enough to be called a \’Professor\’, so please spare title!
Btw, why do you want to eliminate the volume bars? These are natural market movements, by eliminating the data points you are influencing the decision making process.
Dear Karthik,
You remind me of my earlier project finance professor who helped to demystify the subject for me. So the Title. 🙂 . Title or no title, I am in gratitude to you.
Yes , I understand what you convey. If I had not factored in the volume at 14:10 (marked as 02), then the volume in the last but one candle (14:20) would be above the moving average of the last 10 candles and the volumes criteria would be satisfied to go for a long. But it would be unnaturally distorting the reading of the charts.
Thank You.
Yes, in fact we need to be doubly sure when cleaning the data points – remember these are natural events in markets, cleaning them would distort the data.
Karthik,
Is there any site that helps find stocks with volume higher than there 10 day average volume ?
Indranil – have you tried chartink dot com?
Try the app – StockEdge….
I have an issue with confirming whether the stock prices will break S1 ,S2 and S3 on buying side and R1, R2, and R3 on selling side. I mainly depend on pivot points in intraday trade . Recently I got profits of RS. 379 and the very next day I had RS.264 loss. So I am eager to identify my loopholes therefore can you give me a solution by which I can get confirmed whether to buy around S1, S2 and S3 and viceversa. Any numbers calculation can help?
Mithun – personally I prefer identifying Support and resistance by looking at the chart. I hardly look at pivot points – hence may not be the right person to talk about it. By the way, have you checked out this chapter on S&R – http://zerodha.com/varsity/chapter/support-resistance/
I have often noticed extreme high volume in stock but unable to dicipher whether the volume is for purchase of shares OR for sale of shares for me to follow smart money.
In few cases i see increase in high volume with increase in price and vice versa. Does it mean increase in share price with increase in volume is purchase of shares and decrease in share price with volume is sale ? In few cases the share price has no major movement but bulk volume like 1.5L Or 5L.
Then how to i foillow smart money ? I mean unless i know whether the volume is for purchase or sale how can i copy it ?
How long does NSE or BSE or Money Control site take to update bulk volumes on their site ? Is it real time or delayed ?
Remember if I buy 1 share for you (you being the seller), then the volume for that day is 1 and total number of trades is 2. So given this when you see a volume number it represents both buy and sell information. If volume is high then it means the number of buyers and sellers are really high…you further associate this with prices to get a generic view. For example high volume + increasing prices is supposed to indicate bullishness.
Bulk/Block trades is off market transaction so it does not really impact the prices much. Information is usually real time (maybe 15-20 minutes after the transaction has occurred).
Anyway, I would suggest you associate the volume + price movement to develop a generic opinion on market sentiment.
Hi,
What are some indicators of smart money selling or shorting ? can this not lead to a blue candle ??
Not sure if there any reliable indicators to track smart money action.
\”Bulk /block deal is off market transaction\”…Can u plz karthik explain little bit abt dis .Its impact on price,volume ?
Any market transaction which is not routed via the exchanges is called óff market transactions. For example, you can transfer shares from your DP to mine via a DIS slip then it is an off market transaction. Since this is outside of markets, it does not really have an effect on prices.
hello karthik,
your chapters are very useful, great work,i have a doubt like you said if lic will buy share it will buy alteast 50k ,and like this if someone buy share that much of quantity there should be someone seller of that quantity,so my question is how much max share in a day which can be trade and how much quantity someone can buy from the market,is there is no limit for buying and selling.
For all practical purpose there are no limits for this.
In ZT current days volume bar is always high and next days it is reduced, also volume in data table is reduced, why. It is difficult to ascertain the volume of current day whether it is above or below 10 days avarage,Also how to plot moving avarage of volume in ZT and PI
Well I just came to know how you can draw moving average on volume bar, it is simple just select moving average(Simple or Exponential that is your choice) from Technical Analysis drop down menu. It will draw the line on the main price pane, then you need to drag that line of moving average to the volume bar pane and that\’s it…
Most of the software are menu driving these days…so quite easy to get things done 🙂
I would suggest you please speak to someone at [email protected] for ZT and [email protected] for queries related to Pi.
got it, thanks Afsin
Thanks karthik,
🙂
Dear Karthik,
How I can draw Moving Average on Volume Bar using PI…
Thanks and Regards,
Afshin
Afshin – I would suggest you get in touch with [email protected] regarding Pi.
Hi,
It is the way for plot the SMA 10 on volume bar.
First, you select the SMA (Simple Moving Average) from study. Then, you change the source type (there is available 5 types of source on default chart. That\’s called as Open, High, Low, Close and Volume) as volume. Set the value as 10 on the period entry box. Then, the SMA 10 plotted on the candlestick chart only. You must drag and drop the SMA 10 on volume bar.
Note: Once confirm un-select the cross hair before the drag and drop.
Thanks.
Yes you can drag and drop a SMA on volumes.
Sir plz tell me about dos & don’ts of buying penny stocks. Also tell me the character of these penny stocks like kss ltd, Dr datson lab etc.
Hi Karthik,
Thanks for the great work you ppl are doing. I want to know whether day trading done is also done by the smart money (institutional investors) or is it that they do long term investing only.
Thanks 🙂
A lot of funds do day trading in the name of \’High Frequency Trading\’ (HFT).
Hi Kartik Sir,
when we see large bullish candle but not so much increase in volume , can we conclude that \’disclosed quantity\’ is pretty low but actual volume is very high so as to cause sharp rise in price..?
Nope, large candle with low volumes could probably mean there is no institutional participation, therefore the increase in price is backed by retail volume.
So how does it matter anyway even if the increase in price is backed by retail volume? When I go long, all I want is the prices to increase right?
Does it suggest that the price is going to fall soon or something??
Agree – when you go long all you care is about the price going up. Its just that in case the price is going along with great volumes then the conviction to hold the position longer is higher. Also when you hold the position longer, there is scope to realize higher profits. Hence increase in price along with increase in volume is desirable.
Hi Sir , thanks for good tutorial
I have read somewhere that in U.S.A. if we buy or sell in accordance to the volumes , then this is a crime and there is also some legal penalty for this. Why is it so? Is this also true for our country,India?
I dont think this is true. US has pretty strict rules when it comes to day trading. The last I knew there was a minimum deposit of $25K to be eligible to day trade. Dont know if rules have changed now.
Hi, Which indicator in Pi represents the n-day moving average of volume? I can see EMA which is for price but confused which one to apply to draw a moving average on volume.
In fact you can plot the same EMA or SMA on volume and that should suffice.
Can i confirm the trade decision by cross checking the TBQ & TSQ in snap quote? If my decision is short sell, can i take the short sell position after confirming the TSQ is double as compare to TBQ? Whether TBQ & TSQ values are giving any confirmations?
I\’m not sure if one can depend on this information. For example you may observe TSQ to be double than that of TSQ, but what if TBQ is representing a disclosed qty? Then clearly the information is misleading.
did nt understand \’but what if TBQ is representing a disclosed qty? Then clearly the information is misleading.
Yes, misleading on an intraday basis….but on a EOD basis, it will tally.
Sir
High volume =Today’s volume > last 10 days average volume
But sir my question is today\’s which volume when market start that volume (I.e after 20 min)
Or at the end of the day volume
It depends. If you are looking at Intraday 5 mins chart then \’Volume now > average of last 10 candles, then consider it as good volumes. Likewise if you are looking at EOD then today\’s volume > last 10 days volume then consider it as a good volumes.
HI Karthik,
You mention the following with respect to intraday : \” If you are looking at Intraday 5 mins chart then ‘Volume now > average of last 10 candles, then consider it as good volumes. \”
My question is : Is it possible to plot the average of last 10 candles over the volume chart in Kite? I see that you have shown it for plotting the average of last 10 days.
Yes, you can. When you select the moving average, simply select the field as volume.
Please include material on Market Profile. Thanks!
Will do that sometime soon! Thanks.
hi sir,
how can i draw a moving average line on volume bar in ZT
Can you please email support at zerodha dot com for this? Someone will get back to you on this. Thanks.
Hi Karthik,
I am waiting to buy the pullback on low volumes to the 50EMA. But to my surprise, the volumes are kind of messy in the chart which im attaching the screenshot. I cannot make an opinion whether the pullback is on low volumes or not. Please make a comment on this..
Thanks in advance.. 🙂
Jagadeesh..by waiting for an event, your eyes are tuned to only see that particular event and you miss the obvious :). 2 things I notice from the chart you have posted..
1) Starting from left there is a big green candle followed by another green candle. What follows these two candles are 2 red candles with low volumes. This is a typical low volume retracement..which usually happens over 3-5 candles. However in this case it is only 2
2) The big red candle has high volumes indicating a bearish sentiment…what fallows this is a doji. A big candle followed by a doji is quite powerful. I have explained the rational here..in section 8.4
So expectations are good but don\’t let that blind you to other events unfolding.
crystal clear… 🙂
Following up the low volume retracement – here is the chart of Karnataka Bank. The recent large bullish candle (with large volume) is followed by small red candles with relatively low volumes. I would consider this as a good example of low volume retarcement. Makes a good case for an options trade.
Got a doubt. You mean to say since there are red candles with low volumes after a big green candle, it is just a retracement?
Low vols and low prices just indicates weak hands getting out, in the backdrop of a run up, this could be a retracement.
Sir,
What do you mean by \”volume retracement\”?
Price retracement based on lower volumes.
Sir because of low volume retracement we should go long here with an options trade is this what suggested here am I right.And can we consider there is also a flag formation those who missed the rally they can enter here is this right.
Yes, that is right. You can certainly take the options route here.
sorry, here is the complete question..
What is the significance of deliverable qty. to total traded qty. ? can it be of help while analysing price -volume action? or while analysing charts for that matter
Deliverable qty signifies the amount of shares that were traded today with an intention of taking overnight deliver. Where as the traded qty signifies the amount of shares day traded. Higher the % of deliverable quantity, the more bullish the stock is perceived.
Dear sir,
So what should be the ideal percentage range to be considered as good ratio?
For how long such good ratio should be continued (in no.of days) to sustain the rally?
And also, how it should be interpreted when there are red candlesticks?
The higher the deliverable quantity, the better it is. I would guess a sustained (for at least 5 trading session) deliverable qty of over 60% should be considered good. If it is a red candle and the deliverable qty is increasing it only means investors are buying the decline.
Dear Karthik sir, first of all sorry to write in Harshad\’s comment,
but, how can we find out for delivery base selling ?
Regatds
Haridas.
Thats absolutely ok, idea is to learn and grow together 🙂
Well, I guess the delivery based sell volume should be equivalent to the delivery based buy volume.
hi Sir ,
first of all , i am absolutely lovin\’ this blog. i m slowly realizing my mistakes in my trades.
and sorry for this obvious question but ,
\”how can one decide how much %of volume was for delivery and how much was for intraday ?\”
e.g
assume volume candle says : 500 shares.
does it mean…?
1> 500 shares bought and sold on same day?
or
2> say 200 shares were for bought for holding and rest was intraday noise.
or
3> 300 were for BTST trade.
regards,
Rajesh
Glad to know that 🙂
It is hard to segregate the volume based on the trading type. However NSE does give out information on the total delivery trades for the day.
If it is a red candle and delivery is increasing doesnt it mean more delivery people are selling ?
Increase in volume + decrease in price -> bearish sentiment ?
Increase in Volume + Decrease in price is considered bearish.
SIR,
I did not get your below answer to question \”How can we find out for delivery base selling?\”
Please elaborate…
When I buy 10 shares from you, there are 10 shares bought and 10 shares sold. How can one classify this as delivery based selling? It would be difficult right?
Dear Sir,
What is the significance of deliverable Qty. to total t
Dear Sir
How to identify institutional investors on chart pattern?
Volumes is the key.
Dear Sir
Kindly give an example for tracking volume when the smart money is in the market
The only way to keep track of volume is by comparing today\’s volume with the historical volume. The volume table detailed the chapter will help I guess.
Dear Sir
How to spot smart money on chart pattern?
Best way to do this is be observing and tracking volumes.
Sometimes in intraday chart it is noticed that there is a sudden increase of volume (for a range of 30 mins or more) but the price moves sidewise with sort candles. Does it signify anything, like a possible breakout in any direction?
Volume should always been viewed with respect to price. Also, always make sure you compare real-time volume (on intra day basis) with the previous day volume to get the bigger picture.
you can use the bollinger band to identify which direction the trend will break out
Nope, BB is a volatility indicator, had to predict the direction of the breakout.
Sir plz tell me about dos & don\’ts of buying penny stocks. Also tell me the character of these penny stocks like kss ltd, Dr datson lab etc.
I prefer to avoid buying penny stocks, you can find my reasoning here – http://www.thehindubusinessline.com/features/investment-world/market-watch/sold-for-a-penny/article7216585.ece
verygood
10 days MA on volume..SMA or EMA?
I personally like to use SMA.
Today(7th nov) in bharti airtel intraday chart, there was a heavy increase in stock with no volume. So ,this indicates that 2nd row. In these cases, should we short the stock at closing or to wait for a confimation till next day opening?
It suggests you exercise caution 🙂
Is there any website which gives volume \’& price screen in live markets??
Have you checked out http://www.zerodha.com/pi ?
how to view volume trend and moving average on Kite
Check this – https://kite.trade/docs/kite/#charting
Hi Karthik
I cannot apply SMA onto the volume chart bar charts as you have shown in the chapter, neither in kite nor in pi.
Please suggest.
Atul
Once you open the chart in Kite, goto studies and select Volume chart. This will drop down the volume under the chart. Now goto studies again and select MA. Once you select MA, a pop up will prompt. Under \’feild\’ select volume instead of \’close\’ and you will have your problem solved 🙂
Hello,
How to overlay MA line on the volume bar in Pi? In Kite, I can do this. But I require this in Pi.
Click on the source in the MA window and select volume….MA will now be applied on volume.
dartstocks
Dear sir,
I have few doubts in my mind regarding volume chapter…
1. While drawing average line on volume bar, we should draw a SMA OR EMA??
2. Secondly, sir can we use the same concept of average volume during intraday trading??
Looking for your guidance…..
1) I generally prefer SMA
2) Yes, you can.
Dear sir,
I want to clear my doubt that \”What it means when volume very high but no significant change in price?\”
Like in todays infosys intraday chart, there was sudden increase in volume, but there were no significant change in price, how one should look at this side of volume i.e. \”increase in volume, but no change in price\”
Regards
This could probably occur due to a block deal.
Hi Kartik,
Yesterday there was a block deal in NCC LTD of 11,87,000 qty at 86.10 Rs but in NSE yesterday\’s i.e 28 Aug total volume for EQ is showing as 10,50,660 and as BL it is showing as 11,87,000 should total volume be regarded as 1187000+1050660
If I\’m not wrong block deals are off market transactions. Does not get accounted for in regular market volumes.
In in kite platform inside market depth.. There is showing bid and offers… If in any stock bids quantity is increasing.. Say its double the offer quantitie… Inspite of this stock price is not going upfront.. Rather going down… Why sir… Does demand and supply theory doesn\’t work in stock market….. Price of stock should go up Na… If bid quantity is greater… Plzz reply sir… This is a heavy confusion
Vivek, the bid and ask are only transitory and can change every second. So you should not really go with this.
sir im unable to draw SMA line over volume chart..plz explain how to draw it in pi
Vivek, request you to either call our support desk or drop an email to [email protected]