

15.1 Moving Average Convergence and Divergence (MACD)
In the late seventies, Gerald Appel developed the Moving Average Convergence and Divergence (MACD) indicator. Traders consider MACD as the grand old daddy of indicators. Though invented in the seventies, MACD is still considered one of the most reliable momentum traders’ indicators.
As the name suggests, MACD is all about the convergence and divergence of the two moving averages. Convergence occurs when the two moving averages move towards each other, and divergence occurs when the moving averages move away.
A standard MACD is calculated using a 12 day EMA and a 26 day EMA. Please note, both the EMA’s are based on the closing prices. We subtract the 26 EMA from the 12 day EMA, to estimate the convergence and divergence (CD) value. A simple line graph of this is often referred to as the ‘MACD Line’. Let us go through the math first and then figure out the applications of MACD.
| Date | Close | 12 Day EMA | 26 Day EMA | MACD Line |
|---|---|---|---|---|
| 1-Jan-14 | 6302 | |||
| 2-Jan-14 | 6221 | |||
| 3-Jan-14 | 6211 | |||
| 6-Jan-14 | 6191 | |||
| 7-Jan-14 | 6162 | |||
| 8-Jan-14 | 6175 | |||
| 9-Jan-14 | 6168 | |||
| 10-Jan-14 | 6171 | |||
| 13-Jan-14 | 6273 | |||
| 14-Jan-14 | 6242 | |||
| 15-Jan-14 | 6321 | |||
| 16-Jan-14 | 6319 | |||
| 17-Jan-14 | 6262 | 6230 | ||
| 20-Jan-14 | 6304 | 6226 | ||
| 21-Jan-14 | 6314 | 6233 | ||
| 22-Jan-14 | 6339 | 6242 | ||
| 23-Jan-14 | 6346 | 6254 | ||
| 24-Jan-14 | 6267 | 6269 | ||
| 27-Jan-14 | 6136 | 6277 | ||
| 28-Jan-14 | 6126 | 6274 | ||
| 29-Jan-14 | 6120 | 6271 | ||
| 30-Jan-14 | 6074 | 6258 | ||
| 31-Jan-14 | 6090 | 6244 | ||
| 3-Feb-14 | 6002 | 6225 | ||
| 4-Feb-14 | 6001 | 6198 | ||
| 5-Feb-14 | 6022 | 6176 | ||
| 6-Feb-14 | 6036 | 6153 | 6198 | -45 |
| 7-Feb-14 | 6063 | 6130 | 6188 | -58 |
| 10-Feb-14 | 6053 | 6107 | 6182 | -75 |
| 11-Feb-14 | 6063 | 6083 | 6176 | -94 |
| 12-Feb-14 | 6084 | 6066 | 6171 | -106 |
| 13-Feb-14 | 6001 | 6061 | 6168 | -107 |
Let us go through the table starting from left:
- We have the dates, starting from 1st Jan 2014
- Next to the dates, we have the closing price of Nifty
- We leave the first 12 data points (closing price of Nifty) to calculate the 12 day EMA
- We then leave the first 26 data points to calculate the 26 day EMA
- Once we have both 12 and 26 day EMA running parallel to each other (6th Feb 2014) we calculate the MACD value
- MACD value = [12 day EMA – 26 day EMA]. For example, on 6th Feb 2014, 12 day EMA was 6153, and 26 day EMA was 6198. Hence the MACD would be 6153-6198 = – 45
When we calculate the MACD value over 12 and 26 day EMAs and plot it as a line graph, we get the MACD line, which oscillates above and below the central line.
| Date | Close | 12 Day EMA | 26 Day EMA | MACD Line |
|---|---|---|---|---|
| 1-Jan-14 | 6302 | |||
| 2-Jan-14 | 6221 | |||
| 3-Jan-14 | 6211 | |||
| 6-Jan-14 | 6191 | |||
| 7-Jan-14 | 6162 | |||
| 8-Jan-14 | 6175 | |||
| 9-Jan-14 | 6168 | |||
| 10-Jan-14 | 6171 | |||
| 13-Jan-14 | 6273 | |||
| 14-Jan-14 | 6242 | |||
| 15-Jan-14 | 6321 | |||
| 16-Jan-14 | 6319 | |||
| 17-Jan-14 | 6262 | 6230 | ||
| 20-Jan-14 | 6304 | 6226 | ||
| 21-Jan-14 | 6314 | 6233 | ||
| 22-Jan-14 | 6339 | 6242 | ||
| 23-Jan-14 | 6346 | 6254 | ||
| 24-Jan-14 | 6267 | 6269 | ||
| 27-Jan-14 | 6136 | 6277 | ||
| 28-Jan-14 | 6126 | 6274 | ||
| 29-Jan-14 | 6120 | 6271 | ||
| 30-Jan-14 | 6074 | 6258 | ||
| 31-Jan-14 | 6090 | 6244 | ||
| 3-Feb-14 | 6002 | 6225 | ||
| 4-Feb-14 | 6001 | 6198 | ||
| 5-Feb-14 | 6022 | 6176 | ||
| 6-Feb-14 | 6036 | 6153 | 6198 | -45 |
| 7-Feb-14 | 6063 | 6130 | 6188 | -58 |
| 10-Feb-14 | 6053 | 6107 | 6182 | -75 |
| 11-Feb-14 | 6063 | 6083 | 6176 | -94 |
| 12-Feb-14 | 6084 | 6066 | 6171 | -106 |
| 13-Feb-14 | 6001 | 6061 | 6168 | -107 |
| 14-Feb-14 | 6048 | 6051 | 6161 | -111 |
| 17-Feb-14 | 6073 | 6045 | 6157 | -112 |
| 18-Feb-14 | 6127 | 6045 | 6153 | -108 |
| 19-Feb-14 | 6153 | 6048 | 6147 | -100 |
| 20-Feb-14 | 6091 | 6060 | 6144 | -84 |
| 21-Feb-14 | 6155 | 6068 | 6135 | -67 |
| 24-Feb-14 | 6186 | 6079 | 6129 | -50 |
| 25-Feb-14 | 6200 | 6092 | 6126 | -34 |
| 26-Feb-14 | 6239 | 6103 | 6122 | -19 |
| 28-Feb-14 | 6277 | 6118 | 6119 | -1 |
| 3-Mar-14 | 6221 | 6136 | 6117 | 20 |
| 4-Mar-14 | 6298 | 6148 | 6112 | 36 |
| 5-Mar-14 | 6329 | 6172 | 6113 | 59 |
| 6-Mar-14 | 6401 | 6196 | 6121 | 75 |
| 7-Mar-14 | 6527 | 6223 | 6131 | 92 |
| 10-Mar-14 | 6537 | 6256 | 6147 | 110 |
| 11-Mar-14 | 6512 | 6288 | 6165 | 124 |
| 12-Mar-14 | 6517 | 6324 | 6181 | 143 |
| 13-Mar-14 | 6493 | 6354 | 6201 | 153 |
| 14-Mar-14 | 6504 | 6380 | 6220 | 160 |
Given the MACD value, let’s try and find the answer for a few obvious questions:
- What does a negative MACD value indicate?
- What does a positive MACD value indicate?
- What does the magnitude of the MACD value actually mean? As in, what information does a -90 MACD convey versus a – 30 MACD?
The sign associated with the MACD just indicates the direction of the stock’s move. For example, if the 12 Day EMA is 6380, and 26 Day EMA is 6220, the MACD value is +160. Under what circumstance do you think the 12 day EMA will be greater than the 26 day EMA? Well, we had looked into this in the moving average chapter. The shorter-term average will generally be higher than the long term only when the stock price trends upward. Remember, the shorter-term average will always be more reactive to the current market price than the long term average. A positive sign tells us that there is positive momentum in the stock, and the stock is drifting upwards. The higher the momentum, the higher is the magnitude. For example, +160 indicate a positive trend which is stronger than +120.
However, while dealing with the magnitude, always remember the price of the stock influences the magnitude. For example, the higher the underlying price such as Bank Nifty, naturally, the higher will be the magnitude of the MACD.
When the MACD is negative, it means the 12 day EMA is lower than the 26 day EMA. Therefore the momentum is negative. Higher the magnitude of the MACD, the more strength in the downward trend.
The difference between the two moving averages is called the MACD spread. The spread decreases when the momentum mellows down and increases when the momentum increases. To visualize convergence and the divergence traders usually plot the MACD value chart, often referred to as the MACD line.
The following is the MACD line chart of Nifty for data points starting from 1st Jan 2014 to 18th Aug 2014.
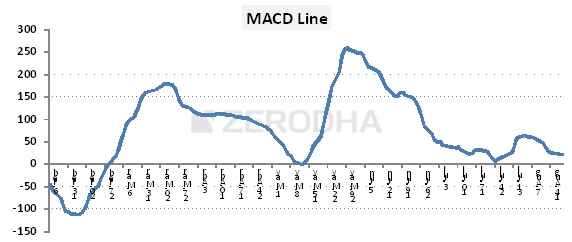
As you can see, the MACD line oscillates over a central zero line. This is also called the ‘Centerline’. The basic interpretation of the MACD indicator is:
- When the MACD Line crosses the centerline from the negative territory to positive territory, it means there is a divergence between the two averages. This is a sign of increasing bullish momentum; therefore, one should look at buying opportunities. From the chart above, we can see this panning out around 27th Feb
- When the MACD line crosses the centerline from positive territory to the negative territory, it means there is a convergence between the two averages. This is a sign of increasing bearish momentum; therefore, one should look at selling opportunities. As you can see, there were two instances during which the MACD almost turned negative (8th May, and 24th July) but the MACD just stopped at the zero lines and reversed directions.
Traders generally argue that while waiting for the MACD line to crossover the centerline, a bulk of the movie would already be done and perhaps it would be late to enter a trade. To overcome this, there is an improvisation over this basic MACD line. The improvisation comes in the form of an additional MACD component which is the 9-day signal line. A 9-day signal line is an exponential moving average (EMA) of the MACD line. If you think about this, we now have two lines:
- A MACD line
- A 9 day EMA of the MACD line also called the signal line.
A trader can follow a simple 2 line crossover strategy with these two lines as discussed in the moving averages chapter and no longer wait for the centerline cross over.
- The sentiment is bullish when the MACD line crosses the 9 day EMA wherein MACD line is greater than the 9 days EMA. When this happens, the trader should look at buying opportunities.
- The sentiment is bearish when the MACD line crosses below the 9 day EMA wherein the MACD line is lesser than the 9 day EMA. When this happens, the trader should look at selling opportunities.
The chart below plots the MACD indicator on Asian Paints Limited. You can see the MACD indicator below the price chart.
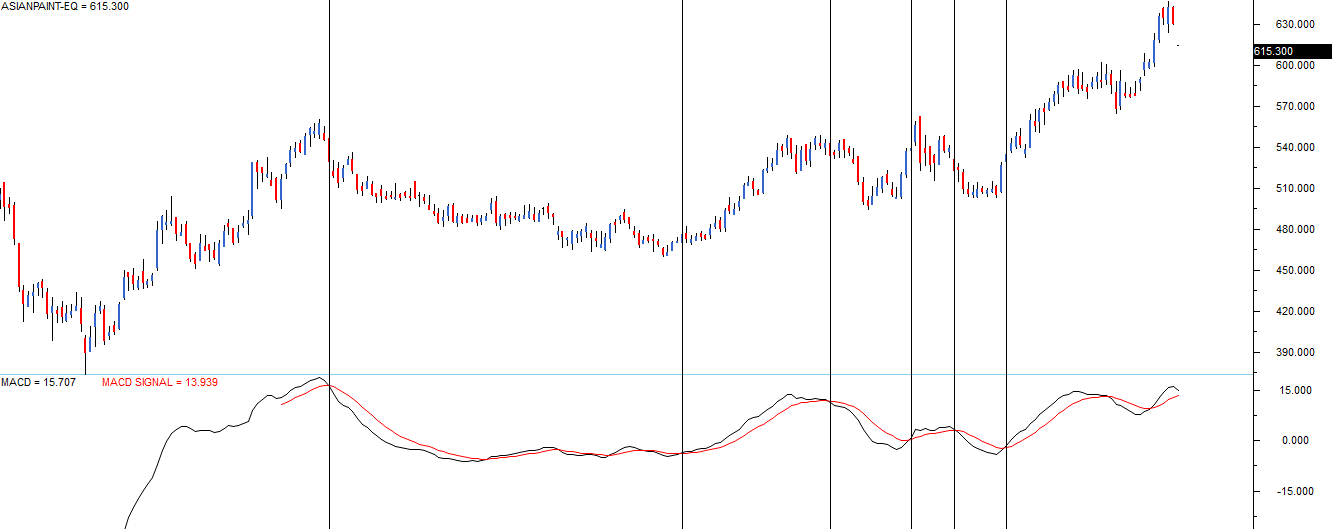
The indicator uses standard parameters of MACD:
- 12 day EMA of closing prices
- 26 day EMA of closing prices
- MACD line (12D EMA – 26D EMA) represented by the black line
- 9 day EMA of the MACD line represented by the red line
The chart’s vertical lines highlight the chart’s crossover points where a signal to buy or sell originated.
For example, the first vertical line starting from left points to a crossover where the MACD line lies below the signal line (9 day EMA) lies and suggests a short trade.
The 2nd vertical line from left points to a crossover where the MACD line lies above the signal line should look at buying opportunity. So on and so forth.
Please note, at the core of the MACD system, are moving averages. Hence the MACD indicator has similar properties like that of a moving average system. They work quite well when there is a strong trend and are not too useful when moving sideways. You can notice this between the 1st two-line starting from left.
Needless to say, the MACD parameters are not set in stone. One is free to change the 12 days, and 26 day EMA to whatever time frame one prefers. I personally like to use the MACD in its original form, as introduced by Gerald Appel.
15.2 – The Bollinger Bands
Introduced by John Bollinger in the 1980s, Bollinger Bands (BB) is perhaps one of the most useful technical analysis indicators. BB is used to determine overbought and oversold levels, where a trader will try to sell when the price reaches the top of the band and will execute a buy when the price reaches the bottom of the band.
The BB has 3 components:
- The middle line which is The 20 day simple moving average of the closing prices
- An upper band – this is the +2 standard deviation of the middle line
- A lower band – this is the -2 standard deviation of the middle line
The standard deviation (SD) is a statistical concept; which measures a particular variable’s variance from its average. In finance, the standard deviation of the stock price represents the volatility of a stock. For example, if the standard deviation is 12%, it is as good as saying that the stock’s volatility is 12%.
In BB, the standard deviation is applied on the 20 days SMA. The upper band indicates the +2 SD. Using a +2 SD, we multiply the SD by 2 and add it to the average.
For example if the 20 day SMA is 7800, and the SD is 75 (or 0.96%), then the +2 SD would be 7800 + (75*2) = 7950. Likewise, a -2 SD indicates we multiply the SD by 2 and subtract it from the average. 7800 – (2*75) = 7650.
We now have the components of the BB:
- 20 day SMA = 7800
- Upper band = 7950
- Lower band = 7650
Statistically speaking, the current market price should hover around the average price of 7800. However, if the current market price is around 7950, it is considered expensive concerning the average. Hence one should look at shorting opportunities with an expectation that the price will scale back to its average price.
Therefore the trade would be to sell at 7950, with a target of 7800.
Likewise, if the current market price is around 7650, it is considered cheap concerning the average prices. Hence, one should consider buying opportunities to expect that the prices will scale back to its average price.
Therefore the trade would be to buy at 7650, with a target of 7800.
The upper and lower bands act as a trigger to initiate a trade.
The following is the chart of BPCL Limited,
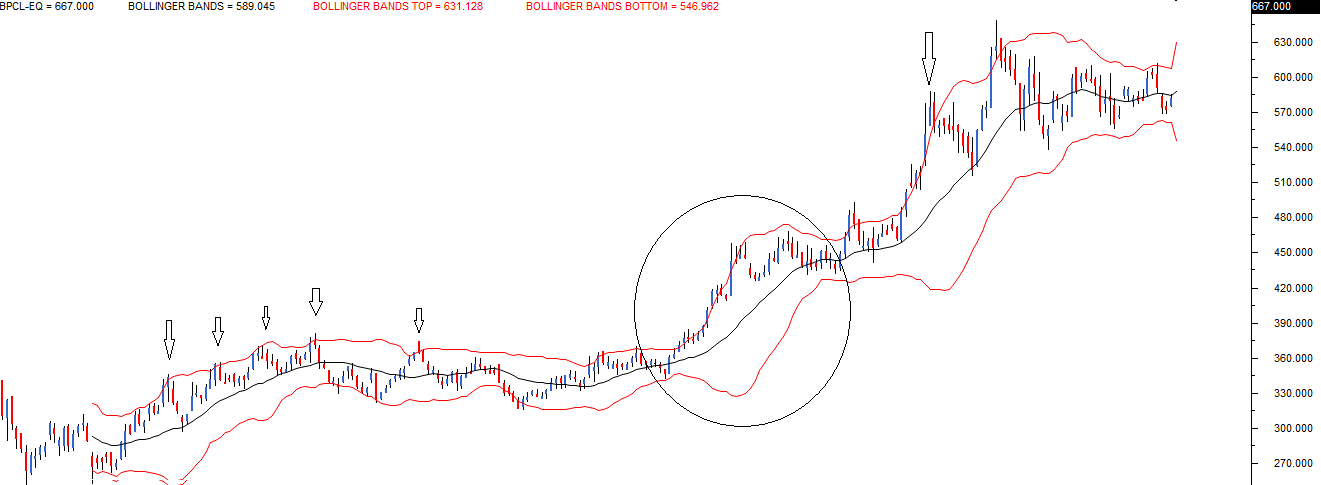
The central black line is the 20 day SMA. The two red lines placed above and below the black like are the +2 SD and -2SD. The idea is to short the stock when the price touches the upper band, expecting it to revert to average. Likewise, one can go long when the price touches the lower band, expecting it to revert to the average.
I have highlighted using a down arrow all the sell signals BB generated, while most of the signals worked quite well, there was a phase when the price stuck to the upper band. In fact, the price continued to drift higher, and therefore even the upper band expanded. This is called an envelope expansion.
The BB’s upper and lower band together forms an envelope. The envelope expands, whenever the price drifts in a particular direction, indicating strong momentum. The BB signal fails when there is an envelope expansion. This leads us to an important conclusion; BB works well in sideways markets and fails in a trending market.
Whenever I use BB, I expect the trade to start working in my favour almost immediately. If it does not, I start validating the possibility of an envelope expansion.
15.3 – Other Indicators
There are numerous other technical indicators, and the list is endless. The question is, should you know all these indicators to be a successful trader? The answer is a simple no. Technical indicators are good to know, but they by no means should be your main tool of analysis.
I have personally met many aspiring traders who spend a lot of time and energy learning different indicators, but this is futile in the long run. The working knowledge of a few basic indicators, such as those discussed in this module is sufficient.
15.4 – The Checklist
In the previous chapters, we started building a checklist that acts as a guiding force behind the trader’s decision to buy or sell. It is time to revisit that checklist.
The indicators act as a tool which the traders can use to confirm their trading decisions, and it is worthwhile to check what the indicators are conveying before placing a buy or a sell order. While the dependence on indicators is not as much S&R, volumes or candlestick patterns, it is always good to know what the basic indicators suggest. For this reason, I would recommend adding indicators in the checklist, but with a twist to it. I will explain the twist in a bit, but before that, let us reproduce the updated checklist.
- The stock should form a recognizable candlestick pattern
- S&R should confirm to the trade. The stoploss price should be around S&R
- For a long trade, the low of the pattern should be around the support
- For a short trade, the high of the pattern should be around the resistance
- Volumes should confirm
- Ensure above average volumes on both buy and sell day
- Low volumes are not encouraging, hence do feel free to hesitate while taking trade where the volumes are low
- Indicators should confirm
- Scale the size higher if the confirm
- If they don’t confirm, go ahead with the original plan
The sub-bullet points under indicators are where the twist lies.
Now, hypothetically imagine a situation where you are looking at an opportunity to buy shares of Karnataka Bank Limited. On a particular day, Karnataka Bank has formed a bullish hammer, assume everything ticks on the checklist:
- Bullish hammer is a recognizable candlestick pattern
- The low of the bullish hammer also coincides with the support
- The volumes are above average
- There is also a MACD crossover (signal line turns greater than the MACD line)
With all four checklist points being ticked off I would be happy to buy Karnataka Bank. Hence I place an order to buy, let us say for 500 shares.
However, imagine a situation where the first 3 checklist conditions are met, but the 4th condition (indicators should confirm) is not satisfied. What do you think I should do?
I would still go ahead and buy, but instead of 500 shares, I’d probably buy 300 shares.
This should hopefully convey to you how I tend to (and advocate) the use of indicators.
When Indicators confirm, I increase my bet size, but when Indicators don’t confirm I still go ahead with my decision to buy, I scale down my bet size.
However, I would not do this with the first three checklist points. For example, if the low of the bullish hammer does not coincide in and around the support, I’ll really reconsider my plan to buy the stock; in fact, I may skip the opportunity, and look for another opportunity.
But I do not treat the indicators with the same conviction. It is always good to know what indicators convey, but I don’t base my decisions. If the indicators confirm, I increase the bet size; if they don’t, I still go ahead with my original game plan.
Key takeaways from this chapter
- A MACD is a trend following system
- MACD consists of a 12 Day, 26 day EMA
- MACD line is 12d EMA – 26d EMA
- The signal line is the 9 day SMA of the MACD line
- A crossover strategy can be applied between the MACD Line and the signal line
- The Bollinger band captures the volatility. It has a 20-day average, a +2 SD, and a -2 SD
- One can short when the current price is at +2SD with an expectation that the price reverts to the average
- One can go long when the current price is at -2SD with an expectation that the price reverts to the average
- BB works well in a sideways market. In a trending market, the BB’s envelope expands and generates many false signals
- Indicators are good to know, but it should not be treated as a single source for decision making.
Good post on MACD/BB crossovers, but I\’ve learned the hard way that simple indicator strategies need rock-solid execution to avoid curve-fit disasters—I tested 20+ EAs chasing that 2-line signal and most died on live data. What worked for me was building custom EAs that match my actual edge instead of buying pre-packaged ones; I use Ratio X EA Generator now to describe my strategy in plain English and let the AI handle the MQL5 code, then I own and test the result in MT5 before going live. Beats paying for overoptimized bots that blow up your account. Have you ever tried building your own EA, or do you still rely on third-party signals?
Hi,
I saw the question asked before, but the answer was not clear to me. Why are the bollinger bands not symmetric to the centre line (20daySMA?) eg, at any one point, upper and lower band be equidistant from centre-line.
Its mathematically symmetric :). If its not looking symetric, it could be because of SMA vs EMA, or offsetting of chart or log scale chart.
Hello Karthik Sir,
In your 15.4 Checklist you mentioned about Buying indicator and point 4 is
4.There is also a MACD crossover (signal line turns greater than the MACD line)
Shouldn\’t it be MACD line > Signal Line for Buy. Correct me if iam wrong.
We have discussed this in the earlier comments, please check.
Hi Karthik Sir ,
I think There is Mistake In The Check list part point no 4 where you have written
There is also a MACD crossover (signal line turns greater than the MACD line)
As we know that for Bullish Pattern Signal line must be below than MACD Line
So then also you didnt reduce the Quantity ??
We have discussed it in the earlier comments right?
Yes sir !
Sorry, sir, I didn\’t read that comment.
Really sorry, sir.
No problem, happy learning 🙂
Hi Karthik,
Two observations,
1. MACD indicator gives indication quite a bit late. It gives me a signal when the trend has already started. Am I correct here?
2. For BB- If I buy, you said my sell target should be based on average price and If I short, then buy price should be around the average price. Here the average keeps on changing. Do you mean my average price should align with S&R?
Good point about automation – before going live, the real test is how your strategy behaves across different market regimes, not just entry signals. MACD and Bollinger Bands work great in trending conditions, but I learned the hard way that a single EA can\’t handle ranging markets or sudden volatility spikes without blowing through drawdown limits. I\’ve been testing Ratio X Toolbox on MT5, which actually solves this by giving you multiple EAs for different conditions – their MLAI 2.0 has stress testing built in that flags when your strategy would breach prop firm rules before you even go live. Have you considered backtesting your full automation setup across at least 2-3 different market regimes before funding it?
Hello sir I have completeed the module fully I would like to know what tools i can use to identify such stocks and also what is the time frame we should be looking at as per these moudles. The other question I had is do the candle stick patterns need to form at support or resistance itself does a candle forming in between the the supoort and resistance mean it is not a sign to make a trade?
Brijesh, as far as the timeline goes, maybe end of day chart is a good place to start. CS patterns forming at support resistance level gives a lot more confidence to take the trade, at least for me as an individual 🙂
Sir if special candle day is not the macd intersection point than should be go for trade if yes than what should we check about macd before trade.
You can look at other indicators and not just MACD.
Hello Karthik,
I need your suggestion,please help me.
I have read all the indicators and understood clearly.Thanks for it!!!.
Coming to query, Do I need to add all the indicators which you addressed should be on the chart because I feel like make the chart simple.Adding all the indicator may cause complex setup..It\’s just my opinion and I might be wrong too..please suggest me..Do I need to put all indicators.If yes,
1. If all indicators satisfy the trade till then I need to take a trade or
Not all indicators are required then
1. Please suggest as per your experience, which indicator or indicators are good to go.
2. Rather all indicators,if you suggest 2 indicators for example, then I should confirm once 2 indicators gives trade signals?
No, please pick 1 or 2 indicators that you think is good enough and those that you think you understand well and start using it. Adding too many indicators can make things complex as you suggested. My personal preference – moving averages and maybe bollinger bands to track volatility.
Bullish hammer is a recognizable candlestick pattern
The low of the bullish hammer also coincides with the support
The volumes are above average
There is also a MACD crossover (signal line turns greater than the MACD line)…..here the MACD line shld be greater than signal line
Sorry, I\’m unable to get the full query. Can you please elaborate?
Hi Karthik sir i think what he is trying to say is that
in the checklist for going long the MACD line shud be above the 9 DAY EMA LINE
but in the text above under checklist maybe because of an typing mistake it has been typed that signal line turns greater than the MACD line.
Here the MACD line has to be above the signal line right??
Even i came to the comments section with the same doubt
Kindly clarify sir
Thank you
Thats right, it has to be higher.
Is it imperative for a trader to understand statistics?
Its good to know 🙂
Best content, and I\’m enjoying learning this, hats off to you, sir!
Happy learning 🙂
Nice Content very helpful
Thanks! Happy learning 🙂
Good morning, Karthik Rangappa sir!!!
Please tell me the exact formula used for VIDYA moving average in Zerodha Kite. Google gave me some formulas. But it is not matching with Zerodha kite VIDYA data.
Thank you in Advance.
No idea, I\’ve not looked into it. However, I\’d suggest you look at either TradingView or ChartIQ portal for explanation.
Great explanation! i had a question, suppose the MACD line has crossed/is above the signal line, but is still in the negative region. in this case what is to be done? Thanks!
The decision to trade should emerge from the main candlestick pattern, indicators only act as a layer of confirmation.
Hi Karthik! After applying the bollinger bands on to charts, I have noticed that it usually would coincide with the S&R levels. Is that right to infer and is it usually true? If it is can I use to identify S&R levels or at least cross verify the ones I plot?
Also, I am unable to figure out how to post a fresh comment so apologies for replying to a reply!
It need not be true all the time. So I\’d not really depend on BB to identify S&R. If the points coincide, then thats good, else I\’d look for these points separately.
Hi Everybody,
On Kite platform Central Pivot Range is calculated based on HLC values of intraday candle values (High Low values are same for intraday and Daily but Closing value differs) causing huge deviation, often, in CPR Range from Other platforms and Theoretical calculations (because daily close value is not used.) (I am mentioning ChartIQ here). Why this aspect is not taken care of by Zerodha/ChartIQ.
Have you created a ticket and reached out to the support desk, if not, please do 🙂
Hi Karthik,
Just curious on the 12-day & 26-day EMA calculations/ numbers. When I put the numbers in a spreadsheet I find these are SMA… hope I am not missing something.
If this has been answered in any of earlier comments, I will recheck.
Regards
Either works I think, but the indicator is packaged with SMA by default.
Hello,
I think the 4th checklist of the example you used of buying the stock of Karnataka Bank Limited would be \”MACD lines turns greater than the signal line\” instead of \”signal line turns greater than the MACD line\”, or maybe I have not understood??
yeah, thats right. We have discussed in the comments.
Hello,
I have a Question in checklist of the indicator as it is mentioned as Signal line should cross MACD line
But I think it actually opposite
i.e. MACD line should cross Signal line from below
Thank you
Yeah. We have discussed this in the comments section; pls check.
Hi Karthik,
Recently I found some stocks with recognizable candlesticks patterns with confirmed their resistance and support level high and low however, Volumes are not really above average. About indicators, few validating the patterns. Can volume be compromised or to strictly stick by the first 3 points of the checklist and wait.
Thank you in advance
You can trade on reduced quantity. This was you get to validate your findings, plus take lesser risk.
Hi Karthik, again thanks a lot for such detailed knowledge!
I just wanted to mention that you perhaps got it mixed up when writing \”There is also a MACD crossover (signal line turns greater than the MACD line)\” (link attached below for highlight). Shouldn\’t it be that the MACD line crosses over the EMA signal, since that would imply that \”the expections set by the EMA signal line are being exceeded, hence go long!\”
https://zerodha.com/varsity/chapter/indicators-part-2/#:~:text=There%20is%20also%20a%20MACD%20crossover%20(signal%20line%20turns%20greater%20than%20the%20MACD%20line)
True, I\’ve explained that in comments 🙂
Dear Karthik Anna,
In the section \”Key takeaways from this chapter\”, the point number 4 should be corrected. An MACD signal line should be EMA not the SMA. Isn\’t it? Thank you for your time in advance.
Hmm, have discussed this in the comments. Do check 🙂
Dear Karthik,
You have produced excellent education material, I would rate them as THE BEST. They are very intuitive and practical. Thanks for sharing your knowledge with everyone.
I would like to know if you have any videos on Divergences (i.e. price action and indicator showing divergence). We see many terminologies on the net, but not clear if they mean one and the same.
Bullish & Bearish Div
Regular & Hidden Div
Normal & Reverse Div
Positive & Negative Div
I went through your Modules and Videos on TA, could not find any references to these terminologies. Can you pls clarify or refer me to a suitable content?
Thanks Vinay. I was about to share the Youtube channel link, but looks like you\’ve already done that. No specific videos related to divergence, but maybe I can work on it 🙂
Thanks a lot, Karthik for the content.
Happy learning!
Hello Sir
There are majorly lagging indicators in the markets the only leading indicator yet i have experienced are Moving average or MACD , any other leading indicator do you want to suggest sir
In a sense, most of them are lagging only.
In the Checklist, for the Karnataka Bank example, the 4th Checklist talks about MACD crossover for a Bullish move but it says 9 Day MACD EMA is greater than MACD which is suited for Sell not buying, please check on that.
thank you
Sure, checking on this.
Very nice researched and thorough material.
Enjoyed reading every bit of it.
Thanks for a great effort.
Glad you liked it, happy reading 🙂
Sir, in 15.4 – The Checklist text. You mentioned that \”There is also a MACD crossover (signal line turns greater than the MACD line)\”. But, I think you mentioned here wrong because since, Hammer is forming means it\’s a Bullish Reversal Pattern and also Bullish sentiment is confirmed (acc. to MACD) when MACD line crosses the Signal line! But, you did mentioned here that \”signal line turns greater than the MACD line\” means MACD a Bearish sentiment. So, please help me with this doubt SIR!
I am so relieved to read this. I was confused and didnt know where to go for answers.
Sure. I hope all your queries are answered. Good luck and happy learning 🙂
As you give examples of charts in different indicators, what interval are you using or best suited for default values ( Day, month, or week)? Do we need to change when we use interval as month instead of day? I am asking this, because all this knowledge is new to me, and interval is not mentioned when the example is given.
I have a preference for using EOD charts, Abhishek.
In BB how can we find the SD?
The upper and lower band of BB is +2 and -2 SD.
Does the EMA inputs in both MACD and EMA crossover method should be same?
They are same, but work differently.
Suppose we are using both 1.EMA crossover method and 2.MACD at the same time.we know that MACD also uses 2 EMA inputs to plot its MACD line. So question:does the value of EMA inputs in both indicators should be same?
I\’d use EMA directly if I were to choose 1 indicator.
Please ignore this post. I got the answer. I missed the point in context of the whole example.
Thanks.
Sure, good luck 🙂
Hi Karthik,
Hope you are well 🙂
In the checklist section, we took an example of Karnataka Bank. The 4th Point – \”There is also a MACD crossover (signal line turns greater than the MACD line)\”
Should this be? – \”There is also a MACD crossover (MACD line turns greater than the signal line)\”.
Sorry incase I missed anything or for any confusion.
Thanks. 🙂
Yeah, also please check the comments section earlier 🙂
A Small correction \”Traders generally argue that while waiting for the MACD line to crossover the centerline, a bulk of the movie would already be done and perhaps it would be late to enter a trade.\”
We need to replace movie with \”move\”
Ah, thanks. Dont know why I said movie 🙂
Hey Karthik,
While you are talking about the Karnataka Bank Limited eg, in the 4th point when it says there is a MACD crossover (signal line turns greater than the MACD line), shouldn\’t it be MACD line turns greater?
I even read some comments to verify the same.
Could you please confirm?
Ah Krish, we have discussed this in the comments. Request you to check once.
Hi, wanted ask why does EMA work well in upwards market and BB fail to perform in a upward market
btw great content
UPwards markets mean there is a trend, hence MA is fairly ok to us. BB is for volatile and sideway markets.
Hi. I am a little confused here. Earlier while learning MACD, it says that the MACD line should cross the 9 day signal line for a bullish pattern.. However, in the checklist below, at point no 4, it says the signal line greater than the MACD line confirms to the buying decision. Am i wrong here?
Hmm, please see the earlier comments. We\’ve discussed this 🙂
\”The sentiment is bullish when the MACD line crosses the 9 day EMA wherein MACD line is greater than the 9 days EMA. When this happens, the trader should look at buying opportunities.\”
\”There is also a MACD crossover (signal line turns greater than the MACD line)\”
Aren\’t these two statements contradictory? I\’m confused – is it a bullish sentiment when the MACD line goes above the 9-day signal line or when the 9-day signal line goes above the MACD line?
Jai, please see the comments, we have discussed this quite a bit 🙂
I don\’t think that\’s a typo. The signal line is the 9-day EMA of the MACD, so if the MACD is above the signal line which essentially means that the recent MACD (12 day EMA – 26 day EMA) is greater than the previous MACD values. This leads to the conclusion that the 12 day EMA has increased more than the 26 day EMA over the recent days further indicating an increase in the closing prices for the recent days. This should be bullish sentiment only.
These are my views. Also can you point me to the comment where you have discussed about this typo you were speaking of.
Thanks.
This was discussed across multiple comments to this chapter itself, Eshaan.
Thank you for Varsity!
I have a doubt. When to use the MACD and EMA crossover system? Should we use both of them together or only MACD will suffice?
I\’d suggest you stick to EMA crossover, simple and easy to track.
You have yourselves mentioned this in the article.
A trader can follow a simple 2 line crossover strategy with these two lines as discussed in the moving averages chapter and no longer wait for the centerline cross over.
The sentiment is bullish when the MACD line crosses the 9 day EMA wherein MACD line is greater than the 9 days EMA. When this happens, the trader should look at buying opportunities.
The sentiment is bearish when the MACD line crosses below the 9 day EMA wherein the MACD line is lesser than the 9 day EMA. When this happens, the trader should look at selling opportunities.
Ah, i think a typo and we have discussed this in comments if I\’m not wrong.
Basically signal line is a fast which crosses over the MACD line. Signal line is the avg of MACD, so it moves quickly.
Now, hypothetically imagine a situation where you are looking at an opportunity to buy shares of Karnataka Bank Limited. On a particular day, Karnataka Bank has formed a bullish hammer, assume everything ticks on the checklist:
Bullish hammer is a recognizable candlestick pattern
The low of the bullish hammer also coincides with the support
The volumes are above average
There is also a MACD crossover (signal line turns greater than the MACD line)
When the signal line turns greater than the MACD line, isn’t it a bearish signal? Is my understanding wrong?
No, signal line is the faster line and indicates momentum. So that is a bullish outlook.
Awesome insights. @Karthik, what do you think will the right indicators for someone to choose on an average. kindly suggest
There is no right or wrong indicator as such. These are all dependent on the situation and how well you understand the indicator. The better you understand, the more comfortable you are working with that indicator.
4. There is also a MACD crossover (signal line turns greater than the MACD line)
In example that you have given above for Karnataka Bank Limited shouldn\’t it be the black MACD line crossing over the red 9 day EMA for a buy signal?
Ah no, please see the comments, I\’ve explained this 🙂
Thanks for the lucid explanation on bollinger bands. However , I have a basic question-since short selling is only for intra day, will a 20 day SMA be valid?
Secondly, if the the CMP does not touch either the upper or lower band, can we take call?
regards
Yes, 20 day SMA is fine. Yes, you can take a call when the price is closer to the upper and lower bands.
Now, hypothetically imagine a situation where you are looking at an opportunity to buy shares of Karnataka Bank Limited. On a particular day, Karnataka Bank has formed a bullish hammer, assume everything ticks on the checklist:
Bullish hammer is a recognizable candlestick pattern
The low of the bullish hammer also coincides with the support
The volumes are above average
There is also a MACD crossover (signal line turns greater than the MACD line)
When the signal line turns greater than the MACD line, isn\’t it a bearish signal? Is my understanding wrong?
Hey karthik
In the hypothetical situation you added at the end the 4 th point ( There is also a MACD crossover (signal line turns greater than the MACD line)) Shouldn\’t it be instead a bearish signal as the you stated : The sentiment is bullish when the MACD line crosses the 9 day EMA wherein MACD line is greater than the 9 days EMA. When this happens, the trader should look at buying opportunities.
Ah no, I\’m talking about buying when the sentiment is bullish otherwise and the MACD as an indicator is supportive (1st case) and not supportive as in the 2nd case. In the 2nd case, I reduce my buying volume.
Hi Karthik,
One Person request, It would be cool to have a dark theme, it makes it easy for Bing readers like me to read during the nighttime. Kindly consider adding it if possible 🙂
Noted, Ashok. I\’ll share this feedback with team. Thanks.
Isn\’t MACD an indicator that looks to follow trend when seen in hindsight? In realtime does it help with making Intraday or Long Term buying/selling decisions?
Most indicators are lagging that way. The idea is to catch an existing trend and ride along, and not really time it to catch the start of the trend.
while initiating trade which indicators do we have to look, all or specific one
The ones you understand fully and are comfortable using.
Please let me know, in all these studies, what time period we have to keep? say, 1 day, 15 minutes, 30 minutes, etc?
Its end of day, unless specified.
Hi,
In first table headings are 12 Day EMA and 26 Day EMA. But it calculation it is SMA instead of EMA.
What is correct, headings or calculations?
Its the EMA, Ravi. Let me check once. Thanks.
Thanks Karthik
Will watch how this pans out, will be an interesting case study
Iqbal
Happy learning!
May be a spelling mistake here. \”the\” -> \”they\”?
\”Scale the size higher if the confirm\”.
Yeah, kindly excuse. We will fix it 🙂
Not sure if it is intentional. May be it has to be \”move\” instead of \”movie\”.?
\”a bulk of the movie\”
Oh yes, typo 🙂
Hi Karthik,
Let me begin by appreciating the effort you have put into creating a really fine resource you and the team have creased in the form of Zerodha Varsity. Great job!
Have a quick one on MACD, how does one interpret the following scenario.
On a specific stock, on the daily chart the blue line crosses over the red line (from underneath), suggesting a buy a signal however concurrently on the weekly chart, blue line crossing below the red line (from above). (This is the set up on NTPC as of today (13-11-23)
Which direction should one set up the trade in a scenario that is seemingly contradictory?
Thanks
Iqbal
Thanks Iqbal. So this depends on the frequency of your trade. If you are going in for a short intrday or swing trade, maybe you can set up a long. But for the longer term basis, you need to think otherwise as the trend seems to indicate bearishness.
On which platform where you teaching about the indicators and different averages . Means i am new so want to practice so can anyone tell me where can i practice these things .
Its there here and on Youtube.
Sir,
In my previous query, I like to mean that if I enter in a trade say at the lower if BB through purchase. Then the candles further broke below i.e, envelope is expanding. In this scenario, at what price should I exit since price is not going up?
Then you need to have a fixed % as a target. For example, 3% below the lower band you could consider exiting the trade. Should be 3% or 5%, you should be able to assess for yourself based on risk appetite.
Sir,
In case of BB, is there any intimation price point at which we can exit a trade if it is going otherwise from expectation?
In case of BB, the upper and lower bands do act as a trigger points to enter or exit the trade.
If 9days EMA is greater than MACD line then Bullish
IF 9days EMA is less than MACD line then Bearish.
IS its correct sir or I am getting it wrong.
Please clarify.
Thats right, Raj.
Hello Sir, Really enjoying Learning and applying same in trading thank you so much .I have a confusion related to MACD crossover with signal line.
In MACD section you have mentioned
-The Sentiment is Bullish when MACD line is greater than 9days EMA
But in Sub-bullet points number 4.
you have mentioned \”signal line turns greater than MACD line\” then we can place Buy order.
Please clarify MACD crossover when long and when short.
Thanks, Raj. We have discussed this in detail in the comments. I\’d suggest you give it a quick check 🙂
Hello Sir,
Thank you again, I tried to find Books list you have suggested earlier but couldn\’t find. It will great if you list down the Books for F&O trading.
The suggestions are in the last chapter, Raj.
Good morning sir,
Sir Can you please suggest some good books on how to find true value of stock apart from DCF method because some companies are irregular in terms of generation cash flow or any other method through whick we can find tre value of stock
Gaurav, check this – https://zerodha.com/varsity/module/financial-modelling/
Hello Sir, Thank you for such a wonderful information. I have some questions please provide your thought
-Can I use all this technical analysis knowledge which I have learned through Varsity with F$O trading specially on Index?.
-Is there any plane to Update this course.
-Please suggest some good book Related to share market / Technical Analysis/ Books Related to F$O trading.
Raj, you can start with small trades and see how well you\’ve picked up the concepts. But before you trade, do backtest your strategies. I\’ve recommended books in the last chapter I guess.
Hello Sir,
Can we make the decision only on the basis of two exponential moving average as explained in moving average chapter. Like 9 Vs 21 EMA, 50 Vs 100 EMA etc. without considering other factors like candles, S&R etc.
Yup, you can. Its one of the simplest techniques and I personally like it 🙂
Thank You Sir for detailed explanation.. i will be reading all the modules on varsity for sure..
Happy learning, I hope you continue to enjoy reading on Varsity 🙂
I think below line is not in line with the MACD indicator ?
4. There is also a MACD crossover (signal line turns greater than the MACD line)
We have discussed this in the comments section, Ramesh.
@Karthik- I would appreciate your efforts and Zerodha team to publish excellent learning content which is explained in a simple manner.
Thanks for the kind words, Jaspal! Happy learning 🙂
Sir,
When taking indicators into account should we individually check for indicators and then take an average of results or is it a necessary condition for all indicators to align before making any decision, i.e. is it an if condition or and condition?
Thank You.
Ideally, stick to 1 or 2 indicators and not more than that. More indicators can give you conflicting opinions 🙂
No need to take averages.
Sir,
I am finding difficulty to identify the support and resistance after trade execution to make the target since, I am finding lot many zones available.
I would like to know if there is any simpler way to point out which ones to consider and which doesn\’t.
N.B: I am already considering atleast 3 zones with atleat 1 fortnight apart.
Do check this once – https://www.youtube.com/watch?v=UBkCkBme2Hg&list=PLX2SHiKfualH_xMbGM-3zWC47s9gUjGR_&index=8
Sir,
Suppose I have setting MACD (12,26,9). Now, when I am setting the time frame to 1D, do it automatically takes values from past 12 days,26 days and 9 days and show result. Also, if I use it for intraday (say 1 min/5 min/10 min/15 mins) with same settings, does it automatically takes values of the past 12 candles, 26 candles and 9 candles and show?
If this applies same for RSI also like it takes into consideration of the past 14 candles (RSI set at 14) accordingly(whether set to 1D/1 min)?
Yes, it does, its changes based on what timeframe you set. Same thing for RSI.
i wanted to know about ichimoku indicators
Have discussed it here, please go through it.
Kindly inform me the settings and its operation of the Stochastic indicator and oblige.
Please use the default settings.
Sir, When the 9 day EMA of the MACD line is greater than MACD line, do it signal to long or short?
It means the short term trend is picking, so long.
Hi Karthik,
I reading it from past 1 week. it is always excited to read every chapter and always in eager to start next chapter.
Thanks a lot for your hard work to build this awesome learning material.
I have 2 questions for now,
1. what parameter we need to use in zerodha to highlight average volume?
2. Most of the times i couldn\’t find support and resistance level since i couldn\’t find price points in the same line even in 1 year time frame, what we need to do in that case?
Thanks.
Glad you liked the content, Saravana.
1) You can use a 10-day simple moving on the volume to identify the above-average volume
2) You can slightly change the timeframe, maybe load 1.5yrs data?
Sir,
Request you to review the snapshot (identified a trade) in the below link and provide your input:
https://1drv.ms/u/s!AmFuhfJtZ3c452UmhtR2RPFagvHb?e=TtkDT1
Regards,
Arora.
Yeah, looks like a bounce from the triple top.
In Checklist plz correct this There is also a MACD crossover (signal line turns greater than the MACD line)
Checking on this.
Hey Karthik, first of all I wanna say that I am really excited learning upcoming module F&O
I got a doubt
SL in the case of BB would be the low of the candle on which we purchased call for going long?
Thats right, Saurabh, assuming you are long. SL will be the upper band if its short trade.
Signal line is 9 day SMA or 9 day EMA? It is stated as 9 day EMA in chapter but in key takeways (4) its 9 day SMA
It is EMA.
in asian paint example correction..
since signal line is close to market price and volatitlity and MACD is plotted on large number of data points.
So to explot favourable opportunity
when signal line > MACD line ….go for long…as trend is to change towards getting up.
when signal line <MACD line …..gor for short….as trend would start to go down now
YEs, please see some of the recent comments where we have discussed this.
hello Kartik sir
should i refer to website varsity or the mobile app varsity?
if the answer is website varsity, what should I do if I\’ve already done 1 module and am about to complete the technical analysis module?
You can refer to either web or the app. What is your preference? Would you like active trading, then maybe look at F&O. Else, if investing interests you then check out the module on Fundamental analysis.
Hello Karthik sir. I had a really big doubt which needs to be clarified quick before I proceed with the course.
should I study from the app or the website?
i had looked into both but I felt that the app was better since it was more structured, had the same content and explained it well. however, I was directed to look at the website by one of the cards in the indicators chapter that\’s part of advanced stage in technical analysis. I\’m now a little concerned whether the app covers all the concepts needed.
hence, my question is this–if one has already started from the app, is it fine if they continue using it? or should they switch to the website version as soon as they can? cause I\’m already coming to a close on this module as well but I\’m concerned that the learning is not sufficient.
Not sure why the difference. Let me check. Meanwhile, stick to either the app or website and complete it. For reference, you can check the other place after you are entirely done learning on one portal.
In MACD example of Asian Paints, Obove the line , lower the line…..to be considered BEFORE the Crossover, OR, AFTER the crossover.
How can one make a use of RSI and MACD for a saleable trade as it only works in sideways trend where Momentum is very less
YOu cant. For a sideways market, you need to pick indicators that work well in sideways markets.
Thanks for the education Karthik. I have question on the checklist point to (volume). While trading options on Bank Nifty how do we consider volume? Bank Nifty being an index does not have volume. Any suggestions or alternative here please?
Pratik, I dont know what you did, but there were at least 30 spam messages from your id.
You can consider the volume in their respective futures contract.
In BB you said when price at +2sd(upper band) then short as expect that it will retrace average(20day SMA) but can we think opposite to that i.e.buy on average(20day SMA) and hold till reached +2sd(upper band) and same for lower band vice versa,
And please suggest what will be the stop loss in BB while buy/short.
Yes, you can look at BB for setting up both long and short trades.
I have checked sir , but sorry still confused, can you elaborate please when to buy and sell according to MACD line and signal line.
Sorry but i have read you previous comment but not able to get clear.
Neeraj, I\’d suggest you look at MACD (I stand corrected). Btw, for momentum and volatility Bollinger band is a much better indicator in my opinion 🙂
Means Above asian paint chart is correct MACD line(black line) is above signal line(9day EMA) then its buying opportunity and when signal line(red line) is above MACD black line then its selling opportunity right na?
Also faisal mohammed comment is right?
Please check my previous comment, Neeraj.
So,its a buying opportunity when MACD line moves over/above the Signal line(9 Day EMA), selling opportunity if MACD falls below the Signal line. Right?
Above Faisal Mohammed comment is correct is it right?
Faisal Mohammed says:
February 5, 2018 at 11:18 am
Shweta, its a buying opportunity when MACD line moves over the Signal line(9 Day EMA), selling opportunity if MACD falls below the Signal line.
Read it through, don’t find any contradictions.
Karthik Rangappa says:
July 15, 2021 at 7:08 pm
The reason is that the signal line is a fast line, reacts quicker since it’s the average line.
Varun says:
July 25, 2018 at 12:59 am
it should be when “MACD line turns greater than the signal line”
what people are missing is, signal line is EMA of MACD not price, hence it will always be less reactive to price and smoothen out changes in MACD line.
Hi sir,please read above three comments,still confused. Varun says signal line is reactive more since it is EMA of MACD not of price, you are saying different, And lastly In, Faisal Mohammed comment he opinion is different, but in this chapter above chapter of asian paint chart is in favor of faisal mohammad sayings, and what you are saying is against above chart. quite confused, in above chart MACD line(black) is above/greater than signal line when bullish, And Signal (red) line is above black line(MACD) when bearish, Please clear my doubt deeply throughly i am stuck.
Neeraj, my bad. So its like this – a stock and an average on stock. Stock will always lead and we take action when the stock price crosses the average. So in this case it is MACD (equivalent to stock) and then the signal line which is equivalent to the average. So go by MACD. Sorry about the confusion.
is above asian paints chart MACD line and signal line is correct now?
Yeah.
i understood sir that is signal line but my question is different ,in above chart in bullish trend MACD line is above signal line and vice versa, but in above comment of gokula said that signal line is more reactive so it should be above MACD line in bullish trend and vice versa. but above chart its opposite of that, in bullish MACD line is above signal line .. quite confused,please clear my doubt.
I think there is confusion Neeraj. It is unlikely that the MACD line is higher than the signal line. Id suggest you observe more charts to check if you notice a similar pattern.
GokulaZerodha says:
May 5, 2016 at 4:35 pm
Hi Karthik,
Was the correction made in MACD?
And also I bit confused here that how can a signal line (which is fast and more reactive than MACD) actually lie below MACD when the trend is up? this seems quite opposite to EMA. 9 SMA (Signal Line) should move over MACD when the trend is up since 9 SMA is recent and should be fast and more reactive than MACD. Please correct me if I’m wrong. I can understand all other concepts quite easily but getting confused here.
MY QUERY BELOW-
In above comment in 2016, it is mentioned that signal line(9 day EMA) is fast and more reactive hence should be above MACD line when trend is upwards , But in above chart when trend is upward then MACD line(black) is above 9day EMA line(signal line/pink line) and vice versa. SO what is correct when trend is upward and downward ,which line should be above and below accordingly.please explain
It is the signal line Neeraj.
( Higher the magnitude of the MACD, the more strength in the downward trend.)meaning
Excellent tutorials, thanks.
Happy learning!
Sir, I am new to Varsity and learning the topics of technical analysis for the last 15 days. Before proceeding further, a big thank you for you and your team on Varsity contents. I have gone through various candle sticks patterns mentioned here but I came to know that there are few more candle sticks patterns like Three White Soldiers Three Inside Up, Tweezer Bottom, Three Outside Up, On Neck pattern, Three Black Crows, Three Inside Down, Tweezer Top, Three Outside Down, falling three methods, Rising three methods and Mat hold. I have not seen any topics of discussion on these candle stick patterns. Just wanted to know if these candle sticks are less relevant or irrelevant before initiating a trade based on technical analysis.
Sriram, thanks. I\’m glad you liked the content on varsity. Yes, there are many more patterns in candlesticks which I\’ve not explained and the reason is simple. End of the candlestick pattern is all about know what is happening with the price action. Notice the three things – what is the prior trend, what are the candles doing? isit signaling a bullish outlook or bearish one, and then take a call on your trade. If you do so, then you dont really need to prepare a list of candles and learn all the patterns.
This leads to another question that what is the main purpose of cross-overs?
1)To avoid trades when the market is sideways.
2)To take quality trades when the market is sideways.
3)Both of the above.
Guide for the same.
Thanks in advance!
Both actually, but to pick quality trades in sideways market you need tons of experience.
Also we used cross-overs to avoid trades in sideways market.In MACD we by default consider two averages which we can say is a cross-over in itself.So can we say that it is more reliable in sideways market or is it that even if we use cross-overs it can give us trade indications in side way markets as well?
Guide for the same
Thanks in advance!!
MACD is more of momentum, but you can repurpose it to identify sideway markets. But I personally prefer using a simple MA instead.
Can we use any other EMA than the traditional 9 day EMA for the signal line?
Thanks in advance!
Of course, you are free to experiment and check what works for you.
Hi Karthik, if a stock is neither in an overbought nor in an oversold zone, i.e within the 30 to 70 RSI range; can we safely rule out the possibility of an envelope expansion while looking at BB signal?
Although intuitive, I\’d still suggest you verify the BBs to see what signal it shows.
What does mean of the Fast MA period Slow MA period Signal Period
Slower MA = Lower moving average, like 21 day EMA.
Fast MA = Higher moving average, like 9 day EMA.
Depends on your EMA pair. For example, if you consider 50*100
50 is fast and 100 is slow.
hello, i am a bit confused here firstly how do we calculate the Standard deviation in a bollinger band and , secondly if all the indicators are relying solely on moving averages than arent we supposed to get the same assumptions.
Bollinger band has an inbuilt SD calculator which does this math. Most indicators use MA as an input, but then it goes through its own set of logic which yields different results.
Hi… karthik just wanted to say hi hope u are doing well hats off to you man you\’ve replying to all the comments since 2014 clearing peoples doubt
Thanks 🙂
Happy reading!
Thanks for the education Karthik. I have question on the checklist point to (volume). While trading options on Bank Nifty how do we consider volume? Bank Nifty being an index does not have volume. Any suggestions or alternative here please?
YOu can check the futures trading volume as a proxy.
I know standard deviation concept. I am talking about \”STANDARD DEVIATION INDICATOR\”. There is an Indicator called \”Standatd Deviation\”.
Kindly provide comprehensive details about \”Standard Deviation Indicator\”. What can we interpret when SD is 1 or 10 or 40 or 80 or 150. What can we infer with respect to the price of stock if \”SD Indicator\” is :
1. High for short term
2. High for a long time
3. Low for long term
4. Low for a short time
What can we expect when we combine RSI with \”SD Indicator\”? What \”SD Indicator\” tells with respect to volatility and price? Is there any range for SD ?
Also what is the best input or settings for \”SD Indicator\” ? Like what should be period with respect to deviations or if deviation is 2 then what should be period?
Sometimes the \”SD Indicator\” indicator is 90, sometimes it is less than 10. How can we interpret this indicator?
I\’m sorry, dint realizes that. I dont know how that indicator works, I;ve not used it earlier. Will try and figure once.
I want to know about an Indicator provided in the Chart namely Standard Deviation Indicator. I want to know about the indicator as I am not able to find satisfactory information about the Standard Deviation Indicator.
Kindly provide comprehensive details about standard Deviation. What can we interpret when SD is 1 or 10 or 40 or 80 or 150. What can we infer with respect to the price of stock if SD is :
1. High for short term
2. High for a long time
3. Low for long term
4. Low for a short time
What can we expect when we combine RSI with SD? What SD tells with respect to volatility and price? Is there any range for SD ?
Also what is the best input or settings for SD? Like what should be period with respect to deviations or if deviation is 2 then what should be period?
Sometimes the SD indicator is 90, sometimes it is less than 10. How can we interpret this indicator?
Anupam, I\’have explained the concept of standard deviation here – https://zerodha.com/varsity/module/option-theory/ , look for it chapter 15 and 16.
Sir, in the checklist para,
it is given as \”signal line crosses over the macd line\” but
it should be \”macd line crosses over the signal line\” for long – crt sir?
Its the signal line only, Muthu.
Do we need to calculate SD
Not necessary since the indicators factors in the same.
Thank you very much
Good luck!
Dear Mr Rangappa,
I\’m referring to my last message and your kind reply. I\’m still not able to decide as to what shall be the deciding factor for bullishness while using MACD…what should be greater 9 signal or 12 over 26 day EMA. An objective answer is expected and would be appreciated.
Thanking you in anticipation
If the MACD signal line is higher than the MACD line, it is bullish. Bearish otherwise.
Hi sir How are you doing? I have seen all your replies. It is mind boggling. It\’s is purest form of dedication.. your will reach higher level.
One doubt sir.
What is the number plotted at side of macd indicator? Above and below zero line ..
How it derivates.
For example ; today Feb 7th 2022
In 5 minutes candle For asian paints above and below zero value shows… 3,5,8 so on -3,-5,-8 so on..
In 5 minutes candle for Honeywell automation above and below value shows .. 25,50,75 so on and -25,-50,-70 so on..
Why side values show huge difference between both stocks….
And how those values derivates…..
How to utilise those values for trading Sir….
Final doubt sir – what does mean this below code ? What is 0.5 here?
( 15 minute Macd Line ( 26,12,9 ) – 15 minute Macd Signal ( 26,12,9 ) ) > .5
Thanks lot sir. May god bless you 🙏
Thanks for the kind words 🙂
It represents the spread of the MACD. The value of the spread depends on the stock price…if the stock price is high like 500 or 800, then the spread will be high, it will be less if the stock price is less like say 30 or 50 Rupees. MACD line can either be above or below the 0 line.
Hi, could you please tell with regard to MACD, when will it be bullish whether the MACD(26 and 12) line is over or under EMA 9. Thanks
Shahwar, we have discussed this in the chapter itself, do take a look. Also the comments as well.
Hmmm. Its 2022, and here I\’m – not late ig. ( yaah, maybe 8 yrs late) 😉
But, I just cant continue reading without a word of appreciation.
A big thanks that you hadn\’t made this a paid platform…
Its never too late, Thomas! Happy learning 🙂
I am really grateful that you created this content, it is amazingly simple but so powerful.
Thanks for all your efforts.
Happy learning, Ritvik! Glad you liked the content 🙂
Hi Karthik!
Is there specific reason that BB does not use EMA? If yes can you please elaborate. Thanks you!
Ah, I\’m not sure why. Maybe that would be over engineering 🙂
I\’ve just browsed the comment section and yes, there seems to be a lot of talk regarding the Karnataka bank example. I read through a few and there is some contradiction even in the comments. So, in a nutshell, I will assume that the following statement is correct:
\”It is a bullish signal when the MACD line crosses the Signal line wherein MACD is greater than the Signal\” (Hope I\’m not wrong)
My other question still stands though: If I had to choose only one, would you suggest me the Moving Average Cross Over System or the MACD improvisation (signal line + MACD)? Since both are essentially MA based systems, I feel checking both could be redundant and might give me mixed signals. Please let me know if that’s the case and what is a relatively more accurate choice.
Yes, it is redundant in my opinion as well. I\’ll stick to just moving average for its simplicity. As far as the MACD and signal line is concerned, please seem my previous comment. I hope that clarifies.
MACD = Average of two moving averages
Singal line = Average of MACD
Hi again, Karthik
Great article once again. If I had to choose only one, would you suggest me the Moving Average Cross Over System or the MACD improvisation (signal line + MACD)? Since both are essentially MA based systems, I feel checking both could be redundant and might give me mixed signals. Please let me know if that\’s the case and what is a relatively more accurate choice.
With regards to the Karnataka Bank example, the following is written in the article:
\”On a particular day, Karnataka Bank has formed a bullish hammer, assume everything ticks on the checklist:
Bullish hammer is a recognizable candlestick pattern
The low of the bullish hammer also coincides with the support
The volumes are above average
There is also a MACD crossover (signal line turns greater than the MACD line)\”
If I\’m not mistaken, a correction is required in the last line, isn\’t it? it would be a bullish signal only if MACD line is greater than Signal line.
Please let me know if I\’m correct.
Best,
Shashank
I\’d choose the moving average system for its simplicity 🙂
The signal line is an average of the MACD line, which means the signal line will move faster and give frequent signals compared to the MACD line itself.
Hello Karthik,
You explain each n everything superbly. Sorry but I couldn\’t find Heikin-Ashi technique used in intra day trading. Please post link while replying me.
Thanks
Neha, I\’ve not covered Heikin-Ashi in Varsity, I\’m myself not very familiar with it.
Hi Karthik,
Bullish hammer is a recognizable candlestick pattern
The low of the bullish hammer also coincides with the support
The volumes are above average
###There is also a MACD crossover (signal line turns greater than the MACD line)##
I think MACD line would be greater than signal line. Am I right?
MACD line depends on how the market or stock has moved over the last 14 days. Remember its an average, so cant really comment based on 1 day\’s movement.
Hi Karthik
You have mentioned that whenever MACD line crossovers 9-day signal line and is above the Signal line we should look at buying opportunities
But in the example of Karnataka bank shares, u have mentioned opposite
\’\’Now, hypothetically imagine a situation where you are looking at an opportunity to buy shares of Karnataka Bank Limited. On a particular day, Karnataka Bank has formed a bullish hammer, assume everything ticks on the checklist\”
\”There is also a MACD crossover (signal line turns greater than the MACD line)\”
please clarify these
Sarvesh, we have discussed this in the comments section already. Can you please take a look at this? Thanks.
Karthik sir, I assume that in Techinical Analysis you explained 3 trading strategies
1. S & R – Buy near support & sell near resistance and vice versa (with other checklist points)
2.Moving Average crossover strategy
3.Breakout/ Breakdown strategy
Am i right Sir?
Yes, plus each candlestick pattern is a strategy on it own 🙂
Can you please tell me how should I counter that?
Yes sir I take trades only and when there is a candlestick pattern but I look for the candlestick pattern when the stochastic is in overbought or oversold region in the current trend direction ( like if uptrend then stochastic should be oversold or if downtrend then it should be overbought). But sometimes if there is an uptrend and the stochastic is oversold I look for bullish reversal candlestick patterns but sometimes the stochastic remains in that region for a long time and the trend changes to downtrend.
Yeah, over time you develop a pattern here and figure the right balance between patterns and indicators. It takes sometime, but its possible 🙂
Hello sir,
I have a doubt regarding momentum indicators such as rsi and stochastic.
Sometimes when there is a downtrend and then the trend is changing to an uptrend so stochastic and rsi tend to be in overbought for a long time it leads to many whipsaws as I look for bearish reversal candlestick is those overbought conditions and encounter many false signals.
Can you please suggest me how to counter this? (I am sort of trying trend trading by buying pullbacks)
I\’d suggest you always pay more attention to the candle patterns over these indicators. Patterns in my opinion are more reliable, indicators give conflicting opinions.
the MACD (with signal) seems to be enhanced version of EMA System we built in earlier chapter. Can we use the time period of that system ( 9 with 21, 25 with 50, 50 with 100 days ….) with MACD?
Yes, you can calibrate the MACD lines to whatever you think suits your trading temperament.
Signal line is a 9day EMA of MACD or is it 9day SMA of MACD?. Given as SMA in key take aways.
I think there should be a correction in 15.4 where we are talking about Karnataka Bank Ltd example. Point 4 says -\”(signal line turns greater than the MACD line)\” it should be opposite \”(MACD line turns greater than the signal line)\”.
Checking this.
sir
one question even bollinger band s upper limit or band expanded should we wait for its reversal putting a small stop loss ? because the view behind is this that eventually the increased price will come back to it average price .
If the band is expanding, it means there is momentum picking up. So you may want to use this as a contract indicator and take a trade in the direction in which market is moving.
Hi Karthik,
could you help me out understanding the logic behind MACD and signal line crossover, why is it expected to be bullish when MACD crosses signal line and vice versa.
I\’ve tried to explain that in the chapter itself, Jaswanth.
No explanation available of MACD HISTOGRAM which is visible in Zerodha charts.
Please share the details like meaning of colour code of MACD histogram along with- ve and + ve directions.
Lalit, please check the queries, we have a lot of discussion going on regarding the same.
Which indicator to use relative strength of a stock visa vis the benchmark index (Nifty 50)?
You can use any simple RSI for this.
A comment just to appreciate your effort in putting this together over the years. It\’s a lot of work I can imagine. I can confidently say I have gone from 0 to at least 4. I really vibe with your content. Being a software developer I do documentation and it really relates to the structure that I do. I am happy I found this. Crisp and clear. An elaborate thank you but it justifies the effort you put in. Thanks, Karthik.
Thanks for letting me know, Prasanna. Happy learning and I hope you continue to learn and hit 10 soon 🙂
Good luck!
Hi Karthik,
I could not go through all the comments to get the exact answer. But I got the funda that the signal line is a 9-day EMA of MACD. So I understand that 9-day EMA of MACD will be faster to react than the actual MACD itself.
Thats right, Sathya.
Hi Karthik,
Hope my question is not already answered – since there were many comments, I found it difficult to go through all of them to check.
My question is about MACD: I understood the concept and how it is applied. But I want to understand why the signal line crossover is earlier than centre/zero line crossover.
Let us consider an uptrend being developed: Assume 12-day EMA crosses 26-day EMA from below and at the cross-over, the MACD value is zero and increases when uptrend continues and price goes up. My question: For MACD value to cross 9-day EMA (signal line) before centre-line (Zero), the 9-day EMA must be below zero which is not possible. So does it mean that before the 12-day EMA crosses 26-day EMA, the MACD value (which will be negative), crosses the 9-day EMA?
Yes, its already answered 🙂
The reason is that the signal line is a fast line, reacts quicker since it\’s the average line. Request you to check the earlier queries, you\’ll get all the answers 🙂
Hi Karthik,
Did not receive any explanation from you regarding symbols like “N”, “S” and “B” beside the values of different Oscillators and Moving averages in Technicals section in \”Streak\” inside Kite. Kindly provide one for better understanding. Regards.
I think this stands for Neutral, Sell, and Buy. I\’d suggest you write to streak\’s support for this for a better understanding. Thanks.
How many indicators shall one refer to especially for intraday trading? Just to make it less complicated
I\’d suggest 1 or 2 that you understand really well 🙂
In the example of Karnataka bank ltd in the 4th option isn\’t the MACD line crosses the signal line?
Hi Karthik,
While viewing Technicals of a stock inside kite, there are marks \”N\”, \”S\” and \”B\” beside the values of different Oscillators and Moving averages. Kindly explain what do they mean.
Need to check this, will get back to you.
Can you please throw some light on the MACD histogram and it\’s significant for taking a buy or sell call.
Will try to add.
How to calculate SD?
SD? You mean standard deviation? If yes, I\’ve explained the same in the Volatility chapter in the Option module.
Sir,
How will we calculate the SD in BB.I didn\’t get that.Please help
The upper and lower band of BB is the SD.
Hi Karthik,
How to plot ma(50,c,0,false) in charts
You can do this on Kite. Select MA as your indicator in studies.
How plot ma(50,c,0,false) in charts
Where I can find false signal option in moving average indicator … like this one … ma(50,c,0,false)
Thanks
That\’s not a false signal, Venu. Only an option to offset. You can ignore the true/false bit.
The below two statements are contradictory, could you confirm which case should be considered as bullish and go for a buy?
1. The sentiment is bullish when the MACD line crosses the 9 day EMA wherein MACD line is greater than the 9 days EMA. When this happens, the trader should look at buying opportunities.
4. There is also a MACD crossover (signal line turns greater than the MACD line) Note: This line is captured From checklist section.
Regards,
Siva
Siva, we must have discussed this multiple times in the query section. PLease do check the same.
Kindly clarify this.
There is a confusion regarding MACD and signal line. In the chapter you have mentioned \”The sentiment is bullish when the MACD line crosses the 9 day EMA wherein MACD line is greater than the 9 days EMA. When this happens, the trader should look at buying opportunities.\”
On the contrary, you have also mentioned \”There is also a MACD crossover (signal line turns greater than the MACD line)
With all four checklist points being ticked off I would be happy to buy Karnataka Bank. Hence I place an order to buy, let us say for 500 shares.\”
Kindly let me know which one is correct.
Please see the comments, we have discussed this many times.
I deal only in Equity delivery. Which is the best indicator- RSI / MACD / BB
It depends on the market condition.
Dear Karthik,
I\’m grateful for your content. In the Karnataka Bank illustration, I hope that the MACD crossover to be bullish; the MACD line has to cross above/greater than the signal line. Correct me if I\’m wrong. Thank you.
Senthil, the trigger should be from the signal line. Remember, the signal line is the average line over the MACD line, so its the signal line which acts as the trigger.
hello, karthik,
in a book called the handbook of technical analysis, there is a term called dominant half-cycle period for optimizing oscillators and there were some calculations in it based on which we can optimize the period for the indicator/oscillator for efficiency. can you please give me some information on it?
About how to count the wave cycles etc. on this topic?
thank you.
Ah, thats something new to me as well. Not sure what it means, although it\’s something we would have come across it at some point. Let me research a bit.
I guess theres some confusion in MACD?
In MACD theory it is mentioned that\”a crossover where the MACD line lies below the signal line (9 day EMA) lies and suggests a short trade.\” whereas in Bollinger Band u mentioned that \”There is also a MACD crossover (signal line turns greater than the MACD line) so u can go long\”.
Could you please clear the doubt?
When we refer to MACD cross over, it\’s usually with reference to the signal line, Aarti.
First of all superb content, thank you for teaching us TA in easiest possible way.
however i saw one mistake
At first while explaining MACD you said \”A 9 day EMA of the MACD line is called as the signal line\” but at the and in key takeaways section you said SMA instead of EMA.
Ah, thanks for pointing that out. Will try and change that 🙂
Okay so if I want to trade on an EOD timeframe and so I want to look at MACD for confirmation so should I look at a weekly chart or monthly chart for confirmation (MACD)??
I\’d suggest you look at the daily/EOD chart.
Karthik,
Am still not clear, MACD chapter 15 – 15.1 mentions that MACD line should be greater than the signal line. Even if I assume it is a typo as per your above reply (signal should be greater than MACD) it is not aligning with my analysis. In this link https://www.tradingview.com/x/mhqsIE9W
whenever in uptrend MACD line is higher and in a downtrend signal line is higher.
Sorry I am not bothering you, its stuck with me as I can\’t move further to other chapters
Thanks
Let me recheck this again to see if I\’ve made a mistake. But from my personal experience, don\’t spend too much time on indicators. Candlestick patterns are far more effective.
Amazing course this. Useful information, kept simple and free of cost.
Happy reading, Prakash 🙂
Hello, I wanted to know if I can use just the angle of the MACD line on a higher timeframe. Suppose I want to take a trade on an EOD chart but just to check if the momentum is aligning to my trade can I use just the ANGLE of the MACD LINE on a higher timeframe like weekly or monthly?
Thank You. 🙂
Maybe, I\’ve never used this, so I\’d not be in a position to comment.
QUOTE
Now, hypothetically imagine a situation where you are looking at an opportunity to buy shares of Karnataka Bank Limited. On a particular day, Karnataka Bank has formed a bullish hammer, assume everything ticks on the checklist:
1. Bullish hammer is a recognizable candlestick pattern
2. The low of the bullish hammer also coincides with the support
3. The volumes are above average
4. There is also a MACD crossover (signal line turns greater than the MACD line)
With all four checklist points being ticked off I would be happy to buy Karnataka Bank. Hence I place an order to buy, let us say for 500 shares.
UNQUOTE
Dear Karthik,
The above extract is from Chapter 15 – Indicators (Part 2) – 15.4 The Checklist
As per the example quoted, the trade setup is for a long position for which Bullish hammer forms in the first point after a downtrend, support coinciding with the low of the hammer, volume is substantial – All Check and ok
But I can\’t get the fourth point clearly – As per the explanation on crossover between MACD with the signal line, it will be a long call if MACD line turns greater than signal line, but in the above point 4 it was mentioned otherwise (Signal line to be greater than MACD line) to take a long position is implied by placing more bet on this indicator
Could you please explain whether I am missing any point here
Thanks and by the way your contribution to all the newbies to stock market in enhancing their knowledge is really appreciable
Regards
Mohideen, it must be a typo in the MADC chapter. Its the signal line which has to be greater than the MACD line. Remember signal line is the average line.
Sir,
what is ideal time frame of chart for short term trade analysis by indicators?
I\’d suggest at least 6 months.
Sir,
But in the chapter it is written that The MACD line should be greater for buying opportunities.
Let me check. Its the signal line.
Sir, I have one doubt in the the checklist portion. In an example of Karnataka Bank, all the bullish sign given to buy the stock including bullish hammer, stoploss near support, Average volume etc. But in MACD signal its telling \”Signal line turns greater than MACD line\”. Actually what we learn in topic i.e. MACD line should be above of signal line. or MACD line > MACD signal line.
Please clarify this
It\’s the signal line that should be greater. Guess I made a typo, let me check.
Thank you so much Karthik for all the lessons. Really appreciate it.
Happy learning!
In Bollinger Bands, how do you calculate Standard Deviation? You just give example of 75… for other stocks how to find standard Deviation explain me…
Thanks in Advance
Standard Deviation is Bollinger Bands. Have explained in the chapter itself.
Sorry I was wrong. I was reading it in wrong way.
Both values do match more or less.
Good luck!
I am currently using Tradingview also in addition to Zerodha Kite platform. I found difference in calculation when I was using Pivot Point indicator. (on 15 min chart, R1 for Nifty was 14720 on Kite and R1 for Nifty was 14784.)
Are there different calculations used on Kite platform than trading view.
Dear Karthik Sir,
The content provided by you is so simple and fun !
Great reading this and a part of zerodha varsity.
My doubt is regarding signal line which initially you defined as 9 day EMA of MACD.
Later in chapter it was mentioned that MACD line is the trend deciding line if it goes up above signal line it will be bullish and vice versa. Till here it was ok.
But later in checklist and takeaways it was mentioned that Signal line is 9 day SMA and also the bullish signal comes when Signal line goes above MACD line.
Would be great if you clarify what to follow.
Thanks, Aman, yes, I think there was confusion with this earlier as well. I have posted few comments rectifying this. Can you please check? Thanks.
Alright, checked the previous comments for this example….
It is very helpful and easy to understand
Happy learning!
In section 15.4 – The Checklist
Karnataka bank Ltd checklist pt. No.4 : \”There is also a MACD crossover (signal line turns greater than the MACD line)\”
For the indicator to be bullish, this should be viceversa, correct? i.e it should read, \”(The MACD line turns greater than the signal line)\”
The signal line is the faster one right? We take cues based on that.
Hello Sir,
Do you recommend using Bollinger band with a 20SMA or 20 EMA?
When using an EMA you rarely have the price trading on the upper/lower band when compared to an SMA.
What do you recommend?
I\’d prefer EMA, Hiten. However, if you think SMA is better, no harm stick to it. Do backtest for results once before placing a trade, you can easily backtest on streak.tech.
How to select EMA for the Bollinger Band Middle line ?
Cannot see any option !
How are you able to set EMA for bollinger band middle line ?
YOu can, maybe call the support desk? They will explain this easily over a call.
Sure sir,I will check sir
Thank you
Good luck!
Sir I tried to use it same as you explained in the chapter, understood the concept
How can one use it I know in trending market even though the stock touches +2sd it goes up but in sideway market too it fails my view sir.i figured it works well in in downtrend or uptrend where stock retraces back to mean before continuing it\’s downward or upward trend.
Hmm, sure. Maybe you should check this across many different types of stocks and see if the results are similar. You can easily do this with streak.tech.
Sir how accurate is Bollinger bands,I\’m backtesting it is not working even though the chart is sideways or range
Depends on how you are using it, Bharath. What are you trying to do?
Good morning sir,
Thanks a lot for sharing such amazing work with us. I had a little doubt. Below is the link of eurodollar contract of mar 21.
https://imgur.com/a/lX1lVT2
Sir, following are the observations i got from it :
1.) The volume traded is good from last few days.
2.) the candle stick pattern formed on day before is hammer but today doji is formed. So there is indecision in market.
3.) macd is trading below 9 day signal line. (i.e macd is 0.10 and 9 day signal is 0.36)
4.) momentum is -ve. i.e -2.0
5.) rsi is 42 so there is no correction.
So based on above i am looking for shorting. Sir can you please tell if my conclusion is correct. If not you can please tell where have I gone wrong.
Thank you
Looks good to go, Shekhar. But please keep your SL in place and don\’t bet too much on it, especially in your early trading days.
Really helpful and writing is attractive easy to understand .I haven\’t studied this much is my whole life but i ma passionate for trading.Thanks zerodha varsity and karthik rangappa sir.
So happy to note that, Satyam! Happy reading.
There is also a MACD crossover (signal line turns greater than the MACD line), you said it gives a buy signal
but it\’s contradicting with the line when you said, The 2nd vertical line from left points to a crossover where the MACD line lies above the signal line should look at buying opportunity. So on and so forth.
Please do check the comments, have explained this a few times.
Hello Sir,
Will you please tell me the use of VWAP value in VWAP indicator? Can I use it as a Stop Loss? Just like Super Trend value used as a Stop Loss in Super Trend indicator.
Thanks
Please check this chapter – https://zerodha.com/varsity/chapter/supplementary-notes-1/
Hello, thank you for this well structured course, I\’m just a little confuse regarding the MACD, first, I just don\’t see that it predict a bullish or bearish momentum because it just fallows the the candlesticks movement at the same time especially when you observe a 1 minute time frame, second, when switching between time frames you can see a differents results: sometimes convergence,sometimes divergence ,so witch one of these time frames to follow ? witch one reflect the true direction of the trend or momentum ? thank you.
Thats right, at the end of the day, MACD is a trend following indicator.
Thanks, Karthik for creating this awesome content which is as useful as it was in 2014 when it was created. Thanks for adding mathematical calculations which help in understanding the concept thoroughly
Need your inputs Karthik. When it comes to creating a technical rule-based trading system, it is advised to work out the strategy using technical parameters and then do back-testing to validate it. Can you share how this thing can be created using the topics you have covered in this module
Gaurav
Thanks Gaurav, happy to note that you like the content 🙂
Yes, it is always a good thing to backtest these strategies before using them. Check this – https://www.streak.tech/
Dear Karthik,
Should I be using a MACD cross over or a 9 x 21 MA crossover? Or both?
I\’d suggest just the cross over.
Sir , would it be wrong to say the macd line is a 26 day exponential moving average?
Great explanation, sir.
No, it won\’t be wrong 🙂
Sir Namaste,
How the SD price is considered?
SD in what context, Prakash?
Wonderful work Karthik… So simple, to the point and enough for trading!
Keep up the good work!
Happy reading, Vinu!
Why is macd histograms showing red and green even when macd signal is above signal line. My understanding they should show only green bars please clarify
Anil, I\’d suggest you ignore the histogram and the associated colours.
Doubt wrt below sentences:
Bullish hammer is a recognizable candlestick pattern
The low of the bullish hammer also coincides with the support
The volumes are above average
There is also an MACD crossover (signal line turns greater than the MACD line)
Q: shouldn\’t the MACD (12EMA – 26 EMA) line turn greater than the signal line(9EMA) here? or is my understanding not right?
Thank you,
phani
Signal line is more reactive, so its the signal line higher than the MACD line.
Macd line crossing signal line from below to above indicates bullishness. Is it correct, sir.If so plz refer to the fourth point of your checklist example .
Yes, also please do check the comments section, have added more insights here.
Hi Kartik Sir,
Good Morning !!
When you select MACD from studies, along with MACD and Signal line it will draw BAR chart also. Can you please explain about BAR Chart a bit ?
Regards
Ishwar
I\’d suggest you ignore the bar chart Ishwar. You don\’t have any added benefit with that.
Sir, for swing trading what are the time periods i must choose while using the MACD indicator.
I generally use 12 & 26.
Thats fine, default MACD values work.
Hi Karthik,
Is it fair to call the MACD the holy grail of technical indicators?
I have found it to be the most reliable indicator while analysing charts.
For example, in the current Hindustan Unilever 1w chart, the MACD had dropped below the signal line sometime around 17th August and has stayed below since, while the 50 day EMA continues to be higher than the 100 day EMA and the 25 day EMA is higher than the 50 day EMA.
Please clarify.
Thanks in advance.
Not at all, MACD is nowhere near a holy grail 🙂
Key takeaways. Pt 4. It mentions the signal line as 9 DSMA(MACD). In the chapter it says, it is 9 DEMA(MACD). Please tell the correct one.
It is a 9 day EMA.
HI Karthik,
Still not clear on your answer for Point 1, please clarify if I\’m missing anything.
For the buy condition, should signal be greater than MACD or vice versa?
I\’ll mention the same statements mentioned above upon which I got this confusion.
Asian Paints eg : The 2nd vertical line from left, points to a crossover where the MACD line lies above the signal line, hence one should look at buying opportunity
Karnataka Bank eg: There is also an MACD crossover (signal line turns greater than the MACD line) hence it is buy.
These two are contradictory.
Signal line should be greater than MACD.
Hello Karthik,
1. In the checklist section while explaining the Karnataka bank example, you have given 4 points before considering to buy the stock. 4th point says there is a cross over and signal line is greater than MACD line which means buy but for buy option MACD should be greater than signal line right?
2. Also every any indicator or pattern or technique, you are always using frequency as day basis, Can I apply BB with its original value during intraday with 15 min frequency? Then BB would become 20 minute SMA.
1) We take the cues from the signal line in MACD
2) Yes, you can apply on 15 minutes chart. The logic and interpretation remains the same.
Helo sir, in the 2nd table of MACD values its 26th day EMA – 12th day EMA is -160(negative 160) but there u mentioned +160.
Sure, thanks for pointing that. Let me check this.
Find shorting opportunities in long downtrend market and find going long opportunities in long uptrend market….will this be a right strategy to do swing trading?
Yes, you can take a contrarian view, as long as there is a valid candlestick pattern to justify the same.
Hello Sir,
I am new to TA and learning through modules. Thanks for simple explanations in each chapters and great learning resource. Checklist points are really helpful for trade initiation however I have some doubts, please help me to clarify my doubts:
1. In case of Cipla chart on 11th August 2020, dark cloud cover pattern has formed. Volume is also there and RSI is 73 which is near to overbought position. Based on these indications, i want to take short trade decision for next trading day. However 9×21 days EMA and MACD suggesting for long trade. As explained in this chapter, i should go for short trade. Please help me to understand if my understanding is correct. Below is the link for Cipla chart of 11st August 2020.
https://ibb.co/bQKyx8M
2. There is S&R values check recommendation in check-list. Since last 3 months some stocks like Cipla, Reliance are trading at quite high value and it is difficult to find similar past values in chart to get S&R values. What should one do in such scenario? How to fix target price in case of long or short trade?
Please help to clear my doubts. Thanks in advance.
1) Yes, that is a dark cloud cover. MA indicates the overall direction of the trend. So in this situation, even if you short, you need need to be very quick in booking the profit and reversing the trade if required.
2) In such a case you need to look at a trend line, unfortunately I\’ve not explained that here in this module. Will probably discuss it sometime in the future.
What is significance of bars appearing on background of MACD?
If they are volumes, why they go below zero line
Its the MACD histogram, guess you can ignore them.
Dear Team,
Is it possible to download a single PDF of all these topics?
All these topics are awesome because they try to explain the tricky theories in a simple yet complete manner.
Thanks in advance.
This module is a single PDF, right?
Thanks Mr Karthik for the clarifications. As regards MACD days for 26 days and 12 days EMA my query is that the 12 day EMA should be of recent vintage i.e of recent dates , the immediate date prior to the calculations going backwards 12 days. May kindly like to see please
Thats right, Vijay.
Hi Mr Karthik
I have following observations
1. In the example in the beginning ,the 12 day EMA taken for MACD has started from 1st Jan14 to 16th Jan 14 and 26 Day from 17th Jan 14 to 5th Feb 14. To my understanding the 12 day EMA should be the recent one and 26 day should start from 1st Jan 14. may like to clarify pl
2. Though you have shown EMAs but it appears in the calculations that instead Simple averages have been considered. May like to clarify pl
3. May also like to elaborate the method to calculate EMA
Best regards
Vijay jain
1) It is on a rolling basis wherein the latest data point gets incorporated into the calculation and the oldest gets kicked out
2) Need to double-check that, MACD is calculated by the charting engine
3) This is quite quantitative in nature, will try and do that one of these days.
Thankyou for your reply 🙂
Apart from deviation part ofcourse
Hi Karthik, hope you are well. I was wondering what is the primary difference between a moving average envelop and Bollinger bands? Is there any major difference in their use or any advantage of one over the other? Please help.
BB is based on the volatility or the standard deviation of the stock returns, but a moving average is simply the average of the stock prices. These two are very different.
On zerodha Kite app, the MACD comes up with two lines and a histogram oscillating around zero.
And numbers show up like
MACD(12,26, close, 9)
-9.7994,-7.768, 1.9227 in red, blue and red respectively.
Can you please clarify what these numbers represent.
Numbers based on MGL stock price on 17-7-20
Blackline is the MACD line, which is the difference between the 12 and 26 day EMA, red is the signal line, which the average of the MACD itself.
Sir the colors of MACD histogram. What does they represent? It is bothering me, cause whole trading day i looked at them and try to understand their meaning and yet nil… So please help. If necessary i will generate a ticket.
Ah, don\’t worry much about the histogram colour. In fact, the histogram itself is not much of use in my opinion.
About colorful bars of macd histogram. Please check cause now it\’s bothering me..please….. Hight and position of bars i understood but not color please help…
What is bothering you? Why dont you create a support ticket for this?
How to set values for indicators?
Which indicator? You can do so by clicking on the settings icon on the indicator and selecting the configuration that you like.
In macd histogram what does green and red color represents.. I searched every where but didn\’t found any information. If color is there it should some meaning. I tried to read chart myself but didn\’t understand.. Please help…
I\’m not sure either, need to check this myself 🙂
Sir, a little bit confused here.
At the end we have to use the MACD Line and 9 Day EMA of the MACD line for the indicator purpose? Or the EMA above/below the current market price and 2 EMA\’s intersecting each other will also add to this.
You can consider just the MACD line, Mohit. That\’s enough.
Hi Karthik, In Bollinger bands, What is your view of using 3 Standard deviations instead of 2?
Higher the SD, safer it is.
Sir above in the explanation it is written that the signal line is the 9 day EMA of the MACD line, but in the key takeaways is written that the signal line is the 9 day SMA of the MACD line. Clear this one please!
EMA Mohit.
I wanted to know what should be given preference (when deciding to buy) between the following:
1. MACD crossing over the signal line
2. 25 day EMA staying below the 50 day EMA
I understand that MACD is a leading indicator and hence may show the reversal in the trend before it has happened. But is that why I see that the 25 day EMA is still below the 50 day?
Between the two, I\’d prefer the EMA. It is intuitive and easy to use 🙂
Good morning Karthik, I have seen a pattern for a stock the price is in a range between (674-729) for nearly for three months the stock does not breaking the resistance level or support level. But today the stock breached the resistance level but in the psi indicator it is showing the price is in above or in flat with 80 range. so what should one do in this position either he has short or as the range is breached he has to take a long position.
Vinay, ignore the indicator, go with the candlestick/price action. Indictor is only secondary to the price action.
Hi Kartik,
I am a bit confused. You have stated the following in the last section of the chapter :
\”There is also an MACD crossover (signal line turns greater than the MACD line)
With all four checklist points being ticked off I would be very glad to buy Karnataka Bank.\”
However, previously in the MACD section, you have stated that :
\”The sentiment is bearish when the MACD line crosses below the 9 day EMA wherein the MACD line is lesser than the 9 day EMA. \”
My question is that if the signal line turns/is greater than the MACD line, is it indicating a buy opportunity or a sell opportunity ?
Signal line greater than MACD, buy, sell otherwise.
Hello sir. The content here is too great. I am a civil engineer and this is totally a new thing for me but I didn\’t feel any awkwardness in understanding any of the lessons. Thank You for making such a exquisite content.
I just had one question that why the EMA table (12 day and 26 day) has SMA instead of EMA, since EMA is calculated by [ (CMP*e)+(Previous EMA*(1-e))] but here in the table it simply the average.
Glad you liked the content Shreyansh. EMA is weighted, I dont think I have mentioned the formula. However, SMA is a simple average.
I am using Zerodha and find it very comfortable to use
Happy trading 🙂
I am not able to find Money Flow Index + (MFI +).Please guide
Did you check in both TV and chartiq?
HI,
In the Karnataka Bank example under section 15.4, shouldnt the point number 4 say that MACD line is crossing signal line, instead of signal line is greater than MACD line?
Because a Buy signal is there when MACD crosses signal and becomes more than signal value?
Warm regards,
Nitin
We\’ve discussed the same point in the comment section, can you please look through that? Thanks.
Sir in ur Karnataka bank example u have mentioned that signal line should be greater than MCAD line where as in the indicator module u have mentioned that when macd line crosses signal line upwards it is bullish sentiment. Could u pls confirm, which statement should be followed.
This has been discussed in the queries above, Siddharth. Request you to take run through the same.
So,
MACD line> signal line suggests bullish sentiment
MACD line< signal line suggests bearish sentiment
But in the example, you have taken-
Now, hypothetically imagine a situation where you are looking at opportunity to buy shares of Karnataka Bank Limited. On a particular day, Karnataka Bank has formed a bullish hammer, assume everything ticks on the checklist:
1. Bullish hammer is a recognizable candlestick pattern
2. The low of the bullish hammer also coincides with the support
3. The volumes are above average
4. There is also a MACD crossover (signal line turns greater than the MACD line)
With all four checklist points being ticked off I would be very glad to buy Karnataka Bank. Hence I place an order to buy, let us say for 500 shares.
This was an example of a bullish pattern, then keeping that in mind in the 4th point for MACD crossover, the signal line should be less than the MACD line right?
The signal line should be higher than the MACD for bullish signals.
All the indicators derive its value from few past prices and offcourse when set on different time frames they are going to give different results because their averages changes. How one would know what timeframe and lookback period is suitable in order to excel in TA.
For most trading strategies, I\’d suggest you stick to EOD data.
But sir in MACD we are working with averages. So it should remain same.
and sir I am not able to understand what do you mean by changing time period data points also changes?
Are you trying to say that by changing time period from weekly to eod we get different candles with different OHLC. ( I know it sir)
But in MACD we considered 12DAY EMA and 26DAY EMA which should remain same even if we change the duration.
Even though past MACD line gives different result but today\’s MACD should show same result in both durations.
Or
It is the case when we change from eod to weekly MACD also changes from daily to weekly
And sorry sir for asking these silly questions, but sir i want to clear all my concepts.
And Thank You sir for posting this useful information for us
Yes, when you change the data, you get different OHLC values, because you point of reference changes. The 12 and 26-period changes based on what you choose as the underlying data period. If you are looking at weekly data, then it is 12 week vs 26 weeks.
Hi Karthik,
Can you please review my setup and execution.
I started with adding following to the Nifty May futures charts in zerodha:
1) Daily chart with 5 minutes duration.
2) MACD(12,16,9)
3) 9-ema & 21-ema
4) Volumes
Following observations were made:
1) From 12:35pm to 1:35pm Nifty future was in an upmove.
2) At 1:40 shooting star formed on chart.
3) This was followed by a big red candle and a surge in volume.
4) At the same time MACD and EMAs also gave short signal.
Trade:
1) Bought 1 lot Nifty 14th May 9000 PE @28.55. It was a cover order with stop loss at 23.
2) It went down in few seconds and made me super nervous.
3) After some the trade started to move in my direction.
4) I had a profit of ~200Rs I moved the stop loss to 29.55.
5) Got nervous again and exited the trade with 225Rs profit.
After Trade disaster:
1) The put option ended @49 Rs.
2) I could have made ~1500 Rs profit 🙁 … How to set proper targets in intraday trades?
Please review my setup and execution.
Thanks again.
This sounds all too familiar 🙂
You need to ensure you stick to the plan, which means that you should have patient capital, and wait till either the SL or target is hit. Takes time, but over time you\’ll get a grip on this.
Sir i changed the duration from days to weekly in charts
then MACD also changes from buy to sell why sir?
Different time period means different data points right?
Hi Karthik,
I did finish TA module 2-3 years back when I opened my account with Zerodha.
I have also finished the FA, stock-mkt intro, futures and option theory module. I have also covered some chapters in option strategy module also.
This weekend I wanted to revisit the TA lessons and started the module again. In 2 days I have skimmed through all the chapters this chapter.
First of all I want to thank you and your team for these modules. They are a great help to newbie like me. I know people who have spent thousands to learn the same stuff I am learning for free.
I have a question here:
If I want to do intraday option trading, is it a good idea to do TA on options chart or should I be doing TA on underlying stock/Index?
Thanks!!
For INTRADAY –
Lets, say I apply four indicators –
1) EMA, 2) BB, 3) Stochastics, 4) MACD
EMA – 9 EMA cuts below 21 EMA for short sell. And all other 3 indicators have reached their peak and all are signaling towards short sell.
So, should I short sell-by confirming all the indicators or any 3 indicators giving the signal for short sell is fine?
P.S. – Also, I have not considered RSI, as the line hardly crosses the overbought mark. So, I have replaced it with stochastics.
Your buy/sell decision should come from the candles and not really the indicators, Hemant. But yes, if all signalling towards a sell, then maybe you should consider a position.
sir,
i have checked all indicators and and found that all indicators show post movement of live market,, then my question is that is there any indicator which indicates us absolutely what is going to done or currently what is going on in live market about stocks,, plz reply ..
thanks a lot…
No, no indicator like that. Every system is a probability model, no guarantees as such 🙂
hello Karthik sir,
Can we treat upper & lower bollinger bands as S&R for stocks?
Yes, you can.
Karthik Sir
1) Checklist no 4 point is wrong for buying in Hindi as well as English Lesson
Macd crossover point
Macd line must above signal line
2) In Key takeaways
Point no 4 is wrong too
Signal line is the 9 day EMA of the MACD line not SMA.
Ok. But please go through the comments as well.
Where we can find Elder impulse chart ?
Hmm, Trading View?
Dear Sir,
At the last part of the topic as you said don\’t base a decision on indicators. Is it also applicable to MA?
You can exclude MA from that statement 🙂
Thanks for the reply Karthik. But I\’m not sure if what you\’ve said is correct. If I interpret it correctly, you are saying \”If the signal line or 9day avg on the spread crosses from below\” i.e., the signal line is greater than the MACD spread, then it\’s a buy signal? I don\’t think that\’s correct.
Just to be clear can you please let me know what the crossover indicated in this picture (https://imgur.com/a/eu4LGJV) is conveying? I think it is a signal for buying (or bullish) since the MACD spread crosses above the signal line.
I\’ve referred to these links provided (https://www.investopedia.com/terms/m/macd.asp), (https://school.stockcharts.com/doku.php?id=technical_indicators:moving_average_convergence_divergence_macd).
Sorry if I interpreted your words incorrectly. Please let me know if I\’m wrong.
That is a sell signal, right? If you notice the signal line is crossing over the MACD line from above.
Hi Karthik,
The indicator (MACD crossover) in the situation provided at the end of the chapter (Karnataka Bank Ltd shares) got me confused a bit and the comments here added more to the confusion.
Just to be clear, a signal line is generally the 9-day EMA of the MACD spread, right? So, it must be lagging behind the MACD spread and when the MACD line crosses the signal line, we can expect it to be bullish, right?
At the end of the chapter, you have assumed a hypothetical scenario in which the Karnataka Bank shares have formed a Bullish Hammer and S&R, volume are also confirming the bullish trade. But, regarding the indicator, you have written \”There is also an MACD crossover (signal line turns greater than the MACD line)\”. How does a signal line crossing MACD line indicate/confirm a bullish trade? Shouldn\’t it be the opposite \”MACD line turns greater than signal line\”?
There have been so many comments on this that at times I feel lost 🙂
Here is the thing though – the 9-day avg on the spread is the one giving you the signal to trade. If it crosses from below the spread line, its a buy. Likewise, if it dips below the spread line, it is bearish.
Apologies if I\’ve confused you 🙂
4.There is also an MACD crossover (signal line turns greater than the MACD line)
this means MACD shoould cross the sgnal line right? but what has been written inside the braces is reverse.
Hi Karthik,
While using the MACD indicator in trading view site i found the MACD histogram shows use of red and green colors while forming columns. Howerver when i see it on kite platform the tradig view chart ony shows red color for bars formed both below and above the zero line .
Please guide me on how i could get red and green colored columns in the kite tradingview on the MACD histogram .
Thanks,
Ayush
I need to double-check this, Aysuh. I\’ve not used it myself.
Sir, to be very frank I am bamboozled in this Technical Analysis sector or you can say the trading part. Actually its getting difficult for me to understand the whole thing of trading concept that how to use indicators and how to analyze the movements and at what time to buy or sell and which stocks to choose.
Where exactly are you facing issues, Ritesh?
Hi Karthik,
What are the best combination on indicators for intra-day trading? Is Bolinger bands, RSI, OBV & MACD combinations very effective? Any other suggestions/tweaks to this would be really helpful.
Thanks,
Ashwin
I prefer Bollinger bands and moving averages 🙂
Are these indicators equally effective on 5 minute, 30 minutes or 1 Day chart?
Yup, this can be applied on shorter-term time frame as well.
PLEASE IGNORE ABOVE COMMENT::::
Hi Karthik,
How do zerodha calculate Pivot points? Asking this question as it’s not same as the conventional way.
17th March: Reliance :[C: 1008.0, H: 1060.0, L: 1003.2, O: 1047.2]
so Pivot should be [(H: 1060.0, L: 1003.2, C: 1008.0)/3] = 1023.7
But in zerodha kite chart it’s: 1024.58
and because of this all other values are getting changed.
Same reply, Kundan 🙂
Hi Karthik,
How do zerodha calculate Pivot points? Asking this question as it\’s not same as the conventional way.
17th March: Reliance :[C: 1008.0, H: 1060.0, L: 1003.2, O: 1047.2]
so Pivot should be [(H: 1060.0, L: 1003.2, O: 1047.2)/3] = 1023.7
But in zerodha kite chart it\’s: 1024.58
and because of this all other values are getting changed.
Kundan, we don\’t do the calculations. We have integrated ChartIQ and Tradingview, so the calculations come from there. I\’d suggest you please look through their support articles once. Thanks.
Can you please specify any patterns for this purpose ?
Almost all candlestick patterns.
Dear Karthik,
You have mentioned for BB pattern
\”Personally whenever, I use BB I expect the trade to start working in my favor almost immediately. If it does not, I start validating the possibility of an envelope expansion.\”
How do you validate the possibility of an envelope expansion ?
Envelop expansion is basically the stock continuing to trend in the direction against your trade. Look for patterns and price action that support this.
I think there is an error in the last example where we are talking about Karnataka Bank and are building a checklist for it. The last point states \”There is also an MACD crossover (signal line turns greater than the MACD line)\”.
According to the explanation of MACD crossover in the previous paragraphs, this should be a bearish indicator, but here it is considered as bullish confirming to the other three bullish indicators.
Please correct me if I am wrong in my understanding
Sachin, I think someone else had the same query and we had addressed this. Can you please scroll through the comments?
what is the meaning of convergence in macd and also wanted to know of divergence…
Its discussed in the chapter itself, right?
Hi All,
Can someone share the code please. Thanks in advance
yes, kindly review!!
Hey KArthik,
Is this explanation under MACD right? because I don\’t see any familiarity between the below explanation and the MACD line in graph?
\”For example, the first vertical line starting from left points to a crossover where the MACD line lies below the signal line (9 day EMA) lies and suggests a short trade.
The 2nd vertical line from left, points to a crossover where the MACD line lies above the signal line, hence one should look at buying opportunity. So on and so forth.\”
Hmm, let me review it again, Kiran.
This tutorial is different from anything I have come across – specifically on TA
Usually tutorials says this \”how you should do it\”
This one says, this what the concept, this is the standard way to use it, \”now you know what you should do with it\”
Awesome Karthik, keep up this, we many are waiting to learn more from you.
Plus the presentation is very interesting – which is something very important, u made all theories as interesting as practical
Thanks, Bipin. Your comment made my day 🙂
I mean I am trying to open volumes for the nifty chart and I am not able to do so, while for specific stock I can do it
WHich stock, Shrikant?
hi.
I am not able to see volumes in my zeodha app, I use a mobile app, kindly help me how to bring volume candle on the screen with its 10-day average.
Thank you.
Its the same way as you\’d do on the web. Open the chart, click on the indicator and select the moving average indicator.
Karthik, how do we plot average volume on the volume chart displayed on pi platform?
You can plot the MA over the volume field. It is a drag and drop thing, suggest you speak to the support once.
Hello Sir,
for the short term trading which indicator should i used.
Thanks and regards,
Kunal
Try the short term moving average, Kunal.
Hi Karthik,
I think some confusion still exists with respect to the Karnataka Bank example.
The 4th item on the checklist reads \’There is also an MACD crossover (signal line turns greater than the MACD line)\’. Isn\’t this an indicator that the trend is bearish? Seems inconsistent with the first 3 items. Am I missing something?
Thanks.
Hi Karthik sir,
I am sorry for a bit awkward question. I am new to technical analysis. I wanted to know why there is difference in MACD and MACD signal line values of Zerodha (kite chart) and Sharekhan (although I am considering 12,26,9 day parameters for both)?
Hmm, this is interesting. The things no two charting engine will reflect the exact same values, it will be more or less the same but not exact. Check this thread – https://tradingqna.com/t/why-does-two-charts-of-the-same-timeframe-look-different-on-the-same-platform/4715
but Sir, you\’ve also said this \”The sentiment is bullish when the MACD line crosses the 9 day EMA wherein MACD line is greater than the 9 day EMA\” – is it not contradictory?
Hey Abhishek, yes, the MADC is more reactive to prices and hence acts quickly. Sorry for the confusion 🙂
Hi Sir,
In the example of Karnataka bank under checklist above you said signal line turns greater than MACD is bullish. Is it right?
Yup.
Dear Nitin,
Can provide accumulation/distribution indicator code in pi.
I\’d suggest you write to my colleague [email protected] about this.
1)Which indicator i should use in both intraday and swing trading?
MACD OR Moving average cross over.
you said that
Moving average crossover Avoids Trades in sideways market and In MACD there may be trade in sideways market.
2)Please correct me\”We can avoid trades in sideways market when MACD line is in positive and the momentum will be high\”
Srinivas, for swing trading I\’d prefer MA over MACD.
AND THANKS FOR CONVEY ALL THIS INFORMATION IN SUCH A EASY WAY
Happy reading, Ajay!
DOES PIVOT POINTS INDICATE SUPPORT AND RESISTANCE
Yes, they do. However, they differ from the conventional way of identifying support and resistance. I prefer the conventional way.
IF THE MACD LINE IS OVER THE 9 DAY SIGNAL,SHOULD WE BUY OR SELL?
It suggests a buy.
Hi, i have a question. If standard deviation for both + and – is going to be same, i.e the value of the deviation from average is going to be the same , then the bollinger bands should show the same shape on upwards as well as downwards of the average . Then how come they aren\’t same ?
The value really depends on the average, which is further dependent on the stock price. Hence you don\’t get a symmetric shape for the band.
Dear Karthik,
I appreciate the wonderful information made available by Zerodha to its members free of cost. But at the same time this is a market strategy to promote Zerodha as a broker and their trading platforms Pi and Kite. It is obvious and no issues with it as there is no free lunch.
Now, my main point is that the answers to comments, typos, errors could be addressed by re-writing all the chapters and all comments dropped with great apologies to my learned friends who cherish by viewing theirs queries replied here. It would bring more clarity and save lot of time of new users who refer it as a Bible and then devote 2-3 days in comment section to retrieve further useful information embedded therein. In fact, comment sections have become too much lengthy in most of the chapters and painful too because it requires minimum 4 days effort in going through it but it cannot be escaped without loss of comprehension of the main chapter. Also, please give exact dates ( start date to end date) for all charts used in examples so that we can draw charts on our computer screen and visualise them for better clarity. : PK Singh, Bhopal
Point noted. Will try and do something about the comments.
Dear Karthik Rangappa,
Thanks for your wonderful lessons
How do we calculate support and resistance for intraday trade?
Thanks for the kind words, Latish. It is calculated on the same way as you would for intraday.
Dear Karthik Rangappa,
Please introduce Pivot Boss Pivot indicator in chart. Thanks
Will look into this, Mani.
I would like to thank Team Varsity for 10 times via different comments because of the reason being you guys have made it so simple and crystal clear!! Many thanks for the Hard Work!!
Hey Raghav, you are the one taking efforts to read and learn, so you should thank yourself 🙂
Hi Karthik
Thanks again for all this knowledge that you are sharing with us for free! No words can be enough. I have learned all about technical analysis on Zerodha Varsity and earned the certificate on your app 🙂
Now I am going through all the comments to may be learn something more.
I have one query. I have heard quite a bit about Market Profile. Will you be covering them in future? Can we expect Zerodha to introduce Market Profile in Kite in near future?
If not, where can I learn about it?
Thanks!
Happy to note that, Ashutosh and congrats on the certificate 🙂
No plans as of now about Mkt profile, but it does look like an interesting area…so maybe we will put up the content ard mkt profile sometime.
Nice! Looking forward to the material on Market Profile.
Hopefully sometime this year 🙂
Hi,
Is there a indicator for comparing the script with the index, like the relative strength comparator, could one be developed by your team.
Thanks,
RC
Nope, thats not there RC.
Hi Karthik,
As a swing trader, can I use the Bollinger Bands as a proxy for support and resistance levels?
Nope, BB does not substitute for S&R.
Hello sir, i have a doubt in MACD
You have mentioned the sentiment is bullish when the MACD line crosses the 9 day EMA where MACD line is grater than the 9 day EMA.
But in check list in the example of buying karnataka bank limited, the fourth checklist
There is also an MACD crossover(single line turns grater than the MACD line).
I am bit confused please tell me sir, thank q
regards
Pranay, let me recheck and get back on this.
Hey karthik.. first of all thanks a lot. Your modules are awesome and it has became very easy to study about the indian markets. Hats off to you…….Well, my question is = If i have studied a stock completely( candles, volumes and indicators). And i know that it will move up the next day, but after the markets close and a negative news regarding the stock appears. For ex. A sudden problem in the company management or the resignation of the CEO which indicates a negative news for the stock. So should i still buy the stock owing to the analysis done or should i avoid it???.
Sumeet, the thumb rule is that the fundamentals precede the technicals. So in the event of any fundamental news, ignore the technical patterns.
Hello there,
In the MACD crossover explanation it is stated that \”the sentiment is bullish when the MACD line crosses the 9 day EMA wherein MACD line is greater than the 9 day EMA\”.
While in the hypothetical example of Karnataka Bank (checklist verification) it states that the signal is bullish as the \”signal line turns greater than the MACD line\”
Kindly let me know if I am not able to understand properly of that is a typo error in the case of Karnataka Bank
Best Regards,
PG
Yup, its a typo. Have made the correction in the comments above.
Hello Karthick,
Regarding Bollinger bands (BB) I have few queries with respect to Intraday Trading
1. While plotting for BB , what should we mention for A) Period B) Standard deviations C) Moving Average Type
2. What chart type should be used for intraday perspective while using BB like 5 min or 10 min or 15 min
3. Can Crossover EMA and BB used at the same time , if yes then I have tried using it and it gives a very confusing picture on the charts like too many lines going up and down
Thank you in advance
1) Period = 14 days, Standard deviation can be either 2 or 3, I prefer 3, MA should be EMA.
2) 10mins or higher
3) Not really, cause BB kind of factors in the EMA. Using both crossover and BB may lead to confusion.
Hi, I have primarily been doing my TA at http://www.investing.com and there the Stochastic indicator has 1. Period 2. SmoothK 3. SmoothD
So I use 14 period and 3 smoothK and 3 smoothD. I understand Zerodha\’s default smoothD is 3 (they told me on Twitter) but where do I put the smoothK data \’cos on the indicator settings, there\’s only \’Period\’ option.
Hi Karthik, is there any software or Mobile App for BSE or NSE which provides all the candle stick patterns data (i mean to ask alerts) and all the indicators where we can customize to set the indicator between the time periods.
By the way , nice documentation 👍
-Mohasin
Mohasin, I\’m not aware of any. But please do watch out for Varsity App, I guess that will be interesting 🙂
Hi Karthik, i did not find any Varsity app neither on Apple App Store nor on Android play store. Are you referring the the above Varsity documentation?
Please provide the App store link for Varsity App .
-Mohasin
Mohasin, the app is yet to come up 🙂
Request you to please follow us on the social media, especially Twitter to keep track of this announcement – https://twitter.com/zerodhavarsity
My question is with regard to BB. Sir, based on your personal experience is BB more effective in 15-30 minutes candles or EOD Candles? in other words is it effective in intraday or swing trades?
Daniel, I think it is more effective on the EOD charts for swing trades.
Thank you! Just to confirm, BB isn\’t effective for short term trades (Intraday), right sir?
Yes, BB can be effective for both swing and intraday trades. My personal preference is for swing trades.
As per the Moving Average chapter, the Shorter MA shall be above the Longer MA in order to convey a bullish trend because it is more reactive. So isn\’t the 9 day EMA, the shorter MA in the Asian Paint example?
But your explanation says otherwise above.
Could you please clarify?
There are multiple crossovers, Shrey. Which one are you referring to?
The one where you refer to utilize the MACD signal line. (Asian Paints Example)
Oh yes, I guess this is a silly mix up. The cues come from the red line, which is the 9 day SMA of a the MACD line. Thanks for pointing this. Will rectify.
As per the Moving Average chapter, the shorter MA
Yup.
While Illustrating example for MACD , i think you have not calculated the EMA. Instead , you took a 26 day SMA and a 12 SMA to calculate the MACD ? . Please clarify.
Let me look into that, Praneeth. Thanks.
Hi
In your above example just after the checklist there is a point \”signal line turns greater than the MACD line\”. Is this correct in a bullish scenario? Just want to clear my confusion.
Regards,
Sid
From the theory I understand the MACD line should be above the signal line in order for it to be a bullish scenario. Please confirm.
The signal line is the faster one, that should trigger the signal.
Yes Sir, I don\’t see a problem with that 🙂
Hi Karthik,
The literature presented has been of great help to novices like me, who aspire to know about the markets with no prior knowledge at all. Just a small query on this chapter – The example on Karnataka Bank at the very end says that the momentum turns bullish when the signal line crosses the MACD line. However, going by the theory above, the MACD line should cross the signal line to create a bullish momentum. Would be very helpful if you could put some light on this.
The signal line is the 9 day average of the MACD line, Ayush. So we take cues from the signal line and not really the MACD line. MACD line can lead to many false signals especially when the stock is moving sideways.
Hello Karthik sir
what are the moving averages used in Rainbow moving average indicator and please give the formula for its calculation.
The default setting is \’2 period\’. The calculations are simple, as explained here – https://zerodha.com/varsity/chapter/moving-averages/
Hi
I am using MACDHistogram in my Pi chart but if i select a color as green the all the historam bars are showing as green but I saw some of the chart software it is showing red and green like in the volume bars. What should I do to get that way
Can you write please contact our support desk for this, Jose?
Hi Karthik,
Is the Stoch RSI indicator not available on Kite?
Thanks
Hi Karthik,
Following up on my earlier query.
Thanks
Dan,
We are adding Stoch RSI indicator very soon to Kite
Hi Karthik,
Why can we only open selected stocks from already pooped out chart in Kite. Very limited options are there.
Now if I want to open any chart, I have to first add it to my watch list and then pop out chart from there. Very inconvenient!
*Popped not pooped 🙂
Figured as much 🙂
Well Panjak, the Marketwatch also doubles up as a window to seek trading information. Remember, this is a platform for both transaction and charting 🙂
Thanks Karthik for wonderful blog,
Could you please tell, which indicator would you prefer for swing trading (for 2 to 7 days) between these 2,
Stochastic or RSI ?
Why ,if you could tell ?
Thanks.
Certainly not, Stochastics, as I find it more suitable for intraday trade. I\’m not a big fan of RSI either. I\’d stick to good old moving averages, I like it for its simplicity.
I have recently started learning technical analysis and find modules here really helpful. Must say great effort!
2 Queries as of now:
1) Is there any way in Kite that I can go directly to any day chart – say 5 minutes chart on 26th Sept last year? I couldn\’t find
2) Is Kite provide real time feed? I think it\’s a bit delayed may be 3-4 seconds, is it?
Thanks in anticipation
Thanks, Pankaj.
1) For now, you cannot go directly to the date you are looking for, guess you will have to scroll to the date
2) Yes, feeds are real-time on Kite. It not delayed.
How am I supposed to go to that date manually? If I put in monthly chart and go there, the moment I change time frame to 10-15 minutes, it kicks me back to the current day.
I hope, you are not suggesting to set time frame to 10 minutes first and then keep going backwards for a lifetime to reach there.
Please suggest how it works, I repeat, I am new to trading and might not have understood your solution properly.
Also please incorporate the feature of going to a particular date directly for convenience!
Pankaj, currently the only way to go back to a previous date on a lower timeframe is to scroll back, which is inconvenient.
Will pass this on the development team if they can find a fix to it.
Yes, Please. It\’s probably more important than what you guys have thought I guess. Coz any newbie who is trying to learn through books and videos would like to see the setup on his/her screen. That\’s the best way to learn I feel. And that\’s what you guys are not providing. I am surprised how this has not been highlighted to you earlier or you have ignored it for such a long time.
Karthik what if the MACD and the signal lines are below the center line and the MACD is below the signal line, lets say MACD = -06 and signal line = -0.5. Basically there is a negative momentum right ? So do we have to see whether it is above the signal line or not ?
Yes, above the signal line indicates bullishness. Are you trying to apply this on Kwality? If yes, I\’d suggest you don\’t apply this on it for reasons stated in the previous comment.
No I\’m not applying it to kwality but my concern is that the MACD line is already below the centre line so why should I see if it is above/below the signal line ? If it has negative momentum it means that it is bearish right ?
Yes, thats right.
Thanks Karthik for superb blog.
Could you please tell,,
1) When we say MACD indicator,
Does it include MACD line only (12 EMA -26 EMA ),Or it also includes 9 day EMA line of MACD line along with MACD line ?
2) Which one would you use for swing trading , trading for 2-7 days,
9×21 EMA cross over ,or MACD ?
Thanks.
I usually refer to the entire MACD system which includes the 12, 26, and the signal line.
I prefer the simple crossover system over any indicator, including the MADC indicator.
Hi Karthik,
Thank you for such a quality literature for newbies like me.
Request you to quench my following queries,
1) Good combination of Indicators most suitable for Intraday trading. (e.g. X indicator works best in conjunction with Y indicator)
2) During Option trading the premium generally fluctuates a lot on either side, in such scenario,
a) How to put a SL ?
b) How to ensure risk to reward is 1:2 ?
Lesser the SL, more the probability of hitting the SL before the target.
Higher the SL, risk to reward ratio increases.
FYI : I buy CE/PE for intraday. I need to work on risk management of my trades.
I would be grateful to have your suggestion on the same.
Thank you.
Ameya
1) I personally prefer Moving Averages to check the trend, Bollinger bands for volatility, and ATR for setting stops. All these with candlestick patterns for price action.
2) For options, SL is ideally based on the spot prices. Same goes for Risk Reward
Also, I\’m not a big fan of trading options on a intraday basis. I\’d rather do futures.
hi Karthik,
Really great tutorials for you .. , never felt bored while reading.
thank you for your efforts.
Happy to note that, Abhilash. Keep going 🙂
Hi Karthik,
I would like to know the formula for calculating Stochastics Momentum Index (SMI). I have list of OLHC of an instrument with timestamp. Could you please help with steps?
I looked into few sites, not very helpful. Am getting wrong results than what kite chart shows.
Tried with Jul Nifty on day candle.
https://docs.google.com/spreadsheets/d/1WGQgk2rTbd-N6d_zmUtTjO9Zhp_VpHXQ5mRxS3nWV9U/edit?usp=sharing
Results were wrong. Can you pls help
Nirmal, I\’ve never implemented SMI formula, so I cannot really comment on this.
Nirmal, I\’m not sure about the formula used for SMI. I\’d suggest you check with chart school dot com. Thanks.
Its okay. no problem.
Good luck!
Nicely written, much kudos to you for all this hard work, time and effort put into this. I read options first but then it was so nicely written that i went back and started from the introduction itself. Thanks a lot !
Glad to know that, Rahul 🙂
Good luck!
Can u please include MACD Histogram?
Sure, will include this.
Any updates on this?
Update regarding?
will you include MACD Histogram?
I\’m not really sure if Histogram is a good tool to use, Vijay. In my personal opinion, histogram interpretation is quite hard and can get confusing.
Hi Karthik
Is there any way we can get Fibonacci levels in Kite charts?
Regards
Jay
Fib levels s available on Kite.
Hi Karthik,
In the MACD section, it is mentioned \”The sentiment is bullish when the MACD line crosses the 9 day EMA wherein MACD line is greater than the 9 day EMA. When this happens, the trader should look at buying opportunities\”.
However, in the Karnataka Bank checklist example, it says \”There is also an MACD crossover (signal line turns greater than the MACD line)\” as a buying opportunity.
Are these not contradictory?
Regards
Jay
Let me check this, Jaya. But MACD line = signal line.
Hi Karthik
Were you able to look at this?
Regards
Jay
Not yet, Jay. Swamped with work 🙁
You are right jay!
it should be when \”MACD line turns greater than the signal line\”
I could see in the comments above, that this concept has confused to a lot of people.
what people are missing is, signal line is EMA of MACD not price, hence it will always be less reactive to price and smoothen out changes in MACD line.
Chart is not updating in my kite.
Request you to do a hard refresh on your browser.
Sir are there any free softwares which can enable us to perform TA on stocks ?
If you have an account with Zerodha, then check out the charts in Kite, it has all the tools and utilities you\’d need for TA.
Hi Karthik,
I have gone through simple moving average (SMA) lesson and Bollinger bands (BB) lesson that is present here.
Pasted below the excerpts from both the lessons and I’m bit confused on the position to take when the current market price (CMP)is above the moving average.
Because, BB lesson suggests ‘sell’ when the CMP is above average price with the expectation that it eventually comes down to its average price and SMA suggests ‘buy’ with the understanding that traders are optimistic and willing to buy above its average price.
I know it is ultimately to my conviction to take a position on the trade but wondering how to interpret these two conflicting messages from these two indicators which are based on moving averages. Can you please help clarifying it?
Excerpt from simple moving average lesson –
The moving average can be used to identify buying and selling opportunities with its own merit. When the stock price trades above its average price, it means the traders are willing to buy the stock at a price higher than its average price. This means the traders are optimistic about the stock price going higher. Therefore one should look at buying opportunities
Excerpt from Bollinger bands lesson –
If the current market price is around the upper Bollinger band range (I.e., when the stocks trades above its average price) , then it is considered expensive with respect to the average, hence one should look at shorting opportunities with an expectation that the price will scale back to its average price.
Kind Regards,
Guru
Guru, although these two are based on averages, BB differs in the maths involved. BB tells us to what extent the prices have shot up or gone down wrt to the average price. The expectation is that it will retrace back to averages. MA, on the other hand, gives you a sense of how the trend is emerging.
Yes, I understand the confusion, but this how the indicators work. It is up to you to learn the nuances and apply them where you think it makes sense.
Thanks Karthik. I’ll now move on from this confused state ??
Kind regards,
Guru
Good luck!
Hi Karthik,
This is some amazing work you guys have done here.Don\’t think any other broker would provide such immense information and guidance for free.
Would be happy to see you to make it to the top position from the current 3rd in the upcoming years.
I do have a question on the checklists though.
1.When you say \’There should be a recognization pattern formed\’ as the first candlestick pattern ,would you also considered Doji and spinning Top as one ,as they show uncertainty ?
2.If a Doji/Spinning top is formed while also other parameters of the checklist(Vol,S&R and indicator) suggest to take a trade ,in your opinion would you suggest to go ahead with the trade.
3.And in a situation where all points of the checklist meet the critirion except the S&R one ,would you suggest to take the trade ?
I hope we hit that position and stay there, Laukik 🙂
1) These patterns although quite powerful works best in association with other patterns
2) Yup, I would
3) I\’d hesitate a bit. I tend to look at S&R more seriously than other parameters
Thanks Buddy 🙂
Cheers!
sir,
Thanks for your outstanding effort to improve the financial litracy of common man. This Varsity has helped me a lot & improved my confidence in terms of trading activity. Actually I have been facing loss so far . ( Investment 4000/- Profit 2380/- & loss 6100/- ) ,
Still I want to carry on, for which I want your support and help.
I have been going through the commends under the chapter 19, Finale , of TA, where I found following text :-
\” The higher the percent of deliverable quantity to traded quantity the better- What it means and how to see.\”
In kite under market watch one can see the TBQ & TBS . But How one can access to the deliverable quantity & traded quantity? Please explain sir,
Thanks & regards,
Rajan. A. T.
I\’m glad you liked the contents here, Ranjan.
Deliverable quantity means the number of shares which were taken for delivery into DEMAT. So higher the number of people taking this, then higher is the long-term interest in the stock and therefore gives a bullish perspective.
Sir,
Thanks for your reply,
But my query was \”How one can access to the deliverable quantity & traded quantity? \”
I mean from where I can collect these data ? – deliverable quantity & traded quantity –
I assume TBQ & TSQ are not \” deliverable quantity & traded quantity \”
Please explain sir,
Thanks & Regards
Rajan A. T.
You can download the bhav copy from NSE – https://www.nseindia.com/products/content/equities/equities/archieve_eq.htm this has all the details.
Thanks for your kind reply sir,
As a newbie myself, how can I identify these ( ” deliverable quantity & traded quantity ” ) from the opened site as per the given link?
More over, During the trading attempt do we have to put in additional time to find out these data?
What prompt me to do this task is mentioned below.
I have been going through the commends under the chapter 19, Finale , of TA, where I found following text :-
” The higher the percent of deliverable quantity to traded quantity the better- do this commend has any thing to do with the success of a trade? If the answer is \”Yes\” then there may be an easy method to find out this relevant data during the trading.In case the answer is \” NO \” I am sorry to disturb you.
Seems I failed to express my self regarding this query. Sorry for wasting your valuable time and effort.
Thanks
Rajan A.T.
You will have to download the Bhav Copy in CSV format and in that report, you will see the deliverable quantity. Don\’t worry, you are not disturbing you with these queries 🙂
Thanks for the useful content. Indeed helpful in making informed decisions. Just wanted to know your take on investing strategy for higher returns in short-term and long-term – value investing or canslim.
Thanks
Value Investing is my preference.
Hi Karthik,
Thanks for the useful content. Indeed helpful in making informed decisions. Just wanted to know your take on investing strategy for higher returns in short-term and long-term – value investing or canslim.
Thanks
I personally have more faith in Value investing.
Hi Karthik,
You and your team are doing tremendous job in empowering us in stock market. I struggled a lot in understanding the concepts of stock trading until I came across varsity. The content presented here is easy to understand. You know how we feel when we are sailing in the ocean full of water but actually looking for a bottle of water to drink and after nauticles of journey we actually saw not just an island but an island with full of coconut trees. That is an over abundant joy. And I’m feeling it for the past few months since I started with varsity modules. I’m so happy reading these modules and wondering how I missed it all this time.
Thanks to you and your team I started stock trading. To me the word thanks here is equivalent to the size of a tennis ball in front of the size of Sun. My deep respects to your and your team.
I have a question, is there any way on pi platform or any other website I can identify everyday a list of stocks that are promising (I.e., stocks that formed identifiable patterns, or confirming some indicators) upon which we can apply the TA and decide trade. I’m asking this question as there are hundreds of companies in the market and I can’t look at every company to apply the TA check list due to time constraint.
Thanks so much for your efforts and to Zerodha ?
Kind regards,
Guru
Wow! Thank you so much for all the kind words, Guru. Comments like these help up stay motivated and deliver better content 🙂
Coming to your query – I\’d suggest you start with studying Nifty 50 charts on a regular basis. I know this is time consuming and painful, but this helps in the longer run. It helps you get better and better with charts. If this does not work for you, then I\’d suggest you look for a screening software like this – https://screener.smallcase.com/welcome
Sir,
Thanks for your reply as follows Do check this video here – https://www.youtube.com/watch?v=sbRnbq99pfI&index=5&list=PLkxTRam6E2V-okv6gwQlt6dLTsn0v6CD1
This video shows How to place order on Stoploss basis.
Where as my query was \”I am a newbie, Please explain how the shorting order is to be done in Kite?\”
Regards
Please revert back
Thanks and regards
Rajan A.T.
To short a contract, you simply have to select the contract and press \’Sell\’. Once you fill the price details, go ahead and press submit, and you would have shorted the contracted/stock.
Thank you sir,
To select the contract means select the strike price call or put and then click on SELL and fill the rate and submit. Am I right?
thanks again.
Rajan Thekkeel
Yes, thats what it means, if you are trying to sell the option, Ranjan.
Thank you sir,
Rajan Thekkeel
Welcome!
Sir,
I am a newbie, Please explain how the shorting is to be done in Kite?
Regards
Rajan A.T.
Do check this video here – https://www.youtube.com/watch?v=sbRnbq99pfI&index=5&list=PLkxTRam6E2V-okv6gwQlt6dLTsn0v6CD1
HI Sir,
If the RSI or Bollinger band show a bullish sign (say RSI less than 30 or price at -2 SD line of bollinger band) but the candle pattern formed is a bearish maruboza pattern and all other checklist coincide with candle pattern ,except the indicator( which is in contradictory to candle pattern and other checklist item) ,then what to be done in this case?
1.Go by the candle pattern and other checklist and sell the stock.
2.Go by the indicator and buy the stock as it is oversold/overreacted.
3.Simply avoid the trade since indicator and candle pattern (along with other checklist) is contradicting to each other.
Also explain the thought process behind your choice.
\” if RSI or Bollinger band showing a bullish sign (say RSI less than 30 or price at -2 SD line of bollinger band) but the candle pattern formed is a bearish maruboza pattern and all other checklist coincide with candle pattern.\”
kindly explain what does this scenario indicate.
I did in your previous comment.
1) Go by the CS pattern
2) No, pay more attention to CS
3) This is also a possibility
Indicators are only supplementary, dont pay too much attention to it.
sir
what is smart money flow indicator & how to calculate it ?
Will try and put up a supplementary note on it sometime soon – https://zerodha.com/varsity/chapter/supplementary-notes-1/
Hi why no one is answering the support number
I have opened a account recently and the experience is not good
Please call me on 9930052883
Have you checked out the support portal? – https://support.zerodha.com/
If your issue is still not resolved, I\’d suggest you create a ticket from the portal.
Sir, How should we apply min crossover MA? As the input takes value for days and not for hours or mins? A bit confused..
Also, i want your suggestions on this analysis..
IDBI BANK EOD CHART 01/03/2018
The candle has formed bullish marubozu at 80.25. The volume is at 65150780 shares for the day. I was unable to plot the S&R. The Bullish marubozu has formed after the formation of flag pattern in the stock for 3 consecutive days. The indicators, RSI is near Overbought at 62.33, MACD has a magnitude of 3.68 and the ADX is at 36.21.
Is this the right approach to look at the stock technically. I had an urge to qualify this from you though I have already went long. Many a times i a unable to plot S&R is their any simple idea to do so?
Well, it does look like a long trade but I\’d kind of hesitate because of the long SL here. But anyway, good luck, hope it turns out to be a profitable trade. 🙂
Also, as long as you have a thesis backing your trade, you should be confident. Trouble is when you trade without knowing anything.
Arey ha.. never trade a candle less than 1% and more than 10 %, you said.. ? thanks for your advice sir..
Good luck!
You can overlay the MA on the minute chart and that should suffice.
Single candlestick patterns are not working in intraday trading.
1min/5min/10min candles which candles works best for intraday trading?
Which candlestick patterns work best for intraday trading?
I\’d prefer to look at 10 mins candles.
\”However, while dealing with the magnitude, always remember the price of the stock influences the magnitude. For example, higher the underlying price such as Bank Nifty, naturally, the higher will be the magnitude of the MACD.\”
Sir, i did not understand this point. can you please explain?
This means to say that the MACD value is also dependent on the stock price, for example, MACD for Ashok Leyland could be 19, but for Bank Nifty, it could be 190.
If the macd line is at 5 and the 9 day ema line is at 7, does that mean their is more volatility in the stock? Also, how to identify momentum stocks? Please explain sir..
Since they are almost around the same value, I\’d assume there is a sideways moment in the stock. Does not really indicate volatility.
Sir, how should we identify momentum in a stock? Does it need ithe research at NSE as well rather than charts. Am asking this because momentum generates more profit than plain market. So curious to know!
Thank you ?
You can always check few momentum indicators like MA, ADX, +DI etc. These indicators helps you identify and quantify momentum.
Hi..can you please clear my confusion .I am confused when should we look for buying opportunity when signal line( 9 day EMA) should be above the MACD line or below.There is contradiction in your explanation part and in your last stated example.
Shweta, its a buying opportunity when MACD line moves over the Signal line(9 Day EMA), selling opportunity if MACD falls below the Signal line.
Read it through, don\’t find any contradictions.
Thank you for clearing my doubts.
Regards!
What is the difference between the person who trade using candle stick pattern along with indicators and the person who trade solely depending on MACD, RSI, and volumes?
I believe your chances of a successful trade is enhanced when you look at candlestick patterns.
Am not getting EMA is calculated here. I checked with the formula and figures are not matching.
Can anyone share the EMA formula derivation ?
I guess the calculations here are for SMA and not really EMA.
I didn\’t understand the convergence and divergence of the MACD line. Convergence means when the difference between the two MA reduces. Divergence means the difference increases. So going by this definition when MACD line comes closer to 0(irrespective of whether it comes from + or – side) it is convergence while if it goes away from 0 it is divergence. But in the explanation it is mentioned as if the MACD line crosses 0 from above(goes from + to -) it is convergence while if it crosses it from below(from – to +) it is divergence.
The location of this discrepancy is just below the very first MACD line plot.
The exact lines are
As you can see the MACD line oscillates over a central zero line. This is also called the ‘Center line’. The basic interpretation of the MACD indicator is that:
1. When the MACD Line crosses the center line from the negative territory to positive territory, it means there is divergence between the two averages. This is a sign of increasing bullish momentum; therefore one should look at buying opportunities. From the chart above, we can see this panning out around 27th Feb
2. When the MACD line crosses the center line from positive territory to the negative territory it means there is convergence between the two averages. This is a sign of increasing bearish momentum; therefore one should look at selling opportunities. As you can see, there were two instance during which the MACD almost turned negative (8th May, and 24th July) but the MACD just stopped at the zero line and reversed directions
In the above two points the terms convergence and divergence can be dropped.
Agreed, will clean this up. Thanks again.
Noted.
Agreed, thanks for pointing this out. Will do the changes. Basically, the crossover from -ve to +ve area indicates bullish momentum and the crossover from +ve to -ve indicates bearish momentum.
It is mentioned as 9-day EMA of MACD in the chapter and as 9-day SMA in the Key takeaways. I guess EMA is correct since it has been mentioned in multiple places. Am I correct?
Yup, EMA.
Hi Sir,
One more doubt regarding BB.
Should we need to validate the checklist points before we initiate the trade based on BB like candlestick pattern,volume ,R&S,etc or when the price touches the BB ,we can simply initiate a trade (without validating checklist),with the expectation that price will revert to average?
Why i ask this is whenever the price touches the BB , I find that price returns to Avg price very quickly ,that when i wait for the (15 mins )candlestick patterns and all other checklist points to confirm, i miss the movement entirely.
Yes, its always better to check the checklist. Remember, the indicator is only a secondary confirmation.
Hi Sir,
You have explained that,in Bollinger bands , if the price touches the Upper or lower band then it is expected to move to average.But my doubt is, what if the CMP is above the Upper band/ CMP is below the lower band (mean if the price has breached the bands),still is it expected to return to average or it would drift the same direction?
There is only a possibility of the price reverting to mean. In fact, some traders even expect the price to increase or move in the same direction when the price hits the upper/lower bands.
Hi Sir,
1. What if the price had already CROSSED the upper/Lower BB.Still the price will revert to mean or will continue the same direction?It was explained in the chapter that if the price touches the upper/Lower band there is a possibility to revert to mean.Does the same applies if the price had CROSSED the bands too? Because in Average true range band,you have mentioned that \”If the stock price PENETRATES either the upper or lower envelop, then the expectation is that the stock price will CONTINUE to move in the same direction. For example if the stock price has penetrated above the upper envelop, the expectation is that the stock will continue to move higher\” and you have also said that \”ATR bands can be used as an alternate to the Bollinger Band trading system\”.
2. In the technical analysis module you have explained about the trend reversal candlestick pattern.Can you give some insight on trend continuation candlestick patterns and explain them in detail (in a separate chapter) as you did for trend reversal patterns?
1.Once the stock crosses the upper/lower band, it forms an envelope expansion, it is more likely to continue with the trend it is in and unlikely to fall back to the mean. Average True Range bands work almost like BB and essentially can be taken as a Buy/Sell signal once the stock crosses the bands
2. The reason not a lot of trend continuation patterns are covered as don\’t help in picking a trade, however, you could use S&R and moving averages to identify the strength of a continuing trend
Hi,Thanks for nice chapter……is zerodha has super trend ,DMA indicator..in kite ?
Kite has Supertrend, however, Displaced Moving Average is not available.
Hi,
Can any one share the methodolgy used to calculate Stochastic in excel
Thanks
Will try and do that as a supplementary note. Thanks.
Hello Sir,
Thanks for your prompt reply
As to when can I expect a revert on the same from your side
Thanks
Meet Shah
I need to build this into excel. Will try and do this when possible, hard to commit a timeline.
Dear Sir,
Would be eagerly waiting for your response
Thanks
Meet Shah
Ok.
Hey Karthik,
In section 15.4, while mentioning the 4 checklist for buying position in KBL, the 4th point mentions MACD crossover.It is mentioned as signal line crossing over macd line. I think it needs to be macd line crossing over signal line. Please check. Correct me if I am wrong.
Thanks!
I think this is correct, Pushkar. Can you re-read this once? Thanks.
Cool. Thanks a lot karthik. Really happy to get one to one response from you. This would definitely prompt me to get more users to zerodha. 🙂
Good luck, Manoj!
There are cases when stock moves up without reaching the support or vice versa. If I look for pattern and S&R I will miss out on many opportunities. Isn\’t it?
I have another query, how do I screen stocks for trading? I tend to stick to a particular set of stocks present in my market watch.
Yes, remember TA only enhances the odds. No guarantees here. That is, in fact, a great approach. I stick to Nifty 50 🙂
Hi Everyone, I have been studying TA from Zeordha’s Varsity section.
Under indicators (MACD) section, it says, IF SIGNAL (SMA 9) LINE IS ABOVE THE MACD (12-26), ONE SHOULD TAKE LONG POSITION AND IF SIGNAL LINE IS BELOW MACD, ONE SHOULD TAKE SHORT POSITION.”
When I matched the SIGNAL LINE AND MACD CROSSOVER, it did not coincide with the price behavior. That is, Signal line above MACD line but stock was not in uptrend. It moved sideways. I understand that MACD is a trend indicator but how do I know that the crossover will result in trend or whipsaws.
Please help
Any indicator which incorporates moving averages cannot really avoid whipsaws, this is the inherent drawback of averages and there is no way you will know beforehand if a move will transform into a trend or die down as a whipsaw.
Understandably so karthik, but JSW Steel behaved totally opposite to what Indicators suggest, I mean, even if Signal Line was above MACD Line the stock was in downtrend.
How do I deal with it? Despite studying the indicators, i am unable to get clarity on a stock.
Manoj, this is not surprising at all. Hence my dependence on indicators is quite low. I prefer to look at the candlestick pattern to make trading decisions and the indicators only sort of confirming the decision. I\’ve stated this on the checklist as well.
Yes. You have mentioned it in the book. But there are multiple instances where without any recognizable pattern formation the scrip has moved up. Am I expecting a lot out of indicators?
What should i do to enhance my understanding and to increase my knowledge of Technical Analysis.
Kindly Guide
Look for the pattern and volumes, I\’d also suggest you pay more attention to support and resistance. Don\’t spend too much time one indicators.
Thanks Karthik for the help !!
Candidly speaking, as far as Zerodha\’s services are concerned, Varsity is one of the best and the best part of Varsity is you.
Just one more question though, how to check realtime premium value of options ?
Thanks for the kind words, Saify. I\’ll take that compliment on behalf of all my 900+ colleagues 🙂
You can see the real-time premium value on kite itself. Just load the option on your Marketwatch and check out the trades on a real-time basis.
Hi Karthik,
Hope you are doing good.
While reading through the above comments, one of the user \”Sooraj J Mishra\” had wrote that he was buying premium.
Being a novice, this is confusing me. I would appreciate if you could tell me what he meant when he said he was buying premium?
As far as your other chapters are concern, you have taught us these below stuff :
Call Option (Buy)
Put Option (Sell)
Call Option (Sell)
Put Option (Buy)
Could you confirm what exactly is buying premium.
Thanks
Ah, I think he meant to say that he has bought an option by paying the premium. Either a buy call or buy put 🙂
Thanks !
Could you confirm, both call option & put option buy, can only be exercised on the expiration date ?
If yes, I am failing to understand the difference between the two. why use one over the other ? Pls help.
Hi Karthik,
Please confirm when buying CE only for gaining from selling basis on high premium, is the premium only the thing to watch ? What i meant is out of all the values such as strike price, underlying value etc. the value to watch is premium ? Since i would be squaring off most of the time.
If yes, can we check realtime premium value on kite/pi ?
If you doing this on intraday, then yes, you can concentrate on option premium.
Yes, that is because they are European in nature. Have you read the module on Options? If yes, I\’d suggest you take a look at this – https://zerodha.com/varsity/module/option-theory/
So, I have a doubt about the Bollinger Bands. Say, I want to change the MA type from 20 SMA to 10 EMA… How would the calculations of the bands get carried out then ??
Instead of calculating the standard deviation of 20 SAM, the indicator would calculate for the 10 days EMA. Everything else would be the same. Also, you will end up getting a lot more signals to trade with 10 EMA, but please be aware, lot more does not necessarily mean quality.
Good evening Karthik,
Firstly, thank you for the prompt response and advise.
Secondly, while you are calculating the Bollinger Bands on the SMA, you would be calculating the standard deviation of the last 20 close values.
When you get to EMA, what you be calculating the standard deviations on ?
For example (pseudo code) on Today\’s NIFTY-
a = [10291.45, 10295.0, 10297.05, 10292.6, 10291.3, 10290.0, 10288.45, 10290.2, 10289.7, 10290.95, 10292.8, 10290.75, 10290.4, 10290.7, 10293.65, 10298.25, 10296.0, 10298.6, 10302.1, 10302.8, 10302.5, 10305.1, 10306.05, 10302.25, 10295.6, 10294.2, 10291.9, 10296.5, 10297.05, 10296.2, 10303.35, 10304.65, 10308.95, 10310.55, 10306.6, 10300.0, 10302.85, 10301.1, 10299.5, 10298.7, 10299.85, 10302.1, 10303.4, 10302.35, 10304.45, 10302.2, 10303.65, 10305.35, 10307.7, 10313.9, 10313.95, 10317.1, 10319.15, 10321.5, 10319.3, 10320.65, 10322.2, 10322.3, 10323.6, 10325.2]
standard_deviation(a) // This is the Standard Deviation for the SMA or in other words, the width of the bands.
However, this would not be the same calculations for EMA.
Even if you look at the Kite app, both the width and the location of the EMA Bollinger Bands are different from the width and the location of the SMA Bollinger Bands.
Could you please confirm ?
Thanking you in advance,
Akshay C Goyal
That\’s because EMAs are calculated differently than SMA.
Hi Karthik,
RSI indicator shows in range of 40-60 even if the stocks are at 52 week high or all time high. What could be the reason? I have noticed for many stocks and hence raising this issue.
That means, the momentum (in terms of % change) is not high enough to be classified as overbought/oversold.
[…] https://zerodha.com/varsity/chapter/indicators-section-2/ […]
Hi Zerodha,
Please add Elder Impulse System indicator in PI. It is available in Kite, but I prefer trading on Pi.
Thank you in advance.
Nevil, currently we don\’t have this indicator available but I\’ve given your feedback to the Pi Development Team
Hi Kartik,
In some websites, the value of divergence is given. What does this indicate ?
Guess I\’ve covered this in the supplementary note.
pls provide full stochastic on kite,
tx
We have that on Kite already. Goto studies and look for it.
Hello Karthik,
Its wonderful and worth appreciating the efforts put in the development of Pi and Kite so far.
In Kite there is only one Stochastic and another is Stochastic Momentum.
Appreciate if you let the user set the %K, %D and Period values according to his/her preference rather than just allowing the user to enter period.
Each setting gives different result that suits his/her trading style/strategy.
Currently, user can change only period value, while %k and %D values are unknown !!! and cannot be changed.
Thus, kindly do the needful so that user can use his/her own values for period, %k and %D – there by making this full stochastic.
I understand Vinay, hopefully, this will be fixed soon.
I think, this is not fixed yet Mr. Rangappa. It would be so useful and helpful, if you let your customers set the %K and %D values on \’Stochastics\’ indicator.
Can you give us (stochastic RSI ) indicator in kite.
Currently only stochastic indicator is available
Thanks
Will look into this, thanks.
did u looking into this???
stochastic RSI on Zerodha
We have just Stochastic and Stochastic momentum index on Kite, Girish. Not Stochastic RSI.
did u look into this???
availability of stochastic RSI on Zerodha.. its thr on investing.com for free!!! we r paying u 🙂
Girish, the charting engine on Kite and Pi is from a 3rd party. Will pass on the request to include stochastic RSI, hopefully, they should accommodate this.
By the way, the only thing you are paying for is brokerage, that too if you are doing intraday or derivatives. Everything else is free, including Varsity 🙂
Which one is a better indicator among MACD and moving average crossover ?
Both are momentum based, I do have a soft corner for MAs.
Dear Karthik,
I may be wrong but i do not digest indicator input period being in days. For example, for MACD we r using 12 & 26 days EMA and 9 days EMA for signal line. I think this is fair for long term or positional. But for intraday it should be in hours and minutes because everyday is different. If i want to enter at 12 pm what is the use of above periods, i should be able to plot data from 9:15 am onwards so that i get an indication for that day only. Same doubt for all such indicators. Please reply as I said I may be wrong. Thanks.
Yes, in case of intrday you need to load this on 5 or 10 mins charts. The the timeframe frequency will automatically refer to intraday data.
what is Convergence and Divergence??
Convergence in terms of moving averages is when two averages meet and divergence is when the two moving averages move apart.
but how come the two averages there can be only one average
Since this is a moving average, the average value depends on the time frame. It could be 10 day MA or 20 day MA…really depends on what you choose.
ok ok ok thankyou so much i got it
the two averages are the no. of sessions u consider for average ie 12 day ema and 26 day ema
am i right
Yes Sir!
Hello Karthik,
Thank you for your efforts.
Can you please help me with the below doubt?
Conversion and diversion as explained in this chapter:
\’When the MACD Line crosses the center line from the negative territory to positive territory, it means there is divergence between the two averages. This is a sign of increasing bullish momentum; therefore one should look at buying opportunities. From the chart above, we can see this panning out around 27th Feb
When the MACD line crosses the center line from positive territory to the negative territory it means there is convergence between the two averages. This is a sign of increasing bearish momentum; therefore one should look at selling opportunities. As you can see, there were two instance during which the MACD almost turned negative (8th May, and 24th July) but the MACD just stopped at the zero line and reversed directions\’
When the MACD is at/around the zero line, it means that the two EMAs have no difference. -> Should not this be considered as \’Conversion\’?
When the MACD line goes over/under the zero line -> The variation between the 2 EMAs is increasing -> Should not this be considered as \’Diversion\’?
When the MACD is at/around the zero line, it means that the two EMAs have no difference. -> Should not this be considered as ‘Conversion’? and the other query you posted – If the MACD is around the zero line, that means that there is no trend. Perhaps the stock is moving sideways. Hence no point trading on MACD.
if i want to become an investor and invest for long term do i still need to learn technical analysis
No, not really. Fundamentals is good enough.
do not i need to learn TA even at all??
No harm learning 🙂
how to set MACD line in kite please advice
Click on select and choose MCAD from the dropdown.
i would like to know abt the ichimoku indicator ! i cant add it in the PI scanner ! ive seen the formula on algos and strategies but it doesnt get added in the scanner !
Can you please drop an email to – [email protected] regarding this?
Hello,
I have just started my trading experience. Being an amateur, I have made losses on intraday too much which put me to learn and practice before investing my hard earned money. I would advise newbie\’s to go through varsity at least 3 times to get a good understanding of trading.
Now, coming to my question, I have some doubt while applying TA.
Today (21st July,17), Reliance made headlines after AGM. And that caused the company\’s share to grow 3.67%.
Now for a newbie trader like me, I was applying my learning and the checklist posted at the end of this chapter to decide whether is this a good time to buy shares or not. Today\’s candlestick was bullish marubuzo. RSI level is closed to overbought(75.87). Average Volume(10 points) is also way high than average which confirms buyers at every price point. Now S&R(using Pivot Points) tells me a different view and the closing price has crossed RL1 and RL2. Even MACD and (EMA 25 & EMA 25) indicates that the stock is good for purchase point of view.
Q1) What can be the possible outcome of the situation?
Q2) What is the difference between MACD and moving average crossover system?
I\’m happy you are learning through Varsity 🙂
1) When a stock has strong fundamental news, please do not use TA. FA over rules TA around corporate events
2) MACD uses another round of averaging…whereas a simple crossover system does now.
Dear Sir,
I have some queries:
1. As you said MACD is an upgraded and more reliable version of MA crossover, then should we discard the moving average as indicator and learn the MA only as a core concept to understand other indicators, or, the MA crossover still have some advantages and reliability over MACD?
2. What does the BB mean when the price around 20 SMA, should we consider it as neutral and neglect it or it also have sth to say?
3.Say we are looking the indicators (MACD, RSI, OR BB) for intraday with 10 min chart, in this case should we wait for the 9, 20 or 14 candlestick to appear for that particular day or we should include the previous days 10 min intraday charts for using indicators?
My concern here is that if we should also include the previous day chart, will the indicators not give false signal incase there is sth important news about the stock (as most of the candles are taken from previous days chart for calculation)?
Regards
Dear sir,
One more thing I want to ask \”Can we use the +2 and -2 values to reinforce our S&R points i.e. can we take a side view on these values to decide our TARGET and SL
Regards
Not too clear about what you are trying to ask. Can you kindly elaborate please? Thanks.
1) Although MA forms the core of MACD, I like MA for its simplicity. Its like samsung vs motorola…end of they day, they all use sony camera lens.
2) BB should be read wrt to the standard deviations and not really with the averages
3) You can probably take the previous day\’s value…but I\’d prefer to look at present day\’s data
I wasted 3 days in understanding the MACD and SMA combination, I thought there is something wrong in me but after reading the comment section I got it clarified.
At last, I want to thanks Zerodha Team for providing us with quality products and that too at no cost.
Happy reading! Good luck!
Hello,
So if MACD line crossed the signal line( MACD line above the Signal line) then we consider it as a Bullish and consider it as a buying opportunity. Is my understanding correct? Example Ashok leyland on 25th May, MACD line crossed the signal line.
And also is there any way to scan these stocks where MACD line crossed the signal line.
Please clarify.
Regards,
Hima Pallela
Yes, a crossover is considered bullish. You can use the expert adviser feature on Pi for scanning – https://zerodha.com/expert-advisors/
I am interested to use Keltner Channel indicator in kite with settings 20 EMA and ATR 1 to be used in 5 or 15 minutes chart. But I find in your settings you have given period as 50 and shift as 5. Does it mean EMA and ATR respectively which I can change as 20 EMA and ATR as 1 as per my requirement. please clarify.
I guess you can customizes it to whichever values you need.
1.) what if the volumes, S&R levels and indicators confirm a long or short position but there is no evident candle stick pattern then should we take the position? similarly if candle pattern is there with S&R levels and indicators confirming a long or short position but without volume then what ?
2.) while the volume crosses the average volume of last 10 days most of the price action has already taken place. so do while taking the position do we assume that the same price trend will continue ?
3.) what is one indicator says yes and other says no? eg the current price is at the -2SD of the BB and RSI value tells that the stock is overbought, then what?
1) I would not take it. For me, CS pattern (which is the price action) would matter the most. I may at time turn a blind eye to volumes…but this really depends on many other factors. Like the overall sentiment in the markets/sector/stock etc.
2) Yes, that is the premise of TA
3) This is bound to happen. You will have to go with the indicator that you trust the most. When I say trust, it has to be by means of rigors back testing.
Topic: Bollinger Bands (BB) (B.Bands) VS Simple Moving Average (SMA)
Hello, I have become a regular reader of zerodha now..
I was looking at a chart and plotted 20 day MA and a Bollinger Band and I was caught by surprise that they both are based on Moving average but the interpretation to initiate a trade are opposite. BB says, If stock price trade above the MA line (near or above the +2 SD) then we should look for shorting opportunities, but the SMA line says look for buying opportunities in such a situation. So, how to deal with this?
One solution I could think of is:
If a stock is trading above the SMA line but below the upper band of BB we should look for buying till it hits the upper band of BB.
Please suggest if I am thinking correctly.
BB is an indicator for the mean reversion strategy, works very well for short term trades. MA is best suited for slightly longish time frame trades.
Hello Zeordha,
Can you please create an indicator for the below logic:
x = LTP
y = number of time periods ago
T1 = +1
if x >= x – (y+1) periods
else -1
T2 = +1
if x >= x – (y+2) period
else -1
T3 = +1
if x >= x – (y+3) period
else -1
T4 = +1
if x >= x – (y+4) period
else -1
T5 = +1
if x >= x – (y+5) period
else -1
T6 = +1
if x >= x – (y+6) periods
else -1
T7 = +1
if x >= x – (y+7) period
else -1
T8 = +1
if x >= x – (y+8) period
else -1
T9 = +1
if x >= x – (y+9) period
else -1
T10 = +1
if x >= x – (y+10) period
else -1
Value = SUM(T1:T10)
so the indicator would always swing between +10 to -10
Request you to please please suggest how to code this indicator in PI….
Request you to please get in touch with Sreeni for this – sreenivasulu.m at zerodha.com
Hello Nitin,
If i want to combine two or more indicators and generate a customized indicator or if i want to generate an indicator(a graphical representation like other indicators not just an alert to signal buy or sell) using a code how do i do it?? in PI and at the same time have access to my indicator in KITE as well??
You can build a custom indicator to use along with both Pi and Kite – however, you need some programming background for this. For Kite you can use our APIs – https://kite.trade/…and in Pi you can use the expert adviser feature here – https://zerodha.com/expert-advisors/
I think there is a mistake in above MACD LINE and MACD SIGNAL example,
In first vertical line from left MACD signal is above of MACD line, one should look at buying stock and in second vertical line from left MACD Signal is below MACD line, one should look at shorting opportunity,
If i am wrong correct me, because i am bit confused after watching the graph second time?
I have inadvertently messed up the MACD section. I\’ve been intending to fix it for a long time now 🙂
[…] You can even use the ATR bands as an alternate to the Bollinger Band trading system. You can read more about the Bollinger Band (section 15.2) […]
The sentiment is bullish when the 9 day SMA crosses over the MACD Line wherein the 9 day SMA is greater than the MACD line.
however Sir when you were discussing on graph at first vertical line from left signal line(red) moves over MACD(black), so that would be the case of long opportunity but there you stated we should look for shorting stock
Arent these 2 statements contradicting?
For the first vertical line also MACD is less than signal after crossover
Prakhar, I\’ll update the part very soon.
The sentiment is bullish when the 9 day SMA crosses over the MACD Line wherein the 9 day SMA is greater than the MACD line. When this happens, the trader should look at buying opportunities
The sentiment is bearish when the 9 day SMA crosses over the MACD line wherein the 9 day SMA is lesser than the MACD line. When this happens, the trader should look at selling opportunities
The chart below plots the MACD indicator on Asian Paints Limited. You can see the MACD indicator below the price chart.
M2-Ch15-Chart2
The indicator uses standard parameters of MACD:
12 day EMA of closing prices
26 day EMA of closing prices
MACD line (12D EMA – 26D EMA) represented by the black line
9 day SMA of the MACD line represented by the red line
The vertical lines on the chart highlight the crossover points on the chart where a signal to either buy or sell has originated.
For example, the first vertical line starting from left points to a crossover where the MACD signal (9 day SMA) lies below the MACD line and hence one should look for a selling opportunity. The 2nd vertical line from left, points to a crossover where the MACD signal line lies above the MACD line, hence one should look at buying opportunity.
Sir I have just doubt while understanding the chart and theory together as you wrote the 9 day SMA(red line) is greater than MACD line(black line) then it is a buying signal where in the chart the red line is greater from black line where it is showing sell signal.
What is the exact thing can you please clear?
Sammandar, I\’m just about to finish the commodities module, once this is done, I\’ll fix the MACD chapter. It high on my priority. Request you to wait for few more days. Thanks.
Karthik, I was going the NSE TAME charts and found this – \”Most common signal is MACD crossing over the signal line. A buy signal is generated when MACD crosses up through the signal line, where as a sell signal is generated when it crosses down through the signal line\”. This is exactly opposite what is give here (Buy signal is when the 9 day SMA crosses over MACD). Could you please confirm which one is correct ?
What you\’ve mentioned is right. I\’ve made a mistake in this chapter…and I\’ve been meaning to correct it.
how can i install my additional custom indicator on pi?
You can build your own logic using expert advisor feature in Pi.
Thanks a ton Karthik for the beautiful explanation of all this. I have two things:
1st query is about MACD. After introducing the 9 day SMA signal, we are totally ignoring the negative and positive territory aspect of MACD (i.e. above or below level 0), but the Kite application MACD study still shows the territory. Does it signifies anything standard if the crossover is being made in positive or negative territory.
And the 2nd thing is about the update portion of MACD 🙂 now the time has come for this :). Please update the part of the chapter with this:
1. The sentiment is bullish when the MACD Line crosses over upside the 9 day SMA signal line as MACD Line is more reactive to current prices as signal line is an average of MACD points itself. When this happens, the trader should look at buying opportunities.
2. The sentiment is bearish when the MACD Line crosses over downside the 9 day SMA signal line. When this happens, the trader should look at selling opportunities.
AND A SMALL PORTION OF EXAMPLE:
For example, the first vertical line starting from left points to a crossover where the MACD Line crosses downside the signal line (red one) and hence one should look for a selling opportunity. The 2nd vertical line from left, points to a crossover where the MACD line (black one) crossed upside the signal line, hence one should look at buying opportunity.
Thanks Sir
We cannot change the way this appears on Kite simply because we have integrated 3rd party charting engine within Kite. I understand MACD needs an update, will surely do this once the ongoing module on commodities is done.
By the way, thanks for the kind words 🙂
5X13 EMA with ADX and RSI combo seems to be working for me to earn consistent decent profits intra day basis.Thanks for all the great explanation provided here.
Cheers!
In between the 2 vertical lines in MACD chart for Asian Paints, there are several instances of the MACD crossover (on both sides)… looks like these are false signals… is there any way we can identify which is a false signal and which is a true one?
Its a tough call, especially when you start off… you will get a sense of this when you practice many trade set ups with MACD.
Hi Kartik,
Thanks for your wonderful lessons i am slowly getting the hang of the game.
I notice an error In the MACD example of Asian paints i think the Pink line should be MACD line and the black line as signal line if i go by your explanation.Pls correct me if i\’m wrong.Thanks
Yes, the MACD explanation needs to be cleaned up a bit. It been pending for a while from my side.
How can we find the envelope expands? Is there any specific range to be maintained between top and bottom lines to ensure the market is sideways?
You have to track the envelop values, if the market trends then the envelop tends to expand.
Please throw some light on ideal envelope value?
There is no such thing as idea 🙂
D/Sir,
as per above tutorials, bullish scenarios occure when EMA9 (signal line) crosses and become more that EMA21. However in expert advisor while coding but script is mentioned as.:
EMA(CLOSE,9)REF(OPEN,1) AND
REF(CLOSE,2)< REF(OPEN,2) AND
REF(OPEN,1)REF(OPEN,2)
Kindly clarify the same sir.. 🙂
sorry its ..
buy* script mentioned as:
EMA(CLOSE,9)REF(OPEN,1) AND
REF(CLOSE,2)< REF(OPEN,2) AND
REF(OPEN,1)REF(OPEN,2)
I\’d suggest you email my colleague Srini for this – [email protected]
Which data do you choose to select the support and resistance for intraday trading
Price data.
Hi Karthik, from pure intraday trade persepective if i use 12EMA, 26EMA, 9SMA MACD or 20 SMA Bollinger band indicator, then what is ideal intraday chart for checking 1st and 2nd checklist point which you have highlighed in module. Because 1minute, 5 minute or 10 minute chart candlesticks will be different at a particular time.
I know, for all practical reasons, I prefer using the 10mins or maybe 15 minutes chart.
Hi,
I have been confused a lot by your chart of asian paints in the MACD line and the 9 day SMA of MACD line.
I believe that you have explained the strategy to follow in chart wrongly.
I think some modification is to be made to the below paragraph :-
With these two lines, a trader can follow a simple 2 line crossover strategy as discussed in the moving averages chapter, and no longer wait for the zero line cross over.
1. The sentiment is bullish when the 9 day SMA crosses over the MACD Line wherein the 9 day SMA is greater than the MACD line. When this happens, the trader should look at buying opportunities
2. The sentiment is bearish when the 9 day SMA crosses over the MACD line wherein the 9 day SMA is lesser than the MACD line. When this happens, the trader should look at selling opportunities
Furthur I think that there has been an error on page 62 point 4 of the checklist, the point written is as follows :-
4. There is also an MACD crossover (signal line turns greater than the MACD line)
In the bracket it should be written that the MACD line turns greater than the signal line for bullish pattern.
I have been very much confused with this whole MACD line and 9 days SMA of MACD line pattern and would like to know weather I\’m thinking right over here or there has been a understanding problem by me. Please help me out here. Thanks.
Ayush – There has been some confusion with MACD chapter. Mistake is from my side…and unfortunately I\’ve not been able to put up the correct stuff as I\’ve been busy with few other things. Will do this as soon as I can.
Yeah, reading all the above comments I became sure that I\’m not the only one with the confusion in MACD Chapter.
I just want to make sure that the bullish pattern through MACD line and 9 day EMA of MACD is formed when the MACD line turns greater than the signal line ?
Thanks for your reply and waiting for the updated MACD chapter.
Yes, a crossover of 9 and MACD indicates bullishness. Will update this soon. Thanks for your patience.
sir,
excellent work……
i have 1 query
i m new & interested intraday trading
1]which time frame is good for most successful intraday
2] is their S&R line developed automatically in pi
3] what details about scanner in pi
4]whether backtest use for intraday
waiting for your reply
1) Depends on your appetite and there is no straight forward answer to this. I prefer to look at 10 or 15 mins data while trading intra day.
2) Nope, also its best if you can plot it
3) Check this – https://zerodha.com/expert-advisors/
4) Yes, you can.
Hi Karthik Sir,
A little confused in MACD & Signal line crossovers when to go long & short.
Can you please explain in brief ?
This is long due Shafeeq, I will re write the MACD chapter all over again very soon.
Greetings Sir,
I am a newbie, striving to be a trader !
First of all let me tell you, Varsity course is the most comprehensive, well structured & a detailed course especially for a newbies like me. I have not come across such a course even after googling a lot on the web. I believe, Varsity stands out in the crowd!!!
Truly respect your efforts and endeavor for providing such a fruitful learning for all of us.
I have been seriously following the course, chapter by chapter and by the grace of God, it was easy to digest until now.
I have a small question for you sir, that your have stressed on a point in this lesson that the low of the candlestick should be around the support price for a long position. My specific queries regarding this are :
1. Why it is so important for the low & support to match?
2. What if the low is way below the support level? and
3. What if the low is quite above the support level?
Please suggest and guide, What should I infer or draw conclusions in these situation& What should be my action plan on these trade !!!
Regards.
Shafeeq, thanks for the kind words and encouragements. Words like this encourage us to do better and better 🙂
1) If the low and Support coincide, then it gives us the confidence that the support level held on and therefore market made a low at support.
2) Then the support becomes the resistance. Remember support and resistance are interchangeable based on the last traded price of the stock.
3) I\’d personally be a bit uncomfortable taking long positions when support is still far from low, it gives a feeling that the market could fall further.
Thank you very much Sir !!!
Appreciate your kind and gentle response to my queries !
\”Cleared my doubt, Clearly!\”
Regards ! May God Bless You Sir !
Thanks Sahfeeq 🙂
how to read Rain Bow indicator
Not sure!
Hi Karthik,
Please define about MACD histogram.How is it different from MACD?Is the former indicator helpful for day trading when plotted in 1 min chart?
I plan to re write MACD chapter altogether, I will include the histogram piece in the new article. I\’d suggest you to please wait for few more days. Thanks.
I see that you had mentioned about documenting histogram 2 years back, still I don\’t find it.
Dear Karthik ,
I was reading the comments thinking it will solve my confusion. but I found that many people have same confusion as of me about MACD and 9 Day SMA signal. You still haven\’t changed the content of MACD and 9 day SMA signal. there is confusion regarding what you are saying and what digram is showing. Please do the correction as you have promised to do it in earlier comments.
and Please Reply
Thanks,
Sushant, I\’m sorry about the delay..its just that I\’m caught with the 2 modules on Options. Will probably re write the whole of MACD chapter sometime soon (week or 2) to make things clear. Meanwhile we will be putting up a supplementary notes in TA module by today/tomorrow which will contain quick notes about 10 indicators.
Hi Nithin,
Posting it in here as you advised \”Your answers would be of help to many TRADERS like me\”
With lots of indicator options to choose from Pi, i have so far tried
1) Q stick,
2) Bollinger bands
3) Elder bull power
4) Elder thermometer (seems good enough except that it shows the trend only after it peaked/dropped, aint)
after starting my trades in Z ..
The above are apart from what i use normally like
1) Candle stick patterns,
2) Wedges (rising and falling)
3) Volume price indexes –> balance b/w buy and sell volumes
4) RSI along with bull/bear sticks (Jap/Ham)
which have helped arrive at good guesses.
But i do find that for the below reasons, some of them are not able to give a clear signal on buy
1) despite the q stick showing 3 or 3 and above on crude sometimes, the actual trend is correction for volatility being the KILLER.
Unable to go with conviction, that it\’s okay to buy based on climbing slope shown as the sell volumes remain Extremely volatile, it happened yday on copper in the eve, even on crude for a while
–> is it okay to use, as it\’s misleading in cases like above.
2) B Bands/other averages/band only suggest the avg that can be a safe but can\’t be a good bet to realize good enuf profits after all taxes charges by SEBI, Exch & govt,
\”ONLY POSITIVE\” being \”Zerodha\’s RETAIL FRIENDLY Brokerage\”..
—> following THESE indicators only lead to very minimal profits most times. This doesn\’t mean a MEAN profit is not respected, but then again as all of us would agree, some more killers by Govt.,
to take care of despite huge risks taken to earn them, no solace from them though they advocate all to invest/trade 😉
3) In your RICH trading experience,what\’s the best indicator to use among SO MANY GOOD Ones (given in Pi) to make a near accurate buy/sell call at any point
4) On shorting, Wedge along with RSI (i try to pick by 70-75 ranges as 80 is not possible always), proxime bear sticks have been helpful but during volatilite volumes every min, unable to judge
For i love the famous words, \”Shorting is the trade for Profits\” most ttrying times , if one is sure about the TREND 😀
Pls enlighten!
Thanks for your time to read this, your availability to reply to trivial doubts from clients, willing to share thoughts, inputs despite being a HIGHLY SUCCESSFUL CEO of a terrific Enterprise!
Regards,
Sri RAM
—
PS: Trading had never been such a delight before using PI (π)
Thanks for posting this, I\’m sure readers here will benefit!
Thank You Nithin/Karthik for this wonderful blog and excellent articles , awaiting your answers on the above.
Sri RAM
Ram read through your entire comment and i get a feeling your problem could be with time frames. Sometimes simple indicators like moving averages give great results. Super trend seems to be performing really well in these volatile markets. I would suggest you increase the time frame, lower the number of trades to capture larger profits.
besides the massive volume surge , what other indicators gave a signal for the massive bullish surge today ?
i have to say i am waiting eagerly for the currency – commodity module 🙂
Thats the next module and hopefully it would be worth your wait 🙂
sure , i still await the answer to above question .
Thanks Karthik Sir for your support…!!!
Please do add Chapter on Put Call Ratio to define market trend…..only you can explain it in simple & easy to understand language..
Regards,
Sooraj – we will cover Put Call Ration in the ongoing module on Options Strategy.
I have around 90000 in my capital. I buy premium on dips whenever RSI is below 20 then sell when premium moves 3 to 4 points….
I am new in the market so I don\’t go for positional trade as It has already cost me heavy loss in the very beginning.
RSI below 20 on the premium itself or the underlying ?
even i do only intraday 🙂
Underlying always!
1) RSI below 20 on the premium itself or the underlying ?
2) JUST THIS ALONE , nothing else ?
instead of selling it off after a 3-4 point up move , why don\’t u simply place a stop-loss and wait if any more profit possible ?
even i do only intraday 🙂
RSI in Nifty Chart only…
I combine Bollinger Bolls with RSI or EMA with RSI when both triggers buy then I buy premiums…
I am new so I donot go for much right now…but I will do as you are saying but it will take some time…!!!
do you trade ITM , ATM or OTM options ?
in this strategy do u calculate option greeks ? or you don\’t consider B&S calculator at all ?
i am very thankful , that you are openly discussing your personal trading strategy with me , thanks a ton 🙂
In the beginning of the series I trade in slightly OTM (at least 10 trading sessions say…) later I trade only in ITM as it has more delta( kartik sir tought us…!!!
and dont say thanx as We Zerodha is a Family….!!!
Happy to read this Sooraj 🙂
Good luck Sooraj!
Dear Karthik Sir,
I do intraday trading in options and in order to judge the trend in nifty, I use google finance nifty 2 min chart.. I want to know that which EMA period is good for intraday trend judgement? 10, 20 or 40? similarly which period is good for RSI? 10 20 or 40??
Regards & Thanks in advance….as I know you will answer…!!!
Sooraj – why are you depending on Google for intraday charts when you have super fast streaming via Kite – https://kite.zerodha.com/ .
EMA – my personal preference is 9 and 21. RSI – 20 over sold and 80 for over bought.
1) i am still unaware on what exactly is scanner on PI and how to use it ?
2) can we use this EMA+RSI combo for long period stock holding also ?
3) is it possible to fix this strategy on PI scanner & and scan stocks which give this signal ?
For queries related to Pi, please email my colleague Srni – [email protected]
Actually I am not allowed to carry my personal laptop where I go to work……I just use NEST Mobile Application for trading and use google finance chart in Public PC to view nifty chart. I cannot take risk to log in in public place thats why I dont use kite….
although I have PI software (indeed superb & useful….) that I am able to use only once in a month….!!!
You can use Kite on your mobile, works like a charm 🙂
That\’s a good idea….!!
I do scalping in Option Premiums and use Bolinger Bond, RSI and EMA for technical analysis.
am I doing right Sir? I earn approx Rs 2500 daily (except one big loss Rs 27000…!!).
What according to you best technical indicators for premiums in nifty as they vary a lot….??
may i ask what trading capital you use for making 2500 daily ?
As long as you have method to madness you are good 🙂
Also, there is nothing like best technical indicator as each one has its own merits and demerits.
Dear sir ,
Thank you for this .. i\’m a newbie .. i wanted to know if the macd is more sensitive or the Moving average crossover system . I knogw that macd is a derivative of moving averages .
Thank you
MA is more sensitive to price movements.
1) i really did not understand \”leveraged indicator \” ,kindly explain .
i used the indicator on commodity futures , i use simple NRML leverage even when i am aware i will close position within the day itself , just to control against excessive leverage . i am not aware about what exactly u mean when u say \” indicator leverage\” .
2) risk to reward ratio , how to check this via back testing , i backtested simple long-short , without any kind of exit parameters .
3) frequency is 3-6 on a day per futures script .
4) generally profitable are higher than losers .
5) profitability per trade , how to check this ?
6) what exactly is \” drawdown \”?
hello , any answers for these above mentioned queries ?
1) If the strategy requires you to use excessive leverage – for example buy futures + sell options simultaneously then the position is highly leverage. This is what I mean
2) For you buy @ 100, with target of 110 and SL of 95, then you are risking 5 for an expectation of 10…risk to reward is 1:2…which is good. However if your strategy gives you a risk to reward of 1:1 then it may not be that great…you are risking 1 for a reward of 1.
3) This seems ok
4) Ok
5) Divide the over all profit by total number of trades …you will get profitability per trade
6) Drawdown is a measure of how much the profitability has declined from its highest point. For example if my overall profitability Is currently at 10K…but historically it was at 22K, then the drawdown is 12K. Higher the drawdown, the more volatility the strategy is.
question regarding back testing :-
i am back-testing an indicator on PI , it shows consistent profits on 2 day , 10 day , 20 day run .
when i run for 30 days , it shows loss .
when i run for 40 days , it again shows profit .
i want to use this indicator for pure intraday trading only .
what points should i consider before finalizing a strategy and going ahead with full automation ?
I can only give you few pointers here, but please be aware that there are many variables that you need to consider –
1) Leverage required – if the indicator you have is highly leveraged the think twice
2) Risk to Reward ratio
3) Frequency of trade signals
4) Number of profitable trades to loss making ones
5) Profitability per trade
6) Drawdown
Etc.
Hi Karthik,
as I have seen the graph u included on MACD and 9day SMA, I saw buying interest when MACD>9 day SMA and vice versa.
the same I saw in GM Breweries case also. but u have written it opposite. please confirm
Need to recheck this Romi.
sir,
Which stochastic indicator is to be followed Fast or Slow.
regards
sir,
Which stochastic indicator is to be followed Fast or Slow.
regards
Both.
SIR,
WHAT IS MONEY FLOW INDEX, HOW IT WORKS, IS IT WORTH LOOKING FOR SHORTS AND LONGS.
Yet another indicator. Will discuss almost all the indicators available in another new initiative shortly.
The Module on TA is really great. It is so beautifully explained. Thanks a lot Karthik and team. Bravo! 🙂
Thanks Gaurav! Glad you liked the module.
Hi Karthik,
You made an excellent introduction to all the fundamental indicators. I would always take care of my decision using all your TA.
But i think there will be confusion in all traders mind that \” What should be best time frame to view this indicators?\”, i personally have problem in this.
Can you make some tutorial as Suitable Time frame one need to watch for all the above mentioned indicators for Short, Med, and Long trade.
Thanks for the suggestion Naitik – just to give you a quick heads up – check out stochastic for intraday, EMA for long term trades, RSI and BB for swing trading. Please note this is just a suggestion, do your due diligence before you act upon it.
karthik,
when i try to back test an error message is shown please explain
Sarath – I would suggest all you shoot all questions related to Pi to Zerodha support.
karthik ji
Can you please tell me what is the meaning of volume candle color red and green.
thanks®ards
vikas
Volume as such does not have a colour code…but traders usually associate the volume colour with the price. If the price has gone up, then volume bar is green and if price has come down the volume bar is red.
Hi Karthik, But I can see for some days the candle is green but the volume is red for the same day and vice versa.
Ah, this depends on the software really. Volume can turn red if the previous day\’s volume is higher than current day\’s volume.
SIR,THERE IS HUGE DIFF IN WHAT U SAY (MACD)&WEBSITES SUCH AS INVESTOPEDIA,STOCK CHARTS,ONLINE TRADING CONCEPTS CHECE&CORRECT IF IAM WRONG
sir,its totally confusing,somewebsites say if MACD LINE CROSSES SIGNAL LINE BUY if MACD LINE FALLS BELOW SIGNAL LINE SELL U SAY OPPOSITE WHICH TO FOLLOW, WHY,WHEN,HOW,PLS EXPLAIN DETAILLY.
Narsimha – I will go tru the MACD chapter again and confirm. Thanks.
sir,its totally confusing,somewebsites say if MACD LINE CROSSES SIGNAL LINE BUY if MACD LINE FALLS BELOW SIGNAL LINE SELL U SAY OPPOSITE
sir,its totally confusing,somewebsites say if MACD LINE CROSSES BUY if
Hi Karthik,
What are the consequences of a Triple Bottom or a Triple Top?. I hear people talking about these but don\’t understand what would happen after the occurrence of one. And how much can we depend on such an occurrence?.
Triple formation just compresses the price into a range…the longer the price stays in this this range, the expectation of a meaningful breakout (or breakdown) is higher. Check this – http://zerodha.com/varsity/chapter/dow-theory-part-1/
Dear KARTHIK,
Thanks for such great explanation, your courses are awesome. Here I am attaching chart of Apollo Tyres kindly confirm the pattern. As per my observation it should be Tripple bottom. Kindly reply
Thanks Mukul 🙂
Yes, it certainly looks like one.
Sir,
while observing different stocks for Bollinger Brands all most all of them followed Bollinger theory. Iam not understood how is it works in side ways markets only.
Thanks & Regards
BB works on a statistical framework. BB especially works well when the stock is in a sideways trend – for the simple reason that it follows the principle of mean reversion.
sir,
can I look for RSI instead of stochastic.
Regards
You can, should not be a problem.
Dear sir,
Which indicators(any two) we need to look for sideways and trend markets. for example as stated Bollinger bands works well when market is sideways .
Regards
Sideways = BB and Stochastic
Trend = Moving Averages and MACD
Does this applies to commodities as well for day trading Karthik?
Yup, TA rules apply to Equities, Commodities, and currencies.
Please elaborate higher the momentum, the higher is the magnitude.Also give detail about momentum n magnitude in basic way mean.
Higher the momentum the greater is the spread between the two averages and hence higher is the magnitude of the difference between the two averages.
Dear sir
Could you kindly explain which parameters in the stochastic oscillators is best suitable for intraday trading?( particularly in Nifty option and Nifty future)
I would suggest you use Stochastic in a sideways market…stochastic does now work when the markets are trending.
Is Stochastic other name for bollinger band ?
No, they are two different indicators.
karthik, You are doing something which is more than EXCELLENT and your courses are Awesome.
Please help me with Intraday Charts Provider who feed market data real time(without 5 or 10 mins Lag). Any Provider will do and i can pay for good service also. I am going to use it for Intraday Trading, Swing Trading, Futures and Options.
Thanks for the encouraging words Sathish – in fact it is not just me there is a small team involved in bringing this content forward on Varsity.
Why dont you opt for Zerodha Pi? Pi has all the features you are asking for. In fact all the charts that I have posted in Technical Analysis module is from Pi. Check out http://www.zerodha.com/pi .
hi Sir,
confusion abt MACD and signal line crossover would be cleared iff one considers \”MACD line\” itself being some scrip, and it has its own 9-DMA as usual. we then follow standard method of trading of using MA only.
(
stock close above it\’s n-DMA => long
stock close below it\’s n-DMA => short
)
i wonder , if we can add one more signal line to MACD line (say 21-DMA) and follow 9/21 MA Crossover system to reduce lag?
* how can we add custom indicators (which will have its own graph akin to std indicator viz MACD ) in \”Pi\” ?
thanks,
Rajesh
This is an interesting thought, probably needs to be explored more. In fact you can easily backtest this on Pi. By the way for questions related to Pi you need to email [email protected]
dear karthik sir…
For example if the 20 day SMA is 7800, and the SD is 75 (or 0.96%), then the +2 SD would be 7800 + (75*2) = 7950. Likewise, a -2 SD indicates we multiply the SD by 2, and subtract it from the average. 7800 – (2*75) = 7650.(karthik sir how to calculate sd 75, bit confuse…thank you sir)
Girish…we will be talking about Standard Deviation (SD) when we take up the chapter on Volatility in the Options module. Request you to stay tuned till then 🙂
okay sir..
thank you sir…`
Welcome 🙂
dear karthik sir..
here i\’m sending bearish macd indicator, stock gravita india ltd. corrected 80 level to 31.
thank you sir.
Nice 🙂
thank you karthik sir…
Welcome 🙂
Hi All,
Is there eny one can explain for loding indicator pi Terminal
It is quite easy to do this, however I would suggest you email [email protected] for the same.
Dear Sir,
The upper and lower bands act as a trigger to initiate a trade. Here is it not important that which candle stck is touching the which band. Bullish band touching upper or lower band or bearish band touching the lower band then it is more strong signal then bullish band is touching the lower band. Also its body which is touching the band or even shadow touching the band or crossing the band, same will have same meaning or it gives some sense of strong or weak signal. Please clarify these variable if they are of concerned.
Thanks
The bollinger band is a volatility, it effective to initiate short trades. I would be happy to see a bullish candle at the lower end of the band while initiating a bullish position. Similarly at the top end I would be happy to see a bearish candle before initiating a short position.
Hi Karthik,
Most sources like books and wikipedia say that a bullish signal is when MACD line moves over the signal line. Here it is mentioned the other way round. Could you please clarify?
Dear Sir,
thanks a lot for your worthy articles on FA & TA, I have a doubt on the cross overs of MACD and signal line. in some books it indicates that bullish cross over is when MACD line cross over Signal line. where in the above chapter it is in reverse. Pl. clarify.
Thanks/Regards
Signal line is a 9 day average line whereas the MACD takes the difference between 12 & 26 day average. Hence the signal line is more reactive to the daily price moves and therefore generates the trigger to either buy or sell.
hi karthik are you sure the signal line is more reactive to the change in prices. i think the macd is more reactive since it the differance and signal is the average its comparatively less reactive to the same change.
Hi Karthik
i am in confusion regarding one of the examples mentioned in the above chapter. its this paragraph to be precise
\”For example, the first vertical line starting from left points to a crossover where the MACD signal (9 day SMA) lies below the MACD line and hence one should look for a selling opportunity. The 2nd vertical line from left, points to a crossover where the MACD signal line lies above the MACD line, hence one should look at buying opportunity.\”
this is a paragraph explaining the improvised MACD with the example of asian paints graph. my doubt is the in the graph at the first vertical from the left the cross over occurs the MACD signal(red line) actually goes above the MACD line(black line), but the in the above paragraph quoted from the chapter it mentioned that the MACD signal lies below the MACD line which is contrary to what\’s seen in the graph. Hope you have understood my query and let me know where i am going wrong.
Wow! Thanks for pointing this, your observation is correct. I need to make this correction.
Hi Karthik, I was about to send the query exactly same as that of Teja and just noticed this comment. Is the correction is not made or is it just my understanding gap.
Oops I;ve missed this completely. I will look into it shortly.
Hi Karthik,
I am still not clear about MACD line and MACD signal example of Asian Paints. The correction has been made on it or not? As I am still confused about it.
Thanks!
Gaurav – I will review the entire write up MACD on priority, can you please check back in 2 days? Thanks so much for your patience.
Hi Karthik,
Was the correction made in MACD?
And also I bit confused here that how can a signal line (which is fast and more reactive than MACD) actually lie below MACD when the trend is up? this seems quite opposite to EMA. 9 SMA (Signal Line) should move over MACD when the trend is up since 9 SMA is recent and should be fast and more reactive than MACD. Please correct me if I’m wrong. I can understand all other concepts quite easily but getting confused here.
My bad, I;m yet to make the necessary corrections. Will do as soon as possible.
I am having an excellent learning through Varsity. Thank you very much.
But I still have the MACD signal vs the MACD line cross over doubt in this article. After reading all the comments, I understood there is/was an issue and I am not able to get to whether it has been solved or not. Can you please elaborate here as to when is a bullish crossover and a bearish one?
If the Signal line (9day) (red) crosses over the MACD line (black, 12 and 26) (ie) after crossing, the red is now above black -> does this denote bullish/bearish.. From what I expect it to be is \’Bullish\’, but what has been mentioned is \’bearish\’. Can you please elaborate and let me know if my understanding is correct or not. Thanks.
Happy learning!
There was an issue, which has been rectified. I\’d suggest you give it another read 🙂
I would be glad if you also include ELDER FORCE INDEX in your varsity.
I insist on including this just as I entered a wrong trade and had booked loss due to Force Index being plotted upside down on PI.
For an example, please open KITE and PI simultaneously and plot FI on both platforms. You will be shocked….
Sorry to hear about the loss that you booked. Will try and include notes about it.
karthik ji, kindly discuss elaborately on ADX in Varsity, thank you
Will do that sometime soon. Thanks.
Excellent to say the least…
Really now understand the application of BBs.
One request .. Would you please include in your tutorial Stochastics & their applications soon?
Thanks, I\’m glad you found this useful 🙂
Will include a chapter on Stochastics sometime soon.
Adani Ent. seems to be trading sideways for considerable time. I found the formation on chart perfectly suited for application of BBs.
Do you agree? Hope i am not embarrassing you by asking this
Lol, why would you embarrass me :). This platform is meant to ask question and learn from one another.
Btw, you are perfectly right with Adani Ent. It is at the lower SD..which advocates a long position. But do make sure other things on the checklist confirm. Good luck.
Sir,
Is there any calculated formula where we can predict the proper closing. If yes, how to calculate?. If no, then how do some people predict in crowd index?
In the intraday chart, RSI is never touching the oversold region. Can i add a SMA and check the crossover for bullish and bearish confirmation??
Thanks in advance.. 🙂
No in fact what you can do is estimate the level upto which the RSI increases (on intra day basis) and based on this you can re calibrate the oversold and overbought levels.
Thank you so much for your reply. 🙂
Do you mean that i need to change the oversold and overbought regions regularly on intraday basis?? I read somewhere that the rsi oscillates between 45 and 100 in uptrend and between 65 and 0 in downtrend. How far it is true? Hope im not bugging you with my doubts. 😀
Thanks in advance.
Not regularly, but you need to understand what levels work for which stock. For example a level of 40 and 60 may work extremely well for Infy while at the same time 30 and 70 may work for TCS. So the point is to identify this metrics.
Btw, you are not bugging me, you are just contributing significantly towards making the community more vibrant. Please keep the comments queries coming 🙂
Thanks alot sir.. 🙂
Considering all the effort you put here to explain this stuff, I think I owe you.. 😀
You owe me nothing Jagadeesh 🙂
I wanted to work on overbought-oversold indicators.Now rsi and cci have been here for too long….How do I get better confirmations and reversals?I am sure we need to keep up with latest indicators….as these have been here for ages.Is there anything new I can work on?
Well, I agree it has been around for a while. But disqualifying it based on time factor may not be a great idea. Having said that, I have not come across anything new that looks promising 🙂
Hi Ashutosh all this indicators are there from along time and promise all this will be there till eternity and the ones mentioned in varsity are the chosen best ones with a great record and tested, don\’t look for new ones practice more with old ones and promise you will never know you will become a master trader
Hi Karthik
Wanted to understand fast and slow stochastic and where they are used
The indicator is best used while trading intra day. I will probably include a write on this sometime soon.
Thanks will be waiting for the same but its working awesomly well for intraday for few points profit in options but i really fail to understand why this news channels and advisory keep fooling people and when the best way to learn TA is keep it simple Thanks for all your efforts
You said it, the best way to learn TA is by keeping it really simple and not complicating it with many lines and indicators.
We have tried to do the same in Varsity 🙂
Learning TA seems simple because of the way you presented the information to us. I have been going though your tutorial for last two days and I never felt bored even for a single moment, things have been explained in a very very simple way but in great detail backed by practical experiences. Thanking you won\’t be sufficient to express my gratitude to you for writing such a wonderful tutorial.
Arunava, thank you so much for the kind words. Words like these encourage us to write more meaningful content. Happy learning 🙂
Hi Nitesh,
Mind if I ask how are you using stochastics on options? For example what is the candle duration you are using and the details of the stochastic parameters?
MACD with 9 day SMA crossover/ MACD SIGNAL example for Asian paints seems wrong.
The red line might be for MACD line and black for MACD SIGNAL.
please look into this.
Thanks, I\’m aware of this. Its just that I\’ve not been able to rectify it yet. Will do shortly.
I think the MACD/signal line confusion still remains (30/09/2016). \”The sentiment is bullish when the 9 day SMA crosses over the MACD Line wherein the 9 day SMA is greater than the MACD line. When this happens, the trader should look at buying opportunities\” . This is in fact a bearish sentiment. Please clarify.
While changing the above, could you avoid using crosses over in both bullish and bearish scenarios? It creates confusion in newbies like me. Crosses over can be used in bullish sentiment whereas crosses under can be used in bearish sentiment. Or simply could you say that \” When the MACD line (generally black) goes above the signal line, then it indicates a bullish sentiment\” or something like that. Thanks.
I understand there is a confusion here, will fix it as soon as possible.
Please fix this.
Karthik, please fix this.
I hope the interpretation of MACD crossover as per universal standards is :-
MACD()>MACDSIGNAL() —– Bullish
MACD()<MACDSIGNAL() —– Bearish
I hope this issue is automatically resolved when TV is implemented in kite. But, the same issue is still persisting in PI. Be aware. Actually, PI has many other indicators having different interpretation issues.
I hope ZERODHA will follow international standards and provide with indicators in its original forms as designed by respective inventors along with with their true interpretation.
Happy trading….
Getting this checked, Sandesh.
black is MACD line and pink is signal line.Just believe it and go ahead my friend.
ok
What chart do we have to plot to analyze indicators and EMA? Because all parameter values changes when we select min, day, month and year chart.
I\’m assuming you are talking about the intraday chart. You can look at the 10 or 15mins charts, Bhushan.