
While discussing candlestick patterns, we had learnt about the entry and the stoploss points. However, the target price was not discussed. We will discuss the same in this chapter.
The best way to identify the target price is to identify the support and resistance points. The support and resistance (S&R) are specific price points on a chart expected to attract the maximum amount of either buying or selling. The support price is a price at which one can expect more buyers than sellers. Likewise, the resistance price is a price at which one can expect more sellers than buyers.
On a standalone basis, traders can use S&R to identify trade entry points as well.

11.1 – The Resistance
As the name suggests, resistance is something which stops the price from rising further. The resistance level is a price point on the chart where traders expect maximum supply (in terms of selling) for the stock/index. The resistance level is always above the current market price.
The likelihood of the price rising to the resistance level, consolidating, absorbing all the supply, and declining is high. The resistance is one of the critical technical analysis tools which market participants look at in a rising market. The resistance often acts as a trigger to sell.
Here is the chart of Ambuja Cements Limited. The horizontal line coinciding at Rs.215 on the chart, marks the resistance level for Ambuja Cements.
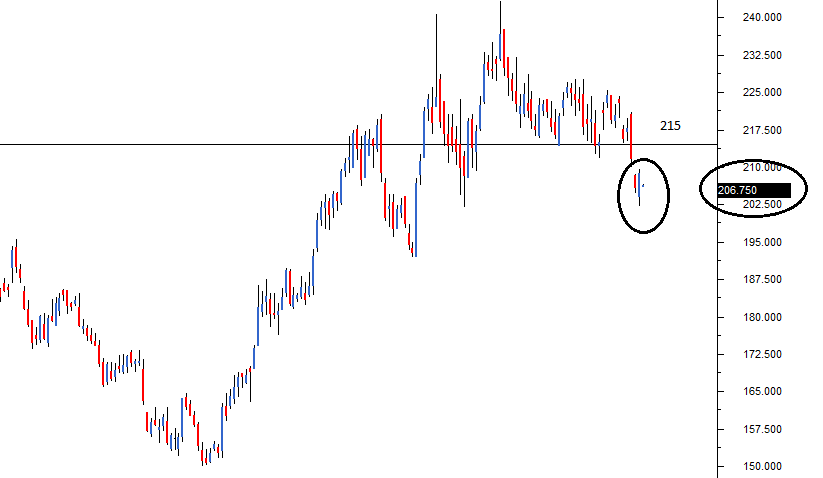
I have deliberately compressed the chart to include more data points, the reasons for which I will shortly explain. But before that there are two things that you need to pay attention to while looking at the above chart:
- The resistance level, indicated by a horizontal line, is higher than the current market price.
- While the resistance level is at 215, the current candle is at 206.75. The current candle and its corresponding price level are encircled for your reference
For a moment let us imagine Ambuja cement at Rs.206 forming a bullish marubuzo with a low of 202. We know this is a signal to initiate a long trade, and we also know that the stoploss for this trade is at 202. With the new-found knowledge on resistance, we now know that we can set 215 as a possible target for this trade!
Why 215 you may wonder? The reasons are simple:-
- The resistance of 215 implies there is a likelihood of excess supply.
- Excess supply builds selling pressure.
- Selling pressure tends to drag the prices lower.
Hence for reasons stated above, when a trader is long, he can look at resistance points to set targets and to set exit points for the trade.
Also, with the identification of the resistance, the long trade can now be completely designed as follows:
Entry – 206, Stoploss – 202, and Target – 215.
The next obvious question is, how do we identify the resistance level? Identifying price points as either a support or resistance is extremely simple. The identification process is the same for both support and resistance. If the current market price is below the identified point, it is called a resistance point; else it is called a support point.
Since the process is the same, let us proceed to understand ‘support’, and we will follow it up with the procedure to identify S&R.
11.2 – The Support
Having learnt about resistance, understanding the support level should be quite simple and intuitive. As the name suggests, support is something that prevents the price from falling further. The support level is a price point on the chart where the trader expects maximum demand (in terms of buying) coming into the stock/index. Whenever the price falls to the support line, it is likely to bounce back. The support level is always below the current market price.
There is a maximum likelihood that the price could fall until the support, consolidate, absorb all the demand, and then start moving upwards. The support is one of the critical technical level market participants look for in a falling market. The support often acts as a trigger to buy.
Here is the chart of Cipla Limited. The horizontal line coinciding at 435 on the chart marks the support level for Cipla.
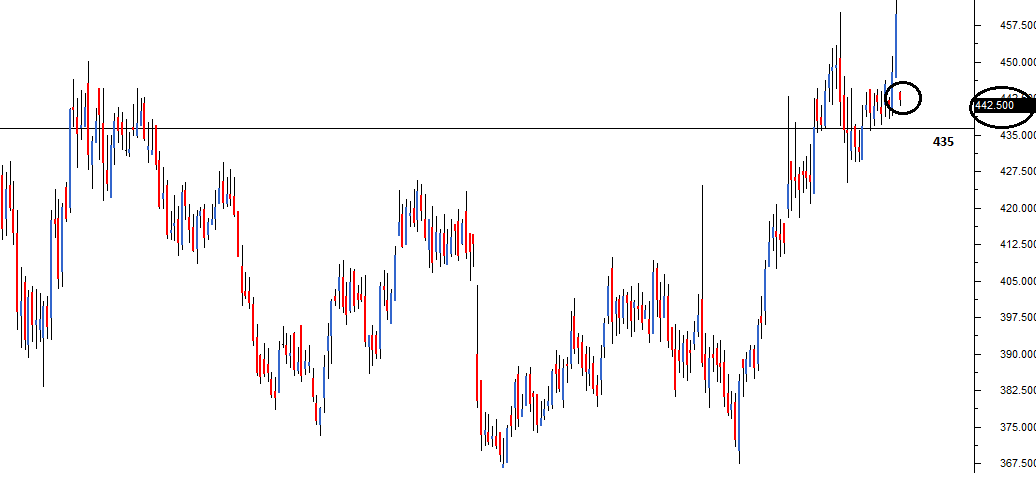
Few things that you need to notice on the chart above:
- The support level, indicated by the horizontal line is below the current market price.
- While the support level is at 435, the current candle is at 442.5. The current candle and its corresponding price level are encircled for your reference
Like we did while understanding resistance, let us imagine a bearish pattern formation – perhaps a shooting star at 442 with a high of 446. Clearly, with a shooting star, the call is too short Cipla at 442, with 446 as the stoploss. Since we know 435 the immediate support, we can set the target at 435.
So what makes Rs.435 target worthy? The following reasons back the decision:
- Support at 435 implies there is a maximum likely hood of excess demand to emerge.
- Excess demand builds buying pressure.
- Buying pressure tends to drag the price higher.
Hence for the reasons stated above, when a trader is short, he can look at support points to set targets and to set exit points for the trade.
Also, with the identification of the support, the short trade is now completely designed.
Entry – 442, stoploss – 446, and target – 435.
11.3 – Construction/Drawing of the Support and Resistance level
Here is a 4 step guide to help you understand how to identify and construct the support and the resistance line.
Step 1) Load data points – If the objective is to identify short term S&R load at least 3-6 months of data points. If you want to identify long term S&R, load at least 12 – 18 months of data points. When you load many data points, the chart looks compressed. This also explains why the above two charts look squeezed.
- Long term S&R – is useful for swing trading.
- Short term S&R – is useful intraday and BTST trades.
Here is a chart where I have loaded 12 months of data points
Step 2) Identify at least 3 price action zones – A price action zone can be described as ‘sticky points’ on the chart where the price has displayed at least one of the behaviours:
- Hesitated to move up further after a brief up move
- Hesitated to move down further after a brief down move
- Sharp reversals at a particular price point
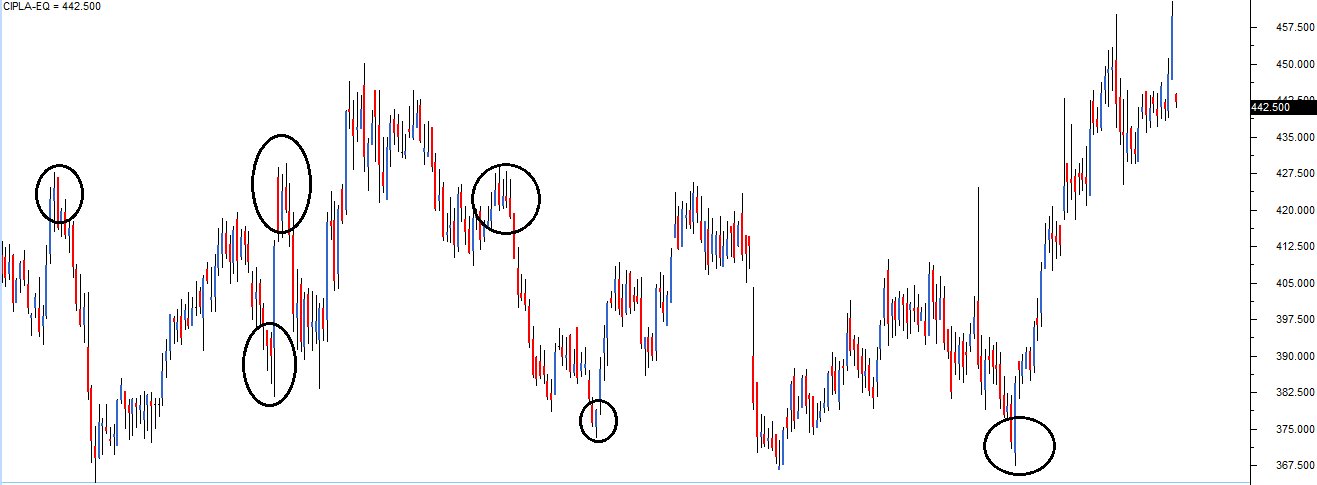
Here are a series of charts that identifies the above 3 points in the same order:
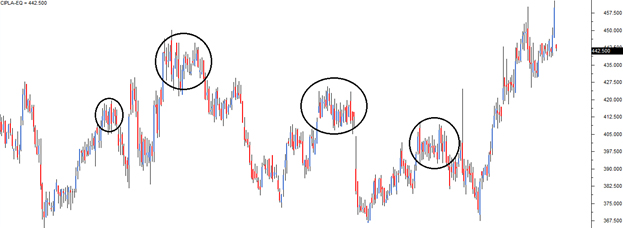
In the chart below, the encircled points indicate the price hesitating to move up further after a brief up move:

In the chart below, the encircled points indicate the price hesitating to move down further after a brief down move:
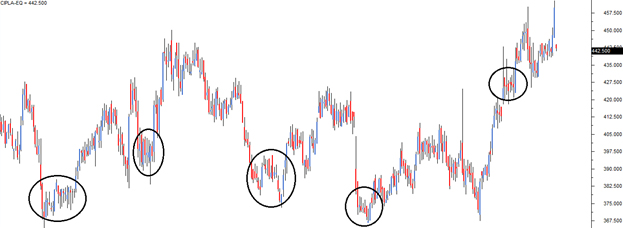
In the chart below, the encircled points indicate sharp price reversals:
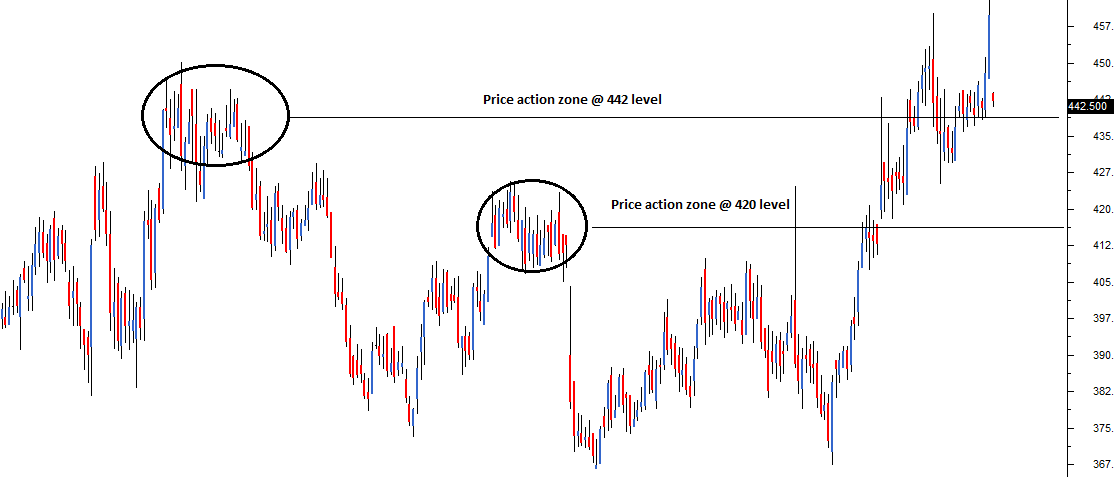
Step 3) Align the price action zones – When you look at a 12-month chart, it is common to spot many price action zones. But the trick is to identify at least 3 price action zones at the same price level.
For example here is a chart where two price action zones are identified, but they are not at the same price point.
Look at the following chart, I have encircled 3 price action zones that are around the same price points:
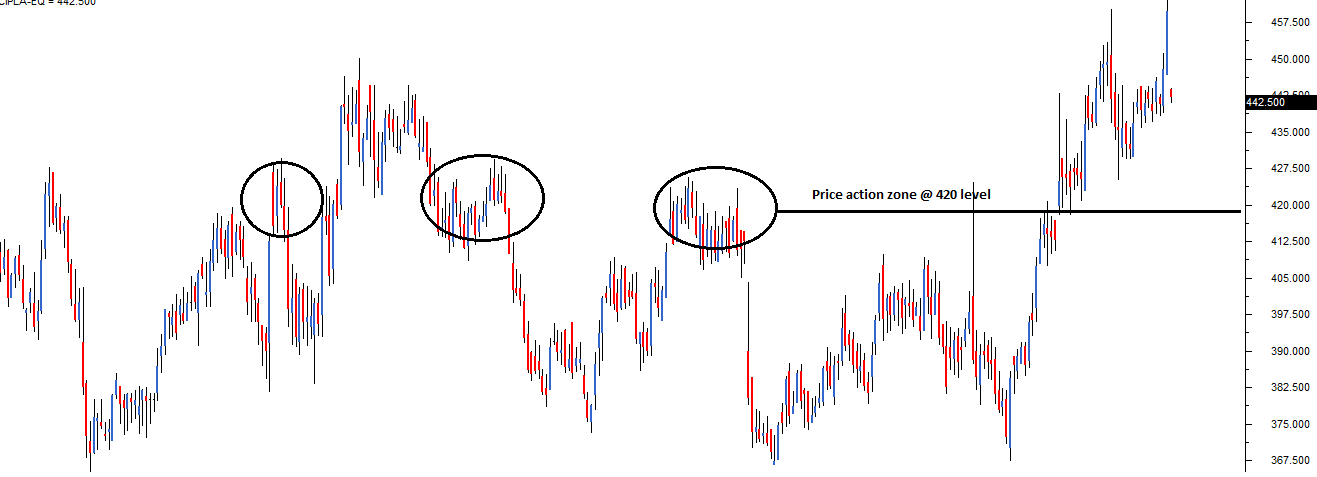
A critical point to note while identifying these price action zones is to make sure these price zones are well spaced in time. Meaning, if the 1st price action zone is identified on 2nd week on May, then it will be meaningful to identify the 2nd price action zone at any point after 4th week of May (well spaced in time). The more distance between two price action zones, the more powerful is the S&R identification.
Step 4) Fit a horizontal line – Connect the three price action zones with a horizontal line. Based on where this line fits in concerning the current market price, it either becomes support or resistance.
Have a look at this chart
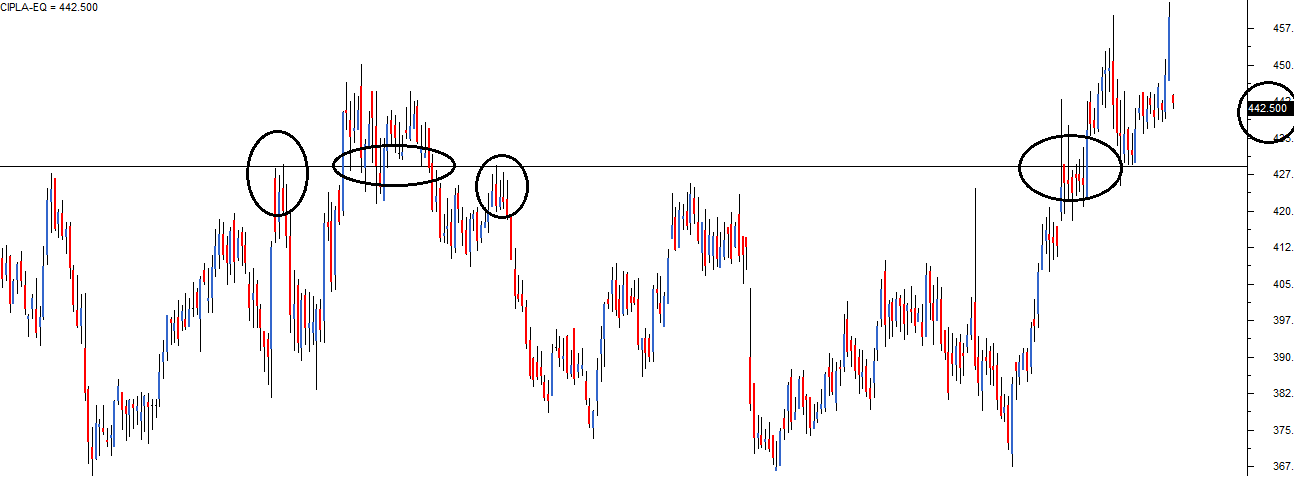
Starting from left:
- The 1st circle highlights a price action zone where there is a sharp reversal of price.
- The 2nd circle highlights a price action zone where the price is sticky.
- The 3rd circle highlights a price action zone where there is a sharp reversal of price.
- The 4th circle highlights a price action zone where the price is sticky.
- The 5th circle highlights the current market price of Cipla – 442.5
In the above chart, all the 4 price action zones are around the same price points, i.e. at 429. Clearly, the horizontal line is below the current market price of 442.5, making 429 an immediate support price for Cipla.
Please note that whenever you run a visual exercise in Technical Analysis such as identifying S&R, you run the approximation risk. Hence always give room for error. The price level is usually depicted in a range and not at a single price point. It is actually a zone or an area that acts as support or resistance.
Going by the above logic, I would be happy to consider a price range around 426 to 432 as a support region for Cipla. There is no specific rule for this range; I just subtracted and added 3 points to 429 to get my price range for the support!
Here is another chart, where both S&R have been identified for Ambuja Cements Limited.
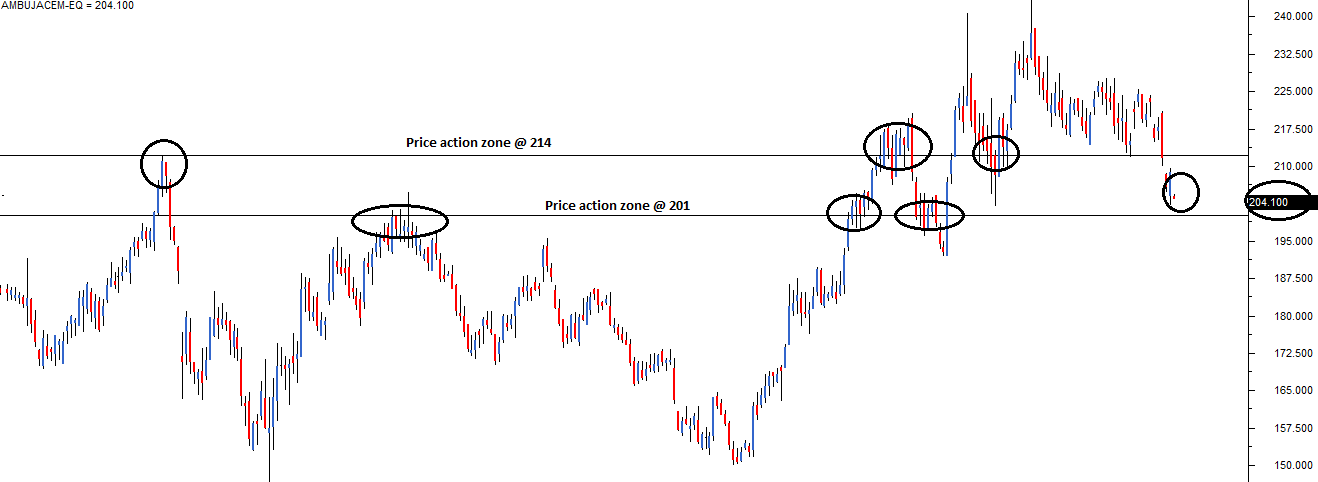
The current price of Ambuja is 204.1, the support is identified at 201 (below current market price), and the resistance at 214 (above current market price). So if one were too short Ambuja at 204, the target, based on support, can be at 201. Probably this would be a good intraday trade. For a trader going long at 204, 214 can be a reasonable target expectation based on resistance.
Notice in both the support and the resistance level, there at least 3 price action zone identified at the price level, all of which are well spaced in time.
11.4 – Reliability of S&R
The support and resistance lines are only indicative of a possible reversal of prices. They by no means should be taken for ascertain. Like anything else in technical analysis, one should weigh the possibility of an event occurring (based on patterns) in terms of probability.
For example, based on the chart of Ambuja Cements –
Current Market Price = 204
Resistance = 214
The expectation here is that if Ambuja cement starts to move up at all, it is likely to face resistance at 214. Meaning, at 214 sellers could emerge who can potentially drag the prices lower. What is the guarantee that the sellers would come in at 214? In other words, what is the dependence of the resistance line? Honestly, your guess is as good as mine.
However, historically it can be seen that whenever Ambuja reached 214, it reacted in a peculiar way leading to the formation of a price action zone. The comforting factor here is that the price action zone is well spaced in time. This mean 214 stands as a time tested price action zone. Therefore keeping the very first rule of technical analysis in perspective, i.e. “History tends to repeat itself” we go with the belief that support and resistance levels will be reasonably honoured.
Purely from my personal trading experience, well constructed S&R points are usually well respected.
11.5 – Optimization and checklist
Perhaps, we are now at the most important juncture in this module. We will start discovering a few optimization techniques which will help us identify high-quality trades. Remember, when you seek quality, quantity is always compromised, but this is a compromise that is worth making. The idea is to identify quality trading signals as opposed to identifying plenty but worthless trades.
Optimization, in general, is a technique wherein you fine-tune a process for best possible results. The process in this context is about identifying trades.
Let us go back to candlesticks patterns, maybe to the very first we learnt – bullish marubuzo. A bullish marubuzo suggests a long trade near the close of the marubuzo, with the low of the marubuzo acting as the stoploss.
Assume the following credentials for the bullish marubuzo:
Open = 432, High = 449, Low = 430, Close = 448
Hence the entry for the long trade is approximately at 448, with 430 as the stoploss.
Now, what if the low of the marubuzo also coincides with a good time tested support? Do you see a remarkable confluence of two technical theories here?
We have a double confirmation to go long. Think about it on the following terms:
- A recognized candlestick pattern (bullish marubuzo) suggests the trader initiate a long trade.
- Support near the stoploss price suggests the trader the presence of significant buying interest around the low.
While dealing with a fairly random environment such as the markets, what a trader really needs is a well-crafted trade setup. The occurrence of the above two conditions (marubuzo + support near the low) suggests the same action, i.e. to initiate a long trade in this case.
This leads us to an important idea. What if we had a checklist (call it a framework if you like) for every trade we consider? The checklist would act as a guiding principle before initiating a trade. The trade should comply with the conditions specified in the checklist. If it does, we take the trade; else we drop it and look for another trade opportunity that complies with the checklist.
Discipline, they say makes up for the 80% of the trader’s success. In my opinion, the checklist forces you to be disciplined; it helps you avoid taking an abrupt and reckless trading decision.
In fact, to begin with, we have the first two critical factors of the checklist:
- The stock should form a recognizable candlestick pattern.
- Note: We have learnt some of the popular patterns in this module. To begin with, you can use just these patterns to comply with the checklist
- S&R should confirm to the trade. The stoploss price should be around S&R.
- For a long trade, the low of the pattern should be around the support.
- For a short trade, the high of the pattern should be around the resistance.
From now on in this module, as and when we learn new TA concepts, we will build this checklist. But to quench your curiosity, the final checklist will have 6 checklist points. In fact, when we have the grand 6 checklist points, we will weigh down each one of them. For example, checklist point number 4 may not be as important as point number 1, but it is more important than 100 other factors that distract the trader.
Key takeaways from this chapter
- S&R are price points on the chart
- Support is a price point below the current market price that indicate buying interest.
- Resistance is a price point above the current market price that indicate selling interest.
- To identify S&R, place a horizontal line in such a way that it connects at least 3 price action zones, well-spaced in time. The more number of price action zones (well spaced in time) the horizontal line connects, the stronger is S&R
- S&R can be used to identify targets for the trade. For a long trade, look for the immediate resistance level as the target. For a short trade, look for the immediate support level as the target.
- Lastly, comply with the checklist for optimal trading results
I want to improve at drawing support and resistance levels, but I lack confidence because I\’m not sure if I\’m identifying them correctly. Are there effective ways to practice and validate whether the support and resistance levels I draw are accurate? I\’d appreciate guidance on how to build confidence in this skill.
i think there is another support in the cipla chart at 390 that is a better support line because the stock is more often seen going up from that point .
Perhaps, usually support and resistance is not just one point, but multiple points in the chart.
Hi sir
1. Any particular reason Dynamic support-resistance lines/levels are not covered in this chapter?
2. How best to create \’the support & resistance zones\’ to keep some buffer to avoid SL hitting first and then price hits target later?
1) I\’m not familiar with that concept myself, hence dint cover.
2) The same technique we have discussed here will help you with it.
Hi Sir,
Suppose if my objective is SHORT TERM, then S&R should be around 3-6 months, so my questions is
1. On which Time frame do I have to put the S&R ? 5 mins or 10 mins or weekly or monthly ?
Because it is difficult to find the S&R in 3-6 months chart using the Daily Time frame.
2. If I use the Normal Distribution for S&R i.e for short term, example my objective to hold a stock for a week or 3 or 4 days, then what will be the period of data I must take from NSE website, eg. for 5 years or 2 years or 1 year ?
and Same question for Long term S&R, for swing trading. Please guide here.
1) I\’d still suggest you use EOD time frame, but along with this maybe overlay it with 10 mins.
2) 1 year should.
Thank you for sharing the knowledge on these concepts in such a simple manner. In the chart above for Step 4) Fit a Horizontal Line- you have identified 429 as the support but should it not be a resistance? Do correct me if my understanding is wrong. Also, I see that the price has indeed breached 429 in the second circle. In such a case do we still consider 429 as the resistance or how do we identify R&S if the price has breached the levels inbetween?
I may have made a mistake. The easy way to remember this is –
1) Its support, if the current market price is above the horizontal line
2) Its Resistance, if the current market price is below the horizontal line.
Hello,
Thanks for all your effort in giving us the high quality content.
I am a bit puzzled when drawing any trend line whether to consider wick or just a body of the candle and when to consider. Could you provide a little more clarity please?
I am more involved in short term trading(I am an impulsive, FOMO filled and a revenge trader). Trying to learn the basics to get back with a good risk management.
Hi Manikandan,
So you can ignore the wick and just consider either the closing or opening (based on the candle type). Also, I understand the FOMO bit 🙂
Here is mu suggestion though – its very rare for traders to identify that they are impulsive and FOMO driven type. Now that you are self aware, at least cut down the position size. Dont bet heavily on any single trade that has a chance of blowing up so bad that it will ruin you. Keep you trades to an extent where you can satisfy your trading itch as well as be smart about risk of ruin.
Hello Karthik,
Thanks for sharing all this knowledge. I am having a query since a long time. It is about support zone/resistance zone. Let me explain my query with one example..Suppose 25550 is 1 hour support and now while going up, I can see 1 hour resistance high at 25552..should i consider that it is resistance due to 25550 support or if resistance high is between 25550 and 25551 then only consider it resistance due to support 25550? What exactly points range I should consider in nifty/banknifty for support/resistance zone? Thanks in advance
Its best to think of this in percentage terms, give it at least 0.5% or more.
Thanks For reply.. 0.5% percentage of? For Nifty it will be? Thanks in advance
Its 0.5% (or whatever you deem suitable) of the price.
hello sir, i am new to investing, how do i decide which company i should invest in from the vast choices available. How do i know which company i should keep track of?
If you are new, I\’d suggest you take a look at the Nifty 50 until you get comfortable.
To look at companies in Nifty 50 or the index itself? Please clarify.
Nifty 50 is the Index. You can start with this.
Thanks a lot for providing such a great content free of cost.
Sir there is a situation where bullish harami pattern is formed. In which I will create a long position. At the price of closing of P2 that is 1473 Okay. And my SL will be the low of that pattern, which is 1454. Okay. And the target that is being made according to the resistance is 1597. And the support zone is 1397- 1403. The SL isn\’t in my support zone, it\’s above it, so should I take this trade or not?
You can take it. What you can also do is see if your SL price and support price is close by, if it is, then maybe you can take a price that is somewhere near the support itself. If they are far apart, then stick to the SL price as suggested.
Sir difference between sl and support is around 50. Is it considered as Far apart.
In the above topic you teach us if the sl is not lie in support zone avoid the trade.
And now you are saying if they are far apart take sl as per pattern.
Please clarify.
50 is far apart or not depends on the stock price. Better you use % terms. Please remember, support or resistance for that matter is just one aspect of the trade, if the other things in the trade convinces you then sure, go ahead and take the trade despite SL not being in the zone. It all boils down to conviction and the way you look at markets 🙂
Hello Karthik,
Im interested in day trading, if I search for support and resistance for 3 to 6 months, then I think the support and resistance could be too long from current price.Since, I am day trader.i follow chart for entry and exit on 15 and 5 min chart.if I check for support and resistance in 15 or 5 min time frame I may get support and resistance lines at early only which is suitable for day trading,than check for 3 to 6 months data points.i have this doubt.which is better to point support and resistance 5,15 or 3to 6 months data points for same day buy and sell..
For shorter term and intraday, I\’d suggest you look at 15 mins, Kishore.
Fantastic material and great explanations. This should be sold as a handbook with alternate blank pages for notes!
My question on Support & Resistance.
I plan to trade over a few days or weeks. I understand that I should load charts for a period of 1 to 2 years.
Over a 2 year period there would be many price action zones and sharp reversals.
Should the recent ones (3-6 months) be considered or given priority over the older data?
Does the \”Pivot\” help in identifying support and resistance levels automatically? If so what is the simplest way to use it?
Thank you.
Thanks, Sanjay.
Yes, it makes sense to look at 1 or 2 years chart for longer term perspective and then zoom out to shorter term perspective, maybe 3 months or so. This way you have a fair understanding of whats happening on the long term and also on the short term basis.
Hi Karthik,
Q- I am using 3-6 months data to plot a line, however I am confused as which timeframe to select? daily? weekly or monthly? please let me know.
I\’d suggest you use a EOD candle, Rushi.
Hi Karthik Sir,
First of all kudos to the team for crafting such a fabulous contest from basics to advanced.I am generally a swing trader, so my doubt was on finding the resistance and support points. Normally, I take single day time frame to find the points (since it is swing), but should I also use 4 hour, 1 hour timesframes as well? And I use breakout and price Action strategies to enter into a trade.But mostly I get stuck on when to book the profit or keep the stoploss as swing is generally from few weeks to months. Since after a breakout,there will be multiple resistance points above and supports below as well, I get totally confused if it is better to wait to bounce back or exit. Would be greatly helpful to know your input on this matter.
Thanks Addul, glad you liked the content. I\’d suggest you stick to EOD charts, as I think I its better for swing trading. Any intraday time frame will add complexity to your analysis with very little value add. As far as profit booking is concerned, I think what you are facing is a common issue 🙂
You can opt for trailing stoploss where you keep locking in the price as and when the stock/index moves in your favor.
Thanks for for the input.Could you also suggest the risk reward ratio that i should follow if for instance using 1 Lakh capital and split into 4-5 trades? What percentage target and stoploss should I be keeping for that is in general for a swing trade?
The other way to look at this is – for every 1 rupee of risk, what is minimum reward you expect? It its intraday, I\’d say at least 25 paisa. This really depends on your risk and reward appetite.
Sir can we use technical tool for plotting SnR like there is tool in kite chart ..and what if market is all time high how can we identify resistance at that time? and support at that time if all time low?
Its not possible to plot resistance when the market is at an all time high, hence you need to look at the trendlines.
Where is video no.8 in technical analysis please let me know
You can check the entire series here – https://youtube.com/playlist?list=PLX2SHiKfualH_xMbGM-3zWC47s9gUjGR_&si=VlMEzsA6CRF5Oei1
my mindset was for positional trading but my profit target /stop loss hit early. what should I do at that. situation?
sir what if a stock which i am trying to trade is at all time high right now and it has been constantly bullish since long time, and when i try to draw S&R line, the support price is too low compared to current price and there is no resistance price. In this case how to make a trade ?
Krishna, yes, at such times there is no point trying to apply S&R. What you can do though is use the upward sloping trendline to get a sense of the S&R levels.
thank you sir for your guidance.
Happy learning, Krishna!
Hi Kartik! I’m learning about trading for the first time and have been trying to apply it in real life side by side. I am unable to understand how to plot long termS&R levels for a stock where noticeable price action zones are too far from current market price?
Prerna, do check this video – https://youtu.be/UBkCkBme2Hg?si=DACvS3wDtdkzNZgo
Hello Sir,
I am not able to differentiate between a normal reversal and a sharp reversal, I have marked them in the chart below. 2 of them are clearly visible sharp reversals, but what about the other two, the trend has reversed but they increase in price is not swift, so should we consider them price action zones or not. I am not able to exactly differentiate between them, can you please guide me through the same.
https://drive.google.com/file/d/1pPQVm_CRZ1mVCr26sIR_FiStNGZQ0Mco/view?usp=sharing
I\’m unable to open the link, but a sharp reversal is usually V shape in nature. Otherwise, the reversals are fairly well spread out.
Sir, What should be the ideal time frame to consider for drawing S&R if I am doing intraday trading in Nifty50 options?
TIA…
There is no such thing as an ideal time frame. For example, I personally plot S&R on an EOD chart even for intraday trading – although we are not allowed to trade at Zerodha :).
But that said, you can try plotting S&R at 15-30mins chart as well.
Thank you… Appreciate your help…
Happy learning!
Hello, I have a question.
When identifying support and resistance levels, should we focus only on points where the trend has reversed? For example, if I\’m looking for a resistance level, should I only consider points where the price moved upward, hit a high, and then reversed downward, or ideally stay around the same level each time?
Or is it also valid to include points where the price reversed from a downtrend to an uptrend?
If yes, why is that acceptable? Because resistance usually refers to the price reversing from an upward move to a downward one.
And does the same logic apply when identifying support levels?
I\’m not sure if I get your query fully.
It is valid to look at price points where the price has reversed. In fact, that\’s why we look these price action zones and assess if there could be a support or resistance.
While plotting support and resistance on a 15-minute chart for intraday trading, there are instances where certain stocks may not exhibit at least three price action zones, with only one or two being identifiable. In such situations, what steps should be taken to address this issue?
In that case , switch to 10 minute or 5 minute time frame. For Intraday , other than 15 minutes , 10 and 5 are also acceptable.
Yes, you can do that as well. But this to some extent is like force fitting data 🙂
Go ahead with 2, but remember in the back of your mind that it\’s not time-tested, hence your reliance on that should be just about ok.
Hello, the Ambuja chart for resistance looks more like a support to me. Why is the resistance not be taken at a higher level say 225?
The first chart? Clearly, it\’s resistance, right?
Hi Karthik,
I found that many people are repeating the same question while I was going through the comment section, and you also answered them without any hesitation. Hats off to you! However, if you give a standard answer that \’\’It is already discussed in the comment section and answered\’\’ that will help readers skip such questions to save time. Anyway, it is up to you. Thanks so much for your service.
Thanks, sometimes people prefer to see a fresh answer, gives them reassurance. For me its a quick few minutes job 🙂 – From Karthik
Hello Karthik, I have learnt almost all basic things like candlesticks, S&R, Volume, trend, chart patterns, but I am not able to initiate the trade, could you please help me that, as I a beginner, how I can do so?
I\’d highly encourage you to join one of these classes – https://varsitylive.zerodha.com/home. Here you can try to place the trade live.
I tried to access the live session to register , It is asking for OTP but unable to receive OTP and tried couple of time
Ah, let me check on this.
sir last me checklists wala point thora nhi samjha . like 6 chevklist point kon sa hai
Check this – https://youtu.be/UBkCkBme2Hg?si=WR5Pc-XPt39udCCr
Might I suggest back testing? They can\’t do everything for us lol
Hello Karthik!
When I change timeframes from lets say Daily to Weekly, Support and Resistance lines change as well; what looked like a support on a daily chart, is not a support for the weekly chart. How to choose the right S/R?
Thats right. So the way to approch this is to ensure you are clear about the timeframe you like to deal with. That way, you know what frequency you are looking at and stick to it.
Sir, what is Identification point?
Identification for which one, Subhendu?
By loading the data, I mean time period I should look back to construct S&R.
Yes, that depends on the time frame you are looking at trading. For overnight positions, maybe 6 months data?
Hello Karthik,
I have two questions:
1. Can we create S&R on a 15-minute chart? If so, what time period should be loaded?
2. Can we use S&R constructed on a daily chart on a 15-minute chart?
> Of course you can, you need to laod 15 min chart for this.
> Yes, but it wont be referred to as a daily chart, as it is a 15 mins chart.
It’s I and not U in the above question. Apology for the typo
Thats alright 🙂
U have read all the chapters in this module and tried to trade intraday but couldn’t find much success
Could u pls recommend how u can scale up my game and also recommend some books for intraday trading and in general strengthening technical analysis
We are actually doing a live course on this – https://varsitylive.zerodha.com/programmes/f4747acb-e1f7-458a-94bb-1a154d256795, why dont you join 🙂
Of course its free 🙂
Oh yes, that makes perfect sense! But my question is \”do we consider 230 as a support even if it is in [250,231] range\” just because it has broken that once before? As in, I feel that psychologically we humans would like to give more weightage to the fact that the \”230\” was always acting as resistance (the first 3 times it did), so I was hesitant in that sense. But I think now I get it. It\’s testing the support once it has broken, and IF it comes below that, then 230 becomes the resistance! And if we see a huge downtrend, say it went to 500 and now is in downtrend, then yeah we have to be very careful because the whole up-trend seems to have broken, right? Thanks soooo much for creating Varsity. You have no idea how much impact you & Zerodha have had on my financial journey Karthik!
Thats right Srihari. End of the day a price action zone is a point when traders in the market took some action (either bought, paused, or sold), and they are expected to take similar action in the future if the price were to visit the same price action zone.
Today\’s support can becomes t\’row resistance if the CMP goes lower than support price.
Today\’s resistance can become t\’row\’s support if the CMP goes higher than the resitance price.
Good luck!
Karthik, how does it (x) become a resistance? The CMP is still \’x+100\’ and coming down. My question is, since it has passed this \’x\’ level 3 times before, and all of those times it has only fallen (making that a resistance from that time POV). But, it did for a fourth time cross it and now is coming down to test that support. This question can be heavily correlated to the image below these lines here (https://zerodha.com/varsity/chapter/support-resistance/#:~:text=Look%20at%20the%20following%20chart%2C%20I%20have%20encircled%203%20price%20action%20zones%20that%20are%20around%20the%20same%20price%20points%3A).
Now my dilemma is, are we supposed to consider this as a support, since I mean the sticky points exist and although it has fallen 3 times before, the 4th time it did go up. Probabilistically speaking, it makes sense that we should NOT consider this as a support. BUT, does the market still consider this as a support? I hope my question makes sense 🙁
So here is what I mean –
1) Lets say CMP is 250, and we notice a price action zone at 230. Assume the stock has touched 230 multiple times in the past.
2) Stock declines from 250, toches 230, in this case we assume the stock is testing the previously establised support.
3) However, stock breaks 230, slides to 215
4) Now since CMP = 215, 230 becomes a resistance.
Thats what I meant 🙂
Ideally, we should take entry in terms of buying when the price is around the support price. But what if it breaks the support line, and now the support line becomes a resistance line? We will incur a loss, right?
Support and Resistance lines can interchange, and thats quite normal. This is the reason why you need to have a stop losses in place.
Hi Karthik, thanks for laying out such a beautiful collection of analysis and your experiences. After analysing the S&R, I have a question that has been bugging me since yesterday.
Lets say we have identified 3 zones (at price \’x\’) where we had seen only \”sticky points\” before. Lets also assume that the trend was downtrend until \’x\’, and after the \”stickyness\”, it went downtrend again. (Lets also assume it did hover around the sticky zone for quite a few trading days). According to the behaviour (b: Hesitated to move down further after a brief down move), this does qualify to be considered as a price-action zone.
Now, say we have CMP as \’x + 100\’ with a downtrend incoming. My qustion is, is \’x\’ still conisdered a support? It is if we base our idea on \”sticky pattern\”, but it isn\’t if we consider the fact that the stock fell after the \”stickyness\” all 3 times before. Thanks for creating Varsity, I am highly indebted to you!
Shrihari, so the previous X now becomes the resistance…this is assuming the new sticky price point i.e X+100 also is a price action zone.
Yes thank you
Happy learning 🙂
Why does Gap up and gap down occur.?. I understand it can be because of quarterly results and such but still I can\’t get the idea that without trading activity how does price go up or down.?
Novak, you can check this – https://www.youtube.com/shorts/5uhDBpH3Og4 , it should give you a perspective on why gap ups and gap downs occur.
Hi sir,
I\’m doing options trading, how to find out support and resistance of options trading? Can you pls explain me sir, I\’m struggling more! If I get bullish engulf candle pattern is not further moving up, but it create some high wick and it\’s goes down.
These chart patterns only suggest what can happen, but there are guarantees in the market 😀
Hi Sir,
In a sharp reversal, can the candles have gaps between them.
Thank you
Yes, it can. Why not 🙂
Hi Karthik,
As a positional trader (swing trader), if I use 2 years lookback data to draw the S&R, most of the stocks in the NIFTY 50 universe seems to have 2-3 S&R zones.. How to fix a unique S&R in this case?
Thats the idea, there is no unique S&R positions. For every stock, there will be multiple S&R levels.
Hello Sir
Support and Resistance (S&R) is a crucial concept in both trading and investing. Equally important is the Breakout + Retest strategy, whether holding long-term positions or engaging in short-term trades. In the context of swing trading, for example, if you\’re holding stocks for 4-6 months, you’ll find that about 70% of stocks tend to retest after a breakout. Let’s take Imagica as an example: as of October 10, its NSE price is ₹78.40. If you analyze its price history, you\’ll notice key levels—₹88 as a recent high, and a significant support at ₹70. The price is currently consolidating between ₹70-₹72, a level that previously acted as resistance but now serves as a crucial support. This demonstrates how Breakout + Retest plays out in real-time. Could you also guide us further on how to best utilize this strategy?
How did you pull that 70% stat 🙂
But anyway, yes stocks do tend to retest before they move another leg up. But for this to happen the market has to be conducive. In a bear market, this could very well tend to be a false breakout.
In case of support, the stock prices are increasing every year.
1. How can we plot support in this case where there are no price action zones to compare?
2. If we cannot plot, is there any alternative?
3. Is there any other way to set target price without support?
4. If a stock price has increased 8% in total this week and is in the high price zone, how to predict whether the price will continue to rise or fall?
1) Not possible
2 & 3) You can check pivot points as a proxy for S&R
4) You can look at the trend and make some approximations.
Hi Karthik, I am thankful for providing this quality content modules with us for free but please can you make a module for specifically swing/short term traders, it would be great if you can post a module for that 😊
Thanks for the kind words, Tanmay. Point noted, will try my best to put this up 🙂
Hi,
For the (first) chart (Ambuja) showing resistance at 215, shouldn\’t the resistance be above the current market price. That to me looks like a support level.
Thats right, 215 is the resistance.
Sir, which indicator will tell the best support and resistance? in zerodha which indicator describes support and resistance?
You can use the classic support and resistance technique itself, Sachin.
Hi. I have a doubt.
How do we find resistance level when the market is continuously forming higher highs?
You cant really find, Madhu. Traditional S&R levels don\’t help, you will have to look at trend levels.
Hi Karthik,
Excellent initiative to teach complex stuff in such simple words. Kudos to you!
What if a stock is trading at an all time high and there is no prior data to identify the resistance point?
Would it mean that we should look for a support price and short the stock despite candlesticks forming bullish patterns?
Or do we always identify trading opportunities through candlesticks and then decide upon targets?
Would love to have some clarity on this.
Vedant, if a stock is at ATH or ATL, then the classic S&R techniques may not help. You will have to plot the the S&R by dropping a trend line.
Hi sir,
Have I marked the support level correctly, specially the price action zones.
https://drive.google.com/file/d/1JeafJX5LTztQLkfjJORzkp35oUIm4vwT/view?usp=sharing
Thanks sir.
Yeah, works.
In the explanation of \’Support\’ taking Cipla as an example, I think in the sentence \”Clearly, with a shooting star, the call is too short Cipla at 442, with 446 as the stoploss.\”, \”to\” should be in place of \”too\”, making the sentence \”Clearly, with a shooting star, the call is to short Cipla at 442, with 446 as the stoploss.\”.
Thank you!
Ah, yes, please excuse my typo.
Hello Karthik,
You mentioned BTST trades for short term S&R. Can you give me more details regarding BTST trades?
Do check this – https://support.zerodha.com/category/trading-and-markets/corporate-actions/general/articles/btst-meaning
Hello Karthik,
Thank you for this wonderful material. I have read a few books in the past trying to learn the ropes, but after spending a few thousand bucks, all I got was a bunch of patterns and indicators. Your approach of having a checklist and how to scout an opportunity universe step-by-step finally gave me the end-to-end picture I was looking for.
I also want to thank the other users of Varsity, I have learned as much from the Q&A as from the articles themselves.
I am practicing the step-by-step checklist-based approach. This is more for learning as I am far away from having the confidence to trade. One area I would like to get some confirmation on is support and resistance. I have uploaded 5 charts in the link below where I have tried to identify the support and resistance lines closest to the CMPs. For Bajaj Finserv, Britannia and Kotak Bank, do you think I have correctly identified these? If not, please guide me on where these lines should be on these charts and how you do the identification. For Hero Moto Corp and Indus Bank, as these are very close to their 52-week highs, my understanding is that support and resistance lines cannot be drawn due to a lack of price history. Is the understanding correct?
Once again, hat’s off to you and the entire Varsity team!
Thank you.
https://drive.google.com/drive/folders/1at3U7KrkVw178mosbMIWcNaOsYj7mipN?usp=drive_link
Thanks Prasum for the kind words 🙂
I checked these charts, they are largely correct. Few points –
Britania – 4900-4950 is where there is some price action along with what you\’ve marked.
Hero – Not possible as its trending. You will have to use a trendline.
Indus – 1450 is a decent support.
Hello Karthik Rangappa,
Before i ask something i want to thank you for educating us.
I have a question on how to plot S&R when market is at all time high.
Please do let me know, Sourabh 🙂
Sir,
In the previous comment, you replied \”1) YOu need to look at few time frames, my preferce – 6 months to get a slightly longer term trend, 2-3 weeks to get mid term trend, and 1 day to get the pulse\”. In this context, could you please clarify the below?
(i) To see the 6 month chart and to understand the trend, which chart you would suggest to observe 1D or in hours?
(ii) Similarly, to see 2-3 week, which chart you would suggest to observe 1D or in hours?
(iii) Likewise, to see for a day, which chart you would suggest to observe ? Is it in hour/min?
To me, I feel selection of chart to observe a particular frame is more tricky. Hence, I sought your advice here please.
Sir,
You have mentioned to look charts of 3-6 months and 12-18 months for S&R for long term and Intraday/BTST trades respectively. However, could you suggest the following?
(i) What should be your suggestion to select the time frame while looking for Intraday/BTST considering that I need to look for the past 3-6 months data to select S&R?
(ii) What should be your suggestion to select the time frame while looking for relatively long term swing considering that I need to look for the past 12-18 months data to select S&R?
1) YOu need to look at few time frames, my preferce – 6 months to get a slightly longer term trend, 2-3 weeks to get mid term trend, and 1 day to get the pulse
2) At least 6 months.
Hello Karthik,
For the first time, I have read an approach towards drawing S&R lines. However ,I was a bit confused on the support line for CIPLA @Rs 429(Step 4- Fit a horizontal line). While the line at 429 seems right, looking at the chart, it seems to me that this level is actually a resistance line. The stock has been trading below this 429 line for about 80% of the 12 month period. There have been some brief periods of optimism as circled by you, but my interpretation is the market is more comfortable with a price below 429.
Would appreciate if you can point of the flaw in my logic.
Secondly, would be good to have the latest comments appearing first.
The thing is that the S&R lines keep interchanging based on the current price of the stock. If the stock is below support line, than the same line is considered resistance and vice versa.
Got it.
Thanks for the reply!
Happy learning!
Hey Karthik
I\’m a bit late to the party haha. Is there any ideal range for the S(or R) region? I tried plotting S&R for Asian Paints and got a region of about 3% width. How should I place my trade (target/SL) with a rather wide region?
Amazing content btw, having tonnes of fun going through this.
Thanks
Better late than never!
No, there is no idea or minimum range and that the best part about it. The range varies for each stock and it purely depends on the price action for that particular stock.
Sir,
I have been struggling in intra-day equity trading, and not able to setup a filter for setting up which stocks to trade. I only focus on NSE top gainers and losers at 9:30am , go long and go short (only when it breaks 15 min candle day\’s high or day\’s low with high volume). But most of the time the trade hits stop loss. Can you please help me how to take better decisions while trading in intraday equity part, it will be really helpful for me. 🙂
I\’d suggest you stop intrady all together. But if you really want to, then please shift your focus to EOD chart and try and get the overall direction for the day and place trades accordingly. 15 mins can be a bit noisy.
Hi sir,
If a Stock\’s CMP is 8% below ATH, and there is only one Price action zone (Sharp reversal) above it, and not 3 PA zones, will the only PA zone act as resistance for the stock?
Thanks
Not really, you will have to go with the trend and probably use volatility or a trend-line to identify the stoploss.
Thanks for explaining how to draw support & resistance lines. However Support & Rsistance values are readily available on various sites. Therefore an individual need not really draw support & resistance lines. Is this statement correct. Please explain
The readily available ones are I think Pivot points and this is the support and resistance points. Do double check once.
Hello Sir! Your lectures are very useful.
I want to ask, How many points should coincide with our support/resistance zone?
And is it necessary to draw only horizontal zones?
Thanks Shashank. At least 3 points should confirm to make a price action zone a support or a resistance point. Yes, horizontal lines gives you some sort of consistency.
Can you tell me the final checklist (6 checklist points).
Do check the later chapters for the entire list.
Hi,supposed we are getting two resistance level,one at 1200 another at 1300 suppose our first Target is hit i.e 1200 after forming bullish pattern.should we now at 1200 consider the second resistance lvl as target or exit the trade after hitting our first target
Yes, with the first resistance becoming the support.
Is it a reasonable assumption that, if market is not in a strong bullish or bearish trend, and if there is no news in the stock, the stock price would remain mostly sideways?
If yes, would the support zone then give a rough idea of the valuation of the stock? As most participants buy at that price range?
Just a thought.
Yes, if there are no triggers, the stock may not really move much. That means, the stocks may trade within a trading range and therefore the support and resistance zone will work well. But this does not have anything to do with the valuation of the stock.
Sir, Please Advice me which share to be taken for long term basis. please guide
Sorry, we dont really advice on which stocks to buy or sell 🙂
Thank you so much for the help.
Happy learning 🙂
Hii..
my doubt is that if i enter the trade to go long with an SL which is around support where a lot of buying action happens, what if my SL gets triggered and i make loss instead of my trade going up at support.
You always keep the SL slightly below the support to give room for the volatility around the support.
How do i read BSE chart, it has gone beyond its support level and we don’t nt see support level . How to define support and resistance level in this case.
Dines, you cant really plot a support or resistance for a stock which is in all time high or low zone.
Thank you very much sir… I am Samujjwal 18 years old learning TA ad making notes from your modules..I have a doubt I don\’t know whether you will still reply or not but I am just asking…Sir Can you tell me what should I do if a chart first forms bullish marubuzo and after 2-3 candles it forms bearish marubuzo…soo what should I do?? Should I go for Buy or short?? And you know what sir I had tried it on Tradingview papertrade and u got profit because I choose to short the stock…but I am totaly confused…plz help..
Thanks Sam and yes, I\’m still replying 🙂
So you would have bought based on bullish engfuling….after you buy, you need to wait for either the stoploss to trigger or the target to hit, irrespective of what other patterns form on the chart.
why we have to look prior 8 to 12 months for technical analysis for swing trading i.e trading for few days or week as technical analysis is for short term.
At least 6 months, Pujan.
In which time frame to draw support resistances while daytrading
I\’d suggest end of day timeframe.
Amazing sir. I have been going through lot of stuff including youtube video and literature on share markets. but I must confess that the way Varsity explains, no one could ever. Karthik sir, you done fabulous job. Kudos to you. Thanx
Thanks for letting is know, Sandip. Happy learning 🙂
Hello sir , I have read candle patterns (both single and multiple) provided by varsity and it is very useful. However i have some doubts. In varsity it said, for intraday trading conforming the candlestick pattern at 3:20 pm and then taking the position. My doubt is, the market was closing at 3:30pm and if i take intraday trade at 3:20 it will square off at 3:30 ( the time market close)… please explain what is the time to take a position for intraday after finding a standard pattern
You can initiate the trade at the close of market by taking on positions in futures and option segment. So you do you analyais using TA, execute using F&0. But if you are trading intrday, then even Equities short works.
Can you plot S&R for a particular stock on the kite trading terminal? If so, how do you do it?
Yes, you can do that. I\’d suggest you talk to a support executive for this, will be easier to explain on phone.
Hi Karthik,
if stock price is all time high, then how can we draw the resistance for that stock?
You cant as there is no price point to draw reference to. You can probably extend a trend line and extrapolate the future resistance points.
what is the best time frame to draw S&R for swing trading and intraday
There is no such thing as best time, Suryakanth. You do it when the situation demands.
What is the difference between Demand & Supply Zone and Support & Resistance?
If possible, an example with chart will help.
What is the difference between support and All Time Low and
resistance and All Time High?
Can any one explain pls
Support or resistance is where price action is spread across historical data.All time high or low is a new price point which is happening for the first time and cannot be considered as a support or a resistance point.
Under the para 11.3 – Construction/Drawing of the Support and Resistance level, the example of Ambuja makes a statement \” So if one were too short Ambuja at 204, the target, based on support, can be at 201\”
I think the word \”too\” should be replaced with \”to\”.
Thanks
Ah yes, will change 🙂
Sir if I want to do intraday trading then how much back should I see to draw support and resistance line
Look for at least 5-6 months of data. That is a good starting point.
Hi Karthik,
Please help with the below doubt:
In a long trade, Lets day the support zone is at 100-102 and the lets say the lowest part of candle is a little below the support zone at say 98. Can you tell me in this case, can we proceed with the long trade and if so, what would be the SL? Is it 100 or 98? Please guide:)
Yeah, ensure the close is above the support zone, and you can ignore the shadows.
sir
I see pivot point standard for support and resistance, from my view all indicators, anything has limits. It also, Please tell it is enough support resistance for intrady.
I prefer the traditional way of doing the S&R line, Vishal 🙂
Hi,
Once I manually mark the support and resistance zones, how do I save it so that I don\’t have to keep redrawing it every time
You can save it as a template. Do check with support desk, they will help you with this.
Hi Karthik,
Thanks a lot for creating such a visionary master piece course content.
I just wanted to know if I can use \”pivot points\” from kite studies to get the S&R lines? Please guide.
Thanks
Chandan
Chandan, thanks for the kind words. Yes, you can use pivot point as an alternative to S&R, although I\’m not a big fan of pivot points. I prefer the traditional way of using S&R lines 🙂
Sir
What are uses of tags in order placing.is at any work, why you give us
Helps you keep tab on things 🙂
https://support.zerodha.com/category/trading-and-markets/kite-features/tags/articles/add-tags-on-console
Sir
Is any option in which we buy intarday or sell intraday. Have options to put both stop loss and take profit at a time.
You can explore GTT for this. https://support.zerodha.com/category/trading-and-markets/kite-features/gtt/articles/how-can-i-use-the-gtt-feature
sir
how much far supoort and resistance valid after candle forming.
is it any percentage
Once formed, these levels stay valid throughout Vishal.
Can we use option chain for identification of stoploss and target?and if so,can you please elaborate 🙏🏼
Sam, you can check this – https://www.youtube.com/watch?v=bCRw8YN-4QY&list=PLX2SHiKfualE4o4joBMXM_YHGBKnZSQbs . The 2nd video has the details but do watch the first one as well to understand the overall context.
My ques is regarding \’Construction/Drawing of the Support and Resistance level\’
In point 4: \’Fit a horizontal line\’, you are connecting the prize zones (at least 3) and based on where the line fits in concerning the current market price, it either becomes support or resistance.
But shouldn\’t it be that:
– For Support – we should determine and connect only the price zones that meet the behavior of
1) Hesitated to move down further after a brief down move
2) Sharp Reversals towards higher side
– For Resistance – we should determine and connect only the price zones that meet the behavior of
1) Hesitated to move up further after a brief up move
2) Sharp Reversals towards lower side
Basically, intuitively what comes to mind for S&R is that, it is irrespective of the current market price, that we determine the S&R levels from the past prices.
The graph that you have shown in the \’Step 4) Fit a horizontal line\’ – I am not able get it intuitively i.e. how can 1st circle & 3rd circle be a support as the prices continue to fall down after the reversal
That\’s right, the way we define a price action zone is by the nature of the price movement and its hesitation to either cross a certain price threshold or break below a certain price threshold. The more number of times the price hesitation happens, the better it is.
As far as the placement of line is concerned, you just need to ensure that you identify a few of these price action zones and connect them, but ensure they are well spaced in time.
Hey Karthik, Thanks for the great content. Can we use the \”pivot points\” in the Zerodha charts to draw the support and resistance lines? Is there any content that describes how to use and interpret that?
Also, you have referred to \”Pi\” as a charting software. Hasn\’t Zerodha shut it down?
Yes, you can use Pivot Points for S&R. Pivot points is another technique to identify S&R. Yes, this is available in Kite. Pi, is no longer supported.
does it mean brief up/down move can be any % in terms of number but what matters is the rejection at resistance and price absorption at support?
Yeah, the activity around these levels is what defines the strength of the support and resistance levels.
Sri what do you mean by
\”The critical bit is the rejection at resistance and price absorption at resistance.\”
Does it means brief upmove /downmove can be any number in terms of percentage
For any S&R points to be valid, the price action zone should ensure that at the resistance level, the prices should retreat or get rejected, and at the support, the price should be absorbed or get filled. That\’s what I mean 🙂
sorry , I forgot to mention in swing trading
Thats fine 🙂
sir,
for marking of price action zone does brief up move and down move need to be above specific percentage
The critical bit is the rejection at resistance and price absorption at resistance.
How much period or no of candlesticks shall we consider for drawing support and resistance on a daily time frame?
At least 8-12 months Tejas.
How to draw support and resistance line.
Please see the chapter, I\’ve explained 🙂
Sir as you have said that 3-4% seems enough diffrence for S&R ,
But is such case RRR in most of cases is less than 1 or around 1
So should we consider taking such trade when RRR is around or less than 1 but other points of checklist are satisfying?
Advit, it all depends on the time frame of your trades. Its unlikely you will get trade with better RRR on an intraday basis, so 1:1 is ok. But for longer-term trades, you should look at trades with better RRR.
Is it necessary that always the high of pattern is lower than resistance?
Or
It is the body of pattern forming candlestick which should be lower than that resistance and high can cross the resistance
Remember, S&R is not a specific price point, but rather a zone. Given this, its ok if the prices move \’in and around\’, the resistance point(s).
Sir,
I want to ask that for swing trading what should the minimum percentage difference between support and resistance?
In stock of ULTRACEMENCO I found that there are some support and resistance within 3-4 percent of each and after forming pattern sometime target is just achieving in one day in such case of S&R
3-4% seems good enough for a short term trade 🙂
Hi sir, it\’s a set of well crafted and well curated modules. Thanks a lot sir.
Happy learning 🙂
In Intraday trading, like Bank Nifty and Nifty, how can we set Support and Resistance ?
The same way as you\’d for any other stocks.
Hello Karthik!
I have seen examples where the support and resistance lines were made slant (connecting all highs and all lows) for a given trend for a given time period. I was wondering about the reliability of those slant S&R lines in comparison to the horizontal lines explained in this chapter. What does it mean to draw S&R lines slant connecting price points at different price levels. Why is it that we observe hesitation in the movement of price at these different price levels connected by our slant line?
Thank you!
It just indicates that the stock is trending and making either higher highs or lower lows. When a stock is trending, this is the only option to plot support and resistance lines as regular S&R line (horizontal lines) wont work.
Hello!
Can we have multiple support and resistance lines over the same time frame say 12 months???
(My understanding is that the target which we place is the immediate support or resistance line and not the farthest one)
Yes, thats a possibility to have multiple S&R zones in the given time frame.
Sir,
In the previous answer, Did you try to mean that \”same\” action zones should be considered corresponding to support/ resistance? Or you try to mean \”some\” action? Is there a typo error in your previous answer with \”some\”? Will it be \”same\” instead?
I meant to say same. The logic being the S&R with frequent price action is better compared to others with lesser price action.
Sir,
To identify a support, should we consider only those sticky zones which had previously fallen and then rise?
Likewise for a resistance, should we consider only those sticky zones which had previously risen and then fall?
Or, can we consider all sticky zones (irrespective of risen/fallen) for either resistance/ support?
Specifically, I like to know if sticky zones\’ past nature also consider their consideration for support & resistance?
Anirban, it\’s best to consider the zones where the price has previously received some action.
sir on Construction/Drawing of the Support and Resistance level in this part the 4th point and the last part sir mensioned this(I just subtracted and added 3 points to 429 to get my price range for the support!) i didt under stand sub with what sir some one replay
As I\’ve explained, Vinayak, this is about developing a range instead of a specific price as either support or resistance. This is to avoid approximation risk, as I\’ve explained in the chapter.
In case a stock or index breaks out an all time high, how to determine resistance? Thanks
Its not possible in such cases as there is no data point to base the S&R values.
sir can you explain me about trend line or in which module it is present.
You can check the chapter on Support and resistance. S&R is an indicator of trend.
For swing Trading, which type of chart we use? Can we use monthly or day chart
You can use day chart.
Hi sir can you verify this BTC Chart that I drawn SUPPORT & RESISTANCE
https://www.tradingview.com/chart/tg7l8Ebc/?symbol=BITSTAMP%3ABTCUSD
Dear Sir,
In intraday trading, would it be helpful to apply below rules which we covered in this chapter:
1.The index should form recognizable candlestick pattern.
2.Pattern must be recognized either at Support or Resistance
If yes, which is the recommended time frame ( 1 minute, 3 minutes etc?) to observe the Price action/pattern for Intraday trading.
Thanks
1) Yes
2) Yes
I\’d suggest you start with End of day candle, Narendra.
Dear Kartik,
Thank you for your responses to my previous queries. This query is regarding SL and Target prices for Intraday EQ trading.
Say, X stock made a morning star pattern yesterday on the stocks support zone (on a DAY frequency candle). Now, I wish to trade this intraday today. Now, the SL will be the lowest low of the stock as per the Candle-Sticks module, which brings the SL around 100 points below my today\’s entry. Based on historical data, I think the target can be set to 20-25 points for today.
My RRR on this trade is 0.25. If I consider this strategy for any other trades, I end up with the same RRR.
Another alternative I tried is finding support on 15 mins candles; I end up with only one or two price action zones with 50-60 points of SL.
Please suggest how can I overcome these problems in my setup and guide me on how to approach SL and Targets in Intraday.
Thank You very much!!!
Shubham, one of the easiest way is to traded basis % points. Keep a fixed % SL and Target. On a related topic, check this – https://www.youtube.com/watch?v=1kQjXFL4Mfc&list=PLX2SHiKfualEyD05J9JsklEq1JFGbG6qJ&index=12
Hi Karthik,
Loaded the data with 1 Day time frame and 1 Year look back period to mark the price action zone to figure out the S&R. Sometimes I get the Resistance line only, not the Support. Opposite is also possible. How do we workaround such cases?
Load more data points 🙂
But that said, it should be possible to spot both S&R in most cases, especially if the stock has not trended in a single direction.
Hello karthik sir, I am new to the market. I looking at all the videos in zeerodha varsity. My question is that, are index and stocks trading same?? Do technical analysis, candle stick patterns all these analysis are same for both index and stock??
Thats right, Purushotham, the analysis is the same 🙂
What does that mean-Pivot levels? And how should I verify whether I am right or wrong while plotting SR?
And what about TCS and Infosys query? Are you not allowed to answer that? OK then just tell me the SR levels. So that I can check where I am wrong
Pivot levels is a technique to find S&R, it is a different technique and hence you are bound to get different values. Yeah, I\’m not allowed to answer stock specific queries 🙂
Good morning Karthik Sir
How should I verify that the support and resistance drawn by me on one year chart and intraday chart are right? Though I join all the sticky points, I suppose its not the same as given on other sites that I googled just to verify whether I am on right track or not. Also can you please help me to know the 6 months-1 year SR of TCS and Infosys both, as I have shares of these companies at 3227 and 1459 levels respectively. Now my problem is when should I exit? What should be the strategy? I thought TCS has broken its resistance on Friday but today it fell and same is the case with infosys (May be I am wrong). Should I sell? Please guide
Most likely other site infer the S&R points via Pivot levels, hence the difference Kiran.
Thanks a lot Karthik Sir for your prompt response. I will do the same
Sure, good luck Kiran.
Thanks a lot Karthik Sir for your motivation. Really a good advice, should I start with Tata steel or Tata power or L & T ? I mean large cap or mid cap.
I humbly request you to suggest me 5 stocks out of Nifty 50 that I should study, on which it will be easy for me to apply TA principles. And needless to say that in this journey of stock market learning, I will always trouble you with silly doubts of mine , hope you don\’t mind answering those 🙂
I dont mind answering your queries, as long as I know the answers myself. So don\’t hesitate 🙂
Start with 2 large and maybe 3 mid-cap stocks. See how this goes and build on this.
Hello Karthik Sir
First of all, Thanks a lot for writing such a wonderful course because its such a great help for a novice like me. Though I have understood the TA concepts because of your simple and easy explanation with examples yet the only problem is that I am not as fast as these youngsters in applying the concepts practically . I want to start intraday trading but how is the big question! (for me, may be not for other beginners). Can you guide me? If possible, then pl tell how should I proceed step by step. Hope it does not sound silly as here on the forum people ask about their trades taken and problems related to it, they are not stuck like me.
Kiran, the best part about the market is that the market is not in a hurry. There are 100s of opportunities every day, and the market is ready when you are ready. So it is ok to take time and deal with it patiently.
Start by focusing on just one stock and analyze it everyday through the lens of TA, that\’s the best way to get started 🙂
Hello.
Thanks for the detailed and systematic technical analysis course. Have definitely learned a lot and still learning.
I have a questions regarding plotting S&R. When plotting the long term S&R should I change candlestick pattern to a weekly chart or should I let it be a daily chart. Sometimes the points tend to differ in both charts.
Also for short term S&R, I have been using the daily charts but is there any other way I should consider supposedly if I am looking at the past 3 months to plot my S&R?
Thanks.
I tend to use the daily chart for both short term and long term, but no harm in using both 🙂
Sri,
Good evening!!!…
What is best time frame for Intraday – equity cash trading
No specific timeframe as such, Arun. Experiment with as many as you can and stick to the one which matches your risk and reward.
thank you so much. i will re-read it now..
Sure! Happy reading.
Ok, thanks.
you mean minimum of 15 sessions is something you look for to consider it for S& R?
Yeah, at least 15 sessions.
Dear Sir,
I am quite confused with resistance and support.
Here in below attached screenshot, you have mentioned that, the encircled points indicate the price hesitating to move up (marked in black) further after a brief up move and i have marked other zones in red. why the one marked in red are not price action zones? or is my understanding is not aligned.
https://drive.google.com/file/d/1rcbF9UxJQwaLT8sp7go-2c33RKzKdOls/view?usp=share_link
Please suggest.
You need a series of trading sessions where the stock has hesitated to break a price point, that\’s when you get a S&R point. The points you have marked may have at the most about 4 or 5 sessions.
Thanks for bringing the market to the retailers… I have been doing equities since 2019 through zerodha kite. And earned returns @ 60%, reading your fundamental analysis module.. Now testing options and learning the basics.. Thanks for the thorough knowledge..
Happy learning, Gaurav 🙂
Hi Kartik,
When a stock is at all time high, current example is canara bank. Then it shows evening star pattern, where it\’s 3rd day red candle breaks 20 day EMA support and volumes are touching 10 day average and MACD shows convergence and there is also evening star pattern in bank nifty, how do I figure out how much the canara bank would drop?
The extent to which the stock will drop is anybody\’s guess, Vinit. CS pattern will only suggest a direction of trade and the SL point. Target and the time to hit the target is something CS patterns don\’t suggest 🙂
I have question for Intra day trading, Suppose i calculated pivot point value form previous HLC and accordingly i calculate the S & R points.
So in which point i should buy the trade and Short the trade?.
If market move above from P point should i buy? and if market trade below the P point should i short the trade?
Example
P 33773.89
R1 33904.73
R2 34,029.3
S1 33649.32
S2 33,518.48
So you keep the price point as a reference point and initiate either a long or short at around these points. For example, if you are suggested a long at 33649 based on previous day\’s HLC, then you wait for the price to reach this point in today\’s session and initiate a long.
explanation is very effective
Happy learning 🙂
Hello sir,
How much should be the length of the candle in percentage, to consider it a sharp reversal
Thank you for your valuable time.
There is no standard fixed answer to this, Dhruv. It depends on the stock under consideration.
Can we use line charts in higher time frame like weekly or monthly to identify the sticky price action zones for swing trade?
Yes, you can as long as the idea is to just figure the overall trend and price action zones.
Hello Sir!!
I\’m a CFA L3 student. Few days back, I saw your video regarding career opportunities in investment bank.In that video, u said that trading activities in different asset classes in investment bank in India is not there and is only there in western countries and sir I\’m very much interested in such an opportunitues but the problem is that I want to stay in India only😁.
Sir there is no possibility of such an opportunity in India? How can I expose myself to the same by staying in India only?
PS:May be this is not the right place for such career counselling questions but I do not know any other platform where I can communicate with you sir.
Abhishek, the market is slowly opening up. Look for AIFs in India, these folks employ traders, but the list is small. Apart from this, look for Indian-origin investment banks; you may also find opportunities in these organizations.
Is 1 day(daily) timeframe suitable for swing trading?
If no, then which timeframe is suitable?
Yes, it is.
Hi Karthik,
Thanks for designing such a beautiful and comprehensive course. I have posted 2 queries in the past few days and await your reply. Meanwhile, I was studying Adani Power chart and am confused between 2 support lines that I see. As a swing trader, which one should I choose? One is a longer timeline and another shorter. My chart image with markings is here: https://invst.ly/zl14v
Thanks Priya; not sure how I missed your query. Can you repost the same, please? About Adani, I\’d suggest you consider the one closer to your entry price.
Can gap ups or downs in the past act as support or resistance?
Yes, sometimes it does. But I\’d not rely much on gaps for S&R.
Hello sir,
Can you please tell me for intraday or option trading which timeframe is the best for drawing support and resistance?
Btw, it is great content I don\’t even see this type of structured content in share market at one place on the internet.
thanks.
I\’d suggest EOD chart. Glad you liked the content. Happy learning 🙂
https://invst.ly/zjh57
in this image, 2021 is in a lower price zone and 2022 is in a higher zone. how do we determine the S and R in such a scenario? Even Adani Ports has a similar trajectory.
Priya, in such cases, the lower prices almost become redundant given the price movement. You will have to pay attention to the recent moves.
As a swing trader: for loading data points, do we look at 12 months of Day charts or 12 months of 1month charts?
I\’d suggest you check the day chart.
Sir which one is more reliable or can provide better results-fibonacci or traditional pivot points?
Very hard to say. It\’s best if you back-test and validate both patterns.
Hello Karthik sir,
You mentioned to spot atleast 3 price action zones that are hesitant to move up after a brief up move or vice versa for down move
My doubt is how much percentage move can be called a brief move if we keep in mind plotting S&R for swing trading
At least 5 to 8%, Dhruv.
Sir I\’m a swing trader(generally holding positions for few days) and if I use moving averages for determining whether any stock is in uptrend or downtrend then what should should be the length of moving averages 10dma or 21 dma or 50dma or 100dma or 200dma?
Yes, averages like 21, 50, and 100 are useful for short-term swing positions.
Thank u sir for this amazing module.
Sir how to determine whether any stock is in an uptrend or downtrend?
You can use simple trend lines and moving averages to figure this, Abhishek.
Thank you so much sir for your kind replies.
Happy learning 🙂
Sir I\’m getting little confused.
Swing trading means holding positions for few days and this few days can go on for two to three months or even longer. Am I correct sir?
Also,if I\’m a swing trader then long term S&R i.e,100 day or 200 day ema is relevant for me.Am I correct sir?
Thats right. The expectation is that it can be held for a few days, and can go for longer.
Sir if I want to determine the S & R of a stock using moving averages then what should be the length of moving averages like 10 day ema or 21 day ema or 50 day ema or 200 day ema assuming I\’m a swing trader? Also, I trade on the basis of daily charts(end of the day charts).
Depends. If you are looking for short-term S&R, then use 21-day EMA. Maybe 100 and 200 EMA for longer-term S&R.
Sir, I\’m unable to find the video.Please help me out
All our videos are here, Abhiskek – https://www.youtube.com/channel/UCQXwgooTlP6tk2a-u6vgyUA
How to find the target price of a stock if there is a candlestick pattern around all time high price?
Hey Abhishek, please watch our youtube channel. We will be putting a video on this topic either today or t\’row 🙂
Is it good to enter position (1 day timeframe) at breakout price or closing price of the breakout day sir?
Depends on several factors, including your risk appetite. Not sure if you had asked this query earlier – you take position for half the capital and the rest when the momentum picks up.
Thankyou for clarifying my doubt sir.
Happy learning 🙂
Hello karthik sir,
I have a doubt in breakouts sir. If we find breakout its better to go long/short at breakout price or closing price of breakout day or at/after retest period? Some breakout has retest period and some doesn\’t. How to find whether this breakout will surely have retest period? Many times I booked loss in retest period and other times I missed breakout waiting for retest period but the price keeps on rising? What should I do sir?
Kindly answer me sir
Take a position at breakout, but with half the planned quantity. If the breakout sustains, then add in the other half.
Hi Sir! Hope You are doing well. I want to thank you for sharing your knowledge about stock markets through varsity. I have read this chapter a couple of times and though I understand the theory part in my head but practically when I try to identify support and resistance in the market I find it quiet difficult to actually spot the support and resistance zone. So, if you could suggest me some tips and tricks through which I can identify support and resistance it would be of immense help. Thank You.
Hardik, compress the chart to load more data points, look for price action zones, and start marking that with horizontal lines. You know you\’ve got either S or R, when 3-4 such price action points are connected via the horizontal line.
hello sir
very useful content of knowledge.
vedios and reading is much better according to me.
just now started to go through the comment section.
Q and A is also very usefull.
gaining knowledge rather than taking tips or advise is always better.
zerodha varsity and you are doing a great work.
i am sure this will benefit to all who want to make concepts clear.
thanks a lot
Thanks for the kind words, Milind! Happy learning 🙂
Hi Karthik,
First of all thank you very much for this wonderful knowledge sharing modules.
I really didn\’t understand \”Sharp reversals at a particular price point\” Identification in the charts.
can you please help me with that.
Thanks,
Vinayak
Which part are you getting stuck with, Vinayak?
Hi, I am new to trading, and I am having some difficulties in building a checklist. Can you help me out?
I\’ve put up a checklist towards the end of this module, can you go through that once?
Can you please suggest whether we should use the support and resistance level explained in this chapter or pivot point in kite application while doing trading.
While the end objective is the same, the process of identification of S&R is different. Pick a method which you understand better.
Found my comment sir, it was under volume chapter, sorry for the confusion, my apologies , will continue from there. Sorry and thank you.
Sure. Happy learning 🙂
Sir,
Seems my earlier question is not visible any more, cannot understand why? In the comments you have mentioned that to show 10 days avg volume , one should select MA and select field has \” Volume \”
But in new verion of Kite under MA there is no option to select \” Field \” rather we have \” source \” , can you please tell us , how to have the 10 days avg volume line overlaid on volume?
If you have already mentioned this, then please forgive me for being a pest, I would be highly obliged if you would direct me towards the link. Thank you.
Bhaskar, so in source, select volume. Its will plot a SMA over volume.
Excellent tutorials,thanks.
Happy learning!
Hi Karthik,
You mention about specific events not having certainty but probability. Is there formal analysis of the probabilities of these events. Can you share some references?
Thanks.
You can backtest and figure how many times in the past signal has been generated and how many times, it has worked.
Sir, Could you please tell that whether there will be Support & Resistance at each time frame.eg: 5 minutes, 15 Minutes & 1 hour etc
Yes, you can plot S&R for any time frame that you want.
Hi sir,
If the objective is to identify short term S&R load at least 3-6 months of data points. If you want to identify long term S&R, load at least 12 – 18 months of data points. I wanna know what timeframe do we need to include for S&R . For example i am loading 3-6 month of data points. what time frame should i keep 1 min, 5 min , 30 min, 1 hour, 1day or 1 week i? Please tell me for both.
2. How candle stick is formed? Is it formed on bid and ask rate or on actual transaction occured. For example I put a highest bid of 282 and it is showing on window but actual transaction occured at rate of 281.50 and my bid is still reflecting on a window . Now how 1 min candle will form. What will be high of 1 min candle. Will it 282( just a bid ) or 281.50 ( actual transaction occured at high rate ).
I hope you get my point
For both, you can keep the end-of-day time frame, Shubika. If you loan any intrday time frame say 15 mins, then you will have a ton of candles for 3 to 6 months time frame.
Candlesticks are formed the basis of actual transactions and not really bid and ask prices.
Karthik sir
Can i get my answers.. I am waitng.
Hi,
The support often acts as a trigger to buy. Support is also consider a entry point for trade
Assume the following credentials for the bullish marubuzo:
Open = 432, High = 449, Low = 430, Close = 448
Hence the entry for the long trade is approximately at 448, with 430 as the stoploss.
Now, what if the low of the marubuzo also coincides with a good time tested support? Do you see a remarkable confluence of two technical theories here?
We have a double confirmation to go long. Think about it on the following terms:
A recognized candlestick pattern (bullish marubuzo) suggests the trader initiate a long trade.
Support near the stoploss price suggests the trader the presence of significant buying interest around the low.
While dealing with a fairly random environment such as the markets, what a trader really needs is a well-crafted trade setup. The occurrence of the above two conditions (marubuzo + support near the low) suggests the same action, i.e. to initiate a long trade in this case.
This a particular part i didn\’t understand. We are taking a positon at 448 with stoploss 430 where support level is also consider at 430. Stoploss means exit the trade and Support means enter the trade. Why are we keeping stoploss near support. We know that at support level stock can bounce back. Why do we need to exit when there is a entry for long trade and we are bullish on a stock . Kindly help to understand this.
We are keeping the SL at such a point where there is buying interest. What this means is that if the stock price drop to the support level, then the buying interest will hopefully ensure that the prices bounce back and hopefully move higher again. The fact that the low of the pattern also coincides with the support line gives us the extra confidence to go long om the sock.
Hi,
Ques1. How many candles should be include for price action zone? I mean at least n numbers\’ of candle can be include a price action zone.
Ques 2. Topic \” Optimization and checklist \” under this topic – i didn\’t understand this line -Support near the stoploss price suggests the trader the presence of significant buying interest around the low. what i think near support significant buying interest is high but above mentioned it is low .
Ques 3. Does technical work on events ? Should be use Technical Analysis during events or Volatility based strategy works better ?
1) There is no specific number, but the more the better 🙂
2) Buying interest is high, hence the support is holding up
3) I tend to avoid using TA when events are around the corner
Very nice presentation. Short and crisp but covering everything. Hatsaoff for that. I have a small doubt:
\”For a long trade, look for the immediate resistance level as the target. For a short trade, look for the immediate support level as the target.\”
Can you explain this point? Actually I didnt get the last sentence. Support is where we are buying right, so how can it be target?
So when you buy, you want the price to increase so that you make a profit from your trade. The price is expected to increase to a point where there is some resistance, which can also be your target price. Likewise with the short trade, where support acts as a price for you set your immediate target.
Hi Karthik,
Can you please also explain the methodology used to calculate the support and resistance level in pivot points in kite application.
Aman, pivot point calculation is a bunch of calculations based on OHLC data. Based on the OHLC, the pivot point calculator gives you 3 support levels and 3 resistance levels.
Hi Karthik,
The resistance and support level which you explained in this chapter does not match with pivot point in kite application.
Can you please suggest whether we should use the above support and resistance level or pivot point in kite application while doing trading.
What I\’ve explained in this chapter is a manual method of plotting S&R. Pivot Point is based on a bunch of calculations, hence the results will vary.
thanks sir this will help me a lot…
Happy learning!
Also sir how to choose or select the stocks for different types of trading,
There is only one thing that you need to keep in mind, if its an intraday trading, pick stocks that are highly liquid.
Hi Sir, i am new in trading, So getting confused in that which time frame should be used for which trading types like for intraday ,F&O or swing trading or positional so in all these which time frame should be used separately, and actually what is the meaning of time frame in this trading or actually what is the need of this time frame over 1 month 6 mnth or years,Also is there any chapter in varsity in which there is mentioned about use of time frames for different types of trades. Please suggest links and thnks for your above valuable education ,learnt a lot.
Check this Neeraj – https://www.youtube.com/watch?v=pYC5RfXAm-4&list=PLX2SHiKfualH_xMbGM-3zWC47s9gUjGR_&index=4
Hi sir, I face this issue everyone I take trade(either buying or short selling). Suppose I bought share at 760 and I am doing this intraday, then how to identify the target like the next resistance is a bit far which cannot be achievable in single day, So how do I exit the trade
Akshun, you can use support and resistance itself as a means to identify the target or SL for the trades. Use an intraday chart instead of an EOD chart and plot the S&R, this will help.
sir whats about the chart patterns, trendlines, stoploss and targets in the series of TA
SL and targets are discussed in the support and resistance chapter itself. Rest of the module is about chart patterns, right?
sir,
I have a doubt how to find resistance when index like nifty, bank nifty when the market is at all time high
I know we can see option chain except option chain is there any different way to identify resistance. I am a new bee in the market sir.
Since markets are at an ATH or ATL, finding support and resistance is not possible since there is no prior price reference. You will have to rely on projections or tools like option chain.
Just figured out myself. Please ignore. 🙂
Hi Karthik, a quick help please. Is S&R feature available within Kite chart? I\’m not able to locate it under studies.
Its available and it is upto you to draw the lines on the chart. However, there is a pivot point indicator which you can use for the system to suggest S&R levels.
Sir, If I want to trade on 5 mins candle in Nifty, Banknifty or any stocks then should I plot Support and Resistance on 15 mins time frame or 5 mins time frame ? Your answer will be highly appreciated. Thanking you in advance.
Its best to plot it on the time frame you are looking at. So if you are trading 5 mins, stick to 5 mins charts. However, irrespective of the intrday time frame, its always good to keep an eye on the daily time frame as well.
Hello sir.
I have a question .
Any other Tanchnical analysis need with S&R.
like volume and moving average for being profitable. I think it\’s complex for me to analysis all technical analysis like volume moving average etc
You can always use candlestick patterns and dow theory concepts along with S&R to enhance your analysis.
Hi Kartik ji,
Can you please tell me if am correct
1)In Resistance we are entering the trade at 206 in order to sell the same at 215 which is the target.
2)In Support we are shorting the trade at 442 inorder to buy once again at 435 which is the target.
Yup, Milind. Thats correct.
Hello sir,the content was so good with plain english even as a beginner easy to understand.
1.How to identify in s&r levels
A)Hesitated to move up further afer a brief up move
b. Hesitated to move down further afer a brief down move
c. Sharp reversals at particular price point
Can you explain brief sir ?
Thanks, Bhaskar. Actually, I have answered these in the comments section (along with the chapter). Can you please take a look again? That will save the me effort of explaining twice 🙂
Let me try to clarify the query through an example:
Suppose a stock currently trades at Rs 100 & among three price action points identified (at say, Rs 95), there is a sharp price reversal from Rs 95 to Rs 85. How does action point actually SUPPORT the price @Rs 95 as the prices further reduced to Rs85 from this point?
Unmesh, there are no guarantees that the price will reverse. Its just that the odds of price reversing is high at 95 because there is a price action zone at 95.
Hi Karthik,
I had a query regarding price action point:
If historically, a price action point has a sharp reversal downwards ,how can it act as a support? Shouldn\’t the direction of this reversal also be considered?
For eg :with respect to your explanation for CIPLA \”The 1st circle highlights a price action zone where there is a sharp reversal of price.\” in STEP 4 of the above chapter.
Not sure if I get your query completely, but yes, as long as the price reacts at the same price point, again and again, the price can be considered as either the support or resistance level.
sir , in option trading can we use option chain data as S&R?
Yup, you can.
sir can you please recommend me some books for learning chart patterns and technical analysis in a more in depth manner …
Varsity itself, Krishna 🙂
how someone can set a resistance level so high like in case of IRCTC 5k-6k(where stock haven\’t reached in past)…. please explain….
Good explanation but,If it is possible to make video lesson on this chapter then it is better
We already have, check this – https://zerodha.com/varsity/module/technical-analysis-video-series/
sir,
pullback and retracement are both same?
Yes, traders use these terms interchangeably.
Sir,
Can you pls explain how to pre determine whether it is continuation pattern or reversal pattern? as sometimes its just small pullback.
Pavan, there is no way you can predetermine this. However, one way is to check if the volume. If its a pullback, the volume is on the lower side.
I have share of OLECTRA the CMP is Rs 796.10. The resistance level 1 is – Rs 812.35 and the second is Rs 828.60. tThe support level 1 is Rs 775.45 and the second level is Rs 742.55.
Please advice me as to whether sell it off or retain the scripts.
Thnk you.
What is your view on this? If you are bullish, then I guess you are better off holding the trade right?
How we should choose a particular price as a support in support zone
Firoz, have explained the same in the chapter. Basically, look for price actions zones and connect them.
Thanks for the response, Mr Karthik.
With regard to your reply, I did a little digging and I just want to verify it with you. Am I correct in assuming that in the context of technical analysis, a channel occurs when the price of an asset is moving between two parallel trendlines. The upper trendline connects the swing highs in price, while the lower trendline connects the swing lows.
Yes, basically channel is useful when the asset price is moving in a trend, either upwards or downwards.
Hi Mr Karthik, hope you get a chance to read this comment.
First of all, thank you so much for these series of articles as they are perhaps the most instructive resources I have come across for beginners. So thank you so much to you and your team.
I had a query which I was hoping you could clarify for me. I read your article on Support & Resistance and tried to apply it to the current periods chart of Ambuja. As you know, the past 12 months have been very radical for the stock market. It was extremely bullish for the past years, and now for the past 2 weeks, it has been quite bearish due to Omicron COVID scare.
My question is, in such periods where the stock is shooting up or tanking, and if there are no Price Action Zones in the same price range due to the volatility of the stock and unprecedented highs and lows, then how can we draw the horizontal line? As you explained, we need to find as many price action zones as possible aligned at the same price level.
Hope you can answer my question
Regards,
Shashank
Shashank, thanks for the kind words. I\’m glad you liked the content on Varsity 🙂
In trending markets, you need to use a channel as opposed to a flat horizontal line.
Do the patterns give same buying and selling signals on smaller time frames and are they valid for intraday trading?
Yup, you can use the same patterns for intraday as well.
please add an course about complete price action trading course please add..
Candlestick patterns is all about price action 🙂
so they both should just LOOK near each other. is it all ?
thanks
They should lie in a price action zone, well separated by time.
Hi
how do we verify mathematically that stoploss is near support/resistance level ?
There is no mathematical validation for this.
Hi! I have read the complete chapter of technical analysis and it is soo wonderfully explained in a way that even a newbie like me can grasp it well! Can you suggest me some good books on technical analysis for further read please? I would like to know more about it in detail. Thankyou
Thanks for the kind words, Maaz. I\’d suggest you pick up Steve Nison\’s book on Japanese Candlesticks, its a good read.
Hi Sir
I have a doubt
as u said that the stoploss should be near the support/resistance
how do we verify this condition ?
Thanks
Hi Can u pls tell that whether the pivot point is to be considered as support/resistance level also ?
Thanks
Yes, pivot points are support and resistance points, but these are calculated. The technique described in this chapter is more visual in nature.
what frequency / timeframe do u use for chart…? do u use the 5 min candle, 10 min candle, 1H candles if you want to day trade a stock and identify the support or resistance..?
thanks in advance
I prefer the EOD charts, in most cases, for intrday, maybe 15 mins. Greg.
Karthik Sir, I\’m trying to draw trend lines.
I\’m using \”line chart\” to draw trend lines because it\’s easy to spot reversals.
Here is the line chart Reliance chart (closing price based line) – https://www.tradingview.com/x/TdNn53EX/
Here is the same charts with candlestick – https://www.tradingview.com/x/ZoYp1oZc/
My question:
Can I draw the \”trend line\” or S&R using the LINE CHART? what do you recommend Line chart or Candlestick for drawing trendlines
Its ok to use a line chart. The objective is to only find the overall trend and the stock, for that either candlesticks or line chart will do.
Can I consider the low of a bearish candle is the support and high of a bullish candleis resistance.
Not really. You need to look for the price action zone as explained in the chapter.
Are support and resistance always horizontal zones ?
It can be a sloping trend line as well.
Sir, thank u very much for excellent crafted course. i find it very interesting in reading the module.
Happy reading, Tulasi!
Yes sir, but don\’t you think people need to understand in depth about demand and supply ??? rather than depending themselves on conventional patterns. Depending on Conventional pattern is like memorizing math problems.
Thats the thing, you should not get into memorizing patterns. You should understand the patterns and logic so well that the price action becomes evident.
Respected sir,
Sir in technical analysis you have mentioned almost everything but you didn\’t mention a very vast chapter regarding supply and demand zone.It would be really helpfull if traders know from which are there is a supply and demand and at which points banks or institutions have pending orders.
Rajdeep, if you realise, the Candlestick pattern is a manifestation of supply-demand. The supply-demand situation is what really causes the candlestick patterns in the first place.
should i use all the indicators only on 1day timeframe or can i use them on any timeframe ? like all ema crossovers, rsi, macd, etc.
because when i switched the timeframe it looked confusing.
i was thinking of switching the timeframe only for price action and using indicators only on daily timeframe.
also do you include a stock if it has no chart/candle stick patterns (assuming you look for chart/candle stick patterns as the first thing) but what is it shows a good price action like maybe a breakout. will you take that trade?
Anuresh, you need to stick to basic indicators, maybe restrict to just 1 or 2 that you understand well. As far as the time frame is concerned, try and start with EOD charts, you can move to a short time frame at a later date once you get comfortable with EOD trades. Eventually, the candlestick is about price action, not necessary it has to follow a know candlestick pattern.
if i am a swing trader using 2hr charts to analyse a stock. here will s&r from 1day timeframe work or should i use s&r from 2hr timeframe. which will you prefer?
I\’d suggest you look at both, although EOD chart is good enough in my opinion.
Wow. Hats off to you Karthik Sir. In depth Knowledge shared with such ease of flow and examples.
Thank you and the team for the efforts, learnt a lot from these documentations.
Happy learning, Sharath.
I found it’s a very useful knowledge. Thank You Very Much. Best Wishes.
Good luck and happy reading!
https://drive.google.com/file/d/18Jra895y9_Y1KUNpVq9hktkYE0cJaqCK/view?usp=drivesdk
Sir have a look at the above pic,assuming it forms any bullish pattern near support should I keep target as I marked,I\’m confused there are so many levels within this range
Struggling to keep target
The easiest target is 3000, usually, round numbers act as physiological S&R points where prices tend to react.
In Support Price section (11.2), the prices are specified as- Entry – 442, stoploss – 446, and target – 435.
How is this possible? Shouldnt the support price be the stoploss? As the stoploss cant be below the makret entry price?
For short positions, SL price is higher Prashanth.
I have a doubt here.
If the current price is 52 weeks or all time high, we may not have any data points to connect at that level. Then how do we identify the Resistance point?
Thats right, in such cases you use the trend line, which is sloping upwards (for ATH) and sloping downwards (for ATL) stocks.
Y I will put stoploss above my entry point if I want to make Profit.
Entry – 442, stoploss – 446, and target – 435
For short positions, you need to ensure the SL is above your entry price since you expect to profit from a drop in price.
Is there a tool that can automatically draw the support and resistance line, rather we drawing it manually?
Not that I know about.
FROM ABOVE COMMENTS
Priyanshu Kumar says:
Is it always necessary for trade initiated on recognised candlestick or candlestick pattern to comply with s&r”???
Karthik Rangappa says:
No, not really. Its an added advantage if it does.
——————————————————————————————–
Sir My question is
\”If there is \”NO recognizable candlestick pattern\” is present, while CMP is near the Support. Can i initiate long trade on the basis of support (with other checklist points volume, RRR etc)
Thank god i found Zerodha varsity and teacher like you
Yes, you can. Remember the candlestick names for only names assigned for specific patterns. The end objective is to identify the price pattern and trade based on it. So yes, you can trade even based on S&R. The more number of things in the checklist confirm, the better it is for you.
Good luck.
Thank you so much for reply sir.
This means here we are considering support zone (around 100) as STOPLOSS , not the low of the Bullish Marubozu (110), am i right sir?
In this case they both coincide right? If they do, then that\’s the best bet. Else if the support is very close to candle low, then you may as well consider the support zone.
Karthik sir, consider a hypothetical situation.
Support is around 100 and Resistance is around 130.
suppose a Bullish marubozu occurs with open=low=110 and close=high=115.
Here bullish Marubozu appeared middle of the support and resistance.
since its not following \”for long trade low of the pattern should be around support\”.
Is it good idea to enter trade in \”MIDDLE OF S & R\”?
(while keeping volume,RRR and other checklist points in mind)
Yes, you can enter at 115, with a SL of 100, and a target of 130.
Hello Sir,
The support and resistance shown in this lesson are perpendicular to the Y axis. In case of an upward trend or a downward trend, can the support and resistance be at an angle to the Y axis?…if yes, do we still follow the same principle to plot the support and resistance lines?
Yes, you can always plot a trend line to identify these points.
sir what is significance of support and resistance? Why such thing exist or what happens behind the scene? Does support and resistance not kind of expires or something if price had already crossed it in&out multiple time ?
Adil, these levels are formed due to the market\’s reaction to price movements. I\’ve tried to explain it in the post itself. Do give it a read 🙂
Can we use multiple candlestick pattern for intraday?
Yes, you can.
Hi Karthik,
How do we place target value for a stock when it is hitting fresh highs? Here there is no previous points to take as resistance.
Standard support and resistance points wont help, Pavan, because an all-time high is uncharted price territory. You can try using a trendline here instead.
Hi Karthik,
If a stock is on an upward trend with prices reaching historic highs throughout the trend, how can we identify the resistance for such a stock? Since resistance is always above the current market price and we would not have price action points above this price, what checkpoints would one use for TA of such a stock?
For stocks that are trending higher and making ATH, it is not possible to identify the S&R points. For this, you will have to use trend lines.
Charts like Tata steel are in continuous up trend for a long time , does the S&R have to be a horizontal line as mandate ? finding it difficult to align the price action zone.
It is best if you plot a trend line to identify support and resistance for stocks that are in a continuous uptrend.
Hello Karthik,
Very nice explanation and easy technique to identify range of stock price. My understanding is we have to figure out two ends (Upper and lower) of Price range here by looking at least three price zones around approx same price. Hope I put it correctly here. But I could see following three possible scenarios with this technique. Could you please conclude trading strategy based on these scenario?
1. What if Current market price is above the resistance price range?
2. What if Current market price is below the support price range?
3. What if Current market price is between support and resistance price range?
Deepak, these situations is what really marks the trading range, things like double top/bottom, triple top/bottom etc. I\’d suggest you take a look at that, which we have discussed in the module.
Hi karthik ji,
It\’s a interesting to go through the chapter, will you clarify me how to identify it on day trading for bank nifty. Because I am seeing so many videos about the chapter previous day they you level how confident it works on next day. Kindly elaborate it in detail to get success in day trading.
All TA patterns are applicable across different time frames, Sandeep.
Hi Kartik,
One we enter into trade, say in long position, what should be our target price? from candle stick we do have stop loss
Should we consider resistance level as target or any indicator like BB to consider..what practice do you prefer?
Yes, you can consider the resistance level as a target for long trades. For short terms trades, this is what I generally do.
Support price means one needs to start buying stocks as price is going to increase further and the stop loss in a bullish marubuzo indicates the price at which one needs to sell the stocks to avoid deeper losses. So if stop loss coincides with that of the support price rather than suggesting us to go long does it not contradict each other.
Support price means that the probability of price reversing and going up is higher, but not guaranteed. Yes, SL in bullish marubuzo is the price at which one needs to liquidate in case the market reverses the direction. In fact, SL in any strategy is to help you in such situations. If SL coincides with support, then its a double indication that the trend is likely to reverse.
Sir
In intraday yesterday resistance turn in support next day and yesterday support become resistance next day vice versa
Yes, support and resistance can interchange based on the movement in the underlying price.
Greetings Mr. Rangappa,
I have had a small query, for quite a while! The Support and Resistances, as you mentioned in the chapter, are tried and tested levels/range at which the demand and supply could emerge! But, if we were to analyze the current market scenario, we will find that the market is at an all-time high price. In such a case how are we supposed to place the support and resistance, that may be relevant to the current market? Please share your view on this matter!
Thank You,
Yash Tawde
You cant apply support and resistance to stocks which are making all time high. You can try and apply trendlines though. Its similar to S&R, except the trend line is at a slope.
Thanks for the varsity, It helps me a lot to understand the market as a beginner.
Happy reading, Nitheish!
Hi
When u say price action and support resistance are we talking about the same thing here?
Reg, Sunil ( 9746207103 )
I registered with Zerodha yesterday but i d not have a username and password to open Kite. Do they send it later?
Thats right, S&R is also a manifestation of price action. Yes, you will get the credentials soon.
Hi Karthik,
Thank you. What happens when the support and resistance levels are broken? Market will go in one direction? Do you have some chapters on mean reversion?
Regards
Anil
These S&R lines are only a guideline on to where the possible support and resistance zones are for the given stock/index. Now just because the stock is at the S or R, doesn\’t mean it will react a certain way.
Hi Karthik,
I am unable to identify and draw the support and resistance levels quickly, its taking time and not effective too , visually identifying price actions are challenging. Is there any technical indicator which does this ? Or any website which draw these lines in real time?
Thank you for your help.
Anil, you can look for pivot point and CPR (available in the CHartIQ version on Kite).
sir i cant that how to create a support and resistance for intraday , when it is a new high which time frame we should choose for intraday. and tell commonly which is best timeframe for intraday S&R.
Try plotting this on 15mins candle.
Sir how to set a S&R , When index is so high , I looked 3 months price point to Set S&R for nifty index, but index making new high and highs support and resistant are not even near that in that time frame. today nifty 50 index near 16000 but in the 3 months price point in April and may are so below it almost 1000 points low it seems a big difference in the cart how can i set a S&R now?
Its difficult to plot S&R for stocks/index at ATH. Its best if you can set up a trendline for this.
Thanks for the module , its very informative
Please can you explain how to find a good stock to trade as there are many stocks out there and various new opportunities daily arising in different stocks. As it is difficult to look at charts of these many stocks and find a opportunity at right time
And which screener is best and how to identify a good opportunity to trade in a stock before it over ,By probably using a market screener or any other method
Thanks for the information and great content
This entire module is dedicated to help you understand how to find stocks to trade 🙂 I\’d suggest you start with Nifty 50 basket.
\”Entry – 442, stoploss – 446, and target – 435.\”
Is this correct ?
For a short trade, sounds correct.
Dear Sir,
Nifty is trading at its all-time high. What exactly would its resistance be?
Not possible to plot since it is at an all-time high. The best way to trade is to trail the market.
sir, all the charts shown in the chapters are in what time frame?
Mix of intrday and EOD.
Sir,
1)Can we use pivot points to identify support and resistance? Is it as effective as S&R?
2) while doing swing trading we need to look for atleast a year\’s data points. The data points/candles should be daily, hourly or ??
1) Yes you can use it. I personally prefer the regular S&R method
2) You need to build different perspectives, starting from a year to 6 months to 1-2 months. Basically get an idea of whats happening on near term and long term basis.
Hi,
Just wanted to know that if a stock is trading above its resistance price then is it a good idea to short the stock or should be long on the trade.
Thanks in advance
You need to explore ideas that will make you go long and SL near the support (remember, a stock price above resistance, then resistance becomes support).
Can we use the pivot points available in Kite to ascertain support and resistance. Also how to get 2 year data in kite desktop.
Yes, you can. Which data are you talking about?
Hi Karthik
What is the ideal lookback period for loading data points for long term investment (five yrs and beyond) and what should be the interval as in data for 5/10/15mins of data for days/weeks etc to arrive at realistic S &R levels
Regards
I\’d suggest at least 2-3 years of data, EOD data should be good.
Thankyou sir for these amazing knowledge and support.
I want to confirm that the plotting of S&R is helpful because it\’s shows the resistance and support history price range and we expect it the same for the upcomings?
Thats right, Saurabh. We expect history to repeat itself.
Hi
how to ascertain the Support/ Resistance if there are three levels of price action points eg in Ambhuja cement chart above one can identify another set of price action zones at the bottom of chart with horizontal line aligning with price range of 157 rs.
The price action point at which the stock has spent max time is a better price action zone.
While discussing support you\’ve mentioned :
Entry – 442, stoploss – 446, and target (Exit) – 435.
Why should i enter market at a higher price (442) and exit at a lower price (435) ?
Please explain.
You enter at a high price with an expectation that the market will go even higher. You exit at a low price only in case of stoploss.
Hi Karthik sir,
Hope you and your family are staying safe. I am new to trading, so apart from reading your well explained modules, I also try watching a lot of Youtube videos. In one of the videos, for plotting SR, it was said that the SR line can pass through the wick but certainly cannot pass through the candle. Here the illustrated charts show that the SR lines are passing through the candle. Please explain.
Thanks
Sri
Wicks can be misleading since these are formed (sometimes), by instantaneous volatility. Hence, I\’d prefer to consider just the candle body.
Hello Sir,
When stock is at an all-time high. Does resistance work in such case?
Not really, because there no previous resistance levels.
Sir aap mujhe mere ac opening date bta sakte ho plz
Hi Karthik,
Thanks for explaining the S&R concept in such an easy language which is very helpful for a beginner like me.
Since i trade mostly in Intraday Banknifty and Nifty which timeframe is ideal (1/5/10 minutes,1 hour) for intraday trades and for how many months data points do i need to consider ( Specifically 3/6 months)
Thanks, Sumit, I\’m glad you liked the content. I\’d suggest 10 or 15 mins for at least 3 months.
Hello @zerodha I have a query that mostly all of the patterns in candlestick require a recognizable previous trend (bullish) if a bearish pattern forms and vice versa than how should we trade if we want to trade a trend up or down in whichever a stock is .
Plzz Respond
Its simple, you need to look for a bullish trend for a bearish pattern and a bullish trend for the bearish pattern.
If the current market price is below the identified point, it is called a resistance point; else it is called a support point.
Here, identified point means ?
Please give example of it.
How should we determine the entry points
i can\’t find the chart patterns like triangle charts in varsity. help me bcoz i think they are useful patterns
Haven\’t really included that here, Sahil.
Hey! I\’m facing problem drawing S&R. Is there any site which provide S&R in chart?
Not that I know about. These are highly dependent on the person drawing the S&R lines, for example, the point that I think is support maybe be 2% away from the point you\’d consider support.
Dear sir, I am bit confused about resistance of Avantifeed. I feels around 550 (547 to 555). Please suggest. Thanks in advance.
Thanks a ton mr.karthik,absolutely amazed ,ur teaching is really professional and in depth.it is so helpful and building our confidence.thanks to zerodha too for providing us with this wonderful teacher and knowledge.God bless u.
Pallavi
Happy learning, Pallavi 🙂
Hi Karthik,
As of today I see a bullish engulfing pattern in Adani Power Stock. And I had drawn the resistance and support for the same to check whether if the market price is within those. But the current market price is above the resistance level. https://www.tradingview.com/x/IQDDeime is the snapshot of the chart I had drawn. Kindly clarify if my support and resistance levels are properly drawn.
YEs, Vamshi, it does look like the S&R lines are correct.
How to identify resistance value if stock is trading at all time high?
Is there any option available in Kite charts which directly show S&R for selected timeframe?
You cannot calculate the resistance value if the stock is at ATH. At best you can draw a trend line and see the likely resistance.
Do we have an option to plot the support and resistance zone automatically in Zerodha?
Thank you
You can check the CPR and Pivot point for this.
Sir ,Mara camera on nahi ho rah he, plz.help me
I would suggest you to include more about time frames, it is not clear that one should do this analysis in which time frames for which type of trade, like swing, intraday or long term etc etc. You can add up some chapters on time frames which include information we can extract by different time frames and intuition, difference etc.
Like I\’ve mentioned at the very beginning, TA can be applied across all time frames and across all assets. Be it intrday or EOD, the pattern and the analysis technique remains the same.
Hello Karthik,
So far, I have found out the support using the following technique:
-A V-shaped or a U shaped recovery
-Support established by a prior candlestick pattern i.e if there is a prior candlestick pattern formed anywhere prior to the current timeframe at the same price point as the current price, I consider that as well as a support line.
However, in your explanation here, you have asked to identify 3 price action zones. So if we go with the approach of price action zones, then it so happens that when calculating support, we end up considering points which in the past were resistance points.
For example: Consider the following points in your article:
a)Hesitated to move up further after a brief up move
If the price hesitates to move up further after a brief upmove, then shouldn\’t that be considered resistance?
b)Sharp reversals at a particular price point
If there is a sharp reversal at a particular price point, then it means that there is resistance at that particular price level
Kindly clarify as to why we are considering prior resistance levels as well in the calculation of the ***support*** for the current price point.
Regards,
Kiran Hegde
Prior price points act as a way to establish the support and resistance levels. Without which, it may defy the purpose of plotting the S&R levels.
Okay sir, will do.
Good luck!
Sir! Can you please take a look and tell me if I\’ve drawn the trend line and the horizontal support line correctly?
https://drive.google.com/file/d/14TGgKPgAt6Z_UHv9R-PwH2X6bnyrt6TM/view?usp=sharing
Looks correct, Prashant. Maybe you can take the trend line a bit closer to the prices.
Thank you Gurudev 🙂
Happy learning 🙂
Sir! Can you please share a screenshot after drawing a trend line and sloping S&R on Nifty EOD chart since Sept\’20? It would give me an idea on how to plot it going ahead. I\’d be extremely grateful to you.
Ah, I\’ll try and do that.
Sir! How to plot S&R when one can\’t find 3 price action zones at the same price level when a stock or an index is in a continuous uptrend like in the case of Nifty since November\’20?
In such cases, you draw a trend line and draw sloping support or Resistance. I\’ve not included this, will try and update this topic.
Sir, The resistance chapter, the resistance of Ambuja cement is 215. Can we apply this for day trade. We need the time duration for applying it to be mentioned in it.
You can choose any time frame and apply the same. For example, 10 or 15 mins.
Sir for past few chapters you have been using the term \”go long\” & \”go short\”, these however have not been explained according to me will they come later or did i miss them in module 1?
I guess we have explained this in the previous module, Saksham.
Sir then long term means is it better for 3 years
Then I need to go back 3 years back and draw?
Sir I observed past and present price action zones overlap or does not match
Long term is minimum is 3 years, if not 5 🙂
New price action zones forms as and when market moves. This is quite common.
Sir once you told me drawing 12 months S&R is enough for Swing trade but
Sir does S&R of past years like 4 years work now, but I\’m not taking into consideration that many years
Its always good to keep in mind the long term S&R while trading. Gives you a perspective of price action.
Where is the 6 point checklist
See the last few chapters.
Hi, I would like to open trading account. Can you please guide me to open an account. Thanks
Sapna, it is a fairly straight forward process, here is the link https://zerodha.com/?ref=varsity, you just have to follow the onscreen instruction.
Any time frame where the support n resistance zones vary from the other timeframes?
Thank you.
do support and resistance zones remain the same in triple time frame or its different?
Thank you.
Yes, it does.
Thanks kartik,
really appreciate your help 🙂
Good luck!
Hey kartik,
https://drive.google.com/drive/folders/1T4RnuO9RkvIOTaa4DUlv6UXE–10VXng?usp=sharing
can you please go through the link and confirm that did i mark the S&R points correctly or it can be better . Kindly give your suggestions if anything is not right or all of it.
Current price is 215.95 so the top line in the pic i take as a resistance price where , the middle line as a support price as it is below the current price and the lower line as the support price if the prices gets lower than Rs. 203.39
I\’ve taken the 18 moths data because due to covid all the stock prices were lower so i thought it wouldn\’t give the proper S&R if i choose only 6-12 months of data.
Thank You
Vibhor, I did look at this. The S&R marking seems properly marked. Good luck.
Hi Karthik
The module created by you is of utmost help , thank you for that.
I had two doubts :
1) The S&R creation technique explained by you focuses on identifying price action zones (Sticky points, sharp reversals) but it does not focus specifically on price points from where it fell or regained. In conclusion are we saying that once we draw a horizontal line basis price action zones same could be both support or resistance basis the position of the price point of the stock.
Example : If my current market price is – 400 and I draw a horizontal line across three price action zones at 380 ( All three are sharp falling reversals that is price fell down always as it touched 380) so is 380 actually a support for me becuase historically the price generally went down when it came to 380 level.
While creating S & R for longer time periods lets say computing basis 2-3 years , are 3 year old price points actually reliable in the sense the time value of money , inflation , market sentiment etc .
1) That\’s right, depends on the current market price. So 380 becomes support, as long the current market price is above 380. Once the price falls below 380, 380 becomes resistance. Also, S&R in my opinion is not really a single price point, its a price region/band.
The relevance is lesser, but never the less, its good to know what happened at that price historically.
sir,
I have tried calculating s&r with 3 data point. so can you tell if its wrong or right.
https://in.tradingview.com/chart/SmpoquAJ/
Thank you
Hello sir,
I have taken 3 months data points. and created this. can you tell me if i have plotted it right.
https://in.tradingview.com/chart/SmpoquAJ/
thank you
Shekar, this seems correct to me.
how do we trail stoploss?
You cancel the SL and put a new SL in the direction of the underlying\’s move. You basically alter the SL to lock in more profits.
Is it always necessary for trade initiated on recognised candlestick or candlestick pattern to comply with s&r”???
No, not really. Its an added advantage if it does.
Sir, you said that s&r tells us about the target price. And on a standalone basis it can be used to identify trade entry point as well.
“Is it always necessary for trade initiated on recognised candlestick or candlestick pattern to comply with s&r”
What weightage does it holds in checklist??
I\’d give it at least 30 – 40% weightage 🙂
Sir , you said that if you want to identify
~Short term s&r load at least 3 to 6 month of data point
~long term s&r load at least 12 to 18 months of data point
But the chart type would be of??
I mean 1min, 5min ,eod week etc.
Look at End of Day chart.
How do we auto-populate S&R lines on the Kite chart?
Not possible, unless you use CPR, which is a slightly different form of S&R.
With regard to above pic my target will be at 967
Stoploss at 1075
What\’s your view on this sir
Sir some has tried to break the resistance and made new highs will u keep high as stoploss
What will be your stance sir
Not sure about the target, but resistance seems fine to me.
Finiding some difficulty while drawing S and R,sir I\’m trying to be perfectcly plot the that is the problem with me how can I overcome that I will attach some of the files I\’ve drawn guide me sir
https://drive.google.com/file/d/1-AySEbEmez_JoDr_2MgN9Wz5e83p7YHm/view?usp=drivesdk
YOu seem to have done a decent job with placing the resistance, Chandu. Why are you concerned?
Hi,
How do we select the 10 week moving average option on chartiq?
Thanks,
Dt.
Change the period to Weekly charts, instead of daily.
Hi Karthik,
While plotting Support/resistance,if we are not able to identify 3 price action zones even after loading 2 years,can we look at data for 3years…What is the maximum years data that we can use to plot S&R.
You can look back upto 3 years or even 5 years. But usually, 2 years of data should lead you to some points around S&R.
Hi Karthik,
Thanks a lot for explaining all concepts clearly. I have one query.
In case of buy,if we are not able to plot the resistance for any stock,but still have one price action zone above CMP.Is it safe to buy?If yes,what can be considered as target price?
If there is a lot of momentum building up, then it is ok. Look at the situation from an overall market perspective.
Hi sir is dark mode available in web?
Yeah, please check this – https://zerodha.com/z-connect/zerodha/bulletin-latest-at-zerodha/dark-theme-simplified-order-window-on-kite-web
Hi could you please tell me how zone 4th price action zone is a sticky region, cause the price moved up after brief upward movement.
Thank you
I see a bit of stickiness at that point. By the way, this is the thing with TA, it is never the same for 2 individuals 🙂
Hello karthik,
its really very informative to know about support and resistance for novice traders like me,
However i would like to ask you a question
Is pivot points indicator plotted in the zerodha platform varies as per time frame ??
because when i tried plotting pivot points on different time frames it gave me different support, pivot and resistance levels.
could you please help me with this
IF WE TELL MONTHLY RESISTANCE. MAY I KNOW WHERE I HAVE TO SELECT MONTH ON THE CHART. IS IT ON TIMEFRAME OR ON CANDLESTICK
Select Monthly charts instead of EOD chart, Priyank. This is on the timeframe.
Please provide weekly puvot levels of all stocks.
It is very useful
Unfortunately, we cant fo that.
Hi
Do these support and resistance level techniques make sense in December 2020?
Asking because I want to swing trade and looking at prev 12-18 month charts the market went exceptionaly up from March 2020. Therefore the horizontal line is always below the current market price.
Thanks
You always plot the latest S&R to see the latest levels. But generally speaking, once the S&R levels are marked, it continues to remain the same.
Hi, how to identify resistance for all time high market
Unfortunately, you cannot since there is no price reference.
Thank you Sir
Good luck, Nilesh!
Sir, I have been Swing Trading from quite a few months. My observation is that since it was a steep uptrend, as market was recovering strongly, there were many opportunities to go long. As on today, market is relatively stable and sideways trend or small downtrend can be expected. How can I identify buying opportunities in sideways trend.
Also,
1. If stock has trending above its all time high (recent examples of HDFC Bank, TCS, etc.), how can we plot S&R Values.
2. Can we use ready Pivot Indicator (includes various S&R Levels) available in Charts (Chart IQ and TV)?
3. If yes, then to what extent?
Thank you!
1) S&R may not help in trending conditions, you may want to check to plot a trend line instead.
2) Yes, CPR is also a good option
3) You can use it for at least a year\’s worth of data.
Sir I\’m comfortable drawing support and resistance for 6months,if I extend above chart looks compress and real frustrates me to know price action zones..shall I draw support and resistance for only 6 to 12 months
12 months is fine, Chandu.
Hi Karthick,
Having said by you that we can keep the stoploss if candle low or high is exactly coming to the support or resistance but What if a candle low or high is having a small difference in the price points with the support or resistance? Also what if the candle centre body is placed on support or resistance? Do we still consider that? Or we should skip the trade in that case?if yes then where we can keep the stoploss for that trade?
The S&R points are auxiliary to CS pattern. I\’d suggest you pay more attention to the CS pattern.
and also wanted to ask that when going for range breakout trades should we wait for the candles to close/finish (on any time frame) and then take trade on the open of the next candle or we should take the trade as soon as the breakout/down occurs?
I\’d prefer to wait for confirmation 🙂
Just a silly question karthik,
in case of F&O should we draw price action on the option strike prices (in the money) or should we draw the price action on the spot??
Spot price, always.
Suppose, in a continuous up trend, entry @ 50 and target (resistance) is @ 100 but @ 90 there are doji and spinning top for 2 – 3 days. (In swing trading, eod chart). What should the stance
Depends on how strong the trend is. If maybe ok to continue the position as long as you get a sense that the momentum will continue.
Thanks,
Good luck!
Good morning sir,
Just I want confirm my understanding about S &R regarding ; National aluminium company (CMP around 43) i feel its resistance around 47.4 to 47.7 please correct. I am apply day data in background of more than one and half year. Thanks
I\’d say it between 46.5 to 47.5 🙂
How about Trend lines. It is pretty similar to Support and Resistance right?
Is it important in Technical Analysis?
Yes, the trendline is similar to S&R, and is useful when the stock is trending in a particular direction.
Good morning sir,
Sorry I know this platform is for pure educational purpose but just I want confirm my understanding about S &R regarding ; National aluminium company (CMP around 43) i feel its resistance around 47.4 to 47.7 please correct. Thanks
Hi Karthik,
What is price action. It is not covered in previous chapters. Thanks.
The entire CS pattern is based on price action theory.
valuable lesson
Hello sir,
I could see that we can also get automatically generated Support & Resistance from the option pivot points.
Then ,
1)under what situations would we need to apply this method & manually draw S & R by this method?
2) What do support 1, 2,3 and Resistance 1,2,3 mean?
3) Where can i find the meaning & explanation of other field that can be changed while we use the points pivot options : like – panel , show as underlay , continuous /shading etc.
1) They are two different techniques. No situation demands you to choose one over the other, you will have to select which technique you\’d like. I prefer the manual way.
2) These are just 3 different levels of S&R. Usually, S1,S2, and S3 are considered as short, medium, and long term supports, likewise with resistance
3) Hmm, not sure, but I suspect these are just aesthetic options, you can ignore them.
Sir,
What time frame is ideal for plotting intraday s&r??
I\’d suggest you load 10-12 day\’s 15-minute data to get a perspective for short term S&R.
Thanku Traders Lounge family
Hello Karthik,
Thank you very much. Much appreciated. It\’s so refreshing to see someone taking an active interest in the welfare of the investor community.
Thanks,
Kiran Hegde
Happy learning, Kiran 🙂
Hello Karthik,
In response to your previous answer, what i mean to say is that, the current market price has breached the support level and is within the 5-8% range lower from support and now a candle stick pattern gets formed.
1)How do we react here?
2)Can we still trade considering that the current market price is just 5-8% lower than the support?
Thanks,
Kiran Hegde
1) Then what you presumed as support is not resistance. Maybe you can initiate the trade based on the CS pattern and keep the resistance as a target. Point is, all lines above CMP is resistance, it cannot be treated as support
2) Yes, but the approach should be different.
Hello Karthik,
As a follow up to my preceding question, can we take a trade if a candlestick pattern is formed but the current market price is lesser than the support level by 5-8% range?
Thanks,
Kiran Hegde
That case, it is not support in the first place right? It would be the resistance.
Hello Karthik,
Thank you very much as always for the prompt response. I did like to reconfirm something again.
\”2) Closer the better. I’d avoid its more than say 5-8%. Also depends on your risk-taking abilities, which I assume is also dependent on your capital.\”
As long as the closing price of a stock comes within the 5-8% of its immediate support level(i.e the closing price is 5-8% higher than the support level) and a candlestick pattern is formed, we could possibly take a trade by evaluating other things in the check list.
Is that what you are implying?
Thanks,
Kiran Hegde
Yes, the key element is to evaluate how conducive the overall market situation is for the long trade.
Hello Karthik,
Thanks for the world-class material and your efforts in educating the investor community.
I do have the following questions about support and resistance
1)Do we completely abstain from the trade if a valid ***candlestick pattern*** is formed but the pattern is quite above the immediate support level?
2)In terms of percentage, what is the acceptable difference between the closing price of a stock and its immediate support level?
3)What percentage variation in price between the low and high of a stock can be termed as \”range-bound\”?
4)Can the pivot point(the black line on the Kite charts or the point which lies midway between support and resistance points) be also considered a support level for a falling stock?
5)what is the significance of the pivot point?
Thanks,
Kiran Hegde
1) Take it as it goes 🙂 I mean, if the overall market is in a frenzy and you see bullishness around, take the trade, it may be worth the risk. If there is bearishness, avoid.
2) Closer the better. I\’d avoid its more than say 5-8%. Also depends on your risk-taking abilities, which I assume is also dependent on your capital.
3) Range bound situations demand the stock to trade within a price band for few days. So you need to have a longer time frame in perspective
4) Nope
5) I personally don\’t use it. I prefer the manual way of plotting S&R
Good evening Sir, I hope you\’re doing good. I\’ve a few queries:
(i) How to identify 3 price action zones for plotting Support & Resistance when the stock is trading near it\’s all time high like Wipro these days? I\’ve attached its chart herein: https://drive.google.com/file/d/1na0y8-Ee2Rksm6cPDT1r4bwCWiwtOCig/view?usp=sharing
Can the price around the encircled area be considered as support in this case because the price is sticky?
(ii) Can Pivot Points work as an effective Support and Resistance?
(iii) If we intend to square off our trades the same day what time frame should we use, EOD data or 15 minute candlesticks?
1) You will have to look at a trend like as opposed to the regular S&R lines
2) I\’d any day prefer the regular S&R calculator
3) I\’d suggest EOD
Thank you very much for putting the wonderful knowledge base for us
I can see there are wonderful videos are made for each topic from Zerodha (especially by Karthik Rangappa) ,
Please can you tag or include videos to make it more useful for learning the things
Not sure which videos you are referring to, we don\’t have many at this point 🙂
Hello Karthik,
I understand I am kicking in quite late & thanks for sharing the immense knowledge. I wanted to understand one thing w.r.t S&R.
The S&R changes for 15m chart & a days chart. I am looking for intraday trading. What should I consider? the S&R for 15m chart or day chart.
Please suggest
BR// Veera
I\’d suggest the EOD chart 🙂
sir, I have a few questions??
1. while forming support and resistance line, can we ignore extraordinary events in the chart of equity for eg. lockdown impact on the market?
2. is it necessary that S&R line should be horizontal only? in the case of IPCA LABS, the chart is in purely upwards and I can\’t form any straight line??
1) You need to include these points as well, Chirag. All these different points are what makes the market 🙂
2) Yes, it can be a trend line.
I understand the concept of Support and resistance. But when I checked for that in Zerodha I got Support 1, Support 2, and Support 3. Also the same with resistance. Can I know why there are 3 support and 3 resistance?
A screenshot of the image is given in the link: https://cloud.degoo.com/share/R355ka4OoL0hNf
This is an indicator called \’Pivot Points\’, which calculates the support and resistance based on the recent price action. The system gives you 3 support and resistance levels as an output. You can use this or if you are like me, then calculate the system S&R manually.
Hi Kartik SIr,
Good evening.
How to do paper trading in zerodha for equities. I already have account in zerodha but i don\’t see any option for paper trading.
Regards
Ishwar
Unfortunately, this is not available for now.
Hi Kartik,
Thank you for answering all my queries. I try to ask as less question as possible by going through comment section. Still i have have some questions.
CMP = CURRENT MARKET PRICE
S = Support
R = RESISTANCE
(1) What should be the ideal range of SUPPORT from CMP ? I mean what should be the value of (S-CMP)*100/CMP ?
(2) What should be the ideal range of RESISTANCE from CMP ? I mean what should be the value of (R-CMP)*100/CMP ?
(3) Should we always prefer the nearest support and resistance ? I mean support and resistance value closer to CMP.
Regards
Ishwar
1) Less than 5%
2) Not more than 5%
3) Yes, but this depends on the stock and its volatility.
Hi Kartik,
Have a nice week ahead. Thank you for kind help and patience.
(1) Kindly have a look at the chart of Maruti. I have taken EOD Candles from June/2019 till Sep/2020 and marked Support and Resistance. Let me know if its correct or not ?
https://drive.google.com/file/d/1mDiy-3prWSSq-KjIe-5wl5TDzGsP_a6i/view?usp=sharing
(2) For Maruti only i have identified S&R for intraday. Let me know if its right or wrong ?
https://drive.google.com/file/d/1ZV6J-vBysPw8-k7xz8dIxoc3d-b_TeJl/view?usp=sharing
Thanks for your help
Regards
Ishwar
1) That seems alright to me Ishwar
2) Yup, looks alright again.
which time frame is best to plot support and resistance for intraday trader
I\’d say 15 minutes chart with at least 3-4 days as look back period.
Hi Kartik,
Good afternoon, I have two questions :-
(1) Can we consider a simple uptrend also as a trend ? For example market is bullish for last 3 days so for fourth day also it will be bullish or we should always look for trend reversal ?
(2) Is it possible that someone will short a share but don\’t find buyer by EOD. How its possible that each day each time we have equal number of buyers and sellers ? Isn\’t it sound like a scam ?
1) 3 days is too short a time frame to establish a trend. But you use 3 days intraday data to identify intraday micro trends
2) Possible. No, the number of buyers and sellers may vary, but what should match is the number of shares sold and bought. Assume you goto a supermarket and buy 10kgs of onions and assume you are the only guy buying. So at the end of the day, 10kgs of onion was sold by the supermarket and 10 kgs were bought by you. Does that sound like a scam?
Sir I\’m beginner in chart reading.i have full knowledge theoritically..but practicality I\’m finding difficulty in plotting price action zones in chart to identify support and resistance.i know full logic behind support and resistance but still finding it difficulty in reading some charts and also should I watch more charts for getting clarity about charts for plotting..please help me in these..tell simple methods to plot in charts…
The more you practise, the better you get at it. There is no other way around this. So keep looking at more charts and try to plot as many S&R lines as possible 🙂
Sir,
I am little confused in pivot points and S&R.
Can i use pivot points S&R instead of using the S&R terms mentioned above?
And also sir I do positional trading..in which time frame we should draw horizontal line for support and resistance like weekly or daily chart ..and also in positional trade I should take entry in which time frame..
YEs, positional is good. I\’d suggest you look at EOD charts.
Ok sir but in nifty50 also ,how can we know that in which stock there is a movement if I trade using pure technical analysis.like we have to see any volume or any other candle stick patterns or indicators or tools for selection of stocks…is there any website that tell us that,there is a movement in some of stocks..so we can pick stocks from particular category..please let me know..
You will have to look through each of these stocks individually on a daily basis and get a sense of where the action is developing. By doing so you will improve your chart reading skills as well.
Sir can u please let me know how to select stocks for positional trading as there are thousands of stocks available in stock market and we cannot dig every stock to meet our checklist for trading and is there any method or creteria for selection of stocks..please let me know sir..
I\’d suggest you start by tracking the Nifty 50 set of stocks until you get a hang of it
Sir,
How can i draw S&R point in sideways trend?
Like, if there is the sideways trend since last 3-6, 12-18 months then how can i draw?
You\’ll have to set up a channel, which is basically 2 trend lines across the stock prices. This will help you identify the S&R levels.
Could you please say what is the best timeframe to analyze techinacl analysis i.e candle stick patters and charts in intraday trading?
I\’d say EOD 🙂
Sir,
How can i be perfect in drawing of S&R?
Practise makes a human perfect 🙂
Pls explain how to use the Support & Resistance in Zerodha chart.
Like the way I\’ve explained in this chapter.
I see.
Btw I love the content, it\’s really well written, minor mistakes here and there that a proof reader could catch.
Thanks, Atul. Yes, I\’m aware of the typos/grammar and other mistakes. I hope I can fix theme someday 🙂
Continuing on the last question since I can\’t edit it.
The 3rd point on S&R construction : Align price points together and draw a line such that they are on the same price.
How rigid is that rule? Aren\’t there cases where support could be a slanted line? Like in say case of an equity which has been consistently growing with intermittent market corrections? I\’m asking because I\’ve seen some articles/strategies on TradingView where people have drawn a non-horizontal line. I\’ve not yet looked elsewhere to validate this, but the slanted line makes sense in those cases to me. What do you think?
Nothing in TA is set in stone, so feel free to get a little flexible with this.
\”If the objective is to identify short term S&R load at least 3-6 months of data points. If you want to identify long term S&R, load at least 12 – 18 months of data points\”
Can you clarify the long term and short term periods?
For example if let\’s say I\’m day trading in a cryptocurrencies with my candlesticks at 5 min intervals, how many data points should I squeeze in to find the support and resistance?
Also, let\’s say there are two supports that I can spot in the graph, which one do I chose? What if both of these have roughly the same amount of price action points.
If you are looking at 5mins, then at least 2-3 days of data you need to look at. Between the two, choose the one which is time better time tested.
Sr, You are doing such a great job….
You know what i like most—that you make understand us such a complicated topic in the most easiest way……
I am the the beginner write now just completed my 12th this year and waana to be a successful trader and investor and your modules help me a lot…..
Today is the teachers day sr…..and i wish you a very happy teachers day…..
Thankuuuu!
Thanks, Tushar! All your wishes means a lot to me. Happy reading 🙂
how to draw trend lines , also what is the lookback period for drawing trend lines
for intraday-15 min
positional-1hr,1 day
long term – weekly
thank you so much love the modules so far
Intraday – 15mins, for at least 5-8 trading sessions
Positional – 1 day, at least 2 weeks of data
Long term – at least 1 year or more.
Sir
how many days look back period we have to consider while calculating stoploss!!
for Intra day trading, should we plot stoploss based on day candels or hours candels?
if im considering 3 hours candels how much back should i consider
The SL is predetermined with the CS pattern right? For intraday, you can look at both actually. I prefer to look at EOD candles and make my trade setup.
Hey Karthik,
Thank you so much for all your support and answering my previous queries. I have some more queries after going through current chapter which are as follows :
1. How we can calculate the S&R automatically by calculating the pivot levels ? Request you to explain me in detail.
2. What is breakout and breakdown ?
3. What is stock Beta and standard deviation to measure fast/slow moving stocks ? I came to know in one of comment about these words. Request you to explain me these and how we can apply them.
4. Suppose any stock in upward trend, is close to reach at R3.
RS (14) is 74 and volume is above 10 days moving avg.
Current rate is above 50 days EMA.
9 days EMA is above 21 days EMA. Should we go long on such stock ?
5. I usually take low of CS pattern as SL in long trade. As you have suggested that support should coincide with SL, what should be permitted variation between low of CS pattern and support level for SL ?
6. What is concept of ascending triangles ?
7. I go long on Bullish Marubuzo pattern. My buy price is 100. SL which is low of pattern is 95. R1 is 103, R2 is 110. What should be my target for swing trade 103 or 110 ?
8. I should trail SL on closing basis or during active session ?
Sorry I am bothering you with so many queries. Your content and replies are really helping me in upgrading my knowledge and trading skills.
Requesting your valuable guidance as always.
Regards.
1) I\’d suggest you look at this chapter for CPR indicator which gives your S&R values – https://zerodha.com/varsity/chapter/the-central-pivot-range/
2) A strong price movement upwards of a consolidation level is breakout, downward of the consolidation level is breakdown
3) Have explained in the futures module, please check that
4) The primary trigger for initiating a trade should stem from candlestick pattern, other factors are secondary
5) The closer the low matches the support, the better
6) It is a dow pattern, wherein the consolidation of price in a channel, tapers down as the price declines. Usually traders expect a breakout
7) Depends on your holding capacity
8) SL trail should be on a active basis.
Good luck and happy reading!
Sir, what does this means that the price is sticky?
The stock price trades around the same price. Thats what I mean by sticky.
But, what if I cannot find S & R value since for intraday I don\’t find S&R line always through which I can decide to exit. So any suggestion what should be the exit mechanism for intraday?
For instance if I plan to short DLF at 173.5, so I need to find a support line to exit the trade and in this case I got 170 but what if I got 165 or 160 as support line? Then exit should be limit order at 165/160 or square off at day end?
In that case, you need to have a % target. For example, it could be a 0.5% or 1% upmove from your entry price.
Hello,
Drawing S & R is a bit tricky in some cases, especially for intraday. Read some of your comments i.e. considering 10 days look back period with 15 min frequency is ideal for intraday. I have drawn S & R lines for Dabur stock and want to confirm with you, is there anyway to upload the picture here? I don\’t see any attachment icon to upload.
If uploading is not possible then below are the details I got after drawing 2 lines.
Lookup back period: 17 Aug to 27 Aug 2020
Frequency: 15 min
CMP: 493.5
Support: 492.2
Resistance: 495.9
Can you confirm if this is correct?
Shashank, you can upload on GDrive and share the link. Btw, from the looks of it, this probably seems ok. I\’m saying this becuase its close to 500, a psychological number, which is where the S&R usually lies.
my question is regarding long term investment. can\’t we copy rakesh jhunjhunwala\’s portfolio?.because they know better about any company than us.so that we don\’t nead to learn fundamental analysis.i mean we dont have to do our own reaserch.
If only life was that simple 🙂
While you can copy his portfolio, what is impossible to copy is his (or anyone else\’s) conviction and capital.
great work, karthik.may god bless you.
Happy learning!
Hi Karthik,
First of all I appreciate you for the quick response you have given…
I have one more question if i plot S&R on EOD (DAILY TIME FRAME) then at what time frame should i use to enter & exit the trade.
Thanks again in advance….
If you are using EOD, then perhaps continue to use EOD for identifying the entry-exit. However, if you are trading intraday, then maybe 15 mins to identify entry and exit with S&R from EOD works.
Hi Kartik,
I have read many comments regarding how to find S&R on intraday someone said on EOD basis some said on 15 min basis and some said on 5 min basis so I am little confused here. could you please tell me can i find S&R on 15 min basis and for period of 2 weeks or EOD data will be best for 3 to 6 months I hope you understand my question?please help I am new to this…thanks in advance
Yes, you can. In my opinion, it is best to plot this on EOD basis.
according to support and resis.
formulas.
they r not working properly..
Thank you so much for this content!!
Just a quick question, How should we initiate our trades based on news (like quarterly results) ??
Depends on how well you can decipher the news.
Hi,
I am not getting weekly or monthly time frame in pivot. Please help
Please check this – https://zerodha.com/varsity/chapter/the-central-pivot-range/
How to plot resistance & support for intraday?please help
The same way as you\’d for an EOD data. The same logic and thought process applies.
Hi Sir,
First of all thanks a lot for the information you have provided in this article\’s. It\’s a pur gold mine for beginners like me.
Sir, I have 2 questions
1. How we will know that there is a support near the stop loss
2. How and from where we can get this kind of candlesticks for the last 3-6 months
Thanks
Kinkar
1) You will have to compare prices
2) You can check on Kite for this.
Because of the pandemic there was big fall in stock prices after march end. And now at August some stocks have surged to half of pre COVID levels and some have attaines the pre COVID price also. I am a new trader who gained all my knowledge on trading only from zerodha. While I am doing swing trading on NIFTY 50 stocks as advised by you I find it difficult to allign three price action points at a same price because for past 5 months the stocks have been trading at a new zone entirely. I am able to identify either a support or resistance but not both in some stocks. Going by your checklist we have to initiate the trade only if SL is around support and vice versa for short trade. What to do under such situations? Should I just proceed by fixing target ignoring the support after identifying a pattern and volumes confirm?
These checklists points are guiding notes, but you may not always get a trading situation where everything has aligned. So try and ensure that as many checklist points are working in your favour if not all.
Dear Sir,
I have taken 2 trades. I have a doubt in both of them. So could you help me with that?
1. I went long after seeing a clear bullish engulfing pattern. The volumes were also high in the second i.e. green candle. But the support and resistance are not any near to the CMP. I looked at both 1 and 2 years chart. The price of the share is gradually falling with brief ups in between. Hence I could not plot my target and stop loss on the chart. So should I exit from the trade as there I don\’t know what target should I fix or is there any other criteria on which I can fix my target because the candlestick pattern was clear and volumes were high
2. I have taken another trade on same pattern i.e. bullish engulfing. In this, I can identify and fix my target and stop loss. But it\’s been 8 trading sessions after the trade and the share is still moving sideways. There are no dojis in this sideways movement, just normal candles. I know you taught us that we should not do anything until we either achieve the target or hit stop loss but I am bearing an opportunity cost. How long should I wait in this sideways market?
1) SL is not an issue here since its predefined. In the absence of a clear target, you can choose to have a generic % target. For example a 5% move. Make sure these are realistic targets.
2) Well as long as your capital permits. But yes, I do get your point. Sometimes these things can take forever to pan out, in such cases, you can also have a time-based SL. Meaning you exit the trade at say a maximum of 10 days post-trade initiation.
sir,reliance has never got 1900 RS share price so adding 2-3 years is not helping,But if a take the chart of 5-10 mins then it is showing some price Point but the gap between them is not even 2 weeks.
Thats right, you can shrink timelines also – 1 hour or weekly charts and see if you find the S&R.
Hi sir,
I hope you are doing well!
Reliance stock price today is 2070 Rs,How to Figure out the Support level because i am not able to locate the \”3 prize action zones\” on the Chart.
Analysts are saying that Support will be at 1900 Rs,which techniques they are using ?
Thankyou
Try to load more data points – at least 2-3 years.
Hello Kartik,
I am enjoying the learning, thank you so much for your replies. I have one question, I have entered into cash long term trade without using stop loss by then I don\’t have knowledge of this, is there any option to put stop loss now to ensure the profit?
You can enter the stoploss via GTT. Check this – https://zerodha.com/z-connect/tradezerodha/kite/introducing-gtt-good-till-triggered-orders
Very useful thank you.
Happy reading!
Hi Sir
Really your content is very easy to understand. I am very very thankful 🙏 to you for your great content. It helps me a lot in beginning of trading.
Happy learning, Viswas.
In order to identify sharp reversals, beside using candles can I also use line chart?
Yes, you can, but I guess it misses key inputs, while it retains a generic idea.
Ambuja Cement chart showing price action at 201 and 214.
At both these lines, price reversal happened at some point in time. 214 starting from left, first and second price actions shows bearish reversal and third one is a bullish reversal. So same line can be a support and resistance depending on where the Current market price is. It is not important that the level should have always acted as a support or always a resistance in the past price actions?
Regards
Not really, the same line can act as both based on where the current market price is.
Hi Karthik,
Thanks you for posting such great stuff on TA. I have a doubt on the chart timeframe. I usually prefer trading Intraday, so which chart timeframe should I use to mark the Support and Resistance. Also, I have tried the daily chart but post COVID most of the stocks are trading at very low price level, so its difficult to identify more than 3 price action zones.
Pradeep, the best way is to use EOD for long term S&R and say 30mins or 1Hr candles for short term S&R.
Sir, I\’m really confused at drawing S&R for intraday. As you said, I was drawing at daily timeframe and with the lookback period of six months. But, in some of the stocks, due to lack of three price points, S&R cannot be created. When I started drawing at 15 min chart with lookback period of 10 days, it became very cluster.
Also, what I was trying to do is to create S&R on day candle and trade at 15 min candle. But, the problem is S&R is a area not just a line. So, on daily timeframe it could be an area of 1-2 %. Now, stock moves 1-3% on intraday basis. So, in intraday, it cannot be a clear cut S&R.
So, please suggest me a timeframe and lookback period on which I can create reliable S&R for intraday only.
Hemant, the best way is to use EOD for long term S&R and say 30mins or 1Hr candles for short term S&R. Yes, intraday will be cluttered, no workaround for this 🙁
No, I have to draw support and resistance for intraday. You said to use daily timeframe and look back of 3-6 months . But, sometimes there are not price points in 6 months, I need to go beyond that. So, should I draw taking lookback period greater than 6 months ? Will that be a reliable S&R for intraday ?
Ah, for intraday, stick to short time frames. Max 6 on an EOD basis for long term trend and you can load 15 minutes chart for last 4-5 trading sessions.
Can we draw support and resistance by taking price points of 5 years or 10 years back ? is it a reliable support and resistance ?
Yes, you can especially to identify long term S&R levels.
Sir, can we say that where market move sideways, it is a price action zone for constructing support or resistance level?
Yes, thats right Amit.
Hi Karthik,
1) Suppose I bought some \”X\” share on the day of candle stick(bullish) formation and set stop loss as lower low of the pattern and target depending upon nearest resistance. What if after few days when my target is still not reached and i see another strong bearish pattern on the same company\’s chart. What should i do? Do i need to exit my position or stay till my trade hit the target?
2) Is there any plan of adding another chapter for drawing S&R based on trend lines?
The ideal thing to do is to wait until the target or SL is hit. However, based on your reading of the market, you can improvise your strategy. Nothing wrong with that. Yes, I do intend to add a chapter on trend lines, hopefully sometime soon.
How do you find resistance for a stock that has reached a new all time high?According to the above chapter that resistance must be greater than current market price,so if the price of stock hits a new high everyday and if a person calculates the resistance as above mentioned then it won\’t be greater than current market price. How do we solve such a contradiction?
In such a case you will have to use a trendline, Sanjay. Unfortunately, I\’ve not explained the trendlines in this module, maybe I will one of these days.
Thank you for the previous response. I guessing owing to the drastic dip in the prices for almost every share (due to COVID) it is becoming a bit hard to draw the S&R lines. Any suggestions to alleviate this would be helpful?
Rohit, not really, stocks have bounced. So I\’m guessing its not that hard now 🙂
i want to show you the picture of the chart? how?
Please upload on G drive or something like that and share the URL.
why pivot points are not showing for today on kite?
Are you sure? No one else seems to have this issue.
1. Do support & resistance lines have to parallel to the x-axis? Can they be angular also? I ask because I have seen users on trading view form angular S&R lines (atleast they seemed to be S&R lines)
2. In a previous doubt of mine, you had suggested to use pivot points to identify S&R. While using them on tradingview I observed the application identifies multiple S&R points, so should I still be going ahead to mark my own S&R lines?
1) Yes, they can especially when the stocks are trending
2) I\’d prefer manual way to plot the S&R anyway 🙂
if the stock price crosses the R1 level in pivot points, then will R1 be the support level for next resistance R2?
Yes, thats right.
sir, while trading with the perspective of intraday which chart duration must be setup to plot support and resistence level?
Same question regarding trading perspective for 1 week or month?
Which time frame would be better to draw support and resistance for intraday, 15mins candle or 1 day candle ?
1-day candles are better.
Thank you for the prompt response. As I am very new at this, I wanted to know if there is a way to check if my S&R plots are correct?
The easiest way is to plot the pivot points and check if they match. 100% match is impossible but anything more than 50% should be good enough to begin with.
Can there be multiple resistance and support lines drawn for the time frame of data? I am trying to plot resistance lines for a stock and getting 2 lines when looking 18-20 months data. The 1st one is 100pts above the CMP while the 2nd is about 30pts above.
Yes Rohit, there can be multiple support and resistance point for a given time frame, this is quite common.
how to use pivot points properly?
Pivot points act as Support and Resistance levels. So instead of you identifying the S&R points, you can simply plot the PP, and it will readily give you 3 support and 3 resistance levels.
hi,
lets suppose there are total of 3 indicators for resistance, out of which 2 are spaced with 2 weeks and 3rd indicator is 4 weeks apart. can I consider it as good resistance indicator. please explain.
Yes, I\’d prefer the 3rd compared to the other 2.
Sir in the example of Ambuja cement qhere the CMP was 204 S&R established at 201 and 214 respectively. How can one get to know that whether he should go long or short? Is it by checking the candleatick pattern. Asking this for intraday and swing trading. Also sir one more thing what previous data should one use if he wants to trade intraday??
THANK YOU.
Yes, the decision to long or short depends on your market view. For intraday, I\’d suggest you use at least 5-6 days on day by looking at the 15mins chart.
Hi karthik,
I understood squzzling the to identify thr S&R like for Long-term 12-18 months and short-term 3-6 month.
Do you think taking time frame of dayily for long term and 15 min for Short term will be good or other time frame.?
Thanks a lot for your valuable article. – sagar
Sagar, you can do with EOD chart as well for intraday. This is up to you. However, most ppl prefer 10 or 15 minutes across 5-6 trading sessions.
got it ! thanks.
Nice, happy reading 🙂
Hi Karthik,
Beautifully explained.
Although after having a look at the charts, my only confusion was how does one recognise the optimum price level, as we will find sticky points, reversal trends in line quite a few times.
So following the history will help, or some other parameter can also be used to identify the trend ?
Thum rule – if there are two price action zones, one has to consider the price point at which there are more number of price action. Discard the ones with fewer ones.
Sir, let say I\’m bullish on a stock and entered trade with a SL and target, and the price is moving in favour to me, but if in one day if I encountered a Bearish Marubozu, what should I do, either stick to my plan or get out the position.
You need to stick to the plan, Mano. Wait till SL or Target is hit 🙂
Pivots in different timeframe are different.
For intraday how important is pivot points in 15 min,30 min & hourly . As all three have different pivots point should all these three timeframe pivots should be considered while trading.
No, I\’d suggest you stick to the timeframe you actually intend to trade and follow that. No point loading other time frames.
Hi,
If I set the stop loss at the high then my stock will automatically be sold at that price right?
So, what is the use of setting the target price if my stock has already been sold at the stop loss price?
It will get sold only is it hits the high point right? Otherwise, it will stay as a pending order.
Thank you so much for the reply sir.
I do have a few more doubts sir, if you don\’t mind.
1) Can you please explain as to why classic or CPR?
2) What are your views on Renko as opposed to candlestick charts. (I have noticed that its easier to spot the double tops ,double bottoms, etc in Renko. Especially while coding.)
3) I am more inclined to trade currencies. Should i start with stock trading and then graduate myself to them. Or start small there and then grow slowly there itself.
Yes sir. Will keep the expectations realistic through backtesting in and out of sample and still know that things can still go south. Risking only 1% per trade. Following your RRR guidelines. And always will keep learning sir. Any further tips appreciated.
Thank you so much. Your reply means a lot. 🙂
1) Classic is a visual concept, requires you to pay attention to all aspects of charts, CPR is a shade better to classic in my opinion 🙂
2) Not used Renko, cannot comment
3) Not necessary, stick to what you are comfortable with
Happy learning!
First of all, amazing job with varsity. Varsity played an important role in getting me interested and motivated to pursue trading. Loved it. Recommended it to people. And they loved it too. I am an ambitious 20 year old. As of now i am just a beginner. But would never forget Varsity and you Karthik Sir as from where i started my journey as i progress in this field.
I have a few doubts though.
1) Which would be your advised support and resistance level for intraday to use amongst traditional, Fibonacci, Woodie, Classic,
Demark,Camarilla, or any other.(These are the ones i found on Kite.)
I want to use one of these as i need it for my algorithm. I am a Kite connect user. And manually spotting S&R is not an option.
2) What are your views on S&R from Gann Square of 9?
3) Idk if it i should post this doubt here on in the volumes chapter as it would be useful for others to look it up. Lmk for the future. So in spotting volumes. Is simple spike in volume from average for a trade sufficient, or are indicators like OBV or AD line better, in your experience? In which case to use simple spike, OBV and AD.
4)I have been coding as many indicators as i can, so as to improve my algorithm. So my question. How much is too much?
One side of me says that why not add more. The more the better. It will just make the algorithm better. Its better to get a confirmation from Williams %R along with RSI and stoch than just one right? And use your kelly\’s criterion to size as for how many indicators confirm the trade. Other side says to keep it simple. Your views?
5) I didnt find anything on double tops, flags, penants, etc in your modules of TA? Although i have spotted them working well in my 2 minutes of experience 🙂 . Your experienced thoughts?
6) Any tips for a beginner?
PS- Sorry for bombarding you with all these questions. I have just started in this field not even a month ago and finding it very interesting and exciting, thanks to you. I am very curious and trying to read as much as i can. I have read many theories but wanted some real time experienced views and have no one experienced but this community.
Thanks in advance. 🙂
Happy to note that Agrim. Wishing you all the best.
1) Classic and the central pivot range (CPR will be available shortly)
2) I\’ve not used these, so cannot comment
3) I prefer looking at it from the average perspective, so yeah, a simple spike works
4) You\’ll know when its getting too much, trust your gut
5) Have included these in the DOW theory chapter
6) Set realistic return expectations from markets, don\’t expect to double your money every 15 days 🙂
Goodluck!
What is pivot point? is it already taught? or it will be taught in future chapter? can you please provide link
Will add a new chapter to this module on central pivot range, where I\’ll discuss the pivot lines.
I’m new to trading….
I would like to identify S & R for few scrips.
Now the present Covid-19 situation stock prices have come down approximately 30 to 40%.
Majority of scrip values are now on rising up direction.
If I have to think for swing trades & fix Resistance line, how it’s possible to draw Resistance , in this market situation ?
Load at least 1 year of data, you will get the resistance levels.
i am using pivot points for support and resistance, then which time frame should i use for EOD charts(btst trades) – auto,weekly,monthly or yearly
For EOD it is monthly. Select auto if you are not sure.
Sir in one of ur comments u have mentioned that in case of swing trading if ur stop loss is 72 and price closes around 70, then next day u will exit the trade. So in case of swing trade do we have to close the trade based on closing price if our stop loss gets breached. Won\’t in such cases our losses will be a bit more as compared to what decided earlier?
This is a tricky decision to make, Siddharth. Many times the stock hits the SL intraday and bounces back. Given this, it makes sense to keep an SL level in mind and close the trade at the close, but then, as you mentioned, this can result in a higher loss.
The answer to this depends on your capital, you need to figure if your capital permits you to take this chance.
can we use pivot points for support and resistance?
You can, but it is not really a personal favourite.
Dr.reddy close at days high 4060(above R3)
Today I executed an intraday trade on Dr.Reddy .
At market hour in technical chart resistance 3 level shown at price of 4012,but after market hour it is changed and shown to 3979
Can you explain this ,why this happened?
The price must have dropped no?
Today I saw, zerodha technical chart appearance changed and looking good compared to previous .
But
when I calculate daily pivot levels manually(based on prev. day open,close,high and low),its get mismatch with zerodha technical pivot levels(specially Support 3 and resistance 3)
I know ,it is not necessary to calculate manually.It is done by system automatically.
But ,If levels will mismatched from traditional pivots,is it not affect my trade?
Charts are undergoing an update, request you to check this today.
Ok, Thanks
Hi,
Thanks for replying, so how can i get this, is there any other sources?
Try Tradingview pro plus version?
Hi,
Can you suggest any Accumulation Distribution course and its importants if available on online
Thanks
I\’m not sure, will look for this online, Prashant.
Hi Karthik,
I got 2 doubts-
(i) – For making support and resistance line its mentioned for long term one can use appx 12 months data. But since downfall, prices are not aligning in zones. What do i do in such a condition.
(ii) – Also to check prior trend of a particular candle. What should be timeframe- for eg if I consider 1 month then its downtrend but since last week its going upwards only.
Thanks!
1) Try loading more data points, 18-24 months.
2) Yeah, if you are looking at monthly charts, then at least a week\’s data.
Thanks Karthik
Hi Karthik,
I have a couple of doubts. please clarify the same
1. A target price is the price that a buyer or seller would like to buy/sell his stock in the market. Is it correct?
2. Will S&R affect the bid/ask price which is shown in the market watch section?
Thanks
1) Yes, target price is the price at which you\’d like to book profits.
2) Not directly, but traders will keep an eye for these levels
Hello Karthik,
Market situation like this, where some of the stocks who have downgraded to there 3-4 years low. In such scenarios will it be advisable to find the S&R based on pattern before 3-4 years?
Also, some stocks are at their 52 week high. So, in this case hw to determine resistance level?
You may find it a challenge to plot S&R for stocks which are at all-time high. At 52 week high, it should still be possible. Yeah, please take the 3-4 years data to plot S&R.
What is the procedure to calculate the number of trading sessions required to materialize the trade.
It is hard to have time targets, Chirag. You will have to work with the prices.
Hi Karthik,
Is there any effective way of drawing a trend line, like the data points to be connected as in S&R? Also, for a day trader and short term position trader, which time frame is considered to be best for drawing the trend line? . Thank you.
Regards
Rajesh
I find the act of placing a simple horizontal line to connect the data points most effective. I would prefer EOD charts.
Hi Karthik,
Can you please suggest what should be the Target Price / Resistance Level of a Bullish Uptrend stock , which is also trading close to its highest stock price (throughout its entire history)?
Sharan, it depends on a case by case basis. Cant fix one number for all situations 🙂
Sir, please explain the process. What I have to do to get this?
Which process, Chirag?
How can I know the number of trading sessions required to materialize the Trade?
Depends on what you are trying to do. If you are day trading, then use at least the last 5-10 day\’s data.
Could you please advise if price is moving swiftly and together with 3 months the price action will not be in the same level and in those cases how do we determine the support and resistance. Please adivse.
The other example is NIFTY now has fallen due to current uncertainty and how do we determine the support and resistance considering the 3 month either for Intraday or BTST trades.
Please advise.. I wanted to tell you the article written is very lucid manner and really great for your work.
You will have to load a higher number of candles and look at a larger data set.
Dear Sir,
I m attaching a photo here could you tell me support and resistance
https://kite.zerodha.com/chart/web/ciq/NSE/RELIANCE/738561
Support is around 1100 n Resistance around 1323
Am I correct?
Unable to open this, but I\’m not sure if I can look at individual charts and comment 🙂
Sir can you explain,
1. Meaning of :
* price hesitating to move up further
after a brief up move
* sharp price reversal.
2. How long can we use the same S and R?
Hmm, have explained that in the chapter itself, Aditya.
Hi Karthik,
Big fan of yours. I have one doubt regarding the time Frames.
Suppose I want to do Positional Trades with Tf of 2-3 days . So what should be the TF of my chart.
Now I want to do Positional Trades with TF of 2 weeks – 1 months. So what should be the TF of my Chart.
Manish, you can use the EOD charts for this. This is what I personally follow as well.
Hello sir
I read the whole module. Thanks for such an easy explanation. I had a few doubts though.
1) For positional trading, suppose i was able to find the support and resistance values then according to my understanding till now for a long trade we should place our stoploss just below the support line because the price usually tests the support so if we place our stoploss just above the support it may be possible our stoploss gets triggered and the price falls to the support line and retraces again. So, in that case, we suffered losses and went out of the trade even though our support price was tested and it still held. So stoploss below the support is right? And similar logic for the target also. So we should place our target just below the resistance level?
2) Do we actually place stoploss and targets while we place short/long trades or do we have to manually exit our positions? Actually i am very new to trading hence asking this.
3) Since in recent times the stocks fell nearly 40% therefore when i was trying to find reliable support and resistances for positional trading using the last 6 months data i was not able to find anything more than 1 price action zone near today\’s trading price. Please suggest what to do in such cases. Shall we place targets randomly in such a scenario?
1) Yes, that\’s correct
2) You can actually place these in your system and leave it at that. However, experienced and disciplined traders execute the trade on the fly.
3) Yes, these situations where you cannot find either the support or resistance. These are times when you look at multi-year time frames and look for price action zone. Also, do remember, when you have a fundamental situation at play, technicals does not matter or hold.
awesome sir i understood easily thanks for the your valuable information
Happy reading, Vijay 🙂
Hello sir
Went through various nifty50 companies and found that during these days (lockdown period) the price is so much low that we are not getting similar \”price action zone\” even after looking back 5 year data. How to plot S&R in such cases ?
And if I reduce the time period to few month than the market is much volatile/uncertain the plotting with ref to that would not be beneficial. Please suggest
Thank you.
Try changing it to weekly charts from EOD, Anup. Hopefully, this will give you a reference price point.
Namaste….
Query: suppose a bullish candlestick pattern was formed in certain stock. candle was long candle breaking resistance level and closed above resistance.
after break out resistance become support.
my question is which stoploss should we consider the low of candlestick pattern which is far below new support or we avoid the trade?
Very tricky depends on the extent of the breakout. If it is broken out and managed to stay just above the resistance, then look for the pattern low. Else do keep the resistance level in perspective.
Hi sir
Difficult things explained in detail & in simple way.
Hats off to u
Happy reading!
Hi Karthik!
Considering the current situation due to COVID-19, is Technical Analysis still reliable for trading? Considering I am a beginner, should I refrain from trading during this period?
Yes, its good to know. You can start with paper trading until you get comfortable with trading.
Dear Sir,
Greetings of the day!!!
I am enjoying reading the modules.
Sir, In case I get three SR levels in that scenario SR price band would be large, then how do I select the support and resistance?
Thanking you in advance.
Look for the price confirming the price action zone, Saurabh.
Dear kartik.,
Kudos man,
Great effort to educate people and great compilations. I could see your hardwork, passion in all this great work. Leterally I am telling I have become your FAN.
One word – Thanks a lot.
Adi.
Thanks for the kind words, Adi 🙂
In the current scenario when Market has seen new low, I am unable to find SR lines. Any guidance on what principles to use. Do I extend beyond last 3-6 months for checking double/triple bottoms/peaks? Thanks
Yes, you will have to look at it from at least a year\’s perspective.
Day wise data I have to select?
Yup, thats right.
As you mentioned in S&R drawing for short term trade – 3 to 6 mth data point and long term trade – 12 to 18 mths data point I have to load, but can you please tell me in that case which time frame I have to select (5,15,30 Mini or day)?
I\’d suggest you look at the EOD data for this.
Sir should the support and resistance be parallel only because u have discussed only parallel support and resistance in the module,I have seen so many traders use diagonal support and resistance also.
Not really, it can take any slope based on the price movement.
I am confused on the difference between learn app and varsity,and how to best use these resources since both are endorsed by zerodha.
Also is the pi desktop software still relevant given the rapid advances made by kite?
LearnApp is a separate company, they focus on video lessons on many topics including markets. Varsity belongs to Zerodha, we focus on notes and articles related to only the capital markets.
Hi Karthik,
I would like to know if Zerodha/ you offer any class room training on trading; though the lessons in Varsity are simple and easy but being a person from life science background I would prefer attending class room training.
Thanks,
Rajesh
Unfortunately no classroom training, Rajesh.
Hi Mr Karthik
confused between supply demand and ask bid.
can u please tell where is it explained in the modules
thanks.
Supply-demand indicates the number of people willing to buy and sell. Supply higher than demand indicates sellers and buyers if otherwise. Bi-Ask indicates the price at which they want to transact in.
Hi
I\’m not getting how exactly the resistance and support lines are drawn and how exactly we determine the current trend on basis of prior Resistance and support line, could you please explain me on this.
Thanks for the help!
Bharath
Bharath, this entire chapter is dedicated to that, I\’d suggest you re-read this chapter and also run through the comments. Hopefully, that will clear up your doubts. Thanks.
Thank you Karthik. how do we check volumes as suggested by you under volumes Chapter? do we need to do that manually or pi has an option?
Under indicators, you will have to select volumes and load it.
Hello Karthik,
Firstly, I would like to thank you for explaining the TA in such a simple and lucid manner.As you mentioned in one of the comments above, I am not a great fan of using pivot points to calculate SR. However, when i was following your chapter on S&R, explanation made sense but I am facing difficulty while plotting them.
I am unable to post the chart here for Bajaj Auto for 07th Jan 2020.EOD chart with 2 years lookback. I am getting below values for S & R
Spot: 3039
Stop Loss(Support):2456
Resistance :3192.
These values looks very high or low. Does this makes sense?
Also, for volumes, we check 10 SMA to determine above/below average. In pi volume graph displayed at the bottom, what does is signify? I tried to edit and check for values but was not successful. can you please let me know how can i check on volume as well?
It looks a bit off, especially the support. If you are doing a short term trade, its better to look at the last 6 months charts. I\’ve not logged into Pi in ages now, let me check. But if I were to guess, this is the regular volume bar.
And some charts I am not seeing more than 2 price action points in 3-6 months range. Should I increase the number of months ?
Yup, you can.
Hi, When we are looking to find out short term S&R ( 3-6 months), should we looks at 1D candlestick charts or hour wise ? How about for a long term S&R ?
I personally prefer 1D candles. You can use hourly as well.
Thanks Karthik ,
My timeframe is 5 minits Chart . Which EMA is [ 9/21/50/100 ] suitable.
I\’d suggest 50 and 100. 9 and 21 can get too choppy.
Thanks Karthik , thanks
what are the parameters to use for EMA
Depends on your timeframe. Start with 9/21/50/100 kind of EMAs and build your technique.
Karthik Rangappa says:
June 8, 2015 at 1:06 pm
Once it breaks the resistance the changes of the stock picking up steam is quite high. Moving averages helps you track momentum quite well.
o.k , For intraday moving average period and simple or EMA
I\’d prefer EMA.
can the support line change into the resistance line and vice versa
Yup, it does, depends on the current market price.
very nice Idea to deal with good trades.
Thankyou.
Happy trading, Umesh.
Hello sir,
what is the most suitable interval for predicting candlestick patterns
Depends on your risk temperament. If you are risk-averse like me, then opt for EOD else at the intraday time frames.
HI Karthik,
Basic criteria for chart generation like time interval,view,display,studies?
As long as you have the time-series data, you can generate the chart.
How far the support level should be from stop loss in percentage if I go long .I have read the chapter and it said stop loss should be near the support. But how much is near.
Hi Sir
How to identify S&R if a stock is continuously growing or trending since a long time?
YOu need to look at the trendline and plot the S&R, Anhishek.
hello
how to find S & R in commoditys because in a commoditys there are contracts of 1 months so how to find ? i also have demat in zerodha.
The procedure to calculate S&R is the same for all the assets, including EQ and commodities.
Sir
If suppose 2 price zones are average time spaced but 3rd price zone found at same level before many years,will it work for S&R.
Yes Jitu, this depends on a case to case basis.
Hi Karthik,
Can you pls let me know how we can calculate intermediate support and resistance .These are small support and resistance level between the actual support and resistance level and in some cases they also turn out to be important reversal point.
Regards
Rohit
I\’d personally ignore these minor S&R levels because more often than not, they don\’t add much value to your analysis.
Hi Karthik,
I just want one clarification, Can we define S/R irrespective of trend before hesitation? Or it needs to be uptrend before hesitation for resistance point and down trend before hesitation for support point?
It can be irrespective of the hesitation, Pratik. This depends on the price action.
Thank you sir 🙂
Dear sir,
First of all i would like to say thank you for all valuable information.
I am following monthly trading chart.To put S&R level how many months i should take? Only 12 months not enough it seems.
Kindly help me to come out of this problem.
12 months is good enough as long as you find 2-3 price action zone, which kind of adheres to the S&R checklist.
how to find s & r in intraday, weekly, monthly or yearly and specially in a commodity like gold, silver and crude oil, as we cannot find s & r as above guided.
The technique does not change based on the time frame and look back period, Rajesh. It is the same across all assets and timeframes.
Hi Karthik sir, can we use the pivot point method to calculate support and resistance level ..¿
Hmm, I guess there are few decent articles on this. Let me try and source that. By the way, in my opinion, classic approach is still the best way to figure the S&R points.
what should be the candlestick time frame to find S&R for intraday.
You can look at 15 minutes candle, Ajay.
Thanks.
Hi Karthik Sir,
Just as ideally two price action zones must be placed at least 2 weeks apart in EoD charts,
what should the separation be in intraday charts, say for 15 min charts?
i.e. the separation period between two price action zones in intraday.
Thanks.
At least 10-15 candles apart is comfortable, Apurva.
Hi,
If I am trading a Nifty Future, should I take Support and Resistance into consideration of the Underlying or of the Future?
If Nifty has a Resistance of say 12,000, should I look for that 12,000 mark on the Underlying or on the Future?
I\’d prefer to look at the underlying rather than the futures.
Sir,
Can you help me identifying S&R in this chart
https://www.tradingview.com/x/mVMEgoD3/
Vinay, I think 2896 qualifies as a support and 3100 seems like a decent resistance.
Hi Karthick
If i bought \”X\” shares after conforming Bullish pattern, after some days if Bearish candles is formed , in that situation should i hold or sell , kindly suggest
You hold the position as long either till your target is hit or till your SL is breached.
In \”Support\” topic you have mentioned Entry Price – 442 and Stoploss at – 445 Higher than the current market price .Why?
also why is the target price – 435
Entry – 442 BUY
STOPLOSS – 445 SELL
TARGET – 435 SELL
Correct me please i am confused
aren\’t you selling at a loss here?
This is a short trade I suppose. So you sell @ 442, tgt 435, and SL @ 445.
Ah, maybe I meant resistance. Let me recheck. Thanks.
Hi Karthik,
Please help me out with a doubt.
S&R levels may change based on the time candlestick period we select. Which means 15 min period and 1 day period may have very different S&R levels.
So, my questions are:
1) If we trade intraday using 15 min candlestick periods. What should be the look back period for plotting S&R levels and should the CS period remain 15 min while doing so?
2) What should be the look back period for plotting S&R levels for long term investments (2-3 years) and what should we select as candlestick period? Should it be 1 day candlesticks?
Thanks!
1) Yes, however, you can also look at EOD to get a larger perspective
2) Eod charts for at least 2-3 years
Thanks for the prompt reply!
You people at Zerodha are gem!
Good luck, Ashutosh and happy reading 🙂
[…] the famous proverb in stock trading, battle of ‘bulls and bears.’ which can be referred to the support and resistance levels. Support is a term given to the point where demand is deduced to be stable and strong that […]
[…] the famous proverb in stock trading, battle of ‘bulls and bears.’ which can be referred to the support and resistance levels. Support is a term given to the point where demand is deduced to be stable and strong that […]
[…] the famous proverb in stock trading, battle of ‘bulls and bears.’ which can be referred to the support and resistance levels. Support is a term given to the point where demand is deduced to be stable and strong that […]
Dear Karthik,
How to draw lines in zerodha chart? I tried using the dra, but am not able to draw any lines in the chart. Is that i need to draw manually in my paper? Can you please help me on this.
You can use the draw functionality in kite. Pick the line (either horizontal or vertical) and place it anywhere on the price level. This works quite smoothly.
Sir ,which type of support should we used there are number of types of support and resistance in zerodha kite.
Use the ones which you plot manually, Nikhilesh.
Hi Sir,
My question is about support and resistance. Some times when the price of stocks reaches at Support levels or resistance levels, they reacts to contrary; they may keep go down or move upward. It makes difficult for me to take a position due to this. So how could we understand such situations?
Yes, Suhas this is possible. Remember, these things only enhance the probability of the trade going in your favor, but there are no guarantees.
So how to read the candlesticks to understand such move? 🙂
You have the whole module to help you understand the same 🙂
Hi,
Thanks for the great tutorial – its presented in a easily understandable format .
I have a query.
When to exit a stock, that has already appreciated and breaks out of resistance level as well?
a. Should we exit near the resistance level, even when the momentum is positive and volumes are high?
b. Should we look for price decrease and volume increase?
Confusion arises, as the target given by brokers is well above the 6 months resistance levels – please advise on the strategy
For e.g I bought Infy @676 – it is trading around 730+ now. But I see the target price well above 800 for it, from many broking houses
Bharani, you should look for trailing the stoploss and riding the momentum.
Thanks Karthik.
I guess it will have to done manually for a CNC order. Is my understanding correct?
Yup, that is right.
Hi Sir,
Kindly add chapters on following topics,as it will be a great help.
1. Demand and Supply zone trading concepts.
2.Gap Trading concepts.
3.Eliot and Wolfe wave concepts.
4. Gann concepts
It seems to be difficult to understand from other platforms. 🙁 Would be easy to understand with your simplified illustration.
Also a gentle reminder,you said you will put up a Module on Mutual funds but not able to find them yet 🙁
Thanks for the suggestion. Will try and add content on these topics soon.
Hi Karthik Sir,
Recently(Jan-11-2019) the price levels of TataMotors has fallen to levels around 180. It formed a Bearish engulfing pattern. I have some queries as follows:
– Volumes are also seen above average here. So if it were to be considered a shorting call, how can we proceed to plot the S&R?
– The recent price levels where it lingered, were around 166 twice and 156 once.
– But the 156(and around) levels have been attained only before 2012, so can that be considered?
– Can the 166(and around it) level be considered for a target, then(since, if we go methodically, then a price level should at least be touched thrice.)?
Thanks,
Apurva.
1) If the stock is at an all-time low, then it will be difficult to plot S&R because there are no previous data points to form the price action zone
2) You should aim for 166 and from then on, trail to 156.
That\’s great. Thanks.
Another, but a quick question:
I was somewhat sckeptical about the previous candles, if they\’re actually forming a trend.
I would like to know your opinion on it.
Thanks.
Maybe yes on a very short term basis.
Thanks a lot!
🙂
Sir,
I am new to the concept of investing and in a learning stage.
I am trying to draw the Res. Price and support Price for the SunPharma (just for practice)as of 29/12/2018, so while i can draw atleast two resistance price lines, yet i am unable to figure out the support price, due to the current prices being at their minimum for past year.
Now, how do i conclude whether i am entering the market at the right time or not. What if i just buy one share and book a loss. That would be a bummer.
Piyush, if the stock is making new high or low then this is a problem. You will have to take lot more data points into consideration.
Dear SIR,
IS it possible in kite charts to show Boring candle/biasing candle , mark price zones-demand and support zones, Risk-Reward similar to what is available in charts of SHAREKHAN.? kindly help if it is possible ,otherwise, may kindly add these features sothat Zerodha will be the best trading software. Regards
Very soon, we will have an update, I\’m sure you will enjoy all the features with this update 🙂
Hi Karthik.
https://drive.google.com/file/d/1BzUjGoCgt-uYDCXm0vOTkcgS7WWvJwtw/view?usp=sharing
I\’ve plotted S&R for PNB bank on a 3 month chart
1. Can you pls check it and suggest where i can improve?
2. If it is correct then how can we explain such a drastic movement happened before oct? News is the only answer or some other factors could be there?
3. If i\’ve correctly plotted the S&R then the distance between Support n resistance lines is less. Taking plus minus 3 adjustment in both will reduce it further. Can u explain this please
And if it is completely wrong can u please upload a correct version of it so that i can see where i was wrong?
1) I think the region between 70 and 73 is more tighter, I can see a lot of price action there
2) The S&R lines are indicative of a certain price reaction…pretty much like everything else in the markets. Remember there are no guarantees here.
3) This really depends on a case to case basis. You should never force fit the S&R points on a chart.
I guess you are more or less on the right track!
Sir i am using zerodha pi . Im trying to find support and resistance levels.
The timeframe that i selected is EOD or 1D . But the Minimum duration it is showing is 1 Y . I cannot find the 3 or 6 month duration as stated above
You should be able to select all timeframes on Pi for Pivot tables(1 min to a week). The pivot points will be calculated using candles for a day for all minute and hourly charts and candles for 1 week for all daily charts.
Sir, in most of the software\’s they show 3 support & resistance points, along with a pivot point, can you please explain why is it so?
Its just a convention to show S1, S2, S3 and R1, R2, and R3, Jimit. No specific reason.
Please tell me how to select a suitable timeframe for a stock for finding support and resistance levels ??
Thank you !!
I\’d suggest you start from the EOD time frame. I personally find this the most useful time frame for plotting S&R.
Hello kartik sir please add a chapter on option chain analysis to find out support and resistance of nifty
We have this – https://zerodha.com/varsity/chapter/moneyness-of-an-option-contract/ , have you gone through this?
Hi could you plz tell me best time frame & best indicator ( for entry & exit) for intraday? Also how to choose S & R……i mean during day trading, should i wait till 10am or till 12pm to find out S&R for the day.
Nothing like the best indicator, Sanju. Really depends on your trading style. I always prefer EOd charts for all analysis, including S&R.
What exactly is EOD chart? Where can I find EOD chart?
EOD = End of Day. You can find this across pretty much all charting software, including Kite.
Hey Karthik,
Where is EOD chart in kite, I couldn\’t find in indicator/studies?? Bro plz be specific know….or if u can plz share screen shot.
Plz guide ……
Open the chart in Kite, the first dropdown you find is set to 1D by default (next to view option). 1D means the end of day. From here you can change to any time period you\’d want.
Dear Karthik,
If some level has acted as support in the past, will that level act as support only in future also, or support & resistance can exchange level with each other.
Hopefully I m making sense..means if we have drawn some level as support but in past that level has acted as resistance, wl this level clear as support level presently?
Support and Resistance keep interchanging, based on the current traded price. Also, once a support/resistance is created, it stays valid forever.
Dear Sir,
Please find the sentence from the material below
S&R should confirm to the trade. The stop loss price should be around S&R
For a long trade, the low of the pattern should be around the support
For a short trade, the high of the pattern should be around the resistance
can you give more detail abut the wordings – \”around S&R\”, \”around the support\” and \”around the resistance\”
By saying \’around S&R\’, I mean the vicinity. For example, if you figure out that a stock has a support at 55, then I\’d consider anywhere between 53 – 57 as the support band. This is what I mean.
Thank you sir for the reply. I would also like to know if there is any tool/study in PI to plot S&R apart from the manual plotting mentioned in the material.
There is a pivot point tool in Pi. But frankly, I think nothing beats the good old way of plotting S&R.
You can find the logic used for Pivot points in this link. Similar logic is used industry wide.
What is the basis for calculationg Pivot Point (Standard in kite). As it is not matching with the general fORMULA
Karthik sir, while plotting support or resistance line what data points should we take into consideration? Low or Close?
And sir, you haven\’t described marking channel or trend line in this module, isn\’t that important? like ascending triangle or range breakouts? please explain sir.
I\’d suggest you look at the close, not the low. Low can just be a spike. Yes, I\’ve not done that, will try and add it as a supplementary note.
Thank you sir. Am eagerly waiting for those supplementary notes.
Your explanation is so lucid and simple for a newbie. I started reading this technical analysis notes a year ago and after reading your TA module only, i got to know about technical analysis. previously i use to think it must be a great task to learn TA but your platform has made everything so simple. After taking this lessons as basics, I\’ve surfed the net and YouTube for further exploration. And even today whenever in doubt i go through them or comment my doubts over here, and thanks to you, you\’re always here to help!
Your TA shishya forever..
Thanks so much for all the kind words, Dhananjay 🙂
Happy learning!
Hi Sir,
Thanks for providing such an informative article. Nowadays, most of the knowledgeable people are sadists who don\’t want to help others, but you are a rare exception. While going through this article on S&R, I started analyzing some stocks. There are quite a few where a recognizable candlestick pattern is formed, but due to constant up or down movement in the past couple of years, we can\’t deduce and S&R. What should we do in such a situation? Should we avoid trading the stock? Thanks so much sir.
Thanks for the kind words, Rachit.
If the stock is constantly moving then there could be levels of S&R being formed. I\’d suggest you carefully look for it.
Dear Sir,
I have read all the modules about technical analysis. I\’m still having difficulty identifying support and resistance on a chart.
Is there any other way to do it?
The best way is to practice it on many charts, Rahul.
But Sir, How can i cross check whether i am right or not?
The only validation in the market is your P&L 🙂
Sir I need you help and guidance. Please have a look at the chart of Tata Motors
https://drive.google.com/file/d/1PAFXebJSygm4xSL9xOiabBB4mP_-in7q/view?usp=drivesdk
Sir I am looking for a long term opportunity. I anaylsed the Tata Motors monthly chart from 2008. I drew support at 290. The price in 2013-14 was sticky and there was a sharp reversal in 2016 from this price. In mid of 2012, price also reversed and a small down in price was observed. In 2011, there was also reversal from 270 though our support line is at 290. Considering an upper and lower level of 5, our support zone comes between 285 and 290. Now the CMP is below the support and made a low of 245 in Aug 2018. Clearly the support level is broken. In july 2018 Hummer pattern formed with considerable increase in volume and in August price increased from 245 to 275 with rising volume giving an indication of change in reversal. Now I am confused as the price is below the support level and a confirmation by pattern and volume for trend reversal is observed. My question is- support level drawn correctly? If yes then should I wait for price to move above CMP to enter in trade. The whole purpose of my question is educational.
Sandeep, if you are trying to invest in the stock for long-term, then maybe you should be looking at FA. TA does not help much with long-term investing.
does 2-3 weeks count as long term investing?
Certainly not 🙂
Long-term is usually 5 years and above!
Hey Karthik ! The s1 & r1 for Titan company are 895.49 and 925.69 respectively (calculated using pivot points) and it\’s CMP is 880.90. I\’m looking forward to short sell but like you said the 2nd criterion of S&R is not confirmed. The R1 is way above the CMP. Should I hesitate to make a trade ?
hmm, I\’m not a big fan of pivot points for identifying the support and resistance. I\’ve never used this for trading 🙂
Thanks for the reply Karthik ! I plotted the S&R using your method. It is difficult but as I look at more charts I feel comfortable. By the way the trade was successful. Thanks ?
Happy to note that, Sawrikar 🙂
Dear Karthik,
Isn\’t it counter-intuitive to have stop-loss equal to support because support means that there is more probability that prices will go up and in case of a long trade if prices reach the \”stop loss level of the pattern\” and incidentally it is also the support level then I am more certain that the prices will now take an upward rally (since it is at the support level) instead of a downward one. And this will be in my benefit as I would be recovering from the losses (losses, since the prices are lower than they were when I took a long position) which I have made. Please clarify this doubt.
I\’m not sure if I get your point completely, but quoting from your comment \”because support means that there is more probability that prices will go up and in case of a long trade \”, exactly why having SL around support for long trades makes sense. In the case of a short trade, the same logic applies to the resistance.
Hi, i was making my analysis regarding support and resistance on aurobindo and i saw that the current market price is above the resistance price. There were no traces behind where the current market reaching at this high before. where as the resistance should be above the current market price. Also, could you please tell me if the support and resistance line constructed is right or wrong. Thanks.
https://drive.google.com/open?id=1u8HYpmse38dikIANfPa53qL06x-YIxU8
Yes, Nithin….this is becuase the stock is trending. Your S&R lines are fairly accurate.
Sir, suppose you make a Support and Resistance for intraday with 10 days 15 mins chart, and also you consider the range of the prices for support and resistance. So, within how much time or days will the current market price fall to its support level and vice versa to its resistance level?
Also, can you tell how much time or days will the current market price fall to its support and resistance for long positions?
thanks.
Nitin, unfortunately, you cannot draw timelines in the market. So no one can really answer this question for you 🙂
Hi Karthik,
I am analysing the daily charts for KotakBank and observe that on the 17th a Bullish Harami pattern is formed. Now I am trying to calculate the support and resistance levels for this chart and am finding it difficult as its been in a constance uptrend and now a small downtrend and I am not able to apply the technique suggested in this chapter, i.e., identifying price clusters or sudden spikes and connecting them with a line. I was reading about using ascending and descending triangles and using the width to come up with a support and resistance.
I want to check if this is a valid approach or if there is a different technique to calculate support and resistance when the stock is in a long term up/down trend.
The chart I am referring to can be found here. https://drive.google.com/file/d/17sYhUuyA2N5y_Mj5xGeqei4hB3y5zaYX/view?usp=sharing
Valid point, Venkat. It is hard to identify support when the stock is constantly trending in either direction. You can certainly use the concept of ascending triangles or even trend lines to identify support or resistance.
can u explain me that for short trade why we look at the immediate support level as a target we should look at resistant for buying trade as a target here is that complete statement:(S&R can be used to identify targets for the trade. For a long trade, look for the immediate resistance level as target. For a short trade, look for the immediate support level as target)
This is because when you short, you expect the price to go lower. So you first sell at a higher price and buy back at a lower price.
Since there is no reference point in all time high or low.. How do we trade these stocks?
Fibonacci retracement maybe?
Yes, fib levels kind of help under such circumstances.
During all times high in a market , do we have resitance levels ? and vice versa do we have support levels during all time low ?
No, this is because there are is no reference price.
is there any website which will give the s&r ready made?
You can use a pivot calculator to identify this, but apart from this, I don\’t think you can get S&R levels, simply because it is a visual concept.
Whats that?
Hi Karthik Sir,
I have managed to mark some price action, zones in the recent IDBI chart, however I am not sure whether to call it the Support region
or Resistance since the line is below the CMP by only 0.5 to 1. So is it already in the Resistance region or about to hover there?
2. I have some difficulty in spotting a zone, meaning that, to mark the extent of the zone. Like in the chart posted here, I have marked the entire region(6) here as since it looked like the scrip had a hard time moving above that limit.
3. Regions 2, 6 and 8 are on the same line, however, if a line has to be actually drawn, it doesn\’t pass from the exact middle of the regions, is it necessary for the line to pass through the middle exactly?
Chart: https://drive.google.com/file/d/1OkJTSOOYhcjNOkMAYCDq76vL-OGKmHO-/view?usp=sharing
Well, if the difference is 0.5 to 1, then clearly, you can consider the entire price band as price action zone.
2) Yes, 6 is a valid time period
3) Not to worry, please remember the idea is not to consider 1 single price point as either support or resistance. It is about the region surrounding the price action zone.
That clears a lot.
Thanks Karthik Sir!
Cheers!
Hi Karthik,
Would like to thank you for your clean and clear explanation on each topic.
If a stock is in clear downtrend/uptrend how to calculate/plot the S&R?
thanks,
It\’s the same technique, Hrishikesh. Just that the trend line would slant in the direction of the trend.
Hi
Kindly suggest the best candle stick time frame for Intraday trade on which we have to draw support & resistance horizontal lines to get the best possible results. It should be 1 day or 1 hr or 15 mins candles?
Please note that the query is regarding candlestick time frame and not for chart time frame.
I\’d suggest you look at the 15 mins candles for intraday.
https://drive.google.com/file/d/1_r6hNWjilRNktHCqO4NilOaSzlWseeeL/view?usp=drivesdk
kartik ji…plz help me..how i can draw S&R in this chart.
i think in this chart support is arround 188-190(not sure)
and how resistance draw resistance.
Shishir, like I have explained in the chapter, S&R is not a particular price point, rather it is usually a price range. So if you think the support lies around 188-190, then it probably is.
On Kite there is \’Pivot Points\’ study, which comprises of 3 Support and 3 resistant lines that i understand but there is Pivot line also.
What is the significance/use of that ?
Hello Karthik,
Once again thank you to your team for the explaining the topic in detail; however I have a question regarding to \’Load data points \’.
It is mentioned as \”to identify short term S&R load at least 3-6 months of data points. If you want to identify long term S&R, load at least 12 – 18 months of data points.\”
However, what is the time frame for candlestick that we should choose. Should we select time frame of 30 mins, 1 hr, 1 day, 1 week or a month?
Please let me know your response.
Thank you once again.
Regards,
Harshajeet
For longer term, I\’d suggest you look at End of day (or day) candles. For intraday, I\’d suggest you look at 10 or 15mins charts.
Thank you Karthik for your suggestion!
Good luck!
Hi Karthik ,
Thank you so much this article it was easy to understand.
Can you please help us to put indicator(Support and resistance) in Zerodha chart.
It would really helpful if you make video or images so that we can refer easily.
regards,
Anand
Thanks for the suggestion, Anand. I\’ll try and do a video on this topic sometime soon!
How to decide support and resistance of a stock if it is trading at it\’s all time high or all time low?
Plotting S&R for stocks which are at all-time high/low is not possible, Ashutosh.
Dear sir, sorry to ask silly doubts. I am stuck during plotting of Support and resistance line. For any price, there will be support and resistance. To plot support, one has to find 3 price action zone (hesitant to move after brief up move, hesitant to move down after brief down move, sharp reversal). All three should be well spaced in time. Encircle 3 price action zone and put horizontal line; having same prices. To plot resistance, one has to find AGAIN SAME 3 price action zone (hesitant to move after brief up move, hesitant to move down after brief down move, sharp reversal). All three should be well spaced in time. Encircle 3 price action zone and put horizontal line; having same prices. But both the lines will be same. Please advise.
I get your point, Roshan. You need to keep the latest price as the reference price. The support point will be below the reference price, so therefore the support lines that you will plot will be below the ref price. Likewise, the resistance lines will be above the reference price.
Thanks a lot sir, how can we plot both support and resistance line simultaneously. Regards.
Not simultaneously. You plot them one at a time.
Sir, the module is very informative. The question and answers clears many doubts. I was reading all the previous posts but I am not able to see the charts posted by other readers. Please suggest.
No one can upload charts, Rohan. The charts are available as links I guess.
Do you think it is better to use a line graph instead of Candlestick for drawing support & Resistance
I guess its best to stick to candles as it captures high/low. Line captures only the closing prices.
Not getting a hang of identifying S&R with Candlesticks.
Which part is troubling you?
Sir, please correct me regarding S&R. Suppose current market price is 100 so there will be support price range (below 100) and resistance price range (above 100). For any candle stick pattern we have to find BOTH support and resistance price zone.
1.As for bullish pattern (one will go long), stop-loss will be low price of candle stick (say 90) and support zone should be around 90. So 90 price will reconfirm as stop loss. Target price will be resistance (say 110)
2. Current market price 100, For bearish pattern (one will go short), stop loss will be high of candle say 110. Resistance should around 110 so it will reconfirm stop-loss price. Target (say 90), should be support.
Thanks..
That\’s perfectly valid, Roshan. It\’s best if both SL and S&R coincide to a single value.
Many many thanks sir, I have query regarding plotting of S&R. (Please correct if anything wrong) End of day price 100. Bearish engulfing pattern formed. I have to go for short sell. Let the Stop-loss is 110; which should be reconfirm with resistance price zone. Now to find resistance, as per given in varsity a). I have to load data points – Q1. How many days data points to be load for this short sell ?(spot market). b). Find out three price action zone with gap of atleast 2 weeks. C. Q2. Should all the three price action should be found or any one or two price action can be taken for 3 times .?
Q3. Is the procedure to find support is same as resistance?
Q4. Should Horizontal line fit to all 3 different types of zones (hesitant to move up, hesitant to move down, sharp reversal). Bit confused sir… Regards..
Q1) You can look at at least 6 months data, assuming you are looking at EOD charts. If you are looking at intraday charts, then at least last 3-5 days.
Q2) 3 price action zone, well spread across time is best, worst case at least 2.
Q3) Yes, it remains the same.
Q4) Sort of yes. But you can be a little flexible here.
Thanks a lot sir, Regarding Q3. I did not got .. How the procedure to find support and resistance will be same. For example, If EOD price is 100. Resistance line110 and support line 90. There would be two separate line. As per procedure Horizontal line should fit well spaced 3 action zone (hesitant to move up, hesitant to move down, sharp reversal). Please suggest. Regards.
I\’m not sure if I understand your query right. However, the procedure to plot to plot the S&R remains the same.
HI karthik,
If I want to do intraday, I use a 15 min chart and identify a trade with entry and exit points. If the target is not hit that day, and SL is also not breached, should I hold till the target is reached or exit at the end of the day?
Ideally, you should continue with this position. But if you do not want to carry overnight risk, cut the position and initiate the same trade again tomorrow.
Thank you so much for replying to all our queries even after all these years. Getting to learn not just technical analysis but also patience from you.
One more query, How to find out the average volume in kite? Can you direct me somewhere where I can learn how to use the features in kite and Pi efficiently?
Thanks for the kind words, Vinothini 🙂
You need to load the moving average indicator from studies. Once you select this, select the field as \’Volume\’ and you should be able to plot the MA on volume. However, before you do this make sure you have plotted the volume chart below the price chart.
Thanks. Got it.
For intraday, on a 15 min chart, to find out the trend , should I consider the candles formed only on that day, or can I use the previous days\’ candles also?
You can use the previous 2-3 day\’s data points.
Pivot Point = (H + C + L) / 3
R3 = H + 2 x ( Pivot – L )
R2 = Pivot + ( R1 – S1 )
R1 = 2 x Pivot – L
S1 = 2 x Pivot – H
S2 = Pivot – ( R1 – S1 )
S3 = L – 2 x ( H – Pivot )
Where,
H – Previous Days High
L – Previous Days Low
C – Previous Days Close
R – Resistances Levels
S – Supports Levels
Sir,
I was trying to draw the support and resistance in Axis bank table but iam not able to, can you please guide.
Thanks in advance
Saurabh, which part is the problem? Can you please elaborate the problem you are facing? Thanks.
Difficulty in finding the price action zones, because chart is not giving much movements
Hmm, is the stock making an all time high/low? If yes, then it wont be easy to plot the S&R lines.
Hey Karthik,
Sorry to bombard you with my never-ending queries…
I was drawing S&R on a 15 minutes chart and there seemed to be one or more price action zone at many levels throughout the chart. So my question how can we figure out which price action zone is the price likely to hit INTRADAY. For instance, we are short on a particular stock and there happens to be 3 potential support zones below CMP then should we just assume the one nearest to the CMP as target zone or it can be the farthest one also? I mean the point is after all to maximize profits so why not the farthest support level? How can we get an edge over as to which support level will be breached and which will not be?
Needless to say, your comments are always highly appreciated. Thanks.
Regards,
Abudhar al Hassan.
This one is hard to say, Abudhar. I generally give more importance to the price action zone which is well spaced in time. Also, the higher number of time the price tests this level, the better it is.
Not sure if I answered your question convincingly enough 🙂
It\’s ok Karthik. Convincing or not, your answers are always logical which is what matters to me the most..:)
I think I am having what is popularly known as the \”Analysis Paralysis\” especially in Intraday trades. Time and again I decide not to trade intraday but my capital constraints is compelling me to trade intraday, at least for the time being. However, I am kinda proud to say that even though I haven\’t made any substantial profits I haven\’t made any huge losses either, thanks to position sizing and your modules.
Alright, one quick question if I may…
Under the Risk management module, in the Kelly\’s criterion chapter, you have cited an intraday trade with Tata Motors futures. The S&R based on which you took the trade were hardly two days old and yet your trade panned out.
So my question is, when it comes to intraday trading specifically, S&Rs over 2-3 days look back period is fine enough or should we scan back more? The reason why I am asking is when we scan back further, some sort of price action zone always seems to pop out of nowhere thereby making it difficult to get a picture on how the trade\’s going to pan out.
Thanks and Regards,
Abudhar al Hassan.
Thanks for the kind words, Abudhar 🙂
You can look at 2-3 days data, but make sure you are looking at something like a 10 or 15 mins chart to ensure you have sufficient data points as look back.
I am unable to see 3 months daily candlestick chart in your screen. It shows only for 2 months. Secondly the support & resistance are not available to see readily
Are you looking at Futures/Option charts? For EQ, 10 year daily data is readily available but for F&O, the charts will only form from the day trading begins. However, try using continuous chart option(You will find it under Display> Chart Preferences).
To add S&R lines, select Pivot Points from the Studies dropdown
Hi Kartik,
I believe most traders will know Support and resistance, candlestick and other main charts. Then how do they derive alpha using technical analysis. If stock is reaching support then I will know there will be liquidity coming in —— or comany will have earnings growth and moving average lines are crossing so it should move up. How traders play a smart move in real mega money generating trades?
Regards
Nikunj, there are several aspects here –
1) Yes, everyone would be aware of TA and other factors – the question is how many of them would act with conviction? How many of they would have pockets deep enough to hold the positions through M2Ms?
2) Frankly, real mega money generating ideas, also called as \’wealth generators\’ goes beyond TA. You need to think about business and their dynamics. Think about longer holding periods. These are more on the lines of deep fundamental analysis
3) You can embrace quants and stats, quite an alternate way to evaluate trading opportunities. We have been talking about it here – https://zerodha.com/varsity/module/trading-systems/
[…] Source: Zeerodhavarsity […]
Is there any special indicator ( chart view) available to identify entry price of a stock and stop loss based on S&R technique? If yes please specify the indicator name for short term and long term purpose.
Not really, but I know a lot of traders prefer to use the pivot tables for cues.
Hi,
As you recommend, \’don\’t exit a trade till the target is reached or SL is breached\’. As i understand SL will be breached only on an intraday trade. However in positional trading if the market continues sideways or falls, would you recommend exiting from that maybe at a loss, perhaps atleast when the support has been breached? Or do u recommend sticking with it till the target is reached?
Thanks
SL can be breached for positional trades as well. So the same rule holds – You hold the position either till SL is triggered or your target is hit.
hi sir,as in candlestick pattern u stated that for bullish trade setup ,keep stoploss at lower shadow or low of the pattern,
then by using RRRcant we find out the resistance or target price?
why there is unnecessary of drawing the line that coincides with atleat 3action price zone,to find out resistance and support?
You cannot find out the resistance and target based on RRR, but rather you should use S&R and find out RRR.
hi sir kindly go through link
https://drive.google.com/file/d/1c9NRJkfips6eFrRZu9Y5GD-aNjsBS1NY/view?usp=sharing
I guess you can move the lines a little lower to coincide with the closing prices.
sorry sir i didnt get the point you explained
and on that link sir there is 3question kindly reply on that
Ah, dint notice your other question.
1) Yes, the lines are placed right
2) Yes, you can take R1 for intraday and R2 for swing, but make sure the reward you are expecting compensates for the risk you are taking (this is with reference to R2)
3) Yes, especially since 496 is not too far from 499.
Good luck!
Dear Karthik,
I have one confusion related to S&R….I think something is contradicting in this chapter..
1. Its written that only one line can be drawn..and according to the current market price (CMP) it becomes support, if lower than CMP, or if becomes resistance, if higher than CMP.
2. In the 2nd rule of checklist its written that if going long, Stop loss should be near the support (that means that line drawn is lower than current market price) then how would we will be able to know the target price (because there will only be one line, and we will not be having any resistance line because there already is one support line near SL) ???
Thanks in advance.
Vibhor, there can be multiple support and resistance lines and not just one set of lines. I would suggest you relook at this with this perspective.
Dear Karthik,
Thanks for prompt reply.
I have a few questions based on your reply above.
1. As you mentioned somehere that we have to identify best price action zones so its not necessary that in a particular time period you will get two sets of good price action zones (3-4 for resistance, 3-4 for support) also we cant increase time much to find action zones as when we are doing intraday. so what to do in that case? As we surely needs two lines, one to satisfy our 2nd rule of checklist and second line for target price.
2. looking at Ambuja cement example in this chapter, can you tell me what price points will be to draw support line there?
3. lookin at Cipla example in this chapter, how would you draw resistance line to support your 2nd rule in checklist?
Other all together separate queries – not related to this above question:
4. looking at Cipla example in this chapter, why did you choose 435 price line, why not 412 or 375. It had better price zones. As a speculation that the spike in price from 375 to 442 could result in a correction later dropping to 412 or 375 back?
5. How to draw a line in Kite3?
Many thanks in advance for taking patience for replying to my questions.
1) Yes, you can. Also, if the stock is liquid and trades easily, you will be able to find at least 2 sets of price zones in 2 years.
2) Rs.215 was the resistance and ard 180 as support
3) If the stock is at all time high, you cannot draw a resistance
4) I thought 435 connected more price action zones which are well spaced in time
5) Please check under drawings.
hi sir,i want to ask if iam doing day trading so what percentage should support and resistance range be there from current market price,
and also if am trading for 4-5 days.
also for 15-20 days.
There is no fixed range, Chirag. It is important to not the immediate support and resistance level when you are trading, this ensures you are close to the CMP.
and what if i do intraday trading?
Hi Karthik,
I have attempted to take a call for JP Associates by identifying some indicators(Recognizable candlestick, Volume, S&R), as follows:
Short at 20.85
Target: 17.5 +- 1.
Stoploss: 22.05
I would appreciate it if you could share your thoughts on it.
You can find it here: https://drive.google.com/file/d/1nsinAJMhbpwYcPuPEdSVyDmYilyLnfnU/view?usp=sharing
Thanks,
Apurva.
I\’d be a bit hesitant with the short considering the strong gree candle plus a gap up opening. You may see some profits, but I\’d suggest you be quick to book it. Good luck.
You\’re right. Though that, I came to the conclusion because of the shooting star, and the volumes showed a lot above average selling in corresponding to the shooting star, but this it showed in Pi not Kite.
So would I be correct in arriving to this conclusion based on the aforementioned info?
Also, what are your thoughts on the spotted support levels?
Thanks.
I\’d suggest you look at the EOD charts for this. But yes, patterns such as shooting start (hammer) etc tend to attract a lot of volume action.
I\’m not too sure about spotted support levels. What is this? Can you share some links to the reference material?
If you\’re asking about the ellipses then I have tried to spot Price action zones. I found no more than two zones at the resistance level and found three at the support level. However if the diagram looks cluttered I\’ll send you another one.
I was just trying to apply what I have learned so far at varsity. I\’d also have you know that, the support levels mentioned in my attempt above has been reached.
The reference material is this same chapter. I have only studied from Varsity modules. Please let me know if any of your above query is unanswered.
Please find the updated chart here: https://drive.google.com/file/d/1H4PUaDFCVC2uoxtpI05e8zF973tGnmpl/view?usp=sharing
Yes, the support levels look perfectly valid.
Hi Karthik,
I have two questions:
1. How do we decide which stock to pick for the day, e.g. COALIndia or SAIL or whichever scrip. How do we know where the action is happening, so as to be able to pick a stock?
2. I have seen advisors also mention, that the support(or resistance) level would be hit in \’x\’ days, so how do they do that?
Thanks.
1) Firstly you need to create an opportunity universe where you list down all the stocks which you like to trade. Secondly, once you have the list of stocks you look at the charts every day to figure out where the action lies, the action as you know manifests itself in the form of candlestick patterns.
2) I\’m not sure about this 🙂
Hi Karthik,
Can u pls suggest some books to refer to understand supply and demand of stocks as support and resistance itself create demand and supply in markets
Not sure of any books which focus only on this aspect, Prateek. The concept of S&R is one of the subsections in a typical TA focused book.
Thanks Karthik
Welcome!
Hey, Kudos on the great work…
Coming straight to the point, while finding S&R, a sharp reversal of bullish trend (ie. a peak in the upward trend) in the past can be considered to locate Support at present (considering the current market price is above the level). Am I correct?
It doesn\’t seem logical, the price level could have been a Resistance a few weeks ago, for example, but now we are assuming it to be Support.
Aadesh, yes, you can use the sharp reversal point (in the past) as areas of support or resistance. However, this has to be time-tested, creating a price action zone. Also remember, the price action zone can be both support and resistance. It becomes support if the current market price is above the price action zone and resistance otherwise.
I really like the way you explained however for me to plot S&R using the above technique is very difficult. Is there a way I can use a formula/study in Kite to place the S&R points on it\’s own? If yes, what should be the time period?
You can try using the Pivot point calculator to identify the levels. Btw, what makes it difficult? Is there anything I can do to help you with it?
Hi Karthik,
I have attempted to identify some price action zones for Jain Irrigation Systems in the attached screenshot, so could you please advise on the correctness and the accuracy of the same. It can be found in the link below.
https://drive.google.com/file/d/1DLlnmCai-0ASvXqbNtt4mPTQt7GrYQt7/view?usp=sharing
Thanks.
Replied on the chart itself.
So, is a small up/down trend in the price action zone allowed? I have replied to the comments in the earlier chart.
Meanwhile, here is another try.
https://drive.google.com/file/d/1duDE3mujZnbBBw8UMxFWwIW0VMX0gMj6/view?usp=sharing
Thanks for all the effort.
Yes, that is absolutely ok.
Hi Karthik,
Could you please take a look at the second link I\’ve shared? It would help me know, whether I\’ve been able to identify the areas.
Thanks.
Hi Karthik,
Just a gentle reminder. Could you please take a look at the second chart. I have attempted to identify 3 areas.
Thanks for all the effort.
Yes, the price action zone on Sail is accurate. Good look.
Thanks a tonne. Karthik Sir.
Welcome!
Hi Karthik,
Do you use a specialized tool to plot those lines of Support and Resistance?
No, not really. You can use the simple horizontal line available in studies.
By what name does that exist in the list(Studies)
Found it. Sorry for the trouble.
Cheers!
Sir, what should one do if the candle suffices the requirement with greater volume, but it is not at the Support or Resistance level? should we go with it or leave?
Yes, you can still go ahead. Not always do you find patterns coinciding with the candlestick patterns.
Sir first of all thanku so much for sharing such useful knowledge about stock market which is very helping to beginner like me.sir I have a query….
As you advised that if a trade is initiated we should wait until it get eighter target or stop loss otherwise trade get bust.
Sir suppose one bought share of xyz at 100 rs price stop loss is 95 and target is 110 .If price reached to 107 and one is willing to sell at this price.is it wrong…..Can you pls explain…
how do we set the target, if the stock price is going all time high or low?
That would be difficult as there is no reference price, the only option is to trail the SL.
Supposedly, a bearish marubuzo had formed and it has even breached a crucial support level. So, the Stoploss should concide with now resistance (earlier support) or else the resistance level before the candlestick pattern?
If your answer is SL should be around new resistance then don\’t you think that it can bounce back and the approximation of our levels went wrong.
This depends on the extent of the breach. Suppose the pattern has occurred at 100 (which is the original resistance and Sl) and breached 95(new resistance), I\’d watch out for 95 since this has moved 5% from original SL. However, if the new support is at say 97, I\’d still consider 100 as SL.
I didn\’t get it sir. Sorry if I have not framed my question properly. Let me put it clearly with precise example.
Stock- IndusInd Bank
It closed at around Rs 1622 on 20th Feb, 2018. Crucial support was Rs 1594 and Resistance was Rs 1660.
The next day a bearish marubuzo formed and it closed exactly at Rs 1594 and making a high of 1636.
My logic: The SL is the high of candlestick which is 1636 and it should concide around 4% of resistance. Now, which level should we consider resistance? The earlier one (1660)? Or if the candle which was above the support and it breached that support level (1594) and closed below it making that candle divided into two zones. So now the resistance should ideally be 1594 which was earlier support. SL should concide with 1594 or 1660 (earlier resistance)?
I really sound noob but I want form a hollistic approach and trying to make my own trading principles and strategies. I am grateful for your patience.
Rinkesh, this is a classic case where I\’d trail the SL. The day I enter the position, I\’d set the SL at 1660 and as and when the stock moves lower, I\’d trail my SL and gradually move my SL towards 1594.
Amazing Sir! This situation arises when bullish candlestick appears around resistance and bearish candlestick around support?
Yup! Good luck, Rinkesh!
Hi Karthik,
As you explained S&R are used to set our targets. And you aslo suggested in 2nd Checklist that , if S&R matches our stoploss we are double confident. So for a going long trade, Resistance is my target, and i can double confirm the trade buy checking if support = stoploss.Hence we are using both S&R to decide a trade. Am i correct?
This is correct, Satish. There is always more confidence in the trade if the support and resistance coincide with the targets indicated by the candlesticks.
Sir how should we look at a stock that is making new highs. What is the method of plotting s&r? Looking forward to your guidance..
Also, on whatbasis should we trail our stoploss or stop profit?
This depends on your risk appetite.
unfortunatley, you cannot plot resistance for a stock making new high.
Dear Sir,
on 12 th Feb,AuroPharma showed morning star pattern.However I am very confused, how to plot S&R here.should I take 2 years of data or 1 year or just 6 months.
I am just a new newbie, If you do not mind ,Could you please draw & send me S&R plotting for reference.
Thanks in advance.
If you are looking for a short-term trade, then look for at least, 6 months data. By the way, the morning star pattern is not very convincing, P3 should have closed higher than P1.
Good luck and happy learning.
Sir, in the above example you got 429 as support levels and you considered the zone of 426-432 (+- 3) which is just 0.7 of deviation of 429. While, the stocks trading at lower prices for example Rs 50, then what zone should we consider? (+- 3) would be a lot of deviation according to me. Should I consider (+- 1%)?
The % will always remain the same irrespective of the stock price.
But if we take percentage of a stock like IndusInd where 1600 is a key level and approximation zone of 0.7% results in 10 points of deviation which means 1590 to 1610 is the crucial level? Or should we make our zone tighter when we deal in high priced stocks?
I\’d always prefer (and advice) to work with a zone rather than a particular price point.
Hi Sir,
1. In the chart given as a example for the point \”Hesitated to move down further after a brief down move\” ,from the right first encircled price action zone is in uptrend,but you have encircled it as a example for \”Hesitated to move down further after a brief down move\”,Why so?
2.If a price hesitation is there in between a up or down trend and after that hesitation the same trend continues,then can that also be considered as price action zone? or only price hesitation point with the direction reversal are to be considered as price action zone?
3.Many a times when i try to find S&R,i find that there are many small peak and trough (with range of 3-6 point) in between a major trend(10-20 points) move(example : airtel). If we are a swing trader, should we need to consider all those small peak and trough,while trying to spot S&R or only the major move is enough for finding S&R.
4.If we are a swing trader and If a candlestick pattern is formed and if all the checklist points coincide and we have entered a trade but after that if the price hasn\’t moved in our direction or even though the price moved but target was not achieved within 5 to 8 trading session(or 1-2 weeks) should we need to close our position or we can still wait for the target or price movement?If so how long we can wait?
5.It happens that many a times when I wait for the SL to hit on a closing basis,the price moves much below SL and close and it turnout to be a huge loss.How to tackle this?
6.If we need to trade only major trends( secondary or primary trend) avoiding minor trend ,can this same candlestick technique with checkpoints can be used?
7.If we are trying to trade using spindle,
7a)then what is the SL for spindle?Is it low point of the spindle?
7b) for trading based on spindle also checklist need to be considered?
7c)for spindle prior trend is important?
7d)if we are a risk taking trader,can we initiate trade based on a single spindle formation in any prior trend? or for spindle based trading is it good to be a risk averse trader?
1) This is because the stock did hesitate to move – owing to the presence of support
2) Yes – can be considered as a price action zone
3) Consider the ones where the follow-on price action is significant. Small reactions are natural in markets.
4) Wait for either the target or SL to trigger
5) Maybe you should trail your SL
6) Yes
Sorry, I\’m unaware of the spindle technique.
Hi sir,
Sorry its a typo,not spindle its spinning top.
1.If we are trying to trade using spinning top
1a)then what is the SL for spinning top?Is it low point of the spinning top?
1b) for trading based on spinning top also checklist need to be considered?
1c)for spinning top prior trend is important?
1d)if we are a risk taking trader,can we initiate trade based on a single spinning top formation in any prior trend? or for spinning top based trading is it good to be a risk averse trader?
A spinning top does not really give a trading signal. So you cannot really construct a trade based solely on it. Its best used when you combine it with other patterns.
Hesitated to move down further after a brief down move”
here can u elaborate what does these means?
AFTER A BRIEF DOWN MOVE
thanks
I\’m guessing that I\’m talking about the price getting arrested at support zone.
If we have taken a position and we are in loss with our SL has already been hit and if the Q results are to be announced tomorrow what to be done in this case?should we need to close the position by today(since SL has hit) or can we wait till the results?
This depends on the logic based on which you\’ve initiated the trade in the first place.
Hi Sir,
1. If support and resistance is a band,then Say if we find S&R point to be 100, then what is the % we can set to S&R band.99-101(1%) or 99.50 -100.50(0.5%) or 108-112(2%).
2.In the chart for \”the encircled points indicate the price hesitating to move down further after a brief down move:\” why have you encircled the last price action zone?I hope it is in the uptrend .
3. \”Hesitated to move up further \” – for this if there was a uptrend and in the middle of it,if the price momentum was low and so price was hovering around the same place for a long time(say a month) and followed by that if there was a steep up move to continue the uptrend ,then can this also be considered a price hesitation point (price action zone)or only the price hesitation point with price direction reversal are to be considered?
4.If a candlestick low is formed at 102 and Support band we assume it to be 99-101, we are going long on the stock,then what should be our SL? should it be 99 or 101 or 102 ??
5.Suppose we were slightly wrong in assuming Support band and thinking that our SL is hit and we sell our stock and if then a bit lower to our sell point if support comes in,what to do and how to avoid it?
6.In some stocks(like KTKBANK) i a finding it difficult to find S&R band.I feel that many S&R points are very close by and so i am unable to take trade since i am not clear with S&R points.Help me on it.(i feel easy to trade in stock with low volumes as i am able to find S&R for them easily)
7.When we try to include more data points in our observation to find S&R,then i find the many peak and lows are formed which are suppose to be S&R points.In this case if the peak is visible, to formed inbetween 257 and 249 ,how to fix the S&R?
8.If we have taken a position and we are in profit, but still our target is not hit and if the Q results are to be announced tomorrow what to be done in this case?should we need to close the position by today(inspite of target not done) as were are not sure about Q results or can we wait with the hope that even if the price move down slightly (because of Q result is being bad) still our target would hit after few days of result.
1) Identify the price point and spin a band with about 1-2% around this price. For example, if the S&R line points to 100, then I\’d consider 98 to 102 as the S&R zone
2) Not sure which circle you are talking about – but I guess there is a hesitation to move
3) The uptrend is within the trading zone I guess. Plese give reference to the image – hard for me to locate
4) 99
5) You cant – another reason why support is a better place to place your SL
6) Look at longer-term trends, load more data points
7) Choose the one which has stronger reactions at the price action zone – you should have not more than 3 points
8) When fundamentals are at play, technicals does not hold up.
Hi Karthik,
Another amazing chapter ended on a great note, thanks a lot for putting all this.
Just couple of points to discuss:
1. What makes price action zones to be more significant if they are well spaced in time, I mean the psychology behind this? and what if price has touched the resistance for past 2 consecutive days and today again most likely it will touch the same level, what and how psychology will be playing out here and how it is different from former one?
2. While analyzing data what time frame is most suited for intraday/positional? Is 3min and 5min time frame worth giving a try or 15min/Daily time frame is OK(currently I try to use this), also lets assume if we say any particular time frame is best or most suited why do we say so? does it reflect any psychology/behavior.
1) It implies that the market participants are anchored to these price points – so greater chance of the price reacting at these levels.
2) I\’d suggest 10 or 15 mins for intraday and EOD for positional trades. Remember, the longer the time frame, higher is the information component and lower is the noise component.
Dear Sir,
Is there any way through which I can get real time update on stocks crossing its support or resistance level, especially on mobile.
Have you checked this – http://streak.tech/
please clarify my doubt, sir…
while we are drawing support or resistance, whether we can include price actions of previous resistance zone in today\’s support zone… or we should include only respective zone areas only ie.. support areas only for support and resistance areas for resistance?
As we know support can become resistance and vice-versa…
Kindly reply me, sir… I am confused in this
Yes Raj, you can include price action from the previous support and resistance zones. No issues with that.
Thank you
Include trendlines in this module…
Ok.
Karthik..could you please explain little bit logic behind gap up working as support, gap down working as resistance? Also what is theory behind gap filling?
I\’m really not sure if the gap can act as a support or resistance level, Gyan. Gaps are formed due to an increase in sentiment – this could be bearish or bullish sentiment.
I tried calculating pivot points (based on formula high + low + close / 3) – the results are not aligning with zerodha kite values. For instance I tried calculating the pivot for Jan 4th for Inidiacem Jan fututres. Basis the above formula:
high for 3rd Jan was 189.7
low for 3rd Jan was 181.2
close for 3rd Jan was 187.6
basis these values pivot for 4th Jan should be 186.17 however kite shows a pivot value of 180.9. Can you please help understand the logic behind pivot point identification (as done by kite – does it involve any differentiation formulas??)
Maybe there is a slight mismatch in the formula you are using as the one used by Kite.
Hi Sir,
Could you please explain as to how one can identify a stock exhibiting identifiable technical patterns for a profitable trade. There are plenty of stocks but how does one come across these technical patterns against the movement of such stocks?
Thanks,
Arya
Arya, for that you need to go through the entire TA module 🙂
Sir, I went through the entire TA module. Maybe, I didn\’t make myself clear.
How does one screen a stock to identify technical concepts applicable? It is not feasible to open charts of every stock to view identifiable trends.
You need to define your opportunity universe first – like Nifty 50. Then look at the charts of Nifty 50 stocks…scanning through these 50 charts does not really take much time on a daily basis.
Sir, I went through the entire TA module. Maybe, I didn\’t make myself clear.
How does one screen a stock to identify technical concepts applicable? It is not feasible to open charts of every stock to view identifiable trends..
Hi Karthik,
In kite app , Chart section there is studies called \”Pivot Points\” , Which has R1,R2,R3 & S1,S2 & S3
So we can readily pick up support and resistance with the help of \”Pivot Points\” Isn\’t It ?
Yes, you can use pivot points indicator to readily find S&R levels. Or you can draw your own lines using the Draw tool in Kite and the method explained in this chapter
Hi karthik sir,
I am little confused.
What is difference between s&r calc. based on pivot point level which changes each day and the s&r level calc based on trendlines as discussed above????
Which has higher accuracy rate??
Which is useful for intraday or btst??
PP is based on a formula but the other S&R technique is based on identifying price action zones. I personally prefer the S&R based on price action for all sorts of trading (intraday, swing, EOD etc).
Hi sir,
For a swing trader, if the SL is broke on a closing basis he would sell on the next day but what about a intraday trader? How should one confirm to close his position??
Its best to close positions based on the closing basis, but that may not be possible for an intraday trader. Hence he has to close the position during the day.
Can you pls guide me with pivot points. Did you explain them in any of your modules. How can we know time frame to reach the target?
I\’ll try and put up a quick note on how to use PP shortly. That will hopefully explain PP better.
how frequently should S&R be plotted? will it change for every candle? how can we know the time frame to reach?
For longer frequencies, like EOD candles, it won\’t. So checking S&R once in 15 days should be ok. But for intraday, you need to check daily.
Hi Sir,
What is the max difference permitted between SL and S&R level,above which we should avoid entering the trading. Kindly explain the reason too.
I would be uncomfortable if its more than 1%. The only reason that we are taking on more risk. So lesser the better.
Hi Karthik,
All your modules are superb and simple and we\’ll explained. Thanks a ton.
I want to know how to calculate the target for shares which have reached their highs (some newly listed shares also). How can we plot their resistance and know targets. If not through S&R what is the alternate way? We keep seeing people saying target is so and so. How can we do it? Plz explain.
It would be hard to plot the S&R for newly listed shares or for that matter, shares which are making an all-time high/low. The only alternative is to plot something like a pivot point.
In Kite we can add script in 5 given market watch option, In 1 market watch upto 20 stocks, If possible please make it dynamic so that we can add more market watch.
Please explain about slanting support and resistance. Trend line support.
Trendline is very similar to S&R, except that it connects higher highs and lower lows. The functioning and its implication are very similar to the regular Support & Resistance.
Hi Karthik
Your blog in varsity is really simple and easy to understand. Thanks
I would like to know if I am right with following. I usually plan my trades such that if intraday reverses will carry forward for next couple of days.
Micro (5-10min): 1 min chart with 1hour data points
Intraday: 10min chart with 3months data points
Swing (upto 5days ): 1 hour chart with 6 months data points
Short term (3-5 months): daily chart with 1 year data points
Long term (beyond 1 year): weekly chart and data points max
For long Term I usually prefer fundament data.
Kindly suggest me.
I\’m not a great fan of the 1 min chart, lots of noise in my opinion, Sainath.
10 mins for Intraday is good.
Maybe you should increase the look back for swing trading to at least 15 days.
Everything else is good according to me.
Hi Karthik,
Thanks for quick response 🙂
So for Swing trading i can use 1 Hour chart with 15days+ look back.
Regards
Yes, that should be good. Alternatively, you can even look at an EOD chart with about 1-2 months of data.
Thanks lots will follow them. Regards 🙂
Good luck!
Sir mene fome our document coriyer mar diye he
Aadhar our pancard ki zirofh cleayer nahi he
Mujhe dono bhejana he
Kese bheju mail se nahi jaa raha he
Me kya karu
I\’d suggest you check with our support executives. Thanks.
hello sir i become fan of your teaching style . sir can i use S&R 10 min chart frame for S&R or i do reliable to hour or daily chart for S&R. please guide me
The longer the duration, the better it is. Hence, for this reason, I\’d suggest you stick to daily charts.
sir mera demade Acount chalu karana he
You can do it online from here – https://zerodha.com/?ref=varsity
Sir, guidelines u told in finale chapter really work a lot, but i m confused about the target. I don\’t know where to take exit. Can u explain little about it???
Simple S&R itself helps in identifying targets, Manish. Guess I\’ve explained it later in the chapter/module.
Got it
Thank U
Cheers!
Hi Kartik,
The examples given here are very nice. I am going through your posts as a daily routine :).
For S&R, can you please help me with some more examples? Where can I look for these patters apart from what you have shown above? Theoretically I have understood the three major points for identifying the S&R points, but need your support to have more examples.
As I\’ve mentioned in the chapter, S&R is more of a visual concept. The only way to get better at this is by looking are more and more charts.
Hi Kartik,
How to send you a file such as an image or an excel file to seek replies on my queries? How do I attach documents?
It\’s best if you can upload it and paste the link here.
Hi Kartik,
Have I marked support and resistance correctly here? Below is the link
https://drive.google.com/file/d/0Bz9UjTbCL1PPeFF6akJEeEVEYjA/view?usp=sharing
Unable to see it, Vivek.
Hi Kartik,
Can you see it now?
https://drive.google.com/file/d/0Bz9UjTbCL1PPeFF6akJEeEVEYjA/view?usp=drivesdk
Yes, but the S&R are way outside the price chart 🙂
Can you please send me the corrected version so that I can understand.?
I\’ll try and email you Vivek, cant promise though 🙂
Can we say that currently ICICI has support at 260-262 and resistance at 290-293?
Yes, looks like it.
Hello Sir,
For intraday trading, plotting S&R in 15 min chart with the look back period of 15 days is very difficult as sometimes, we dont have enough price action zones and sometimes every other point matches. Also, as it is intra-day trading, the trend lasts for short period. Is there any other way of setting target in intraday??Pls advise. Thank you so much for all your efforts.
Regards,
Jawahar
I agree, 15 day period for a 15 mins time frame is a little tricky. However, try and reduce the frequency to 5 trading sessions. This should help.
Hi Karthik,
Please accept my sincere compliments for having Zerodha Varsity and supporting people like me who want to explore investing in equity markets. Believe me you are the best online content on this topic I have come across.
I have been into Buy and hold strategy for quite sometime. I wanted to know whether we can put stop loss on the buying day itself if we are using \’CNC\’ as order type. Similarly, can we sell the scrip on the buying day itself (say it gains 3-4%) if we are using the order type \’CNC\’.
Many thanks for your prompt reply as always.
Thanks and Regards
Rudra
Rudra, thanks for the kind words.
Yes, in such a scenario, even though the product code is CNC, it will be considered an intraday.
[…] learn in-depth about support and resistance you should visit varsity of […]
sir 6 pages if watch list is not enough please add additional pages
Not sure what you mean by this, Sujay.
Hi
Long term S&R – is useful for swing trading -> is this useful for equity futures ???
Short term S&R – is useful intraday and BTST traded -> should we use hourly candle stick or day to find the support and resistance
Yes, it is.
For short term, you can still use EOD but I guess using hourly charts is more comforting to many traders.
1. How to determine the next immediate support and resistance for nifty index while trading index options? I want to trade in options and asking also since I see most often the analyst who come on news media, say the immediate S&R.
2. How do they come up with resistances when the markets are at an all time high?
1) The same way you would for any other stocks. Plot the trendlines. Ignore the media.
2) Not sure, as this is not really possible.
Hi Karthik,
I found it easy to understand and read all the technical analysis.
I am very new to trading and started trading only after reading varsity. I have advised my friends to prepare notes from varsity and start investing.
I have a silly question. How can I plot support and resistance level in Kite chart.
I have seen it mentioned as studies> pivot points.
While I do that I got many lines. I did not understand that. Is there a way to select the price action zones as you have mentioned in the varsity..? Please instruct me how to do it..?? ( I am pretty new. So please answer it simply as it is your style)
Also tell me how does the pivot point study work to plot support and resistance level.
Happy to note that, Sai Pramod!
Yes, you can use the horizontal lines available under tools. This will help.
Good luck.
Hi Karthik,
I see that you are using basically using horizontal line to get to S&R. I have also been reading other sources of TA and learned that we can use sloping lines as well.
I personally have a liking for sloping lines for getting my S&R.
1) Any particular reason for your preference for horizontal lines ?
2) I also have a observation that once you draw the sloping lines beyond current date you are almost getting a resistance/support level for stocks/index making all time highs/lows.
Your suggestions please.
Thanks
1) Nothing really. Slope lines are used when the stock is trending. I guess I missed explaining that part 🙂
2) Hmm, this is because the stock is trending and has a good momentum.
Sir, can I place a stoploss based on ATR? If yes, please tell me how?
Of course you can! Check section 18.2 – https://zerodha.com/varsity/chapter/volatility-applications/
Sir, I am comfortable with placing stop-loss based on candlestick…will that be bad?
No not at all, in fact, it is more meaningful when you do it this way.
Thank you sir……:)
Cheers!
Hi karthik,
In one of ur post u have said that trendline as a tool is available in kite. I cant find the same. Can u help me with it?
Click on draw – select tools – pick lines.
What is the time frame to find prior trend?For example let us assume a stock which is in bullish trend overall,but it is bearish today.
You need to look for at least 5-8 prior trading session for this.
TQ SIR
Cheers!
Hi How to calculate the buy above and sell below values using previous day\’s data like daily i am getting the values from niftysign.com website and it\’s working well for me. Today\’s(15/09/2017) values are for Banknifty Future BUY ABOVE 24977 TARGET 25066/25155 STOPLOSS 24933
SELL BELOW 24888 TARGET 24800/24711 STOPLOSS 24933 So Please anyone can do this (at least approximately) and reply how to calculate.
Not sure, Murgesh. Its best if you use S&R levels for this.
tell me how do i learn to set a target price.tell me everything about target price. and how should i research for intraday?
You use simple S&R to set targets. I\’ve written about it in the above chapter.
1) What if the price is at all time high? how to find resistance then?
2) also, for S&R should we consider the lows and high or real body?
3) while drawing eclipse/circle, how to decide on the area of drawing? because if we draw small, the horizontal line may not pass through that circle.
4) For long trade, the Stoploss should be the low of pattern. If support is below the low of pattern, then we should not take up trade? or if support if above the low of pattern, we should not take up trade?
1) You cannot as there are no data points
2) Maybe you could, really depends on the situation
3) Try loading fewer data points?
4) It\’s best if support coincides with low. If it\’s anywhere else, check the viability of the trade by quantifying the Risk to reward pay off.
Karthik – I was looking into the nifty index chart and had this doubt.
What if a script is trading at its all time high, how do we find its resistance point? Since it is one of the points of the 6 point checklist.
Its not possible to identify resistance for stocks making an all time high. You will have to rely on the other checklist items. However, for support, you can use Fib retracements.
Hello Karthik,
My understanding of S&R is once price breaks a resistance and moves up(along with considerable momentum) the same level acts as an Support now. Is this right or wrong. If yes then let\’s say while constructing Support level in Down trend Can i use previous price action zones which were earlier acting as Resistance.
Also i find it difficult to plot S&R levels in strong up or down trend, say i am using a day frame looking at candles corresponding to 2 years and the price has been on up trend with minor fluctuation as per Dow secondary trend, in such cases price action zones don\’nt occur at same level. How should i decide S&R in such a scenario as i need them for my stop loss and exit price.
Also please let me know if there is a option to attach screen shot so that i can show you what i mean.
Regards,
Nayan
Thats right – today\’s resistance be tomorrow\’s support and vice versa. I understand your point. The only way to deal with it is by loading more data points. No option for screen shots I guess.
Hello Karthik,
Adding to above scenario i observed that on some occasions even 5Y period candles are unable to provide me price action zone for creating Support and Resistance.
Additionally i observed that these have rebounded as Per Fibonacci Retracement 23.6% level on couple of previous occasions.
Can i use Fibonacci Retracement level, level decided as per previous behavior of stock, to calculate my Support level in a strong uptrend like in this scenario i mentioned here. When i ask this i do understand that i am treating my current price as resistance level.
Please note the candle stick pattern formed is Bearish Harami with more than average vol(10day EMA) on both P1 and P2 candles, prior trend in Up trend.
Regards,
Nayan
Yes, of course. You can use the Fib levels if the stock is trending continuously. It is especially common to find such situations in a strong Bull market.
Hi Ash,
You could buy a stock today and sell it in the net trading day. The stock will be shown as T1 holdings but you could sell it as any other stock in your holdings. Do remember that you cannot do BTST only if the next trading day is a settlement holiday. Zerodha has a separate blog for settlement holiday, you can go through that one.
Thanks,
Ujjwal
Thanks Ujjwal, but I think I tried once to sell like that, but it said the stock is not yet available in your portfolio or something.
You cannot sell a stock which is not in your holdings in CNC. Please try with MIS.
Sure would check, thanks.
Karthik,
1. Are there BTST trades in the Zerodha Kite trading platform? If not, how do we do the trade in Zerodha?
2. Is S&R always a manual process? Or is there a tool like we have under the “Studies” drop down in the Kite platform?
3. What to do if we can’t find 3 action points, in some cases, the stock may keep rising/falling for over a period of 12-18 months isn’t it?
Thanks,
Ash
1) You can do BTST on Kite
2) Pivot Points identify S&R using simple addition/subtraction. I\’m not a big fan of PP, I prefer to look at the chart and identify the areas of S&R
3) In that case, there simply won\’t be any S&R
Awesome, thank you. Could you please let me know how to do BTST on Kite?
It works the same way, buy using CNC on T1 and sell the same on T2.
Thanks but I think I tried once to sell like that, but it said the stock is not yet available in your portfolio or something.
Can you please check with our support executives once? Thanks.
I am looking at the chart for L&T Finance Holding and on the daily chart it looks like there will be a bullish marubuzo.
my question is for a stock like that which is at its all time high how do you get the resistance points ?
PS: Also do let me know if it is a bullish marubuzo because on the \”all time chart\”it looks like a hanging man.
how to do decide which one to go for in such a situation
No, you will not get a resistance point if the stock is at ATH. Likewise no support for a stock which makes ATL. It does look like a bullish marubuzo.
so in this case how do we set targets ?
It would hard, a better option would be to trail the profits.
Hello Sir,
Varsity is actually a wonderfull Place to start learning abt trading,& Im so elated that I can learn many things from comment section also.
Thankyou So much?
Glad to hear that, Dharni 🙂
Happy learning!
Sir, I can\’t find the link to the PDF anymore. Where are they ?
It\’s there, scroll down to the end of the chapters list and you will find the download option.
I paid 300 rupees for demat and trading account for equity trading 15 days ago. I filled up and gave all the related forms and documents at bangalore headoffice. Yet my account hasn\’t been opened till now. Why?
Suggest you speak to the sales manager for this, Rahul.
I read the article, but not understand support and resistance. My Question is how to identify Buy or Sell stocks with this graph.
In support time what to do? (Buy/Sell), In resistance what to do? (Buy/Sell).
S&R levels are great to identify targets. Give candlesticks a try to identify a trade opportunity.
there are 1_2 differenmces in every chart i try to plot s&r …..also i tried peak and trough method but in vain
I\’d suggest you read through the chapter again and try and implement this again.
and tghe metho0d suggested in module just doesnt works the way it has been explained . please help
sir i tried plotting prixce action zones but every single time i cant seem to find any in same price level and if i do they are not well s-paced in time
I\’m not sure where you are getting this wrong, it is a fairly standard practice and quite easy to implement.
how can we identify support level for a stock which is continuously in a downtrend and resistance level for a stock that is continuously in an uptrend if we are not able to use a trendline (ie, not three points can be joined using the trendline for resistance or support)
We cannot identify S&R levels for stocks which are making all time high or low.
some stocks move faster than others for eg. Adlabs has a greater up/down move in 3-5 days time frame than a stock like SBI. How can we identify these fast moving stocks? Is stock Beta and standard deviation the right measures to do this?
Yes, beta and SD is a good measure for such movements.
Hi Karthik,
Thank you so much for this extremely informative articles. Even better is the fact that you\’re still replying to the queries after all these years :). Usually, in places like this, writers stop supporting the new readers. What I wanted to ask is:
Is the process of finding support and resistance same? that is, finding the range where price stayed the same or made sharp reversals? should it be acc to what we\’re trying to find?
for ex, let\’s say we\’re trying to find resistance for a long position we entered and the support points we find are based on trend reversals. If all of these reversals are from bear to bull, then it will not be a resistance, right? because buyer demand increases there.
Thanks for the kind words, Pratyush 🙂
Yes, the process is the same. These ranges are referred to as price action zone. So identify them, well spread across time and plot the S&R level. Also, please note – support and resistance levels interchange based on the CMP. So given this, today\’s support can be resistance tomorrow and vice versa.
I am a little confused with the idea of plotting S & R using formulae (S1, S2, P, R1, R2, etc.). The formula does not look for things like \”sticky zones\”, levels where prices have in the past bounced off from, etc., which is what S&R is all about. This appears to be a completely different way of looking at it. It only looks at previous day\’s OHLC data and nothing more. The steps that you have described above in the article have nothing in common with this approach. I am really curious – what am I missing here?
Yes, the one I have explained here is a visual concept and does not really depends on formulas. You must be referring to pivot levels.
Once a previous support or resistance level is broken how is a new level created? If the stock has broken support or resistance levels that was never broken, in other words it is trading at all time high or low, then how is a new resistance or support level created?
Stocks that have reached a all time high will not have a resistance. Likewise, a stock which has breached an all time low will not have a support.
I am a swing trader with a holding period of 5-10 trading days (1-2 weeks) and I want to target returns of 5-8% in that period. For plotting support and resistance zones, how long should my look back period be like? Is it fine to have a 2 years look back period for this purpose?
You could look at 1 year and then 6 months data. I personally think 5-8% could be a challenge, but anyway…good luck 🙂
is there any tool on zerodha pi or kite which lets us mark support and resistance levels of multiple stocks manually and upon reopening the chart later the marked zones are highlighted so that we can be aware that a particular stock is nearing support or resistance zone?
Check out save view option on Kite!
For setting target price, when should we use the different methods viz. risk-reward ratio based, Fibonacci based, support/resistance based etc. Since each of these are likely to give different values for targets is there any specific circumstance in which only a particular method should be used?
No, its best to go as per the situation. I\’d suggest you adopt one technique and stick to it during the trade.
when price breaks previous support or price breaks previous resistance, what does it exactly mean with respect to buyers and sellers? Does it mean that when previous resistance is broken then sellers that were earlier active in those price levels are no longer active and hence buyers are driving the prices higher and hen previous support is broken then buyers that were earlier interested to buy the security at those price levels are no longer interested and hence sellers are taking prices lower?
also i would like to know that when once support or resistance is broken why does it again at some point later become level os support or resistance in the future?
Moment support breaks it becomes resistance and vice versa.
Breaking a previous price action zone (could be support or resistance) invariable conveys a continuation in price momentum. One possible explanation could be due to the fact that the price could attract traders who traded at that level previously.
Hello sir,
first of all thank you for this wonderful module.
i am a beginner and i went through your TA module and found it really helpful. I am following what you told about being swing trader at starting and graduating over time to day trader.
but i have a question:
as you said to plot s&r using EOD data over a period of at last 2 years in the last chapter. i have been trying that but have failed for stocks like eicher motors etc that have continuously increased over last few years. please help me on your approach with few example like eicher, yes bank etc so that am comfortable in plotting s&r. Please sir help with respect to this via few examples which do not have such distinct peaks as given in your examples. Feel free to mail me at [email protected]. (explanation using snapshots would be really helpful)
further if i want to invest just for few days what should be the strategy of plotting s&r (i.e. should the time frame be 2 yrs for plotting s&r??) and what should be my look back period (should it be 6-12 months???)
Prashant, if your intention is to invest for few days, then I\’d suggest you look at shorter term time frame for plotting S&R. Maybe something like 6 months. This should help I guess.
Could you show us how we can estimate volatility using the Garch model? If it can be done using excel
I\’m not too familiar with the calculation of GARCH models. I will have to learn this myself to explain it 🙂
If a stock has broken a support level or a resistance which has never been a previous level of support or resistance in its history that can we assume that there must be some fundamental change in the stock because of which investors are betting on a likelihood of further fall or rise? and going by this is it safer to take a position on the ongoing direction of the trend (by checking other parameters also)?
S&R at uncharted territory usually indicates a strong momentum in stocks. This can happen for fundamental reasons. Yes, you can set up a trade here – I\’d prefer options here. But tracking such positions closely becomes very important.
Who buys when an uptrend has ended and the prices are continuing to fall from above and who sells when a downtrend has reversed as per all standard criteria and prices are beginning to rise after the steep fall? If we are to assume that only the novices are buying when market is falling and selling when prices are rising then will the huge volume figures justify that there are so many novices who trade most of the time like that?
Its the difference in opinion that makes up a market. At every price point you will find traders with different point of view.
Dear sir,
thanks for explaining s&r in a simple way, but i have a query regarding it that what is the use of volumes in considering support and resistance?
and
what happens if price crosses after a resistance with a good volume?
S&R and volume are two different topics. Its best if they confirm to each other. Price + volume increase beyond resistance is a great thing.
Hello Karthik,
I have plotted S&R levels, please let me know if it is plotted correctly. I hope i have not plotted many lines as S&R
https://kite.zerodha.com/share/U45BXGEUXA.png
Thanks in advance
Unable to see the chart. You will have to upload it somewhere I guess.
are these S&R levels plotted correctly. chart is for infosys. follow the link below for image.
https://ibb.co/ntg1kk
Yes, it look like you\’ve got them right.
Hello. How can I get S&R levels on Kite.. ?
Trend line as a tool is available, you will have to use it to plot S&R levels.
what is price action zones and how to mark it..please explain about price action zones
Explained in the chapter in great detail.
which chapter??…its not explained in detail anywhere(price action)
In this chapter itself, Vikash.
hello karthik sir.. first of all thank u for ur kind effort of spreading knowledge.. my question to u is can I use S&R tool instead of calculating it manually? I mean are these tools accurate?
I personally think S&R is a very visual concept and best done using the old school approach.
What if prices dont match at same level than how would i draw s&r?
What does it mean,
1. For a long trade, the low of the pattern should be around the support
2. For a short trade, the high of the pattern should be around the resistance
1—-If we are going long on stock, the CMP will be around resistance than how could the low be around support, it is necessary that the candlestick or price will be between support and resistance???
Can you explain it please ??i cant understand it
For all long trades, the low of the candle is the stop loss. Likewise for short trade, the hight of the candle is considered as SL. Keeping this in perspective –
1) It means that its best if the SL coincides with the support
2) Similarly, the SL should coincide with resistance
How many price point one can set and should set in chart?
I\’m assuming you are talking about the price action zone….if yes, then look for at least 3 price point.
No?, i mean to say how many S&R we can and we should add in chart?
Ideally 2 – one for long term and 2nd for a short term basis.
1 S&R for long term and 1 S&R for short term?
I am little bit confused about what long and short term mean in S&R cam you clarify my doubt.
Load the chart for a year or so and plot the S&R level…this is a long term S&R, now zoom in the chart to say 1-2 months and plot the S&R again, this will be short term S&R.
Suppose in long trade if CPM touched the reference price point, then who will buy the share if all of them are selling.
If it is a liquid stock, you will always have buyer and sellers at every price point.
Sir,What does liquid stock specifically mean?
It means you can easily buy or sell the stocks in which ever quantity you need. Also, when you place a market order in a liquid stock, you will not lose much owing to impact cost.Check section 9.2 – http://zerodha.com/varsity/chapter/nifty-futures/
Does it mean when the volume is high it is termed as liquid stock?
In a sense, yes.
Is support and resistance are only approximation of buying and selling at trigger price?
Yes, they are approximations.
Sir I am confused with this line. Please elaborate.
Entry – 442, stoploss – 446, and target – 435.
Entry is the price point at which you sell, stoploss the price point at which you book a loss and get out of the trade, target is the price point you hope will occur soon for you to profit from the trade.
At resistance point the trader should squareoff the trade,
Am i right?
Sq off if it is a long trade. You can even initiate a short at resistance (expecting a retrecement in prices).
while drawing S & R for swing and intraday trading . What candlestick time length should be taken? like 1 Day, 1 month, 15 min etc
Depends on the timeframe you are looking at. I\’d suggest you look at at least last 3 months data.
Dear sir, i am from bangladesh. i want to use rsi–(Relative Strength index) in Forex uses. which category time frame is best for trade ? RSI-14 Default but i want long period use.which is best ..Example. 7,14,21,50,100,120 . which is best please give me a positive Message. i wait for your Message.
Debasuish, I\’d suggest you try to calibrate your trade with 21 day period.
can we apply fundamental techniques like CAPM, sharpe ratio, jenssen alpha etc to calculate risk, return, target, entry price etc, while applying technical analysis methods in trading for short term?
Nope, at least not in any technique I know off. The ratios you mentioned are all portfolio/return metric which measures performance.
sir for intraday trading , what will the ideal look back period for marking support and resistance zone?
can we mark s&r zone within previous 5-10 candles in 15 min chart?
At least 15 trading sessions.
Hi,
I have a question regarding the stop loss and the target in a sell call. Could you please explain these ?
Can you ask the question in the relevant chapter please, thanks?
hi Sir, my query is on the \”points indicate sharp price reversals\” while identifying the S&R. can these points be high and low points of a SHADOW of a candle? or should it always be open or close of a Candle. Please clarify. Thanks.
I personally prefer the open/close points.
Sir,
you have mentioned that for short term S&R, load 3-6 months of data and for long term S&R, load 12-18 months of data.
Can you please tell what sould be the periodicity of these datas?
I mean daily or weekly?
Thanks.
EOD in both cases is good.
the maximum duration of 15 min chart is 60 days in pi. How do you see data for more than 60 days???
Once you select 60, a new option to select 90 opens up, once you select 90, you can select 120. By the way, 120 is the maximum time period available.
Sir….Can we used pivot point as support and resistance level ?
Yes, you can.
Hi, Karthik,
Please tell if you look at current chennai petro NSE chart what would be the resistance and support levels? Support I feel support would be around 256 (plus minus 5) as per method you told above.but resistance I can not guess. What is your opinion?
It seems to be at an all time high, hence can place a resistance. I\’d agree with your support level.
Thanks Karthik!
Appreciate that.
Welcome!
I have basic query. I was looking at Nifty Jan-Future daily chart and came across that Pivot and S&R calculation is different compared to pivot point calculation in ICICI direct. Why is this discrepancy? Isn\’t this should be the same?
Please revert.
Thanks
Both these methods take different approach to answer the same question. S&R (the traditional one) is a visual concept, while pivot points requires you to crunch some numbers. My dependence on the traditional method is higher.
Hi,
I am not clear on this. You said, \” S&R (the traditional one) is a visual concept, while pivot points requires you to crunch some numbers\”.
1. numbers that we work out for Pivot point and S/R are the same numbers that we plot on chart. Right?
2.Reiterating my question that why Zerodha and ICICI direct has drastic difference in result? Whatever be the methodology or approach, would not the final result be nearly same (with some tolerance)?
1) No. When you look at a chart and plot the S&R level, you tend to identify attributes that make up these levels (like price action zone, well spaced in time etc). Piovt point is a calculator which requires you to give price inputs and it will suggest a possible S/R levels.
2) Have a look at this – https://tradingqna.com/8843/technical-charts-google-finance-yahoo-finance-amibroker-match?show=8896#a8896
the zerodha pivot calculation and share khan pivot point calculation were different from each other and similarly I was losses created as per zerodha plotting in pivot level at kite meanwhile I was discovers those methodology why is different calculation plotted at chart in kite what exact result ? which one used demark,Fibonacci,or something else because standard pivot not match zerodha and sharkhan …let me know if asap by email plz
The formulas are the same, Arif. The charts could vary slightly for this reason – https://tradingqna.com/t/why-does-two-charts-of-the-same-timeframe-look-different-on-the-same-platform/4715/3
Voltas_daily_chart_last_6_months_Bearish_Engulfing.jpg
voltas_daily_chart_3_months_Scenario_1_Target.jpg
Voltas_15min_chart_10days_Scenario_2_target.jpg
Hi Karthik,
My question is for Intraday Trade. (It took me 2 hours to write this, so as to make it effortless reading for you and other users also get benefit out of this)
In some of the comments above you suggested that one should be looking for the 15 min chart with a look back period of 10-15 trading sessions for S&R. But in the actual reading material you mentioned 3-6 months for Intraday and BTST. So I am bit confused.
Here is a real and recent example for Voltas.
On 6-jan-2017, EOD. Voltas formed a bearish engulfing (Identified this pattern on the basis of daily EOD charts)
I want to sell the stock for Intraday (given all other items on check list comply).
Scenario 1
As I identified the candlestick pattern based on the daily chart, this becomes my rational for identifying the S&R (target in this case), so, I look the daily chart for 3 months. Based on this the target comes to be around 320
My trade setup is:
Sell price: 334 , SL: 347, target: 320
Scenario 2
If I look for 15min chart for last 10 trading session and the horizontal line for the target fits in 336. This target clearly does not make sense as it is already above my selling price of 334
My final understanding is (please correct me if I\’m wrong) – we should look for daily chart and not the 15 min chart for identifying the S&R for Intraday because we identified the candlestick pattern based on the daily chart in the first place.
Please provide you thoughts on the same.
I am unable to attach the screen shots that I have taken of the voltas charts
Sorry about the inconsistency, but really this depends on the chart. It does make sense to differentiate between intraday and EOD trades. For EOD you need lot more data points and much lesser for intraday. For example, when trading intra day, I look for the 15 mins chart with 10 day look back. However, if it fails to give a S/R level (remember same price action zone, well spaced in time etc) then I would extend beyond the look back period and dig for more data. So there is no hard and fast rule here…it really depends on the chart. However, please don\’t consider anything less than 10 days.
Also, remember the trade setup profile for intraday and EOD can vary quite a bit.
Which time frame i have to use is useful for positional trading ?
It really depends on the time frame you have in mind. For example for a 1 week time frame, I\’d be comfortable looking at 30-45 trading sessions.
Karthik, How do we say we have maximum sellers at the Resistance? is it based on the assumption that most of the market participants will follow the technical analysis/look at the charts and sell when resistance is reached ?
This is an empirical observation. Typically, at resistance points the price starts to decline. This happens because there are more sellers willing to cash out.
Sir,I am positional trader and i hold for 2 to 4 month.Which indicator i have to follow? S&R,RSI,BB,MACD,SMA?
S&R and SMA works best for the timeframe you work with.
I find the way of discussing different trading topics on zerodha varsity to be the best. You guys know very well what exactly newbie traders are looking for and how to perfectly deliver the right information required to trade successfully
Happy to hear that Anupam 🙂
Sir I\’m not able to look the chart exactly on your kite zerodha. How could i get three days chart to understanding all your indicators ( when I open 1day chart then why am I getting last two months chart.) My mean how can I understand your modules with kite zerodha
Thanks
Check this – https://kite.trade/docs/kite/#support
Hello,
Please tell me if I am doing right or not.
Every night I browse nifty 50 stocks for candlestick patterns on EOD basis.
If I find a recognizable pattern along with S&R ( plotted using 1.5 year data on EOD basis) compliance then the next morning I buy or sell the stock using (MIS) option, so I can leverage more .
Is everyhting I am doing right?
What I mean is, Is it ok to calculate the S&R using EOD data and then use that S&R for intraday trading ?
This is absolutely fine. In fact, I personally think identifying intraday opportunities based on EOD data is a great way to start.
Thanks Karthik,
Actually I have this doubt because most of the time when I do this kind of trade, the trade goes in opposite direction and I incur a loss.
I observed that the predictions i do using EOD data come true only after 1 or 2 sessions and not the next day.
Is it normal? Is that how it is?
Tricky, in this case you need to plan your trades with an intention of holding it overnight.
Hey Karthik,
What exactly does it mean to plot S&R on the basis of EOD data? Do we need to look at the daily time frame candlesticks or is it something else altogether? And if it\’s not too much of trouble then could you please illustrate with an example how to plot S&R levels for INTRADAY trading based on EOD data? Thanks in advance.
Regards,
Abudhar al Hassan.
The technique of plotting S&R remains the same. If you plot them on EOD (or daily time frame) then it becomes an EOD S&R, which is good for slightly longer term trading. If you plot them on intraday trading, then this is good for short-term trading.
sorry i didnt get what does EOD basis means ,
and what does MIS basis means?
EOD means, end of the day. MIS means \’margin intraday square off\’. I\’d suggest you start from the basics module and lay yourself a solid foundation – https://zerodha.com/varsity/module/introduction-to-stock-markets/
Hello Sir
Can you tell me, When we have to sell before resistance or after resistance if before resistance than how will we know that the current market price is below than resistance point or selling point. It is a buying or selling signal
Just confusing to understand please explain Karthik sir
Thanks
For initiating a short, you should look for an opportunity sell before the resistance point.
Sir,
Can you explain us how to draw base candle based on sam seiden\’s supply and demand level theory?
Will try and put it up sometime. Thanks.
Can this method be used for predicting the S&R?
Pivot Point = (H + C + L) / 3
R3 = H + 2 x ( Pivot – L )
R2 = Pivot + ( R1 – S1 )
R1 = 2 x Pivot – L
S1 = 2 x Pivot – H
S2 = Pivot – ( R1 – S1 )
S3 = L – 2 x ( H – Pivot )
Where,
H – Previous Days High
L – Previous Days Low
C – Previous Days Close
R – Resistances Levels
S – Supports Levels
Also, is this method suitable for long trade?
Yes, you can. Many traders use this method. However, I prefer looking at charts and identifying them on the charts itself.
Hi Karthik, which price to be considered while determining the support or resistance? The closing price/high/low? Not able to attach my file wherein i have drawn S& R levels of Nifty. There seems to be some issue as i am not able to see the ones attached by others. I am using Chrome/Firefox. Mailing it to Support.
I saw the email and the attachment, the support drawn seems to be fine. Its best to take the closing prices.
Unable to attach the pic and I am unable to find the attach option. Here is the alternate link. Sorry for spamming I think the above given link doesn\’t work. https://postimg.org/image/yjuipeihv/
No problem, I\’ve posted a replied.
Hi Karthik,
First of all thank you for this wonderful module. I have learnt a lot from these modules. Sorry for being an ignorant noob.
This is the only chapter I am having trouble with. I am having lot of trouble identifying the correct support and resistance level. I have attached the chart of Coal India from past 6-8 months. Could you please check it once and tell me what I am doing wrong. I am pretty sure selected points are wrong and getting very confused.
http://tinypic.com/r/4kcjg4/9
[IMG]http://i64.tinypic.com/4kcjg4.png[/IMG]
Gaurav – this looks alright to me. Why do you think there is a problem?
Hi Karthik,
Thank you afor the revert. Well actually the problem is I am unable to determine what exactly would support and resistance by looking at this chart. Also, I have checked couple of websites where they show support and resistance of a particular script. For Ex: http://www.niftylivecharts.com/supp_and_res_1300.php?input=COALINDIA
How reliable are they??
One last quest I saw support and resistance were changing on a daily basis on this website is it normal?
Not sure Gaurav as I;ve always relied upon my own reading as opposed to such websites. I\’d encourage you to do the same, only then will you develop a knock to identify trading opportunities.
Yes, S&R is a function of daily price moment, so it is absolutely normal for these values to change on a daily basis (based on the movement in the underlying).
Hi Kartik,
I have been reading and practicing your lessons but somehow i think i,m not applying them correctly.
ATTACHING A CHART OF ICICI BANK.I initiated trade on 22nd after gap up opening assumimg a bullish Harami for previous two days.I wish determine the S&R for this stock but am confused.
1)Can you guide me to determine
1)What is the S&R for ICICI bank
2)What is the patttern emerging on end of 21st Sept.
3)What should be the suggested trade action next day on 22nd when the stock opened with a gap up.
Thanks.
I don\’t know how to attach the screen shot with this message so sending it via email to support.
Not sure if ICICI formed a bullish harami. There is no downtrend at all in the first place, which is mandatory for any bullish pattern.
Why isit hard to identify the S&R for ICICI? I\’d suggest you follow the technique explained in this chapter, only then you can start identify better trades.
Hi,
I want to know that as you said there should be three points to consider and as of today if we talk about Reliance Industries whose price is 1065.80 which was 1065.45 on 13th Apr 2016 and 1077.35 on 13th Jan 2016 so in this case how can we decide which one will be the Resistance point and support point and my second question is that if there is a bullish trend and people know that the prices will rise so why do people sell in the market and how come the traded wanting to buy the shares get the share from.
I will try to answer the second part of the question. Suppose a stock is uptrending, everyone who have bought some shares are making profit. But remember that the profit is not realised, meaning they still don\’t own the extra money; they actually own the stock. The money will be received only after selling the stock. This phase is called profit booking. So Suppose a large number start doing the same, it will tend to bring the stock price down because of the selling pressure. For an uptrending stock, this is called a dip. If things are moving smoothly as before then after a certain number of trading sessions, the stock will resume it\’s rally. I hope I cleared your doubt.
S&R is never really a single price point, its best if you consider it as a range within which the support or resistance exists. In this case I\’d assume the entire region between 1065 and 1077 as a region where S&R exists.
So Karthik you mean to say that 1065 will be the support and 1077 will be the resistance, am i correct?
That really depends on were the current price of the stock is. If it is below 1065, then I\’d tread the entire region between 1065-1077 as resistance…and if the current market price is above 1077, then I\’d tread the entire region between 1077 to 1065 as support. The point is, S&R is not a single price point, but instead its best if you treat it as a price zone.
Hi Karthik,
If i want single price point between the range of 1065-1077. Could i calculate the average of the range. I mean (1065+1077)/2 = 1071 is single price point. Is it valid method?
Thanks in advance.
Yup, but this also depends on why you need to calculate the average.
For 1 Hour chart, is it best to plot S&R level with the look back period of 4 Months?
In the grand check list you have mentioned look back period is 6 Months to 1 year and in some other area up to 2 years for plotting S&R.
As per your experience what is the best look back period for the swing trading with target of min 1 day to max 5 days?
I\’d suggest you look at at least 6 months for swing trading.
Sir one more question with above question, for intraday trade what timeframe will be suitable to plot s&r on chart…???
15 mins is good.
Hi sir, it\’s a wonderful initiative by zerodha to educate people about market…. I have attached a link of crude oil mcx chart…if I want support and resistance for intraday what would be that…..??? I am unable to find any meaningful resistance….so, please help me about it….and for intraday trade what should be ideal look back period in case of such commodity….??? Thanks in advance sir…..link:- http://m.in.investing.com/commodities/crude-oil-advanced-chart
Hi Abhay – It is very easy for me to just tell the S&R levels, but I wont do that as the purpose of this platform is to educate people :). So please tell me which part is difficult and I will be happy to help you there.
For intraday lets say 15 mins time frame, a good 5-6 day lookback is great!
Hi
In calculating the S&R prices, we are using only price action zones.
What about volumes?
Can we correlate this with volume profile?
Like the peak (with some tolerance)of the volume profile closer to the S&R prices tells us that this stock is bought and sold at this price maximum.
Thanks!
S&R is a concept developed based on prices…but in cases where you see a breakout above the resistance or breakdown below the support, make sure there is sufficient volume. This is perhaps a good way to certain its validity to some degree.
Since pivots in kite works better than standard formula
what is pivot level formula is used in kite since levels doe not match with the standard formula ?
Ah! This would be difficult to figure out as we have get the charting package from a vendor.
hi Sir,
please let me know, can we get leverage facility from day 1? mean if i am new trader with yours , then i can get leverage in first month ? kindly explain.
Yes, you can. We have the same rules for all traders.
Sorry Sir if question is silly but i am confused
Say I find Bullish Marubuzo and the stock I am following only have resistance point (no support point).Here I know what should be my target (=resistance point) but as per your second point in checklist stoploss should be around support point which stock does not have.
Can such situation arise where stock has either resistance or support but not both.If yes then what should i do in above scenario???
No question is silly Vishal !
Yes such situation can arise especially when the stock is at an all time low. In such cases, I\’d advise you to have the low of the Marubuzo as the SL.
I actually have a similar doubt. Suppose a stock is trading at all-time high. And there is no history of price action zones available. Then is there a way to set a target?
It would be very difficult in such a scenario.
Hey, I have read this chapter and I found it is very useful.Just one doubt, how will we find support and resistance levels of stocks which is nearly all time(or within required time frame) high or low.If we can\’t find how should be set the target prices for these shares and what alternate paramete can we take into account to buy or sell?
Shares at all time high will have no resistance and will have only support. Likewise shares at all time low will have no support, but will have resistance.
Greetings Sir,
While plotting S&R levels with a look back period of 2 years, what should be my ideal time frame of candle (Daily, Weekly or Monthly) to plot these levels?
Thank You.
Regards
Daily will be suitable as it is stated in the module that as many candles as you can gather will help you to identify the price action zones. So for a look back of 2 years daily will be the best.
if price has come down from certain point for only one time will it qualify for resistance?
plz refer the diagram
should this point be referred in future?
Nope, the price level should be tested at least three times across time.
Is there any content on trading with Triangles? Here is an ascending triangle setup for Tata Motors.
Have not discussed triangles in Dow Theory, however the chart you\’ve posted certainly look like one.
Hi Karthick,
Very thankful for your quick reply.
one more doubt about the time frame. The time frame (5min, 15min, 30min) trend to indicate either the past or upcoming (5min, 15min, 30min) time frame event?
Consider this, time now is 9:50 AM, and you open a 5 min chart…
Open will be the tick at 9:50 AM
High will the highest tick between 9:50 to 9:55
Low will the lowest tick between 9:50 to 9:55
Close will be the closing at 9:55
Hi Karthik,
Good day,
Are we following any ratio for trailing stop loss order (Target (Sqr.Off Sell/Buy) Price, Stop Loss Sell/Buy & Trailing Stop loss ticks)? Because, we are missed profit or loss incurred in intraday market. Are you give any suggest about this query.
I observe about on trailing stop loss article on z-connect the below trailing stop loss are:
1. Sqr.Off (Target) Sell/Buy (Absolute) – 10.5 pts
2. Stop loss Sell/Buy (Absolute) – 15.5 pts (15.5 pts – 10.5 pts = 5 points up – 52.38% from Sqr.Off (Target) Sell/Buy)
3. Trailing Ticks (Absolute) – 2.5 pts (50% of 5pts Stop loss Sell/Buy)
We are observing from here below the information getting:
Target – 10pts from entry points
Stop Loss – 5pts (10/2 – 50% of target)
Trailing – 2.5pts (5/2 – 50% of stop loss)
Is this correct for trailing stop loss ratio or anything idea about this related query?
Thanks in advance Karthik.
Trailing SL helps in locking in your profits…you can do it with BO orders. Else you can do it manually with the way you have suggested, both are good in my opinion.
how to draw S&R for company after stock split. e.g- infy and avantifeeds. As stock whch is available at rs 2000 will be available around rs 1100 from next day after stock splits in the ratio of 1:2, so all values changes
The charts are usually adjusted for splits/bonuses to make it appear continuous.
plz see chart of avantifeed…..here chart is not adjusted after stock split
I suppose this will get fixed Rohan.
Hello Karthik.
Wish you a great happy new year.
Just one question.
As discussed in the chapter for intraday 6 months graph to be taken for plotting S&R. Suppose if I\’m only intrested to trade on index like nifty and BN then what will be the best time frame to consider for plotting S&R as only near month contracts are having considerable volumes. And also lemme know is it fine if I would consider 15 minutes candlesticks for recognising candlestick pattern.
Thanks in Advance ?☺
Happy New year to you as well!
Even for indices you can take 6 months look back period.
Yes, 15 mins is good for intraday trading.
Thanks Karthik.
Welcome!
Hi Karthik,
Finally S&R started making sense to me thanks to you guys 🙂
Two Queries:
1) Any comments about my below S&R. Does it mark all the important levels? If anything is missing kindly let me know
2) Are the levels marked in red circle valid? I mean those are mostly for range bound right? So, can those be considered as a valid level?
Thanks Karthik 🙂
Yes! It does make sense and you\’ve marked them well 🙂
Nice 🙂
Thank You
Welcome!
hi,
what does range bound means?
and isnt only 180to183 level is good for resistance
If the stock is trading (consistently) in a price band – like between 100 on the lower side and 115 on the upper side, then the stock is considered to be range bound. 180 – 183 is just about 1.5% or so. Not good enough to call it a range.
Karthik bro,
which S&R technique gives us more accurate result:
a) one you have mentioned in this chapter
b) bollinger band
c) pivot points
For S&R I would suggest you use the technique we have discussed in this chapter.
Thanks bro.
Happy New year 🙂
Wishing you the same!
Hi Sir,
I got confused on the stoploss values.
Considering your first example, of Ambuja cements
Entry – 206, Stoploss – 202, and Target – 215, and the trader would perform a long as it is a bullish Marubuzo.
What does stoploss of 202 here signifies. (I believe SL is a value defined to minimize the loss occuring in a trade)
So here, when the current market price lowers to SL value, does that mean the trader can buy the stocks @202.?
And similarly why do we set SL as a higher value during short?
Request you help here please…
The stoploss price level is the level at which you decide to close the trade and book a loss as the trade is going against you. So in this case you enter a long position @ 206..but for whatever reason the stock starts the fall, then you will close the position @ 202 and book a loss of Rs.4/-.
In case of short positions, you will be profitable only if the stock falls further. Hence the stoploss is always a higher price when compared to your entry price.
Dear Mr. Karthik
Greetings for the day.
Below mentioned details have been posted in Technical Analysis Part 2 chapter 11
Mr. Karthik, Today (24.11.2015) I was trying to find out target of HDFC Bank for intraday with the help of Support and Resistance level. Below mentioned is my observation:
After opening at 9:15 am HDFC Bank was not able to break Rs 1070.45 and was moving down and coming upto 1070.45 and traded approximately 31 candles. (may I consider it as resistance level???)
On 32 Candle, it broke the same and went upto 1073.50 and keep trading there for long time and start declining but keep on going up after touching 1070 upto 17 times. (May I consider it as support level this time???)
18th Candle was Bearish Marubuzo (Red, O 1070.20, H 1070.20, C 1070, L 1070) is it right???
19th Candle Bearish Engulfing (Red, O 1070.50, H 1070.50, L 1069.20, C 1069) after this HDFC Bank has gone down.
Is finding Resistance earlier (1070.45) and support (1070) correct? May I consider 1070.45 as target if bought @ 1060 (bullishness) and 1070 as target if sold @ 1073 in bearishness.
I request you to kindly guide.
Guess I answered this earlier.
Dear Mr. Karthick and friends,
Greeting of the day.
Mr. Karthick, Today (24.11.2015) I was trying to find out target of HDFC Bank for intraday with the help of Support and Resistance level. Below mentioned is my observation:
After opening at 9:15 am HDFC Bank was not able to break Rs 1070.45 and was moving down and coming upto 1070.45 and traded approximately 31 candles. (may I consider it as resistance level???)
On 32 Candle, it broke the same and went upto 1073.50 and keep trading there for long time and start declining but keep on going up after touching 1070 upto 17 times. (May I consider it as support level this time???)
18th Candle was Bearish Marubuzo (Red, O 1070.20, H 1070.20, C 1070, L 1070) is it right???
19th Candle Bearish Engulfing (Red, O 1070.50, H 1070.50, L 1069.20, C 1069) after this HDFC Bank has gone down.
Is finding Resistance earlier (1070.45) and support (1070) correct? May I consider 1070.45 as target if bought @ 1060 (bullishness) and 1070 as target if sold @ 1073 in bearishness.
I request you to kindly guide.
Lalit – When you look for S&R, it is always good to check on a EOD basis and identify the price zones. Yes intraday also is possible, but I persoannly prefer to do this on a EOD basis.
Sorry, have not seen the HDFC bank chart, so cant really validate the patterns.
6 months chart is here…Support aroung 79-81 right? Please help in finding out resistance for the same…
As I said, stock is at an all time high, so no resistance.
Hi Karthik,
Here is the chart IDBI, Formed a Bearish Engulfing Pattern.
My question is i could not able to find resistance for this because it is making new highs, As you mentioned, for a short trade, Resistance should be around Stop loss price. As i could not able to find out how can we approach this one? Your views please…. I checked in 6 months chart and 1 year chart.. I am attaching both charts here..Please correct me if i am wrong in identifying the Support in 6 months chart..As of my knowledge it is around 79 to 77 right?
Since the pattern has occurred at an all time high, keep the high point of the pattern as SL. Good luck with the trade.
Hi Karthik,
Please help me in drawing Support and Resistance for the IDBI bank also? I have encircled some points which all are mentioned as Sudden Price movements?
Please help me to identify
Hesitated to move up further after a brief up move
Hesitated to move down further after a brief down move
Sharp reversals at particular price point
and Align the price action zones and Fit a horizontal line.
You\’ve got this right!
Hi,
Can you help in drawing the Support and Resistance for the attached IDEA 6 Months Chart?
and Can i expect last 4 or 5 candles as Dojis and Spinning tops?
150 seems like a support area. Yes, the last couple of candles represent dojis and spinning tops.
Hi Karthik,
Hats off to you guys for writing such simple articles for dummies like me! Very well explained..
Have this doubt, please see if you can help me here.
After examining daily charts of stock, if I have identified the stock can be short sold, how do I set the target for the day?
I can set this to the support level, but cannot except the stock to reach support on the same day (since I am looking at daily chart), whereas the position has to be closed intra-day. How do I trade this scenario? Close position today and sell again next day?
Thanks Hari, glad you are liking Zerodha Varsity.
You can do that – as in initiate the trade the next day again or you can short it in Futures market and carry it forward till you deem fit.
Sir I have written two blogs on Tatamotors and Yesbank price movement on the basis of Support & Resistance. Would you please share yours views on it.
Yesbank: http://toshniwalrahul.blogspot.in/2015/09/as-on-22-08-2015-at-0047-technical-call.html
Tatamotors: http://toshniwalrahul.blogspot.in/2015/09/as-on-22-09-2015-at-0116-technical-call.html
Warm Regards,
Rahul Toshniwal
Saw the post, I hope your strategy works well for you, good luck 🙂
Although I personally would not invest in Tata Motors since I don\’t really like investing in companies with high debt (this is just my personal view).
Hello Kartik,
I read this module long back since then I was skipping one question I wanted to asked. Finally i made up my mind to ask it. What i understand that at support (demand Area) we shall go long and at resistance (Supply area) we shall go short or sell. But you are saying that the candle pattern should match with the S&R and stop loss shall be at S&R. It means at support we are selling (SL) whereas there we should buy as the stock is suppose to bounce back after hitting the support. Is it not contradictory. What i feel actually the SL shall be little below the support if it is broken then one will come out of the trade. Pl. through some light.
Thanls
RPHANS
Please do not hesitate to ask questions – only if ppl ask we get to learn!
What you said makes sense, in fact that\’s the reason why I do not consider a single price point as either support or resistance. In fact the S&R should always be regiod (price band).
A breach below support could be nasty, hence the reason to get out of the trade near S&R region
Hi Karthik,
I have the same question as R P Hans.
What I want to know is ->
1. How much percentage up and down of the support line shall the support range be considered?
2. The SL shall be in this range or above the lowest Support point? Where shall the SL be kept?
Thank you in advance.
1) At the most 3-5% max.
2) Preferably the lowest support point.
hi sir , i read the whole chapter about support and resistance but still not able to draw support and resistance line .sir i attached tata steel 2 yr price graph plz explain me support and resistance in this case ..thanks in advance
Pravin – Can you please tell me where you are facing a problem in drawing S&R lines?
Sir,in order to find support and resistance basis thing required to identify the price that displayed at least one of the following behaviour
1. Hesitated to move up further after a brief up move
2. Hesitated to move down further after a brief down move
3.sharp reversal at particular price point .
Sir I am able to find such type of behavior in stock that are sideways ..but facing a problem to identify such behavior in stock that are countinusly in downtrade like tata steel sir in such case how to identify support and resistance zone ….sir plz tell me what are the support and resisatance in above uploaded tata steel graph …..thanks in advance ..
Tata steel is making new lows, so it would be tough to estimate any support for this stock. Worst case maybe 230.But of course for other scrips you can stick to the method you have described….but also makes sure the price action zone is well spaced in time.
Ok Sir, Thanx a lot.
I think the time shown here is not +5.30 GMT i.e. IST but -5.30 IST
Need to look into this, thanks.
Sir, in step 4, there are enough price action zones to find the support level of Ciplawhich is around 429 as CMP is around 442 but there are no price action zones to identify the resistance level of the stock. How to find resistance level in such a case? please guide.
I\’m assuming the stock is at an all time high here. If the stock is at an all time high, then clearly there are no prices to draw a resistance and hence not possible.
What should I do after the stock breaches the resistance level and starts going further upwards?
Which indicators will help me in deciding the further movement of the stock?(or does the situation become purely speculative?)
Once it breaks the resistance the changes of the stock picking up steam is quite high. Moving averages helps you track momentum quite well.
sir please check if the blue line marked as a support line is correct or not? and how can i mark the resistance line on it?
P.S.- it in a chart of 12 months
this is the image
I think the support line is placed quite well. Use the same techniques that you used to place the support line to mark the resistance line…just ensure the resistance line is above the current market price.
[…] two blue lines on the chart are horizontal lines drawn to indicate my expected levels of support and resistance. Instead of having to go to the marketwatch, use buy and sell orders, I can very easily place a buy […]
Excellent explanation. Thank you very much.
Most welcome 🙂
Dear Mr. Karthik,
When we are trying to work out the target (to eventually evaluate the Reward-Risk Ratio), do we need to consider Moving Averages which are near current price as possible support or resistance, in case they are closer to the price than the SR identified as per process indicated in this chapter?
Also does the slope of a moving average line (up/down/flat) have any implication as to whether they are more likely to act as support or as resistance?
Thanking you again for your efforts,
Deep
The slope of MA matters when we are in a good trending market. So I would suggest you develop a sense for the price levels based on the traditional S&R technique and also evaluate the slopes. Also in most cases where the market is trending, the MA will be below the price, making it a good support rather than providing for a resistance (hence targets).
Thanks, but does this mean that I should look for long setups only in those charts which have the moving averages strictly below current prices and the target resistance level is that as determined by the process in this chapter?
Also what will happen when the market tends to trade range bound for considerable periods of time, in which case moving averages will be in between current price and traditional resistance? If we wait for price to go above the MAs then the risk reward ratio at those points would become unfavourable.
Thanking you once again for the great work and taking the pains to promptly reply to each query.
Deep
In case the price is trending lower, MA will be below the CMP, so you can use it as resistance level aka stoploss. Also, MA does not really work well when the markets are range bound. So Make sure you stick to traditional S&R for range bound markets.
Thank you very much for extraordinary effort. I had a query
So at a nutshell it seems to me you are suggesting to set the TARGET at RESISTANCE , when STOPLOSS ~= SUPPORT ( checklist point 2) for a bullish trend stock. am i right ?. I feel you end up fixing TARGET or STOPLOSS quite far than necessary. Please advise.
also how many candles do you suggest to consider for 5 mins interval candlestick graph to arrive at a decent support and resistance ?
Perfect, in most of the cases target = resistance and SL = support should suffice. Also the price may look far from necessary only when you initiate a trade which is away from support. So always ensure for your long trades the support is close to your entry price. For 5 mins, at least look for last 2 – 3 days of data…that should be good.
Hi Karthik,
Thanks a lot for this wonderful module on TA. I started to practice drawing support & resistance levels on chart. I took latest daily chart for SBI. It would be great if you can clarify following points:
Are price action points marked correctly here? I have taken 1 year daily and tried to mark points as per step2) in this chapter.
After drawing lines through price action points, i am confused whether resistance level is 280 (which is already crossed) or is it 290
Is the support line marked at 255 correct?
If I am computing fibonacci levels, what are the high & low points to be considered in this chart (335 & 190) or is it (335 & 235)?
Thanks
Glad you are liked the module 🙂
1) Resistance and Support are price action zone which change based on the current market price. All price action points above CMP is the resistance and all of them below CMP is the support. Hence based on the pirce what is support today can become resistance t\’row
2) Yes, you have market the levels quite well. However I dont like too many lines on the chart (this is just my personal preference). I just like to place 1 line above the CMP to identify R and one below to identify S.
3) Going by the above 2 points, 290 is the resistance as the CMP is below the 290. Also whenever you are in such a confusion, its always safe to assume that the S or R is somewhere between the two price levels i.e 280 to 290. No harm doing so, in fact its better this way as you will naturally adopting to a conservative approch
4) 255 is certainly a good support as it covers at least 3 price action zones
5) 235 to 335 should do good for the fib levels I suppose.
Thanks for the reply Karthik
Welcome!
Sir, Is it advisable to keep Stop losses as mentioned below for different time frames i.e Short to Medium term.
2-3 DAYS – 1 WEEK – 9 DEMA
2-3 WEEKS – 20 DEMA
2-3 MONTHS – 50 DEMA
I would buy the stock after it forms recognizable candle stick patterns and other parameters such Volume, MACD Cross over, RSI are favourable and to keep a stop if stock falls below the mentioned EMA Can I exit. Regards
The most easiest way of placing a SL is by looking at the support or resistance level. So in a way the EMA can also be treated as support levels. I personally prefer to keep SL based on individual stock volatility. In the on going module on Options I will discuss this technique.
Kartik,
In support and resistance, you have mentioned BTST trades. What is BTST and these trades are for intraday or EOD
BTST = Buy today sell t\’row, the same is explained in this blog – http://zerodha.com/z-connect/queries/stock-and-fo-queries/btstatst-buyacquire-today-sell-tomorrow
Request you to go through the same.
BTST = Buy today sell t\’row. You can read more bout it here – http://zerodha.com/z-connect/queries/stock-and-fo-queries/btstatst-buyacquire-today-sell-tomorrow
Hi Karthik, let me tell u ..u are doing a commendable job with this modules and they are absolutely wonderful and very informative.
I wanted to that whether this T.A. applies well with commodity like Gold and Silver too? I want to trade in Gold and Silver. I wish to know what are factors which affect gold and silver price, what should be looked into before trading, T.A works on it or not? Well i need little details please.
I would be grateful to you for your time and efforts 🙂
Hope to have reply asap 🙂
Akash
Glad to know this Akash. We are trying to put the best possible efforts to deliver the most practical and relevant content to our users. The principles of TA can be applied to any asset class as long as it has the right time series data (for example – date wise OHLC, volume information). So going by this, yes you can apply TA to all commodities including Gold, Silver, Crude Oil, Copper etc. Of course the fundamentals of these commodities change..but that is a different topic all together.
Karthik can u help me with that? can u point me in that direction or some link where i can see and go through those fundamentals.?
This is great book on this topic – http://as.wiley.com/WileyCDA/WileyTitle/productCd-0470012188.html
Thank u so much Karthik 🙂
Welcome 🙂
Hey Karthik, i think this would be one of those rare cases when a person thanks the other for not agreeing 😉 Thanks a lot !!
Hi Karthik, i got an insider info that some traders/operators have softwares which show the stoploss value assigned by other traders and hence take undue advantage. Is it reality? Is it legal? If it is, then what is the relevance of putting stoploss?
No Rahul, as far as I know exchange does not give out order book details just like that. You can subscribe for L2 data which would reveal the orderbook…but honestly doing such things is not easy (at least to the best of my knowledge). So don\’t worry too much about all such things, they are just rumors.
Hi Karthik,
when we can say that support and resistance has been decisively penetrated or breakout. support we have taken a long trade on support level and no definite candlestick pattern is available like doji. Now assuming that the trade will go up where the stop loss can be placed in case it breaks the support level and go down.
When you take a trade based on support or resistance, please ensure that the SL is placed at pr very near to the S&R region. For example if I have bought a stock because it has a support at 75, then my SL will be somewhere between 72-75. If it goes below say, 70 (preferably on closing basis), I will exit the trade at a loss the next day. However the next day the stock gaps up and starts trading over 75 I will continue with the trade.
thanks just to clarify that i was talking about intra day trade and not positional trade….in Intra day trade is it ok if we place the stop loss just below the support level (say .5% of the stock price) and exit the trade if 2nd or 3rd candle breaks the support and hit the stop loss…please advise and thanks in advance for all your support and answering our queries.
Absolutely, you can (in fact you should) be doing the same. In intra-day if the stock breaches the S&R, just wait for few candles, gauge the overall sentiment and then take a call. Sometimes the reaction could be swift where it breaks a tough S&R level and it starts bleeding heavily, in such situations you should be quick to close the position and take a minimum loss.
Dear Zerodha,
I\’m customer of zerodha &
i\’ve few queries please resolve .
1) What is the difference between BUY STOPLOSS ORDER & SELL STOP LOSS
ORDER ? Explain With examples, like taking SBI/PNB/RELIANCE.
2) What is the big difference between TR.PRICE & PRICE in Buy Stop
Loss Order & Sell Stop Loss Order with Examples required…
3) I\’ve Scenario for you :-
Stock :- SBI, Qty :- 100, Product Type:- CNC, F1:- BUY.
a)LTP:- 300. Time: 3:20 PM.
b)LTP:-295. Time : 3:25 PM.
d)LTP:-290. Time : 3:27 PM.
c)LTP:- 300. Time: 3:30 PM.
Here the best buy is @ 290., Any How there\’s BEAR & BULL @ 3:25 PM &
3:27 PM & at 3:30 there\’s Sudden rise Bull.
My question to you is :-
a) I\’ve to Lock Buy Position @ 295, But as soon it reaches @ 290 order
should execute. If it doesn\’t come @ 290, Atleast it has to Buy @ 295.
How to achieve it ?
This question is little tricky, Please think well and answer..
b) Can we utilize the BUY STOP LOSS ORDER, PRICE, TR.PRICE Privilege ?
If so, How in Zerodha , F1 Tab, What has to be Tr.price & Price ?? How
to execute the best buy here…
Please Note :- I know the concept of limit order…
4) Another SELL Scenario:-
Stock :- SBI, Qty :- 100, Product Type:- CNC,
a)LTP:-315. Time : 9:20 AM.
b)LTP:- 325. Time: 9:50 AM.
d)LTP:- 305, Time : 3 PM
e)LTP:-300, TIME: 3:30 PM
Here the best sell:- 325 @ 9:50 AM. Any how human will get fear when
it\’s going down, In the above scenario, there\’s variation of BEAR &
BULL. I would like to LOCK Profit @ 315, Time : 9: 20 AM. But best
Sell is 325 @ 9:50 AM.(BOOK PROFIT IS @ 325).
How to execute these orders USING SELL STOP LOSS ORDER ? WHAT SHOULD
BE MY TR.PRICE & PRICE ?
Nagesh, we have a very interesting blog on the types of Stop Loss orders which you should read thoroughly to understand. It has some scenarios that you describe already explained.
Since you wish to block profits, I think it\’s best for you to use Bracket Orders. With Bracket Orders you have the luxury to enter your buy price, target price, stop loss and also your trailing SL. You should read this blog to get a better idea on it.
T u ok,we draw s&r as u explain how can I expect as graph will be smerged &what is the validity of this. Is it silly.sorry
You can in fact do this quite easily on the charts…in fact I have explained the whole of TA by using PI.
Where can i find ta by pi
I\’m assuming you trade with Zerodha. If yes, request you to shoot an email to support at zerodha dot com.
Hi Karthik,
You have mentioned that the stoploss should be around the S&R . Let us say in a long trade the stoploss is little above the support level. Now the stoploss has been breached and the price is about to touch the support level. Should I now exit as the stoploss has been breached or stay as it is around the support?Please explain.
Thanks in advance.
Let us say in a hypothetical long trade situation the support is at 95, and the candle\’s low is at 98. Because they are so close, i would as well consider the support level as a the stoploss.
SIR,IT WILLBE TIME CONSUMING TO PLOT RES,SUPP FOR INTRADAY WHY CANT U PROVIDE DEFAULT IN PI.RATHER THEN THIS LONG PROSES FOR E,STOCK ITS BETTER TO SCREEN SOME WEBSITE&GET ACCRATELY&QUICKLY
Thanks for the suggestion. S&R is a very visual concept and it requires some amount of calibration (which has to be done manually). For this reason its best if the trader can plot it himself. Also, once you get a hang of it, it just takes couple of seconds to plot the same. After all, some hardwork is required to make some money in the markets 🙂
Is it correct to say that 200 SMA is a support / resistance level?
Yes, 200 day average represents roughly 1 year of trading activity. When the stock price comes down to the 200 day average many traders/investor tend to buy it therefore giving it the support.
As mentioned in the chapter, For intraday minimum 3 to 6 months data to be loaded for finding S&R. If iam using 5Mins/10Mins candlestick pattern for decision, what\’s the time period(Candles) to be loaded for S&R?
For intraday, load at least last 3-5 days 5/10mins data for plotting S&R.
Hi Karthik,
In Pi I can only see 15 min chart. Can\’t I view 1 min chart.Also, can I use any recongnizable candle stick(like Marubuzo or doji) on 15 min charts?
Yes, you can apply all the recognizable candle stick patterns on a 15 min chart. Btw 1 min chart is also available on Pi.
How can i get support & resistance levels automatically in the chart while intra day trading? Can i calculate using pivot point? If using through pivot point how much the success rate?
The only way to calculate the S&R automatically is by calculating the pivot levels. I personally don\’t rely much on it, I prefer the old school method of plotting S&R levels.
Pivot level is a new term for me.. can u plz in a line or two explain me abt it??
Pivot helps you identify the support and resistance points based on few simple equations. This is different from the regular method because the traditional method is more of a visual concept where as pivots use OHLC data as inputs to the equation.
Which software do you use for technical analysis?
Have been using Zerodha Pi for a while now.
The zerodha pi software isn\’t available for macbook pro users. How do i use zerodha pi on my macbook?
I\’m really not sure on timelines on this, request you to email [email protected]. Thanks.
First of all thanku so much for sharing such useful knowledge about stock market which is very helping to beginner like me.sir I have a query….
As you advised that if a trade is initiated we should wait until it get eighter target or stop loss otherwise trade get bust.
Sir suppose one bought share of xyz at 100 rs price stop loss is 95 and target is 110 .If price reached to 107 and one is willing to sell at this price.is it wrong…..Can you pls explain…
Well, if you think 110 is a reasonable target, then ideally you should wait. Else there is nothing really wrong booking a profit at 107.
thanks for Your Effort
Hi Karthik,
Thanks for this wonderful blog.
When will you release Futures trading module. I am waiting for it .
Thank you!
Thanks Ram. The first 2 chapters of Futures should be up by t\’row. Please do watch out for the same.
That\’s great.. When can I expect other chapters
The first 2 chapters are up today, t\’row maybe another one. Will continue to add more chapters through out the next week. Thanks.
HOW DOES ONE KNOW THAT THE SUPPORT OR RESISTANCE WILL HOLD OR BREAK . IN CASE OH V SHAPE MOVEMENT OR STAYING FOR SHORT PERIOD FEW CANDLES , IN CASE OF MARKET STAYING SIDEWAYS IT IS CONSIDERED AS BREAK OUT OF THE SIDEWAYS ZONE .
The more number of time the price tests the S&R level, the stronger it is considered. Of course there is no guarantee that these levels will hold up. It is just an intelligent estimate.
then how to trade just gamble by taking all the trades at support and resistance .
No, if fact that would defeat the purpose. The idea is to take up only those trades that qualify through a checklist…and here is the checklist that I\’m talking about – http://zerodha.com/varsity/chapter/finale-helping-get-started/
Thank you sir
Hi sir,
what should be the support of unitech. i think it already breached it..that is 17 . then … what should be new support
I\’m posting this for education purpose only 🙂
Unitech has a support zone between 16.10 and 16.75. I have attached the chart where I have connected at least 3 price action zone (as described in the chapter)
900 is a valid support…I guess 950 also serves as a short term support but it lacks the 3 price action zone as required.
Is the support line correct on BOB which is around 900
Hi karthik,
Ihav come across some charts today where some reversal patterns appear above some previous gaps and reversed.. can i consider previous gaps as supports and resistances..???
I personally don\’t like to considered gaps as a price action zone and hence prefer to avoid gaps for S&R considerations… but thats just me :). I would suggest you dig up more price history to evaluate the presence of historical price action around the gap price level.
Hi Karthik, Thanks for the lucid explanation. Would you let me know,while plotting S&R for Intraday trading, 3-6 months of EOD data or any other time frame data(like 15 min. data of 3-6 months) to be taken into consideration.? Thanks.
For intraday I would suggest you plot the S&R on 15 mins candle with a look back period of at least 2 weeks (10 trading sessions).
Sir, your explanations are very helpful and informative as i am new to trading. Can we apply this 2 week R&S method for both Equity-Cash trade and Stock Future also?
Yes, you can certainly do this!
Hi Karthik Rangappa,
In case of swing trade shall I select 1D time frame of (3-6) months or shall I select some other time frame?
The reason I asking this question again is because, I am finding challenging to find few specific S&R in the time frame of (3-6 Months) by keeping 1D time frame.
Appreciate any of the community member feedback. Thanks
1D is good, Dave. To plot the S&R, you can even increase the time frame to over 6 months. This should not pose any problem.
you can see the candle stick patterns being formed and take the , next trade ex if there is a doji high becomes resistance , or a pin bar high becomes resistance .
hi actally i want to know how we attach file or picture image along with these comment
You can upload on Google drive and share the link here.
sir ,what if a stock is trading at a record high price what is the resistance ?
We need to have price history to identify S&R levels. Hence if the stock is trading at an all time high, plotting the resistance is not possible.
Dear Sir,
In the above first chart , You plotted 215 as the Resistance point , But My doubt goes here ,how you came to that point that chart is resisting at 215. not even 216 or 214 . Or how i can fix a resistance point . In the said chart many candles are traded above 215 i think in chart it shows 240 ranges. or you confirm it with any candle patterns???
As I mentioned in this chapter, it would not be a wise idea to take a singe price point as a either support or resistance. We should consider the region in and around the price action zone as a S&R. For example if the line coincides with 215, I would be happy to treat 211 to 218 as either support or resistance.
Sir, I have read almost all the chapters and its really useful. Can you plz tell how to use trailing stop loss, should it be based on any indicator or manual stop loss. Require for intraday/ positional. Thanks..
For both intra day and positional it may not be a great idea to base your trailing stop loss based on a typical indicator. It should preferable be based on a preset condition. For example…for every 2% move in your direction you may want to trail the stop loss by 0.5%.
Sir, can you/anyone please tell me… what is difference between manual stop loss and trailing stop loss :-)…
In fact both Manual stoploss and trainling stoploss are manual….they are two different technique of placing SL. In manual you set a price as your SL. For example if you buy a stock at 100 and you are willing to lose Rs.5 on it, then your manual SL is Rs.5.
Trailing SL is when you trail your SL when your trade starts to make a profit. Have explained trailing stoploss here in section 7.5 – http://zerodha.com/varsity/chapter/margin-calculator-part-2/
Also, you maybe interested to know that in Zerodha\’s Bracket Order type you can automate the trailing stoploss.
hi
suppose my stock is trading at 1185
now i get one support at 1150 and other at 1100
the priceaction zones line is better in 1100 range than 1150range
to whom should i take support range
thanks
1100.
Karthik, kudos to you!
Unbelievably Awesome job at explaining complex stuff in such simple terms….
I already feel confident and successful at trading stocks after reading your modules 🙂
Can’t wait to put them into practice (of course with my unique Point of View 🙂
Thanks a lot for taking time to craft and create these modules – I can see how patient and persistent you are as you’ve repeated some points over and over, so we newbies can digest the sophisticated stock stuff.
For me, it’s the best trading educational course that I’ve come across!
Really you deserve at least a five minutes standing ovation from all readers here on Varsity, thanks a lot karthik ji 🙂
Thanks for the very kind words 🙂
I\’m really happy you find the contents useful. Happy learning and all the very best !
you are good guide. very nice tutor . i would like to know…in zerodha kite…, can use any specified indicator or tool to identify Resistance levels, demand zone, Support levels , supply zone signals. through these signals of the indicator we can buy or sell easily. few other agencies … like shereKhan / TradeTiger ( youtube videos are available ) they call it Boring Candle indicator to specify Demand and Supply zone. so i have one request can we have any indicator or tool in our Zerodha / kite to specify Demand and Supply zone
Thanks for the kind words, Prasad.
Its best if you plot the S&R lines manually. Remember this is a visual concept, you need to see the support or resistance emerging at a single price point over multiple time periods. Hence its best if you do this manually.
How to draw S&R lines manually ?
Have explained the same in the chapter. Request you to kindly check. Thanks.
Yes, 1000% times.
IF YOUR ENTRY IS RIGHT YOU CAN HAVE THE PREVIOUS CANDLE HIGH IN CASE OF SHORTING OR LOW IN CASE OF LONG AS THE STOP LOSS .
Sir, This module 2 can i download as pdf.
Yes, you can.
How should I practice. How to know whether iam doing right or not . can any body help me. I don\’t have any friends to discuss about this
Pavan, you can post your queries here and I\’ll be more than happy to answer.