
Average Directional Index (ADX)
About:
The Average Directional Index (ADX), Minus Directional Indicator (-DI) and Directional Indicator (+DI) represent a group of directional movement indicators that form a trading system developed by Welles Wilder. The Average Directional Index (ADX) measures trend strength without regard to trend direction. The other two indicators, Plus Directional Indicator (+DI) and Minus Directional Indicator (-DI), complement ADX by defining trend direction. Used together, chartists can determine both the direction and strength of the trend. Source: stockcharts.com
What should you know?
- ADX system has three components – ADX, +DI, and -DI
- ADX is used to measure the strength/weakness of the trend and not the actual direction
- ADX above 25 indicates that the present trend is strong, ADX below 20 suggest that the trend lacks strength. ADX between 20 and 25 is a grey area
- A buy signal is generated when ADX is 25, and the +DI crosses over –DI
- A sell signal is generated when ADX is 25 and the –DI crosses over +DI
- Once the buy or sell signal is generated, take the trade by defining the stop loss.
- The stop loss is usually the low of the signal candle (for buy signals) and the high of the signal candles ( for short signals)
- The trade stays valid till the stoploss is breached (even if the +DI and –DI reverses the crossover)
- The default lookback period for ADX is 14 days.
On Kite:
Load the ADX indicator from studies. Kite gives you an option to change the lookback period; by default, the lookback period is set.
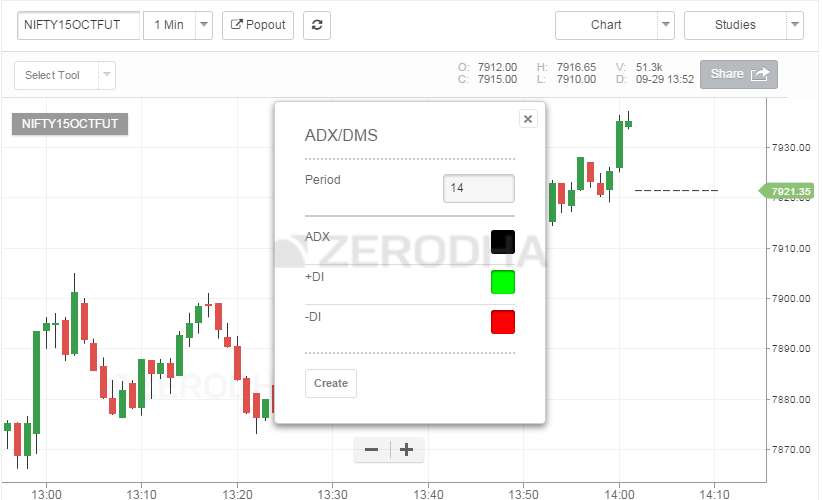
You can customize the colour of all the three components of the ADX system. Click on ‘create’ to load the indicator –
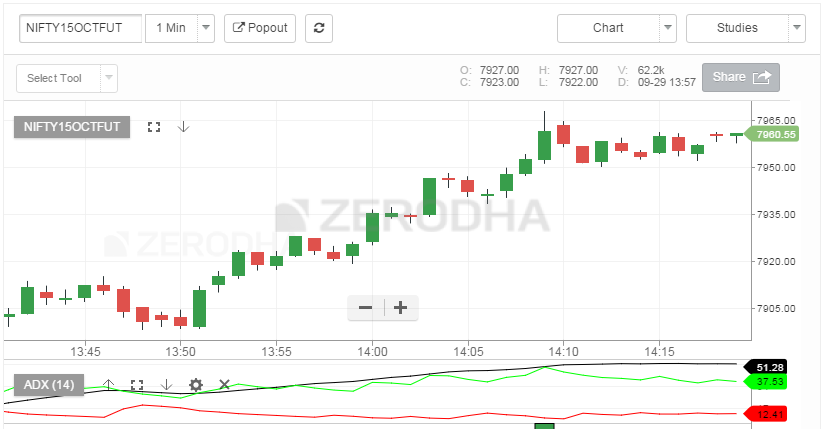
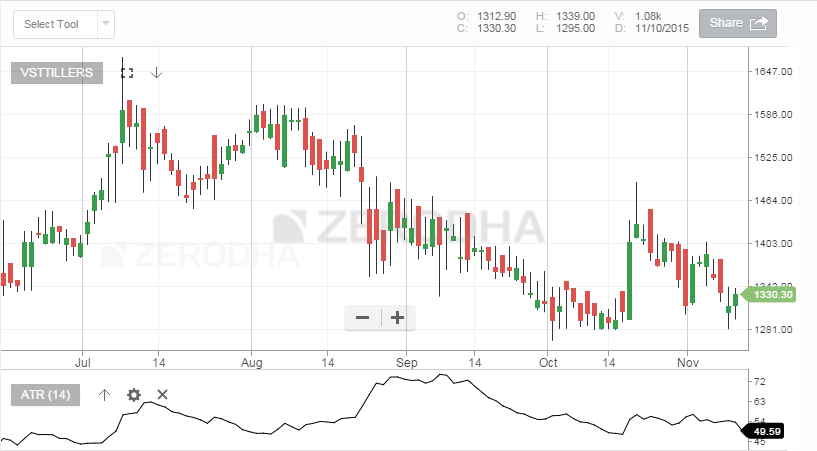
By default, the ADX indicator is loaded below the instrument. The black line represents ADX, ensure it is above 25 while looking for the crossovers.
Alligator Indicator
About:
An indicator designed to signal a trend absence, formation and direction. Bill Williams saw the alligator’s behaviour as an allegory of the market’s one: the resting phase is turning into the price-hunting as the alligator awakes so that to come back to sleep after the feeding is over. The longer the alligator is sleeping, the hungrier it gets and the stronger the market move will be. Source: infimarkets.com
What should you know?
- The Alligator indicator is overlaid on the price chart.
- The indicator comprises three simple moving averages – 13, 8, and 5-period averages are used.
- The 13 period MA refers to the Alligator’s jaw, 8 period MA refers to the Alligator’s teeth, and the 5 period MA refers to the Alligator’s lips.
- By default 13 MA is coloured blue, 8 MA is coloured red, and 5 MA is coloured green.
- A buy signal is generated when the following condition is satisfied –
- All three MA’s are separated.
- The price is above the 5MA, 5MA is above 8MA, and 8MA is above 13 MA.
- Once the above condition is satisfied, it means that the asset is trending up.
- When the uptrend is established, it is upto the trader to identify a good entry point within this trend.
- A sell signal is generated when the following condition is satisfied –
- All three MA’s are separated.
- The price is below the 5MA, 5MA is below 8MA, and 8MA is below 13 MA.
- Once the above condition is satisfied, it means that the asset is trending down.
- When the downtrend is established, it is upto the trader to identify a good entry point within this trend.
- Periods, when the 13, 8, and 5 MA are intervened (or moving flat), is considered a ‘no trader’ zone, and therefore the trader is advised to stay out of markets.
On Kite:
Load the Alligator indicator from the studies. As you can see, the moving averages’ default values are loaded, i.e. 13, 8, and 5.
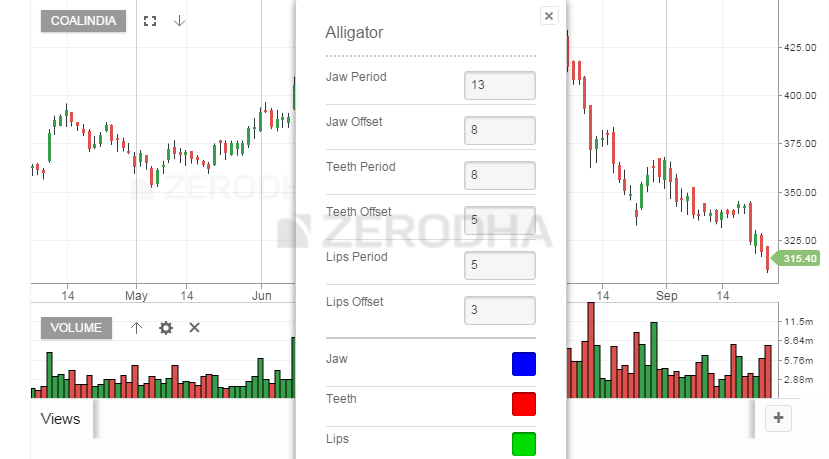
As you can see, the indicator input also loads the ‘offset’ values for each MA. Default values also load these offset values. Offsetting or displacing the moving average reduces the number of whipsaws in the average. Needless to say that you can change the default values for moving average and offset to any value that you deem appropriate. Further, you can even customize the colour of each indicator to your preference.
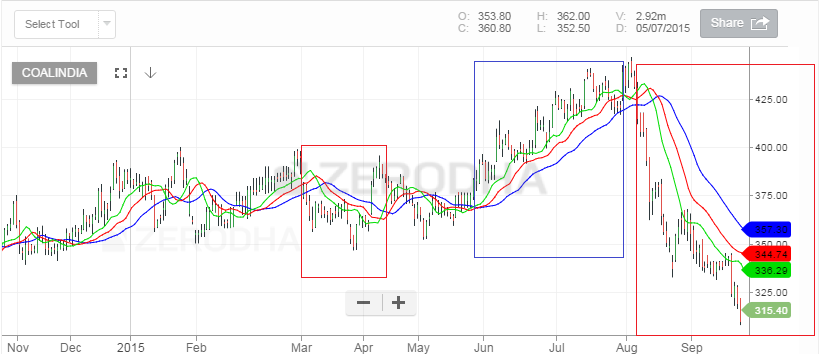
Here is the snapshot of how the indicator looks when the indicator is overlaid on the chart. There are 2 instances when the sell condition is satisfied (highlighted in red) and 1 instance when the buy condition is satisfied (highlighted in blue).
Aroon
About:
Developed by Tushar Chande in 1995, Aroon is an indicator system that determines whether a stock is trending or not and how strong the trend is. “Aroon” means “Dawn’s Early Light” in Sanskrit. Change chose this name because the indicators are designed to reveal the beginning of a new trend. The Aroon indicators measure the number of periods since price recorded an x-day high or low. There are two separate indicators: Aroon-Up and Aroon-Down.
A 25-day Aroon-Up measures the number of days since a 25-day high. A 25-day Aroon-Down measures the number of days since a 25-day low. In this sense, the Aroon indicators are quite different from typical momentum oscillators, focusing on price relative to time. Aroon is unique because it focuses on time relative to price. Chartists can use the Aroon indicators to spot emerging trends, identify consolidations, define correction periods and anticipate reversals. Source: stockcharts.com
What should you know?
- The indicator measures the number of days since last high or low is made. Hence the indicator is a measure of time relative to the price.
- Aroon consists of two-component – Aroon up and Aroon Down.
- The default value for Aroon is 25 days. Aroon up measures the number of days since the last 25 day high occurred and Aroon down measures the number of days since the last 25 days low has occurred
- Both Aroon up and Aroon down are plotted side by side.
- Aroon Up/Down is lower bound to zero and upper bound to 100
- A buy is generated when Aroon up is above 50 and Aroon low is below 30
- A sell is generated when Aroon down is above 50, and Aroon up is below 30
On Kite:
Here is the snapshot of the indicator when loaded from studies –
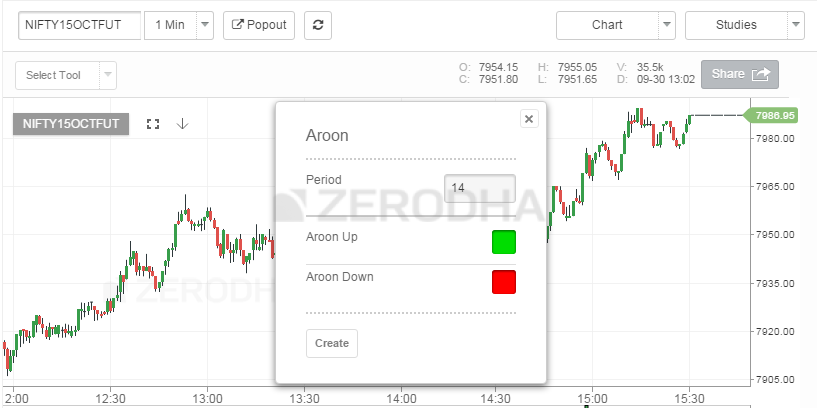
As you can see, the default period is 14, feel free to change this to any number, you wish. 14 here represent the ‘number of days’. Remember if the period is 14; the Aroon measures the number of days since the stock made 14 days high/low.
As you can see both Aroon up and Aroon Down are plotted.
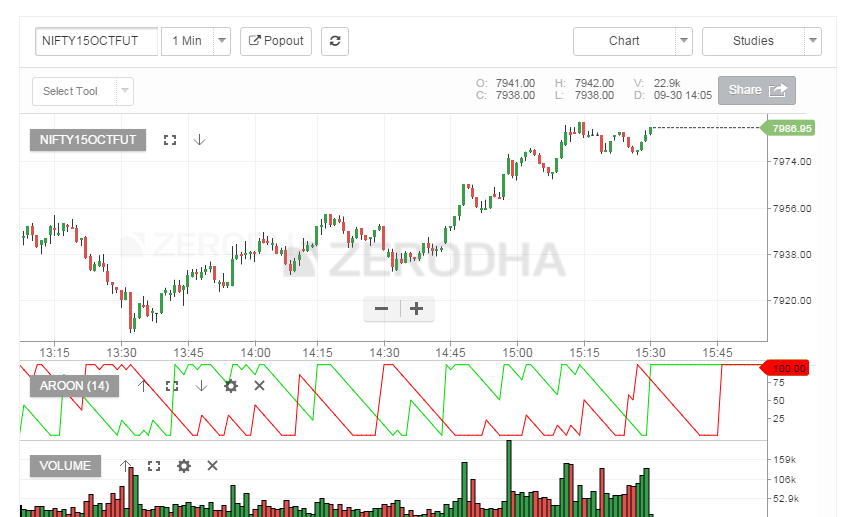
Aroon Oscillator
Aroon Oscillator is an extension of the Aroon indicator. The Aroon Oscillator measures the difference between the Aroon up and Aroon down and plots the difference in the form of an oscillator. The oscillator swings between -100 to +100, with the ‘0’ level as the centre point.
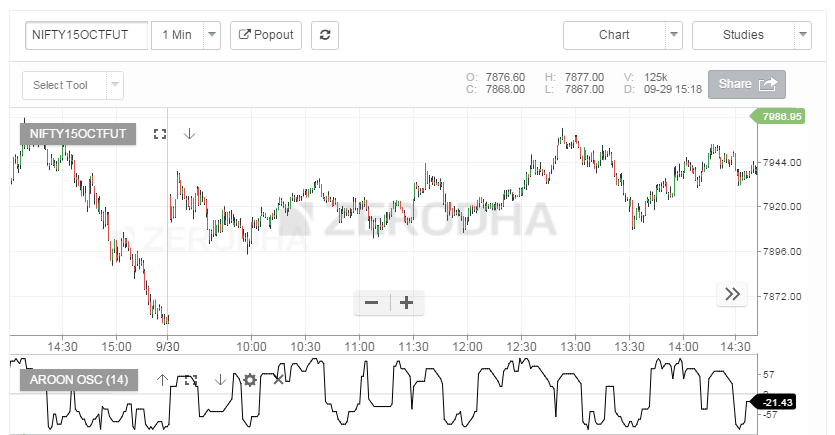
The snapshot below shows the Aroon Oscillator loaded on to the chart –
A reading above zero means that Aroon-Up is greater than Aroon-Down, which implies that prices make new highs more recently than new lows. Conversely, readings below zero indicate that Aroon-Down is greater than Aroon-Up. This implies that prices are recording new lows more recently than new highs.
As you can see, the Aroon Oscillator is either going to be positive or negative the vast majority of the time. This makes interpretation straight-forward—time and price favour an uptrend when the indicator is positive and a downtrend when it is negative. A positive or negative threshold can be used to define the strength of the trend. For example, a surge above +50 would reflect a strong upside move, while a plunge below -50 would indicate a strong downside move. Source: stockcharts.com
Average True Range
About:
Developed by J. Welles Wilder, the Average True Range (ATR) is an indicator that measures volatility. As with most of his indicators, Wilder designed ATR with commodities and daily prices in mind. Commodities are frequently more volatile than stocks. They were are often subject to gaps and limit moves, which occur when a commodity opens up or down its maximum allowed move for the session. A volatility formula based only on the high-low range would fail to capture volatility from gap or limit moves. Wilder created the Average True Range to capture this “missing” volatility. It is important to remember that ATR does not indicate the price direction, just volatility. Source: stockcharts.com
What should you know?
- Average True Range (ATR) is an extension of the True Range concept.
- ATR is no upper or lower bound, hence can take any value
- ATR is stock price specific, hence for Stock 1 ATR can be in the range of 1.2 and Stock 2 ATR could be in the range of 150
- ATR attempts to measure the volatility situation and not really the direction of the prices
- ATR is used to identify stop loss as well
- If the ATR of a stock is 48, then it means that the stock is likely to move 48 points either ways up or down on average. You can add this to the current day’s range to estimate the day’s range. For example, the stock price is 1320; then the stock is likely to trade between 1320 – 48 = 1272 and 1320 + 48 = 1368
- If the ATR for the next day decreases to say 40, then it means that the volatility is decreasing, and so is the expected range for the day.
- It is best to use ATR to identify the volatility-based SL while trading. Assume you have initiated a long trade on the stock at 1325, then your SL should be at least 1272 or below since the ATR is 48
- Likewise, if you have initiated a short at 1320, then your stoploss should be at least 1368 or above.
- If these SL levels are outside your risk to reward appetite, then its best to avoid such trade.
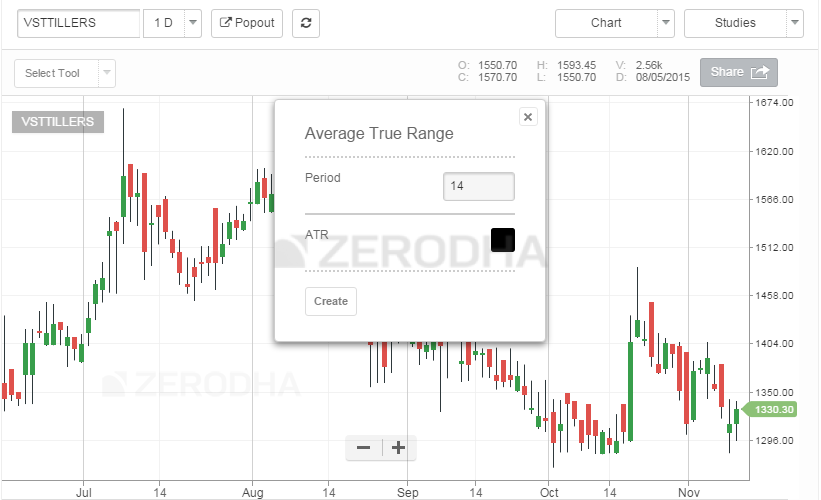
On Kite:
As you can see, the default value of ATR is 14, which means to say that the system calculates the ATR for the last 14 days. Of course, you can change this to any value to wish. Here is the snapshot –
Once you load the chart, ATR is plotted below the price chart as seen below –
So the next time you place a stoploss make sure you check the ATR value to see if stoploss level is relevant. You may also want to read more about volatility and its application (including volatility based SL) – Click Here.
Average True Range Band
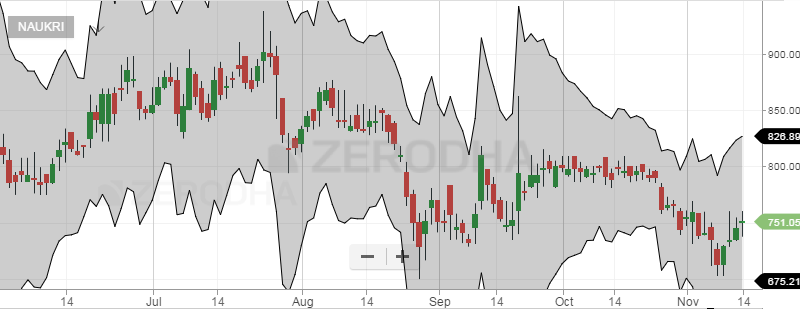
The ATR bands are an extension of the ATR concept. The idea is to plot an envelope around the stock price to evaluate if the stock prices are behaving “normally” or trending in a particular direction. To do this, the ATR band calculates the upper and lower band.
What should you know?
- The ATR band calculates and plots the upper and lower envelope around the stock price.
- To begin with, a moving average of the stock price is calculated.
- The ATR value is added to the moving average value, and this forms the upper envelope.
- The ATR value is subtracted to the moving average value, and this forms the lower envelope.
- If the stock price penetrates either the upper or lower envelop, the expectation is that the stock price will continue to move in the same direction. For example, if the stock price has penetrated above the upper envelop, the expectation is that the stock will continue to move higher.
- You can even use the ATR bands as an alternative to the Bollinger Bands trading system. You can read more about the Bollinger Band (section 15.2)
On Kite:
When you load the ATR band from studies, you will be prompted for a few inputs –
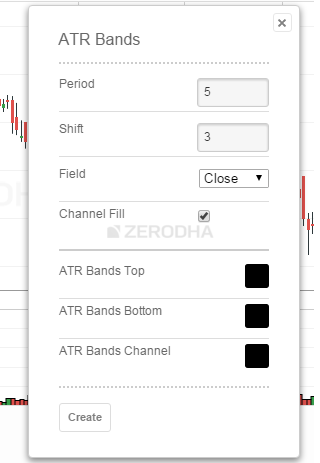
Period refers to the MA time frame; the default value is 5 days. You can change this to whichever time frame that you deem suitable. We would suggest you ignore the ‘shift’ parameter. For the ‘field’ option select ‘close’, this means to say that you are plotting the MA values on the closing prices. The rest of the options are mainly aesthetic features, feel free to explore them. Once you click create, you will see the ATR bands plotted on the chart.
Super trend
Before understanding the supertrend indicator, understanding the ATR is necessary as the super trend employs ATR values to calculate the indicator values. The supertrend indicator is plotted over the price chart of the stock or the index. The indicator line changes its colour between green and red based on the price moment in the underlying. The super trend does not predict the direction, rather once the direction is established, it will guide you by initiating a position and suggesting that you stay in the position until the trend sustains.
What should you know?
- When plotted, the supertrend indicator appears like an alternating green and red continuous line.
- A buy signal is generated when the stock/index price turns greater than the indicator value. At this stage, the indicator colour turns green, and you can also see a crossover of the price versus the indicator (price greater than indicator value)
- Once the long position has been established, the trader is advised to hold the position till the price closes below the green line. So in a sense, the green line helps as a trailing stoploss for the long position.
- A sell signal is generated when the stock/index price turns lesser than the indicator value. At this stage, the indicator colour turns red, and you can also see a crossover of the price versus the indicator (price lesser than indicator value)
- The sell signal can be used to initiate a fresh short or exit long. Although waiting for the sell signal to exit the existing long position can sometimes lead to the loss. So the trader should use his discretion here.
- Once the short position has been established, the trader is advised to hold the position till the price closes below the green line. So in a sense, the red line helps as a trailing stoploss for the short position.
- Supertrend is basically used to identify a trend. Therefore, it works best in a trending market.
- The supertrend indicator, when compared to a regular Moving Average trading system generates fewer false signals; for this reason, the super trend indicator is preferred over a Moving Average trading system.
On Kite:
When you select the Supertrend indicator from the list of studies, you will be prompted for two inputs – Period and Multiplier.
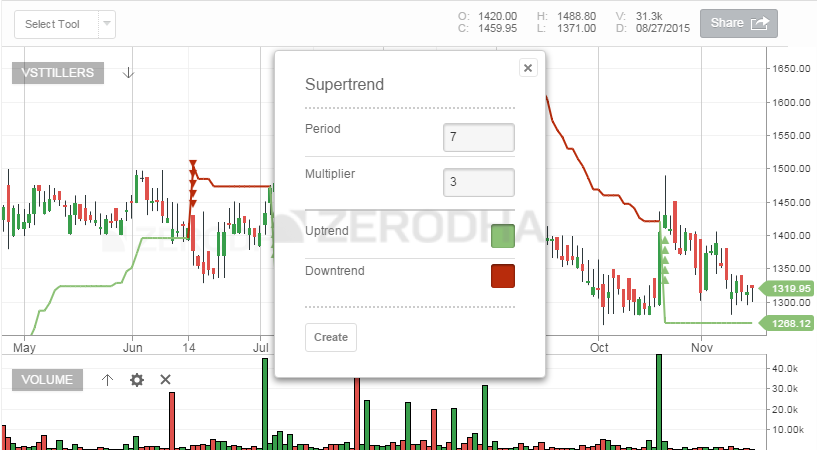
Period refers to the ATR number of days. The default value on Kite is 7, which means that the system will calculate the ATR value for the last 7 days. You can input any value you deem suitable.
The multiplier refers to a value by which the ATR will get multiplied. The default value on Kite is 3, so whatever is the ATR value, it will get multiplied by 3. The multiplier is a crucial input for Super trend. If the multiplier value is too high, then a lesser number of signals are generated. Likewise, if the multiplier value is too small, then the frequency of signals increase, hence chances of generating false trading signals are quite high. I would suggest you keep this value between 3 and 4.
Once the indicator is plotted, this is how it appears on the chart –
Notice how the indicator changes the colour as the price moves. Also, whenever the buy/sell signal is generated, green and red arrows are generated (respectively) prompting the trader to go long or short on the stock.
Volume weighted average price (VWAP)
VWAP is one of the simplest indicators to use. It works on the principle of averaging the traded price in terms of volume traded. Let me give you an example to help you understand this better.
Here is how Infy traded between 14:30 and 14:35 on 2nd Nov 2016 –
The data is quite simple to understand; for example, at 14:32, 2475 shares were traded; it made a high of 983.95, low of 983, and closed the minute at 983.1.
Now, we use this data and compute the VWAP price. To do this, we calculate the following –
- Typical price = which is the average price of High, Low, and close
- Volume Price (VP) = we get this by multiplying the typical price with its volume.
- Total VP = This is a cumulative number, which is got by adding the current VP to the previous VP
- Total volume = This is again a cumulative number, which is got by adding the current volume to the previous volume.
- VWAP = We get this VWAP number by dividing the Total VP by Total Volume. The resulting number indicates the average traded price, weighted by volume.
Let’s do the math on Infy data –
As you see, the VWAP is a dynamic number, changing based on how the trades flow in.
How to use the VWAP?
- VWAP is an intraday indicator, use it on minute charts. Often when you plot this, you will notice a jump at 9:15 AM, when compared to previous day’s data. Ignore this jump as it means nothing
- VWAP is an average, and like any indicators employing averages, this too lags the current market price
- VWAP is used for 2 main reasons – to get a sense of intraday direction and to get a sense of the efficiency of order execution
- If the current price is below VWAP, then the general opinion is that the intraday trend is down.
- If the current price is above VWAP, then the general opinion is that the stock is trending higher.
- If the VWAP lies in between the high and low, then the expectation is that the stock will remain volatile.
- If you intend to short a stock, it is considered an efficient fill if you short the stock at a higher price than VWAP.
- Likewise, if you intend to go long on a stock, it is considered an efficient fill if you go long at a price lower than VWAP.
On Kite:
Open the chart of your preference and select VWAP from the studies dropdown –
Note, VWAP can be applied only on an intraday time frame and cannot be applied on EOD data.
Once you select the time frame (1 min, 5 mins, 10 mins etc.), the engine calculates the VWAP and plots it on the chart as an overlay.
You can now visualize the VWAP and the current market price and plan your trades accordingly.
Why is vwap different for different time frames
VWAP depends on the volume and price right? So it will be different at different points in time.
Is 5 min chart vwap 1hr chart vwap different?
Hello Sir,
Up until now, you had discussed candlesticks, volumes, S&R and other indicators and made a checklist according to that for us to use while shortlisting trades. So my question is- in this chapter, there are many more indicators that you\’ve discussed like VWAP, Supertrend, ATR, etc- how important are these for me to consider ? Can I just go by your Grand Checklist ?
Yes, you can, and also there is no need to learn all indicators. Pick and choose the ones you understand well and use them 🙂
Hello Kartik sir Aditya here, \”As you can see, the indicator input also loads the ‘offset’ values for each MA. Default values also load these offset values. Offsetting or displacing the moving average reduces the number of whipsaws in the average\” there are 2 things that i need to ask in this statement, 1) what is the meaning of offset values? , 2)what is the meaning or reducing whipsaws in average?
Aditya, an offset in the context of a moving average means shifting the moving average line forward or backward on the chart.
> Positive offset: Moves the moving average forward/right, i.e., into the future.
> Negative offset: Moves it backward/left, i.e., into the past.
Whipsaws are false signals — when a moving average crossover or signal suggests a new trend, but the price reverses quickly. E.g., MA crossover says “buy,” but price drops soon after. This leads to frequent, small, losing trades — that’s a whipsaw
thank you sir for helping me out]
Happy learning, Aditya! Good luck!
Hi There is a indicator called majority rule. I understand that it is computed using multiple indicators and taking a vote between them as to whether they are signaling a bullish or bearish sentiment. Which indicators are used in this voting and what are the settings for those and is there an option to change the indicators used or their settings?
Ah, not sure about this, need to check myself.
Thanks for the response. Can you check and let me know please.
Hi karthik, may be i am asking silly
but when said \”A buy signal is generated when ADX is 25, and the +DI crosses over –DI\”
do this mean that +DI is moving upwards to downwards and -DI is moving downwards to upwards ?
Thats right, end of they day these are Moving averages and its variants.
Please sir say more about cpr for long and short time frame and for next day trend analysis. Thanx
What exactly would you like to know?
how to set the RANGE FILTER BUY AND SELL INDICATOR
Ah, not sure. I\’ve not used this indicator myself.
Hi Karthik,
I wanted to ask that if I want to trade in a specific sector or industry say IT sector. And there are hundreds of stocks. How can I identify my opportunity universe therein. Is there portal or something where I can get particular stocks no matter large or small cap but with good fundamentals which would act as further filter to identify the opportunity universe?
Also, there are many indicators mentioned and taught here and in previous chapters. What would be you top 3 indicators among all?
Thank you in advance :p
Its simple – first identify factors that makes sense. For example, within IT sector lets say you want to look at companies which have 30% PAT or 20% ROI. When you apply these filters, your tracking universe becomes smaller and manageable. You can do this either on screener or on Tijori.
Hi Karthik Bro
You have mentioned VWAP as an Intraday Trend Identifier.
If Price is above VWAP – Trending Higher
If Price is below VWAP – Down trending
But you mentioned if some one intend to short the stock, short the stock at a higher price than VWAP, similarly if intend to long, long the stock at a Lower price than VWAP.
Can you just explain the contradictory.
Regards
Nishad
Nishad, short higher if you expect the price to go lower than the VWAP. Thats the idea 🙂
Is the volume and ADX indicatior similar ? as both shows you the trend. the only difference is that adx indicates buy/sell signal. Right?
Yeah, you can look at it that way 🙂
Is there indicator which can show \”buy\” \”sell \” embedded for intraday or scalping
Hmm, no, not sure what you mean.
Hi Karthik and Vipul,
Can any one of you explain the strategy in a bit more detail which Vipul has mentioned in his below comment:
\”I think Super Trend is the best indicator or what I would say as super Profit machine. We should see first identify the 30 min Super Trend Signal – whether buy or sell and then see 5 min Super Trend signal line to enter the trade as per the 30 min Signal. Eg. if 30 min signal is in sell mode (red line above), then in 5 min mode take every sell signal that comes with stoploss of 5 min signal line. I have minted tons with this strategy hence sharing. Karthik Sir can elaborate further if there are any chinks in this strategy. Alternatively you may combine any longer term time frame to judge primary trend and take decision as per shorter time frame supertrend eg. 1 hr – 10 mins 🙂 Thank you\”
I understood how supertrend works, but am not able to grasp what is being said here and how to setup trade as per this strategy.
I\’ve not used the indicator much, so cant really comment on this Abhishek.
Hello..
If i didn\’t get wrong..
So you mean to say go long when the premium price is below vwap, and, short it when premium price is above vwap??!
Please look at the intrinsic value of strikes to know its moneyness.
Hi Karthik
When you say ATR bands can be used as an alternative to BB, wished to understand as the interpretations to both are different and why is that so.
For BB, upper band indicates an expensive price hence a shorting opportunity while ATR upper band means higher momentum upward so a long opportunity.
Am i missing something here?
ATR is a single band, the same that is the center band of a BB. YOu can use that as a measure of volatility.
While ADR is calculated as the average of x candlesticks ranges (H-L), how is ADR % calculated?
I am referring to the fact that in TradingView when we use use Average Day Range indicator, we can change the scale from Regular to Percent and then it shows in %. But not able to understand on what basis the percent has been derived. Hence the question.
Ah Daljeet, I\’d suggest you check the Tradingview documentation for ADR. They will have a detailed explanation for ADR.
Hi, in the chapter on Bollinger Bands, you had mentioned that when the stock price crosses the upper band, it is in the over-bought region and consider shorting it. Similarly if it goes below the lower band, it is in the over-sold region and consider going long on it.
In this chapter, for ATR Bands, you mentioned that when the stock price crosses the upper band, it is expected to move in the same direction and hence consider going long and vice-versa when the price goes below the lower bands.
This is opposite and yet you say consider the ATR Bands as an alternative to Bollinger Bands. Why?
One way to look at it is that the price momentum would continue and therefore the bet in same direction. It is a counter intuitive approach.
Hey Karthik
I was going through some charts and found Supertrend to be working really well. At worst, it makes us exit at break-even. Seems like I can long on some stock in trend and forget about it for a few weeks until I get the exit signal, giving decent passive returns of ~3% a month.
But I know if it\’s too good to be true it isn\’t true. So, what\’s the catch here?
TIA
End of the day, it is an indicator. So nothing is guaranteed here 🙂
Hello Sir,
Really grateful to you for this content. My doubt is that when we should realise that the selected indicators are not working especially in today\’s market context when market is on all time high?
Anand, there is no concrete answer to this, you will have to constantly evaluate the indicator\’s effectiveness given the market condition. Having said that, a series of false signals is usually a good time to check under the hood.
My WVAP figures are showing on the charts. What could be the reasons?
Sorry, dint really understand the query, can you elaborate?
Hello Karthik sir, I have some queries, :-
Q 1) do candlestick patterns work most time in intraday time duration like 15 mins , 5 mins or 1 hour? As learned in the first module , higher the time duration in the charts, higher the accuracy with the candlestick patterns.
Q 2) How volumes play a role in intraday charts, if the candle is forming a bearish marubozu with less volumes , can I consider it as a valid pattern for a steep downmove and how can I get a volume confirmation as well with a valid candlestick pattern in intraday?
Q3) If candlestick patterns are forming but with less volumes, can we consider it as a valid pattern or invalid *IN BOTH INTRADAY AND EOD CHARTS. 🙂
Q4) I have a confusion while drawing a trend line , When we draw a trend line , we connect the \”highs\” or \”lows\” of the candles or and move it in a downward or upward direction in candlestick charts. but in line charts we have only closing prices in it , so if we connect all the closing prices and it will form a trend , but which one is more relevant while drawing trend lines? we can identify the bird\’s eye view of trend from line charts, but is it technically correct to draw it with \”highs\” and \”lows\” of the candle?
Q5) If a bearish engulfing forming in the downtrend that means , the stock is in downtrend , there can be more fall in the stock ? vice versa to bullish engulfing in the uptrend.
Q6) Last question, I learned about many indicators in varsity but too many indicators are giving me different views while taking a trade, I am Getting distracted and confused after seeing so many indicators in a chart. Can I use only 1 indicator that is RSI and depend only on price-trend-volume action for my trades? 🙂
1) While it can be applied to any time frame, I think 10 or 15 mins is better compared to 5 or 1 min
2) Pay particular attention to volume. Always a good practice to trade on higher volume candle
3) I would not be too comfortable with that
4) Its ok to connect highs or lows or even open and closes. Best to draw trendline on candles instead of line chart
5) Yes, of course. Nothing is certain in markets.
6) Stick to moving averages, its simple and effective in my oinion 🙂
Hi why is MVWAP indicator not available in Zerodha?
No, on charitq we can apply the moving average indicator based on vwap data, and it will function similar to MVWAP.
Studies option is no longer available in Kite I guess.
Ah, please do call the support desk to reconfirm this.
Market depth mot showing in our zeroda app.
Company name -Supreme Engineering Ltd
Please check once with support desk.
Sir,
I read your topic on short selling and got the answer.
Sure, happy learning 🙂
Sir,
Can we make short selling in CNC in zerodha? Or is it only allowed in MIS?
Sir,
I have the following two queries on Aroon/its oscillator:
(i) As we learnt, Aroon talks about the number of days since we watch a particular number of day\’s high/low. Hence, as per definition, if we are looking for Aroon high/low with a look period of x days, then shouldn\’t the value of Aroon high/low <= x. Kindly confirm.
(ii) Also we understand to buy/sell when Aroon high is above 50 and Aroon low is below 30 and vice versa for sell. Now, I would like to know that these figures from 0-100 for Aroon high/low—- Are those a calibration based on pre set logic since? Please suggest.
(iii) Regarding the oscillator, the difference is plotted between -100 to +100. I would like to know if this difference is also plotted based on pre set logic and calibration?
1) Not really, there could be instances where the stock is in a prolonged trend and therefore not make any high or low
2) Yeah, these are based on preset logic
3) Yeah
Wherefrom & How may i download the Zerodha \’Pi\’ software in my PC ?
That s/w is no longer available, Bijay.
Sir,
If I follow candlesticks, volume,S&R,dow theory, fibonacci, MACD,RSI……will it be enough to set up trade or Do i have to also follow the other indicators (chapters which you briefed in the last three chapters)?
Please suggest from your own experience.
Namskar sirji mujhe ek sal ho gaye trading karte huye ab tak mai profit 1rs bhi nahi le paya aur loss 8 lakh kar chuka hu. Pl.margdarshan dijiye. Aur
option trading ke liye kon sa indicators best hota h.
Can we apply VWAP indicator for long term?. If not for what is the best time frame to for 1 day trade.
Not sure; what are you referring to here? Long term or 1-day trade?
Hi, in VWAP, can you provide how u calculate the 1 Standard deviation, cause chart IQ values are mismatching with tradingview in zerodha
Not sure. Can you create a ticket for this? Someone from the charts team will get back to you.
Hello Karthik sir, I have a small doubt on point # 6 in Super Trend where it is mentioned that \”Once the short position has been established, the trader is advised to hold the position till the price closes below the green line.\”
Sir, my doubt is that it makes sense of \”price closes below green line\” for long position. Does the \”price below green line\” also applicable for short position? Thanks
No, that is specific to the green line, short positions only.
How to use VWAP indicator on Banknifty and Nifty daily charts.Kindly share the information.it will be helpful to me.
The usage is the same across instruments. Have explained VWAP in this chapter itsef; let me know if there is anything specific you\’d like me to elaborate on.
I need a clarification. In Point 7 of ADX, are you referring to the candle where there was a crossing or the candle in which we entered the trade? Sometimes, we might be entering the trade later than cross over.
Appreciate your guidance.
It is the candle where the crossing is there (signal candle).
Hey!
Are we supposed to know all these indicators?
As these are quite a lot🙄😅.
Learn a few and stick to it 🙂
Hello team Zerodha. Why is the indicator \”Chandelier Exit\” not there in kite app. Or else is there any alternative the the above mentioned indicator for buy and sell signals? Please mention if any.
I\’d suggest you call the support desk for this.
Did you check under ‘studies’?
My kite doesn\’t show studies. Please help.
I\’d suggest you call the support desk for this, they will guide you.
Sir, if you could please answer this question asked previosuly:
We are creating our own supertrend indicator algorithm and are facing issues with respect to initialization of ATR. The issue is when the market begins at 9:15 am, how do we initialise the ATR?
1- Do we take previous day’s last minute True Range
2- Do we take the Last Close minus Today’s Open
3- Do we continue the ATR series from the last reported close
This becomes important since in times of gap up or down, initialization can affect the starting of supertrend series.
Thank you
1) Thats not possible, you will have to take the day\’s ATR. Maybe start your indicator at 9:20?
2) Yes
3) Yes
Can be trade in sideways trend and if yes then which indicators to use?
Try the RSI or MACD.
Also, just like real time prices are available through API, can we get real time value of ATR also through API?
Thank you
Ah, no that won\’t be possible. But if you get OHLC, you can build, right?
Dear Sir,
We are creating our own supertrend indicator algorithm and are facing issues with respect to initialization of ATR. The issue is when the market begins at 9:15 am, how do we initialise the ATR?
1- Do we take previous day\’s last minute True Range
2- Do we take the Last Close minus Today\’s Open
3- Do we continue the ATR series from the last reported close
This becomes important since in times of gap up or down, initialisation can affect the starting of supertrend series.
In alligator indicator you explained about offsets. What are offset values and how do we use? Whether they are supposed to be same as the value of indicators?
Thank you.
They are used as a smoothening factor, VB. You can use the indicator without the these factors as well.
A question.. not really from thia chapter but from intraday trading … So a hypothetical situation say on day 1 I shorted a stock at 916 at 9:20 am and it closed at 910 but I did not squared off my position .. and on day 2 the stock opened at 890 what would happen will my short position continue at day 2 or would it be auto squared off on the end of day 1 … And what would be final p&l … Conditioned I\’m using zerodha.
It would be squared off on day 1 itself, but just in case there is no liquidity or the stock hits a lower circuit, then the position will be short delivered.
hey Karthik, just now checked the ADX on TradingView there is the ADX line but no +DI and -DI lines on intraday chart of 15 minutes, am I making a mistake or there is something else I should know, please help!
Thank you!
I think they have separated out the +DI and -DI bit as a separate indicator. Need to check this myself.
Hey Karthik,
Minor correction:
Under Supertrend point #6, \”below the green line\” should be replaced with \”above the red line\”.
Thank you for the detailed write-up.
Checking, thanks for pointing out.
in zerodha kite how to set VWAP Indicator.i am try to use VWAP indicator but not success. please help
You can load this as an study Nilesh. Its is quite easy, but can you call the support desk if you are finding it tough to figure out, they will explain easily over the phone.
sir what should be the time frame for vwap to use.
YOu can start with EOD charts and see how it goes for you Anup. Then you can start tweaking.
Is Bar replay feature available in Intraday timeframes like 5,10,15 minutes?
I don\’t think so, Arjun. But I need to double-check this myself 🙂
So the ATR says price is limit each day right…
Sorry, dint get that.
It looks like typo here
“ Change chose this name because the indicators are designed to reveal the beginn……”
Checking on this.
Hello Sir,
I plan to purchase X stock on a positional basis.
Sometimes I feel despite the weekly momentum indicators being bullish, my stop loss is hit in the ATR in the daily section.
Possible if the stock is highly volatile.
Hi Sir,
When using ATR, do I use it on a weekly basis or daily basis?
I\’d suggest daily.
Hello Sir,
There is a good chance if Nifty breaks below 15500 on and ends up closing 15400/15300 etc.
This would result in a substantial loss for me.
How would I place a trigger stop-loss order for this, as let\’s say intraday 15500 breaches my trigger stop-loss would get activated and my position is exited. However, the market recovers and closes at 15550 which means my stop loss should not be valid.
Thats now how it works 🙂
You place a sl, the price acts as a trigger. If it hit the price, SL is executed, you can\’t really say the market bounced back and SL was not valid.
Hello Sir,
I hope you and your family are doing well.
My question is When should I apply each technical analysis study and tool to with respect to different time frame?
Obviously higher time frame rules as mentioned earlier.
But for example assume nifty has a daily support of 15500. In the hourly and 15 min chart the support breaks, so do I close my long positions or wait for nifty to close below 15500 on the daily chart?
Good chance nifty go lower and close at a lower level and I would lose substantially?
How does one intertwine Monthly, Weekly and Daily charts?
Sourya, if you\’ve established that 15500 is the support for Nifty on the daily chart, then you wait for it to close below that level on the daily chart. The problem when you mix time frames is that you\’ll be in and out of trades more often than you\’d want.
Hello Sir,
I have rarely seen ADX move to 25 while the DMI concurrently cross each other. Usually the DMI is already above after which the ADX has crossed.
Also often we see the ADX line around 30-40 and now slowly reducing.
When can one enter into these scripts as the ADX could reduce to 28-29 and against start to increase?
How does one enter positions like this?
You can see this happening when there is momentum picking up in the script. Not a common occurrence in a flat market.
Hello Sir,
For using ADX.
Many a times the +DMI is way above the – DMI and after which the ADX reaches 25. Would this be considered a buy signal as the +DMI has crossed over the -DMI way before the ADX reaches 25.
Also often we see the ADX line around 30-40 and now slowly reducing.
When can one enter into these scripts as the ADX could reduce to 28-29 and against start to increase?
Some traders do, but I\’ve had mixed experiences. I\’d suggest you test this for a few signals and see how the trade pans out.
Hello Karthik,
Suppose bank nifty is trading at 34684. It has an ATR of roughly 700 points, so that would mean I would have to set a stop loss at 33983 or lower correct?
Isn\’t the range very high? It could lead me to take a substantial loss per trade if my trade goes wrong.
That\’s right David. The larger the range, the lesser the probability of SL getting triggered. So your capital must ensure you can take this kind of risk.
Dear Sir,
These are part of the Advance Get Software from E signal.
Have you heard of it?
I\’ve heard, never used it. I\’ve used Metastock for a long time, comes from the same Indian distributor I guess.
Dear Sir,
Have you done research on Elliot waves? JTI(Joseph Trend Index)? Make or Break? TJ\’s Elipses?
Do you know about these and are they good to use?
Nope, I dont know this indicator.
Thank you so much!
Good luck, Pranay!
I think I found it. Just need confirmation if DMI is the combination of ADX, +DI, and -DI.
Thats right.
Hi! Is there a way to get the +DI and -DI lines on TradingView?
I\’ve not specifically checked this, but it should be a part of the ADX.
sir, I have been following you since last year and I learned many things this last year and I wanted to take this to next level and improve my skills in the field of investing. As I wanted to know more about the markets and the psychology to deal in the markets. It would be great if you share your investing experience so I get few more insights and how to overcome some biases. Can there be a chance to contact you and have a video session or a call to discuss above-mentioned things. I would like to hear from you.
I\’ve shared everything I know here 🙂
Hey Karthik,
In the Aroon Oscillator indicator under the \”What should you know?\” section, point 6. \”A buy is generated when Aroon up is above 50 and Aroon low is below 30\” shouldn\’t that be Aroon down rather than Aroon low?
Sorry, dint quite understand that.
Hello Karthik,
Thank you so much for all the materials that you have authored. I had even gone through your financial stories for kids, which will be helpul for future generations.
Look at this chart –https://www.tradingview.com/x/vdQ09POr–. In this chart I have added fibonnaci retracement and MACD. And I have noticed that every time signal line crosses EMA (above) there is a retracement in the chart to a fibonnaci retracement level.
1. will this be always true?
2. Should I consider this as a strategy to trade this stock next time?
Glad you liked the content! Happy learning.
1) No, not always true.
2) Maybe you should back test this before you take it live.
Hi sir,
I really want to thank you from my bottom of my heart for the well written notes. These notes are going to be turning point for every trader..
Sir one request, can you please explain ichimoku clouds in detail…As you say filter the news from the noise.. So I want to do the same on this particular topic with your explanation..
Thanks in advance! 🙂
Thanks, Arijit 🙂
I\’ve not used IC much, hence don\’t think I can explain it well 🙂
Vwap is not working in my platform don\’t way I follow all instructions but it not working
Please do check with the support desk for this, Vikas.
Can you add new indicators (scripts) in tradingview (Pine editor is available)?
Not for now, Kumar.
My doubt is similar to Tagore.Point 4&5 and 7&8 are saying opposite. if CMP is below VWAP than should we short or should we go long . For example present Nifty 50 is below VWAP.
What Stop Loss we should keep for VWAP , Aroon and Aroon Oscillator .
I guess this is a mistake, checking on this.
My doubt is regarding the VWAP discussed above, and from the points 4 and 5, it says if the current price is lower than VWAP then, it\’s a down trend and likewise if current price is higher than VWAP then, it\’s an uptrend. So, I could say one can \”short\” in the former case and go \”long\” in the latter, but the points 7 and 8 says completely opposite.! So, sir can you please explain in detail.
That\’s right, let me check the point again. Maybe a mistake.
CPR is available on kite mobile ?
Not yet, hopefully soon.
In VWAP, aren\’t the points 4 and 8 contradictory (similarly point 5 and 7 contradictory)? If price is above VWAP, then stock is trending higher (point 5); so how is shorting the stock considered an efficient fill (point 7)?
I guess I need to reword this, thanks for pointing this.
Sir for intraday 15min chart should we use one day ATR or 15min ATR
For one day it might be 20
For 15min 4-5
For 15mins, I\’d suggest you use 10-period ATR, see how it goes and then reevaluate.
Sir can ATR be used for Swing trading
Or for that should we use sqr rt of number of days and find volatility and keep that as a so
Which one do you prefer and used by you
Thank you😊
YOu can use ATR directly for swing, no need for the conversion. I kind of prefer ATR since its easy to use on the fly.
In zerodha, VWAP is not applicable for indices like NFTY , BNFTY.
But some of brokers like Angel etc. have option to use this indicator on indices.
Please guide.
Are you sure? Have you checked both ChartIQ and TV?
Dear Karthik,
kindly explain the application of Aroon in intra day scenario and what should be the suggested period in the same case?
You use this the same way as you\’d use for end of day, Ravi. YOu just have to shrink the timelines.
Hello Karthik,
First Thank You for so much for the Info.
Can you also update on how to trade on channels and trend lines?
Channels and trendlines can be traded just like the way you trade any range. Usually in a range, the movement is sideways, but in a trend/channel, the stock price is trending in a particular direction, this is the only difference.
valuable lessons
Happy leaning!
Please add list.
Trend/indicator name for intraday, short term and long term.
Trend/indicator name for options trading.
Sorry, dint get that.
For the ATR do you use the Current market price? or the price range within the day?
Yes, CMP is used.
if stock price will not cross that band then how to use this indicator ? because as per the description :-
\” If the stock price penetrates either the upper or lower envelop, then the expectation is that the stock price will continue to move in the same direction. For example if the stock price has penetrated above the upper envelop, the expectation is that the stock will continue to move higher \”
I have looked at the data of 1.5 year and i didn\’t see any signal.
You wait for those extraordinary moves 🙂
Hi Kartik Sir,
I was drawing ATR Band in Kite. I found stock price never penetrates either the upper or lower envelop.
You can even look at the example given by you for ATR in below link. Candles are not crossing envelop.
https://zerodha.com/varsity/wp-content/uploads/2016/02/Image-11_ATRbands_created.png
Kindly clarify if my understanding is incorrect.
Regards
Ishwar
These are volatility bands, which are higher and lower than the CMP, hence it never penetrates unless there is a sudden spike in price.
Dear Sir,
I have tried MC crossover, Price action, NR 7 etc.
it seems the stock goes down as soon as I buy it, and have lost money in all methods.
Can you suggest what should I do to stick to simple basics and get on track?
Scale back and paper trade these strategies for a few weeks if not for months, Satish. You will get a sense of what\’s happening in the market and then you can scale back with real money.
I\’m confuse on the application of vwap.
If the current price is below the vwap we assume the stock will go downward so why should we go Long and enter the trade at a lower price than vwap?
VWAP changes continuously. Use this as a reference price and not base your trades entirely on VWAP.
Do we have the option of putting standard deviation bands on vwap in Zerodha ?
Thats basically the BB on VWAP, I not sure of this is possible.
Ok Sir. Thank You.
Good luck, Sunny!
1.Sir, what approach you ideally follow to FIND small cap or mid cap stocks that are good in value since they are not known as such and holding period is for long term ?
2. Sir, what happens once the 100% authorised capital is utilised and the company wants to issue more shares ? They will file for increasing the authorised capital and then can promoters bring in more capital to increase their stake ?
3. Sir, just want to confirm. Looking at the options data just gives us the sentiment of what the others are thinking i.e whether they have a bearish/bullish view this no way afeect the actual prices of the underlying for eg: Bank Nifty ?
4.Sir, in case of BTST trade how is the brokerage and other charges are charged since the delivery is not taken comapared to taking delivery and then selling it ?
1) Approach is common across any size of the company – good balance sheet, ethical promoters, operationally profitable, plus a moat around the business. Holding period is valid as long as these things are valid
2) Yes, this pass a board resolution, take necessary approvals and increase the number of shares
3) Not really, its hard to conclude market sentiment just by looking at the option data on a stand alone basis
4) Brokerage is not applicable for BTST, for other charges please check this – https://zerodha.com/charges#tab-equities
To Karthik Sir (not a query this time)
Let me take out this moment and thank Karthik Sir and the whole team of Zerodha for this wonderful Initiative (I know its been there for few years now but it still remains wonderful and always will) 🙌🙌🙌
I wanted to learn about candlesticks at first and I started searching for it on google and I guess (this word is just to add poetic effect read as CERTAINLY) I landed at the RIGHT PLACE and I won\’t be leaving it for quite some time now 📚😍
I started this module 15/20 odd days back and \’Technical Analysis\’ is the first module I got started with and I don\’t really know how these days went so quickly as I was so engrossed by the simplicity of the language in which concepts are written 😱
This is without a doubt BEST STRUCTURED COURSE (now I believe ZERODHA VARSITY as a whole) available on the internet and way way BETTER than any of the PAID COURSES one would do. This is nothing less than Gold for anyone looking for knowledge on Financial front be it a newbie from any background or a experienced person from finance background.The way the things are explained is quite astonishing and at the same time simplified such that you can keep reading it all day long 💯
Another thing to point is quick solution to the queries posted, Karthik Sir is always there to solve queries and that too real quick since it has become a part of daily routine Karthik Sir follows. I think now I will be posting too many queries here in and out in the future (I hope I don\’t irritate you though) and stay connected to you in some way or the other as it would be a privilege for us to have you in our little journey and get guided through your simplicity and calmness 😇
The EFFORTS taken by the whole team at VARSITY can be seen in the content presented and it will now pay dividends throughout ZERODHA\’s Journey ✅🔝
I wish ZERODHA the BEST in the future and I thank once again to the WHOLE TEAM of ZERODHA and KARTHIK SIR for this 🙏
Thanks,
SUNNY BHADRA ✌
Hey Sunny, thank you so much for the kind words and all the encouragement. Its overwhelming. I hope you continue to like Varsity and I hope we continue to post good meaningful content here. Happy learning 🙂
Also, feel free to post as many queries as possible, will be happy to share my response to it.
Thank You 🙏🙌
Understood Sir. This little comments add too much value. Thank you very much.
Can I share such things in future as well to know your views ? Will it be ok ?
Please do, will be happy to share my thoughts.
Sir is this a good example of Fibonacci https://in.tradingview.com/chart/JRLhTAZi/ ?
Just want to validate.
Yup, it is. But somehow I\’m not too convinced with such a large time period. I\’d prefer if the peak and trough is within 3 months.
Ok Sir.
Thank you Sir for the quick response.
Can I know when are you planning to upload the reading on scales and how we will be getting notified ?
I haven\’t planned anything for now, maybe I\’ll do that.
Sir, can you please explain :
1. Different types of scales Log vs Regular Scale vs Percentage, etc. How they are interpreted and what are the differences between them ?
2. What does the \’offset\’ option in indicators settings mean and example regarding how it actually works ?
3. Do you use any of the indicators personally from the supplementary reading ? which one will you recommend ?
4. Supertrend indicator or Moving Avg (Simple and/or Exponential) which one you prefer to use ? and in MA Simple or Exponential ?
5. i) Is there any other useful INTRADAY indicator other than CPR ?
ii) what indicators and/or charts or combinations of both i.e. trading setup will you recommend for intraday ?
Sorry for asking too many questions at one go. Will wait for your reply.
Thank You.
1) I\’ll probably put up a chapter on this
2) You can ignore this
3) I prefer the good old indicators – MA, BB and RSI
4) EMA
5) Indicators are not my main source to trade, its the candlesticks 🙂
Can you explain how to set targets in the ADX system?
ADX won\’t help you set targets, you will have to use things like support and resistance for setting the target.
Hi Karthik,
How should supertrend be interpreted/used on the tickertape screener. I am new to investing so a detailed reply will be very appreciated 🙂
Anu, its best to look at ST on Kite and use it the way we have discussed in this chapter.
Sir, any book you would recommend to develop a trading mindset or for technical analysis?
I\’d suggest you read up the articles here – https://zerodha.com/varsity/module/innerworth/
Sir, there are so much indicators, which indicators are best to use? For both long and short. And if using MACD, then we should even use the above indicators for confirmation or not?
I\’d personally prefer indicators like moving averages, BB, ATR, CPR.
Okay, next chapter ?
This is the last chapter in this module.
Hi,
Please elaborate about Central Pivot Range and Pivot Points and its setings too, how Central Pivot Range can be access on trading view chart.
Thanks
Vandana
The next chapter explains CPR. But CPR is available only on ChartIQ for now.
Sir, can you plz advise me which indicator from the one listed above should be my priority if i am looking for buying stock in Short team holding .
I\’d say Moving averages 🙂
hello,
came across Dr. Alexander Elder\’ s book titled \”come into my trading room\”, wherein he described the technical analysis tools he found himself, (Elder\’s Force Index and Elder\’s Ray). I find both of them very important as far as gauging the power of bulls and bears during a particular timeframe. Both of these indicators are there in our studies.
Can u please elaborate how to read / interpret these indicators in zerodha?
thanks
rupesh
Ah, I\’ve not used these myself. Need to educate myself on this 🙂
Hello, since last couple of days, facing problems on PI software. Most of the time it says Operation Time Out for even the smallest action like adding new script. Even clicking on Help or any of the command also it says the same thing. Can you please guide what to do?
I\’d suggest you contact the support desk for this, not much that I can do to help.
while trading based on ADX indicator..should there be a recognisable candlestick pattern be formed or is this not a necessary condition?
As an overlay, it is ok to look for a recognisable CS pattern.
Thank You SIr
hello Karthik,
Thank you for very wonderfully explaining all the indicators. I have gone through all of it . i really find ADX and MA working for me. About Supertrend, I saw a similar looking indicator called UTP indicator ( which the shaw academy people were promoting ) . Are there any similarities or both are different ?
I\’m not sure about the UTP indicator, in fact, have not heard of it. However, I personally prefer to look at the price action, as manifested by candlesticks as my primary source of trade identification. Indicators of all types are secondary for me.
Dear Karthik,
In Nifty and Bank Nifty charts, why cant we see volumes.
Indices in spot are not really traded.
Hi Karthik,
Thanks for reverting back. Do you have any preference among these indicators as they are many and diverse. Obviously not all of them would satisfy their conditions so just asking for an expert opinion.
I prefer the good old MA and Bollinger Bands 🙂
Hi Karthik,
Are the above indicators also part of the grand checklist and should they be satisfied for qualifying trades? Another question I have it in candlestick patterns we take a buy decision when the prior trend is a downtrend but in alligator let\’s say it won\’t satisfy the buy condition because the prior trend was a downtrend. What according to you is more preferred here?
Also how are these indicators different from what we discussed in the technical indicators chapter previously.
These are indicators, and all indicators have the same spot in the checklist. I\’d prefer to give more weightage to candlestick patterns than indicators, including the alligator.
Hi Karthik, In Alligator indicator while waiting for 13,8,5 SMA to move above or below each other(waiting for signal) large part of the move is already completed. This can be seen mainly in down trend. Is there any way to run over this limitation?
Not sure, the idea is to capture a part of the overall big trend.
Hi Karthik
Which are the best indicator for intraday trading .As i am unable to get much data from Vwap
I\’d rather rely on candlesticks for trading intraday rather than the indicator.
yes i have tried both tv and chart iq
but zerodha new indicators introduced list contains this indicator
The new update was stalled, will release shortly though.
I am not able to find Anchored VWAP in the studies draw down list
how can i locate this indicater
Have you tried both TV and ChartIQ? If its not there in both then I\’ve afraid the indicator is not available.
sunil kotian says:
August 26, 2017 at 10:27 am
helo sir
fibonacci tool is not found…its a very good tool.pls do something about that
Reply
Karthik Rangappa says:
August 26, 2017 at 4:50 pm
Not found where? It’s there in both Kite and Pi.
Reply
In Kite, While clicking on the drawing tools, it appears left side of the window (not underneath the cursor!)
I also struggled few days (few weeks !) to locate this hidden menu.
Ah, yes, this is a collapsable menu 🙂
Hi Kartik,
I have two questions.
1. Possible for +DI and -DI to avoid crossover for extended time ? Does it mean we should not enter ?
2. How often do ATR and Range width coincide ? Can both be used together to set Stop Loss ?
1) I\’m not sure if the crossover can stay for an extended period. Anycase, if it does, then I\’d avoid a trade stay on the conservative side
2) ATR can use used as a stop-loss, not sure about the width colliding part.
Hi karthick, I\’m just a beginner and just completed your technical analysis module. Now I planning to practise what I\’d studied so far.
Btw, do I really need to understand these indicator, that you explained above?
Wishing you all the very best, Mithun! It is good to know these indicators, does not harm 🙂
Hi Kartik,
Not sure why ADX with +DI & -DI is only present in ChartIQ and not on Trading view. I\’ve been saving many indicator templates in TV and wanted to add ADX/DMS as well. But just for +DI/-DI signal lines, I\’ve to constantly switch between TV and ChartIQ.
Unfortunately, there is nothing much we can do, Nithin. Will bounce this off with the TV team anyway.
Sir, I\’ve added the ADX indicator from the indicators section and I can the see value and Line on the graph of ADX but I cannot see the +DI and -DI lines on the graph. What do I need to change in order to see the +DI -DI values or lines?
Did you try trading view?
how to use super trend for btst trades?
The same way you\’d for swing. No difference.
Hello Karthik Rangappa,
I tried this with 1Min interval but it wasn’t even close.
This is last 15 trades of 22nd May 2020, between 3.15 to 3.30 pm (1 Min interval)
VWAP I received is “9037.80”, VWAP I saw on chart is ~9012.
OPEN HIGH LOW CLOSE VOLUME Typical price VP Total VP Total Volume VWAP
9016.05 9022.75 9015.55 9022 68100 9020.1 614268810 614268810 68100 9020.1
9022.05 9025.4 9020.8 9025.05 62925 9023.75 567819468.8 1182088279 131025 9021.852919
9025 9031.55 9025 9030.35 76725 9028.966667 692747467.5 1874835746 207750 9024.480126
9030.45 9041.4 9030.45 9041 120975 9037.616667 1093325676 2968161423 328725 9029.314541
9041.05 9049.9 9041 9049.05 111000 9046.65 1004178150 3972339573 439725 9033.69054
9049 9051.5 9043.55 9044.5 104400 9046.516667 944456340 4916795913 544125 9036.151459
9044.6 9052.8 9039.2 9040.2 95100 9044.066667 860090740 5776886653 639225 9037.329035
9038.65 9041.4 9036.5 9036.5 36450 9038.133333 329439960 6106326613 675675 9037.372424
9036.65 9039.95 9036.35 9037.95 29850 9038.083333 269786787.5 6376113400 705525 9037.402502
9037.6 9038 9035 9035 42750 9036 386289000 6762402400 748275 9037.322375
9035 9040 9032 9036.85 70725 9036.283333 639091138.8 7401493539 819000 9037.232648
9037 9038.85 9034.85 9038.1 36975 9037.266667 334152935 7735646474 855975 9037.234118
9037.95 9040 9037.95 9039.5 57975 9039.15 524044721.3 8259691195 913950 9037.355649
9039.55 9041.85 9039.35 9040.5 54000 9040.566667 488190600 8747881795 967950 9037.534785
9040.35 9043.35 9040 9041 70725 9041.45 639456551.3 9387338346 1038675 9037.801378
Is your VWAP formula correct?
I tried this with 1Min interval but it wasn\’t even close.
This is last 15 trades of 22nd May 2020, between 3.15 to 3.30 pm (1 Min interval)
VWAP I received is \”9037.80\”, VWAP I saw on chart is ~9012.
OPEN HIGH LOW CLOSE VOLUME Typical price VP Total VP Total Volume VWAP
9016.05 9022.75 9015.55 9022 68100 9020.1 614268810 614268810 68100 9020.1
9022.05 9025.4 9020.8 9025.05 62925 9023.75 567819468.8 1182088279 131025 9021.852919
9025 9031.55 9025 9030.35 76725 9028.966667 692747467.5 1874835746 207750 9024.480126
9030.45 9041.4 9030.45 9041 120975 9037.616667 1093325676 2968161423 328725 9029.314541
9041.05 9049.9 9041 9049.05 111000 9046.65 1004178150 3972339573 439725 9033.69054
9049 9051.5 9043.55 9044.5 104400 9046.516667 944456340 4916795913 544125 9036.151459
9044.6 9052.8 9039.2 9040.2 95100 9044.066667 860090740 5776886653 639225 9037.329035
9038.65 9041.4 9036.5 9036.5 36450 9038.133333 329439960 6106326613 675675 9037.372424
9036.65 9039.95 9036.35 9037.95 29850 9038.083333 269786787.5 6376113400 705525 9037.402502
9037.6 9038 9035 9035 42750 9036 386289000 6762402400 748275 9037.322375
9035 9040 9032 9036.85 70725 9036.283333 639091138.8 7401493539 819000 9037.232648
9037 9038.85 9034.85 9038.1 36975 9037.266667 334152935 7735646474 855975 9037.234118
9037.95 9040 9037.95 9039.5 57975 9039.15 524044721.3 8259691195 913950 9037.355649
9039.55 9041.85 9039.35 9040.5 54000 9040.566667 488190600 8747881795 967950 9037.534785
9040.35 9043.35 9040 9041 70725 9041.45 639456551.3 9387338346 1038675 9037.801378
Hard to read through the information. VWAP is based on every tick, as you can imagine, there is data loss with 1 minute, but this is the closest. What is the % difference?
I need some help in calculation of vwap. I\’m actually writing some code using developers.kite.trade to automate vwap strategy.
My question is, how do I use interval to get price and volume list ? For ex. in above example, you used 1 min interval to show vwap calculation, let say if I want to calculate vwap for 1st 15 min candle than which interval should I consider? If I get all trades between 9:15 am to 9.30 am by 1min interval and If i calculate vwap for these many prices, than will I get correct vwap as per Zerodha charts?
Yup, you can use the 1-minute interval, it is a close approximation.
hi
there r two charting platforms in kite,
In chartiq platform, i am not able to find indicator named \’RATIO\’, so if anybody can help.
Second thing is in tradingview charting platform , when i place an indicator, and then after trying to place moving average of that indicator i am not getting right input dropdown. is there any way of putting moving average indicator of any indicator .
if anyone can help
thanks
ritu
Ritu, I\’d suggest you call the support desk, they will guide you through this.
I was trying VWAP in Pi to create a scanner, Could you please let me know the trading script OPCODE for VWAP in PI. I want to try LOW < VWAP(14). Would that be possible?
Ah, I\’m not familiar with that scripting language.
Hey Karthik, thanks for your response. I am kind of new to this platform. I got the answer…As you mentioned we can use Volume Profile along with Functional lines to determine the S&R levels. But when we use the Up and Down arrow keys, the level change. This might be because of the change in period intervals which is happening automatically? Could you clarify this?
I think so too, but I\’m not sure 🙂
Hi Sir,
I was going through the benefits of sing PBV(Price by Volume) to find put Support and resistance levels easily. Are there any similar indicators or combination of indicators that can be used to achieve the purpose of PBV ?
Regards,
Anand Pai
Hmm, I\’m not sure. Need to check this Anand. But I\’d anyway prefer to use the line approach to spot the S&R.
Supertrend
Karthik Sir
Point No 6
Once the short position has been established, the trader is advised to hold the position till the price {closes below the green line}. So in a sense the red line helps as a trailing stoploss for the short position.
is wrong
it should be the price closes above the red line.
If am i wrong please correct.
Sure, let me check this.
Hi Karthik! Because of the prices dropping since the COVID-19 outbreak, I\’m finding it difficult to find the S&R levels. Is there a different way to find S&R during such times?
Hi Karthik,
Firstly, thanks for the amazing material. Detailed to perfection! Wishes for many more.
In the TA section, is there any scope to add Trendline and Gann analysis.
Trendline yes, will add that sometime soon. I\’m not sure about the Gann analysis 🙂
Many a times I find difference in Pi and Kite data points and I don\’t know which one I should prefer for data accuracy (usually I prefer Pi). How reliable is Kite data points doing back testing of VWAP data with intraday time frame (5m, 15m) up to 30 days?
Minor differences are always there, Ajit. Do read this – https://tradingqna.com/t/why-does-two-charts-of-the-same-timeframe-look-different-on-the-same-platform/4715 . I\’d suggest you stick to Kite.
sir, many people says that reading books will not help in trading. After reading all the content thus we need to furthue do any technical analysis course???
I get that. But the issue i face is, Those cancelled SL orders gets executed at current prices. As explained above. I don\’t know how it happens ? Unfortunately, i can\’t send the screenshot here.
Hmm, if the order is cancelled, how can it get executed? I\’d suggest you speak to the support agent for this anyway.
Good Afternoon Sir,
I am facing an issue while cancelling the Cover Orders while doing Intraday.
That is , after I square off my existing CO position completely, when I try to exit/cancel the Stop Loss order from pending orders tab. Those orders gets executed at current Market price as a result decreases my overall profits.
For ex. If I Buy CO Infy at 670 with SL 655 and Sell it at 675 with SL of 690. After this when i try to cancel those pending SL, they both gets executed at current price.
Please help sir, How to avoid such scenario ??
Vaishak, when you exit, there is no need to cancel right?
Sir
Can I short stock in swing trading if some bearish pattern is formed on EOD charts?
Yes, but you\’ll have to do that in the Derivatives segment.
hi, unable to set VWAP indicator on NIFTY chart..kindly advice asap..
Suggest you call the support desk for this, Dinesh.
Hello Karthik,
What\’s your take on the Elliot Wave Analysis?
That\’s one thing I\’ve not tried, so I really don\’t know 🙂
its on chartiq. thanks
no on tradingview
I see only a red line
I tried the adx indicator +di and -di are not showing .
where can I find that?
On ChartIQ?
Can you please also add CCI indicator
Can you reply? For my post –January 27, 2020 at 4:39 pm
Posted the reply.
Dear Karthik,
Qw 1) How can we track volume of FII/DII activity from live intraday chart ?
Qw 2) When we select 5 minute chart & we see large volume with large price. But on next 5 minute we see that huge price down with huge volume.(Example Bharti Airtel). It’s an intraday loss. Whats your suggestion as you experience professional !
THANKS
-Janesh Suthar.
1) Not possible
2) It could be a scalping algo which has bought and sold in quick successions.
I request you to sort comments based on number of like.. so that people can get help with most helpful comments first.
Also please try to add value to the original article which comments already provided
We\’ve been wanting to do this for a while. Hopefully soon. Thanks for pointing this anyway.
Hi, I tried to compare your VWAP indicator with the one I have on MT4, but I found out that on MT4 we have VWAP Period (calculating average x candles VWAP values back). May I know what default value you use? and is it possible we can have Period input?
Thanks.
Not sure, need to check the defaults. Btw, you can custom set it to whichever value you need.
Thanks Karthik,
This is in continuation with my previous post and your reply.
I am not sure if I can post a Stock directly here or not, but to make my case more clear I am putting that. If you see VEDL it has good fundamentals and technicals and in Zerodha, TradingView and other platforms and forums VEDL has given Buy call from Friday i.e. 27th Dec 2019. But this stock is more in rangebound or declining. Where is the demand and supply part playing here if most forums and our own technicals and fundamentals are saying to Buy why is it declining? What is that we are missing? Please refer to my point 2 from the above previous post
If some information is not sure like fundamentals are not strong or technicals are not strong then we can say different POVs can be there, but if both are good then why the different POVs?
The stock can be bullish from all angles but if the market is not interested for some reason, i.e. the stock has no activity, then it can remain sideways or in whichever state it is in for a long period. Remember, the saying, \’markets can stay irrational for longer than you are liquid\’?
So it is just a matter of time before these factors start to kick in and move the stock.
Hi Karthik ji,
Thanks for providing education to the people here who are either doing mistakes on their own or with so-called advisors and ultimately losing money. I believe Zerodha and your efforts will help in controlling or even stop that.
Here I have a few questions which are bogging my mind for some time:
1) If one is interested in Intraday/BTST-STBT/Swing then the fundamental analysis of stocks is not important? Only technical analysis is fine?
2) Since the information is known to most like technical and fundamental even then why stocks are not moving in one direction? Even I have seen today for example in multiple places including in Zeroda, TradingView and many other news/stock websites VEDL is buying signal but still in intraday it is in rangebound and below VWAP. This is indicating price action (by the investors/traders) is not completely following or not caring about this or they have a different set of information which we general retail investors/traders don\’t have access to?
3) How to know instantly (using an alert system or software) smart money is entering into or leaving the stock? I know you told how to check this using Volume and Price but checking each stock takes time hence if there is an auto mechanism that alerts us would be good right.
Appreciate if you can throw some light to get more information as this behaviour is interesting to me day by day.
1) That\’s right. Either TA or Quantitative model will help
2) Eventually, the supply demand dynamics come into play. This matters for intraday price movements
3) Volumes are the only way out for this. You will have to associate this with the price and make your conclusions
Hi Karthik,
Thank You for the response.
Can you take a look at Super Trend and let me know the Math behind it. Since Investopedia dont have the details, what you put out here is going to be the authoritative reference point for the future generations.
In case that is going to take time, can you email me the Math in Excel.
Thanks Again.
Pavan.
Will try and do that, Pavan. Thanks.
sir i did not understand how does supertrend indicator plotted of price label? when does it plot upper label from current price and plot lower label from current price? I am confused about it. please sir clarify these.
Monirul, have tried to explain in the note itself.
Hi Karthik,
How is the Supertrend calculated. Why cant I find it in investopedia ?
Is there any standard reference formulae on the basis of which Supertrend is calculated ? Do you have any excel sheet ? Or do you have the basic algorithm which Zerodha has used to calculated Supertrend in Kite ?
Can you please help.
Thank You.
Pavan.
Hmm, I\’ve not really looked at the math behind the super trend. We use the charting engine from 3rd party, so we use whats pre-packaged.
Hai Karthik ,
How to use Vwap as Stop Loss ?
I\’m assuming you know what VWAP is. So essentially VWAP gives you a price, which you can use as a stoploss.
Sir ,
in this chapter you explain us about adx . while plotting adx there is only one line there are no crossover lines . how to set it ? . the setting is also is not having those options on kite . see here : https://www.tradingview.com/x/RAvkyJE0 . There is no option to set +d1 and -D1. Where am I going wrong ?.
Sheedhar, use the ADX smoothing and DI length instead. Else, you can always switch back to ChartIQ.
Sir,
You were going to check & revert back. Please see my post dated 2 Aug 2019 & your reply dated 3 Aug 2019.
regards,
ulhas
Hi,
In the lectures above, it is frequently mentioned to load an Indicator from \”Studies\”. But I am unable to find Studies anywhere on TV.
I load indicators from the Indicators tab on TV but it does not give me the option to load Aroon Oscillator or ATR bands. The Aroon Up/Down and ATR indicators are available though. Have the Aroon Oscillators and ATR bands been removed for redundancy or are these loaded from somewhere else?
I\’d suggest you call the support desk for this, Nikhil. They will guide you through this. Thanks.
Hi Karthik,
I am having a difficulty understanding the Aroon Up and Aroon Down.
If the default value is 25 days, how can the value of Aroon Up or Aroon Down be greater than 25?
The last 25 day high/low has to be within the last 25 days only. So, how can the value be greater than that?
25 day high/low could have happened \’n\’ days prior right?
Hi Sir – How to get option of MA on volumes in Trading View as i am not getting volume option in MA settings.
I\’d suggest you call the customer support for this, Abhishek. They will help you.
Can you please tell how does zerodha calculate the indicators like ADX, RSI & SUPERTREND.
i tried to calculate them excel but my values dont match with it on day chart. i tried to download the bhav copy and considered the series EQ for all stocks.
These calculations are done by either ChartIQ or Tradingview (our charting partners) and not Zeordha.
Hello sir,
Information provided by is so useful for beginners like me.
I follow all your notes and material provided by you in Varsity.
I have a small doubt regarding \” trailing stop-loss\”, because of this I am not able to get good profits.
My doubt is
I purchased a stock at 100.00 and kept stop-loss at 99.5 and my target is 102.00, trailing stop-loss by 1.00.
If the stock price goes to 100.25 then what would be my stop-loss and target?
Will they be \”Stoploss = 99.75 and target 102.25\” or \” Stoploss = 99.5 and target = 102\”
What is the actual significance of trailing stop loss by 1.00?
If you intend to trail by 1 point, with 10 points lead, then everytime your position leads by 10 points in your favor, you trail your SL by 1 point. So if you have initiated the position at 100, with 99 SL, then when the position leads by 10 pts, i.e. @ 110, your SL moves to 100.
Why does the super trend shifts to right when the multiplier is increased and vice versa when it is decreased ?
This is because of the momentum, Omkar.
Respeted Sir,
I many time request you to show average traded price in 4 digits (121.4763). But till today it is not updated. I thick there should not be any problem. This is very useful in commodity.
regards,
ulhas
Will check this, Ulhas.
Option chain in NSE website shows open interest of call & put option
Then What about Future contacts where can found open interest of Future option
It is there in the futures contracts page of the stock itself. You can also check the market dept in Kite for the contract to see its OI. Check this – https://zerodha.com/z-connect/tradezerodha/kite/open-interest-on-kite-charts-and-more
While using Supertrend indicator for the purpose of Positional trading, how am i to tune
the parameters accordingly?
i.e. the Chart time frame is Day/Weekly, what values do i have for the required parameter Period and multiplier.
Bineeth, you should set the chart time to daily for positional trading.
Please advise as to how one is to choose the relevant period for ATR indicators to make stoploss level relevant.
If i am a Positional trader what period should i have for ATR to get a relevant Stoploss for my trade.
Bineeth, frankly there is no straight answer to this. However, I\’d suggest you start with a 14 day look back period and see how it goes for you.
hello Karthik,
First of all, thank you for the step by step explanation of the Technical Analysis. I really wanted to try out swing trading as you suggested for beginners. I was quite clear until Chapter-19. But, I am confused with chapter-20 content. Is all these indicators to be used for swing trader or intraday trader or for both? Could you please clarify this.
No, not really. In fact, as I mentioned earlier in this module, the indicators are only used for additional confirmation. It is not the only thing to consider.
Hi Karthik,
How different is the ATR Trail Stop indicator from Supertrend? While I try to plot them on Kite (on chartIQ) both seem to give identical entry/exit/reversal signals for similar values for period and multiplier.
Are the calculations/formulae for ATR Trail Stop Indicator and Supertrend Indicator, the same?
Can one be substituted for the other? As I checked trading view charts on Kite, it doesn\’t show ATR indicator, only Supertrend is available.
They are two different indicators, Nishant. The calculations are very different..and no, I\’d be a bit hesitant to substitute one for another.
There\’s not available download link in iBook format.
Only PDF download format is available.
Kindly share the Earlier download format in multiple optional
I eagerly waiting for ur reply.
Thank u
We will try and do that, Kundan.
Dear sir,
In sentinel alert there should be alert of two moving average crossover. Need to update in next version. Waiting for the same.
Regards,
khupase
Will note this, meanwhile, you should check out https://www.streak.tech/
Hello Karthik,
First of all word of appreciation. I joined zerodha just a month ago and so far experience is excellent.
Queries:
1) can you explain calculation part of Average true range?
2) Can you explain more about multiplier in super trend as in how it is being used for calculation of super trend line?
THANKS
Welcome to the Zerodha family 🙂
Both your queries require a detailed post, not sure if I can do that in a comment. Will try and put this up sometime soon. Thanks.
I am using 50 day ema and 100 days ema with RSI average true range,MACD with volume chart for investing a month or two.Is it a good combination?
Yup, you can start with this and calibrate as you proceed.
Got my answer for my above query, fount it on my own
Thanks.
Good luck!
Thanks for lessons,
Query regarding adx,
1) what does smoothing period really is all about, what\’s its purpose and how it works?
2) why is there difference in adx result between kite and advanceget software? How to over come this problem?
3) Dr Charles B schaap recommendation for DMI PERIOD IS 13 and ADX PERIODE IS 8 ( ON 13 PERIOD DMI). How to test this setting in kite adx?
Plz help me with my above query.
Can anyone share the calculations for ATR Trailing Stops (HighLow). I am aware that it is moving average or high/low with a multiplier of ATR added or subtracted. At this point I am not sure how Zerodha\’s charts are deciding the trend changes (i.e displaying higher stop vs lower). Can anyone help?
I want to write python code to calculate stochastic momentum index, Please share the formula for stochastic momentum index used in zerodha kite…
Hi team,
please share the formula for ADX,+DI,-DI for calculation in python program
You need to Google for it, Balveer 🙂
Kindly reply this… I am confused
Suppose I placed BO stop loss order for 1000 stocks of ITC at 279.65, the stock came & reached my entry price, but available stocks at this price are 500 stocks only, will 500 stocks are executed or executes only if 1000 stocks are available at once at my entry price??
Because last time it didn\’t execute, although my target hit and sellers too available at that price
Whatever quantity is available at that price will get filled(500 quantity in this case).
The reason your order didn\’t get completed was that there could be more sellers at that price in which case, there will be a time priority.
I want to change my phone number … What are the charges levied? How can I change?
I tried to change from zerodha console… When I click on the edit button.. A small pop up window opens for few seconds and closes… Unable to edit. Kindly check once and solve my issue
Hoping for reply
Check this – https://support.zerodha.com/category/your-zerodha-account/login-credentials/q-login/articles/how-do-i-change-my-registered-mobile-number-and-email-id
1)is it possible to attach Demat account opened from another trading site to Zerodha?
I trade only intraday… I am doing intraday from past one year I never faced any overnight risk until.
3)Will, it possible to do intraday trading from both trading sites with one demat account?
4) Will you say what is the procedure I have to follow now?
kindly reply
1) No, we have stopped mapping 3rd party DEMAT accounts to Zerodha accounts.
2) This is will be an operationally difficult
Hi,
I have small query. How people look at volatility and momentum to know if breakout is real or false? In my view RSI ( momentum) should be more than 60 and Bollinger band ( volatility) should show spread of bands. Similar situation we have in Nifty today, only negative is doji at FIbonacci 61.8% level.
It will be great if you share your view. Which one will prevail breakout or doji at Fib level?
For breakouts, you need to look at the strength of the candle (measured by range) and the associated volumes. The indicators as such is not a great utility to evaluate the breakout.
Hi sir,
Kindly reply to my query
I do intraday trading with less position size regularly. I think I don\’t require Demat Account. If I don\’t have Demat account whether I can place live orders? Will it reflect in my balance? (usually, I will square off by 12.30-1pm even if it is in profit or loss)(since I am a working professional) so no problem with volumes or overnight risk etc.,
DEMAT is required, in case you are unable to square off, then you will be stuck in a situation. Better to have one.
Sir,
I love going through the different topics on varsity time & again.
Can I request you to please post details of the Vortex indicator.
Regards,
Desmond Lobo
Glad to hear that, Lobo. Will try and do a review of that.
I need to plot 10 days high and 10 days low on 5 minute timeframe.
Could you please guide me ?
Thanks,
Alpesh
You need to do this on the charts? If on excel you can use the Max and Min function.
Hello Karthik
I need to plot it on chart of zerodha kite.
Thanks
Alpesh
Hello Karthik
Could you pls guide on this?
Thanks
Alpesh
Alpesh, this could be a little tricky. Not possible on Kite.
HI sir
Today I placed a sell stop order on Bank India at 96.55 with a target of 1 (95.55) and stop loss of 0.95(97.50)
Order got executed and hit my target 95.55 but target not executed it revert back and hit my stop loss
May I know why target not executed even after it hit
Kindly reply me
Rajesh, you mean to say that the scrip touched a low of 95.55, but your order did not execute? This could happen if there were no buyers for the quantity placed.
Congratulations — for being a no.1 stockbroker in India
My sincere request/suggestion
Why can\’t you extend trading end time from 3:20 pm to 3:30 pm?
Kindly consider it
Rajesh, we need time to run the risk management process. Btw, personally, I think what is not achieved between 9:15 AM to 3:20 PM is unlikely to happen between 3:20 PM to 3:30 PM 🙂
Plz provide me ZERODHA Pi software installation link
I am unable to find it in your website
Rajesh, here\’s the link
I have a doubt in ADX what if the -di is above +di and top of that there is ADX line(eg.45) does that mean the bullish trend is strong and the price fallen would bounce up again ?
Yes, these are the indicators of momentum, Suyash. +Di for positive momentum and -DI for negative momentum.
Sir,
VWAP and Average Traded price are same or not.
They are the same, Venkatesh.
How does Kite calculate ADX? When I use the equations for calculating ADX given on the internet, the values are different from what is shown in Kite. Can you share the equation used by Kite?
You can check this – https://documentation.chartiq.com/tutorial-Using%20and%20Customizing%20Studies%20-%20Definitions.html#adx-dms
Thanks for your reply.
Still i have some doubts. Suppose a stock\’s closing price is 100/- and i have given a SL order of the same stock at 98/-. Then on the next day, when the market opens stock has to execute this 98/- order before going further down. How is this possible for the market to open even lower (suppose 90/-) without executing 98/- SL order.
The SL order is a day order, it expires at the end of the day. You will have to place a fresh order the next day.
Thanks for clearing my doubt Sirji!
Good luck, Nitesh!
wonderful writings and insight. nowhere got such a simple yet comprehensive basics. write more please…
Thanks for the kind words, Nagu. You can find a lot more content here – zerodha.com/varsity
Sir,
How a gap up or gap down is possible when there are buy orders (in case of gap up)/sell orders (in case of gap down) already placed in the market at several intermediate prices?
please help me to understand the concept.
Thanks,
Nitesh
The several intermediate prices are what causes the gap, Nitesh!
Sir to be professional in this field is there any courses or certifications and any study material for taking exams.If we clear the exams will we get jobs in any fund houses or brokerage companies.
I’d suggest you try and get yourself a CFA certification and look for opportunities in Asset Management companies. This is your best option. Good luck!
Sir, Today I initiated a position on sun pharma (sell BO stop-loss order ) at 537.25 with a stop-loss of 6 and target of 8
and after it comes near to my target I decided to increase my target assuming it may move further seeing my indicator… Is it possible to cancel only the target order for Bracket order, because by the time I trying to adjust/change value of my target it went on to hit my target
Kindly reply me sir
No, that would not be possible. However you can use CO if you want stop loss only.
I got a display message as everything is free(Zerodha products) for one month… Is it true?
I want to enrol in a course in Learn APP
How can I enrol?
Kindly reply me
Yes, it is. Please do fill this form – https://docs.google.com/forms/d/e/1FAIpQLSdiuvpOOcQZ4g4XExumZhZFeaXqcr7Nf7SHbA3Hbp6LzTHRtQ/viewform
After enrolling ..Will you ask us to pay or directly deducts money from our trading account without our consent?
I want to access trial period first if I like his way of teaching I will pay and continue
kindly clear my doubt,sir
You will be paying then directly, Rajesh. This has nothing to do with your trading account.
Sir,
Suppose a stock is range bound. I go long at the support and plan to short at the resistance level. What should be the ideal stop. Do I need to change my stop loss EVERY DAY. Or will the stop loss remain constant till I reach the resistance level. Please guide.
If you are trading ranges, make sure the range is at least 5-8% wide, this will give you reasonable cushion to trade. For all long trades, the support itself is the SL level and the \’price region\’ around the resistance acts as the target. Do wait for the price to hit the resistance, the price reaction around the resistance could be swift and you could be stuck in an open position. Likewise, for a short trade i.e the resistance works as stop loss and the price region around the support acts as the target.
Thanks Sir,
You said that I could be \”stuck in an open position\”. Can you kindly elaborate.
Meaning, you\’d anticipate the stock price to hit the resistance to book your profit. But the reactions around S&R could be so sharp and you\’d not get an opportunity to exit, leaving you with an open position.
Today I placed BO (stop-loss order) buy order at 319.95 for Wipro but the order got executed at 319 only… May I know the reason why this happened?
I mean Both trigger price and price at 319.95
Rajesh, would need more details about the trade?
What was the price at which Wipro was trading at that time?
Best you contact our Support team for individual trade related queries
Support team.. link plz
my order got executed at 14:10:07
price at that time was 318
How can I change my candlestick chart panel to left and stock selection panel to right… As a day trader and left-hander, I am facing difficulty in placing orders fast
If there is any settings option of doing that, kindly reply me, sir, If not kindly think about it
Thank you
We don\’t have that option yet, Padmasree. I\’m passing this feedback to the team.
let us know whether we have Vwap – upper band and Vwap -lower band strategy.if not, will this be available in Kite or PI.
VWAP uupper and lower bands are currently not available on Kite. Will pass this feedback on to our Product team
Good evening sir,
Kindly clear my doubt
I regularly use BO CO orders
Suppose if I place Yes bank Buy BO order at 235 with a stop-loss of 3 (231) and target of 5(240). Suppose it spiked near my target and went up to 243.. Will I come out of that trade? I experienced one time for stop-loss it got executed way lower than what I actually placed. Is this applicable to the target too?
Yes, your order can get executed at 240(Target price) or higher. This depends on the liquidity and volatility of the contract you are trading in. If there are buyers available for a price of higher than 240, your order will go through.
Please suggest currency indicator which gives a trading opportunity. i used MACD and moving average but confused to me so please give best range in MACD and Moving Average,
Thanks in Advance
The indicators are the same, irrespective of which asset you are looking at. Have you looked at the default settings?
Yes
Welcome!
I uses bracket order and cover order regularly… But I have a doubt about it… Kindly clear it
Suppose yes bank stock moves to 191 and comes down to 187… Now I want to place a Bracket order(Buy) at 189 … Whether I can place the normal limit order(BO)? or I have to place stop-loss bracket order?
Till now I am placing stop-loss bracket order
You will have to place an SL BO, Rajesh.
Dear Karthik sir,
Is it legal to buy some shares (Intraday) from my trading account & short same amount of shares from my wife\’s account (with a little or no difference in avg. price)???
It is absolutely ok to do so.
Hi Karthick,
SuperTrend Indicator in Zerodha chart and PI shows different for the same range (7,3) given.
1. why is it so?
2. I have figured out the formula employed in PI but could you tell me for zerodha chart?
Will check and get back on this. Thanks.
Hi Karthik,
In 2016 August , Tata Motors was trading at 550, it is in continuous down trend( in long term) for 2 years by now. Now trading at 220 levels. In the middle there were small up trends, but it never touched 2 years back price. i.e 550.
Do we need to consider this as fundamentally some thing wrong? If not what is the reason for this continuous downtrend for years.
Yes, perhaps its time to review the fundamentals all over again 🙂
Hi Mr. Karthik
As we all know, ADX is calculated from ±DMIs. Presently in KITE we have only 2 controls for ADX (its moving avg, rather). 1) Its period 2) Smoothing period. Can you please explain what is smoothing period. how it is done. If we apply smoothing to ADX in kite will that affect DMIs also or DMIs are independent from ADX smoothing.
But now, I feel, if we change the period for ADX in KITE, it also applies to the period of DMIs. Is it so ? Please clarify..
Regards
Both the DI\’s are also smoothed for the period defined along with the ADX using Wilder\’s Smoothing techniques.
Here\’s the documentation from ChartIQ(our charting tool vendors). Also, find a write up on Wilder\’s smoothing technique here.
hi
1) what is the preferred period can be used for adx in intraday (default is 14)?
2) what time frame for VWAP for intraday?
Regards
1) Yes, I\’d suggest you stick to default 14 days. Other values you could try are 9 and 21. But please do backtest this once.
2) I\’m not sure if I\’m clear on this, VWAP is the intraday.
What is the best timeframe (1 min, 3 min, 5 min, 10 min or 15 min) for intraday trading according to your trading experience for VWAP, super trend, PSAR and ADX.
Your feedback will be valuable.
I personally like 10 mins or higher.
Thanks Karthik for useful insight.
Good luck, Daljeet. Happy reading 🙂
1) I heard about timings change for Indian stock market . Isn\’t only for derivate market or for equity also? Mention timings also
2) which department in state decides stamp duty for stock markets?
Kindly reply
1) No official communication on this
2) State Government
Yes, It\’s state government…
Whom should I have to approach? Which department of finance? Just a hope, they may reconsider it if someone like me makes a request
In my state stamp duty is 2nd highest of all the states… Almost 5times more than Maharashtra government… Its severely affecting my trading career especially psychologically… Even though I am correct in procedure and plan
You will have reach out to the Revenue Dept for this 🙂
Is any training provided by zerodha regarding this technical analysis etc.. ?
Everything we do is put up online 🙂
Dear Sir,
Need to see time in chart, because the charts which we see is updated at what time. The chart may be of old time.If decisions are taken with ref. of chart. We will loose money.
Need to show time on chart saperately with exact time in hours, minutes & seconds.
regards,
Ulhas
Ulhas, I\’m assuming you are referring to the intraday charts here, if yes, the time stamp is available.
Dear Sir,
Need to see time in chart, because the charts which we see is updated at what time. The may be of old time.If decisions are taken with ref. of chart. We will loose money.
regards,
Ulhas
The time stamp is available for intraday charts, Ulhas.
1) What are the charges levied when we transfer amount from zerodha account to bank…
I cancelled transfer amount will charge are levied?
2) What are the charges levied for phone number change? (I want to change phone number)
3)Is it possible to change or add another bank account to Zerodha?
Kindly reply me, sir
1) All fund transfer charges mentioned here – https://zerodha.com/fund-transfer
2) Other charges – https://zerodha.com/charges
3) Yes, you can. Suggest you contact the support desk for this.
Hello Karthik,
You have always been a great teacher for me. If you haven\’t been a trader, I\’m sure you\’d have been a great teacher.. I have read somewhere that if a person cannot teach a thing in the simplest way.. he himself didn\’t understand it completely in first place. I believe, you have done a great job in making things very simple. Having said all of this.., I would like to wish you a \”Happy teacher\’s day\” from a trader\’s perspective. I totally loved your work
Hey Kiran, thank you so much for the kind words. Such heartwarming comments keeps us motivated to deliver more and better content everyday 🙂
Hi Mr. Karthik,
I also request you to throw some light on the configuration of ADX indicator that is mentioned in KITE chart. For example : the ADX is mentioned in its window as \” ADX(14,14,Y,Y). 14 is period, another 14 is smoothing period. But what are the two Ys. Their selection is not mentioned in the ADX settings window.
Thanks
If Series and Histogram are ticked, its marked as \’Y\’.
Great. Thanks, Faisal.
Hi Mr. Karthik
As we all know, ADX is calculated from ±DMIs. Presently in KITE we have only 2 controls for ADX (its moving avg, rather). 1) Its period 2) Smoothing period. Can you please explain what is smoothing period. how it is done.
Further, as ±DMI lines are also moving averages, is it possible, in KITE to impart their period also as variable, which means we will be having ADX period, DMI peroid and ADX smoothing period as variables in ADX settings window.
Regards
Is it possible to place an order above CMP in CO orders? (I know we can place in SL BO orders)
Kindly reply me
No, we only allow Limit and Market orders in CO.
1) What are the charges levied when we transfer amount from zerodha account to bank…
I cancelled transfer amount will charge are levied?
2) What are the charges levied for phone number change? (I want to change phone number)
3)Is it possible to change or add another bank account to Zerodha?
Kindly reply me, sir
1) I want to place BO(stop-loss order) for Reliance infra CMP is 453 I want to place at 453.60 (limit price) and trigger price at 454 … and stop-loss of 4 and target of 5… Will the order get executed? If yes how are profit and loss calculations…
2) If it does not hit the trigger will the order get executed?
Kindly reply me, sir
Hoping for response
When CMP is 453, you can place a buy order with 453.6 as trigger and limit as 454. Once the trigger is active, your order will get executed between 453.6 and 454.
Your stoploss will be Rs 4 below the executed price and target Rs 5 above.
we cant place trigger price greater than limit price.. am I right?
Sir, what are charges levied when we transfer amount to bank from zerodha account?
There are no charges if you use UPI for transferring funds between your bank and trading account.
Is price alerts free? I want a free one… Is it free for only one month?
kindly reply me, sir
How can we use it? only this message is displaying…..Login with your Zerodha account and gets Sentinel Pro FREE for one week
After free version will you deduct from our account? or will you ask us whether u need or not?
Only LTP based alerts are free for everyone.
Plus and Pro plans can be subscribed once the free trial is complete(only for Zerodha users).
Payment can be done through Razorpay or deducted from your trading account based on your choice
Yes, here are the details – https://sentinel.zerodha.com/pricing
I executed Grasim buy BO order at 1088.80 with the stop-loss of 9 means stop-loss is 1079.80… But the candle where my stop-loss hit is having lower of 1081.35, still how my stop-loss hit(executed) in spite of not reaching actual stop-loss..
Kindly reply me.. what happened there?
Raju, charts don\’t capture all the orders that have been executed on the exchange platform. They only capture a few ticks every second. The candle for the time frame wouldn\’t have captured your trade. Read more on this here.
You can also verify the trades on the exchange. Here\’s how.
I placed BO buy order for sun pharma at 659 with the target of 4 and stop of 3… It means 656 was my stop-loss but it got executed at 655.40… Why such a difference?
Kindly reply me, sir…
Rajesh, you SL was triggered at 656 but if there wasn\’t a bid available at that price at that time, it will get executed at the next available, which in your case is 655.40.
Is it applicable to profit also? or only for stop-loss? 663 was my profit target if there is no bid.. will it get executed at next available bid?
Kindly reply me, sir…
Yes, for profit, since it is a limit order, your order will get executed at 663 or higher.
Is it possible to edit CO BO orders after execution? I mean I want to decrease stop loss and increase the target…
Kindly reply me, sir… I little confused about these orders
Yes, you can modify these orders from the orderbook
How to exit CO order?
What is trigger price in BO(stop-loss order ) Is it the trigger price same as CO(i.e., stop loss)? or it for order execution same as Normal stop-loss order?
E.g., Suppose I want to buy XYZ Shares above 110 CMP is 108 I place trigger price as 110 and price as 110.55 with a stop loss as 106 and target as 115? Is it correct for BO stop-loss order?
You can exit CO from the order book. The position will be exited at the best available bid or ask price.
Trigger price in BO is used to enter the position(to buy above LTP or sell below LTP). In CO, it is the trigger price for the 2nd leg(Stoploss).
Yes, you can place an order with trigger as 110 and limit as 110.55(LTP 108). The 2nd(stoploss) and 3rd leg(target) of this order will have to be entered as a difference from the Trigger price(Rs 4 for stoploss and Rs 5 for Target.
Thank you for replying
I mean whether I have to exit/square off CO at market price? or Is it possible to place the fixed target like BO orders?
I didn\’t find any such thing in the order book
Presently I am squaring off at market price by clicking exit order
Kindly reply me
No, you can\’t place a target order in CO(Cover order only provides protection on the downside). If you want to place a Target, why don\’t you use BO?! 🙂
Is the trigger price (CO) in zerodha is stop loss?
I thought that trigger price just activates the order and real order is executed only when it reaches your limit price(eg Suppose when the Current market price is 100 I place trigger price of 101 and Limit price is 101.5.. If it touches 101 trade gets activated and real order executes only when it reaches 101.5… Am I true?
Kindly reply I am little confused
Yes, for CO, the trigger price is the stoploss order(2nd leg).
The entry order can either be Limit or Market. If you want to buy above the LTP(or Sell below LTP), use Bracket order(you can enter using Stoploss order)
I placed bracket order for ICICI by calculating in zerodha margin calculator… Even though I have sufficient margin amount(in fact I have more than the margin required… My order rejected thrice… And it shows RMS margin requirement is not sufficient. Why my order rejected? will you please reply me
Rajesh, margin requirements for Bracket Order are based on how far you\’ve placed the stoploss. Also, have you entered the stoploss and target as a difference from your buy/sell price or you directly entered your stoploss value?
This post should help you with the same.
First of all thank you very much for these informative modules on indian stock markets.
I am completely new to all of this (trading and other complex jargons) although I am investing money through mutual fund SIPs.
I have a query regarding stoploss. Suppose I put a stoploss of x /- for a particular trade then is it guaranteed that it will be executed when stoploss is triggered?
I mean there must be some buyer to buy at that particular price otherwise it wont be executed. Also, this would be the case for any order whether its buy or sell.
Can you please throw some light on this.
Thanks
Nitesh..
There are no guarantees in the market, Nitesh 🙂
If the stock moves quickly, there is a possibility that it won\’t get executed. So always double check to confirm execution.
Thanks for your quick reply.
It means stoploss is not foolproof!
One may end up being trapped in a bad trade situation.
Yes, execution is not guaranteed.
Nice info. very informtive
Good luck, Praveen.
Can we trust zerodha?
why I received a message from zerodha with a bse2nse message attached? even though I opened an account directly
Kindly reply me
I never used any sub-brokers link/or any other link in the account opening process… I myself directly opened from zerodha account opening page…
This is the message I received
Dear Rajesh Reddy – Br
Thanks for initiating the account opening process at Zerodha. We have received your PoA declaration today and will get back to you soon with the status.
Do get in touch with your Sales Manager – Deepa ([email protected]), mobile: 9176812020 or call us back on 080-49132020 in case of any further queries.
Lastly, we appreciate your valuable feedback, please do let us know about your account opening experience by writing to [email protected] and [email protected].
Why I received bse2nse.com?
These idiots literally torched me with their calls and messages…
Let more know details about it
I trust zerodha a lot, never lose the trust of customers by encouraging this kind of activities
Will you reply to me?
Hi Karthik – I just finished getting to know the Introduction & TA and I must say that this is one of the best insight to stock market and I\’m going to share this on FB for others to know.. Blow away by your simple explanations, Kudos..
One clarification from my side while reading through this sentence (Total VP = This is a cumulative number, which is got by adding the current VP to the previous VP) – I\’m unable to identify the previous VP , can you clarify pls.
Best,
Senthil
Thanks for helping us spread the word, Senthil. We all need to do our bit in helping the Indian Capital Markets to develop 🙂
VP = Volume * Price
So the current Volume * Price data gets added to the previous Volume * Price and a cumulative number is generated. See the table, it has the calculation.
Thanks sir.. In chapter you have mentioned for most of the TA to look at the candle stick pattern at 3:20pm while the market closes at 3:30pm, is it really possible to do a intraday trade within that 10 mins time interval (or) Am I missing something in here..?
These are not for intraday trades, you look at whats panning out and take a positional trade.
Looks like some confusion, what i meant is the timing of 3:20 pm is mentioned in candle stick patterns from module 5 to module 10..
Yes, at 3:20 PM you take a call on how the price action is panning out and decide if you want to initiate a trade or not. You should also be in a position to identify the candlestick pattern.
Yesterday I opened zerodha account, today I got login credentials
There you people asked login security five questions
How can I stick to two questions of my choice? It keeps on changing every time when I log in
Kindly reply me, sir,
2 out of the 5 questions will randomly pop up at the time of login in. This is how 2-factor authentication works. Unfortunately, you cannot keep 2 questions constant.
I practised in my friends zerodha account… Their security questions are fixed to two only… Is there any option for changing the answers…As a swing trader we occasionally open account, It\’s somewhat difficult for me to remember…
Today is an exchange mock trading day. You may receive live ticks and your orders may go through. These are dummy transactions and are wiped automatically the next day.
I am seeing occasionally these message during weekend days… what is this? Is it a practice one? whether we can place orders?
You can reset the 2FA here – https://kite.zerodha.com/forgot?type=password
Mock trading is mainly for the brokers to test their systems. The ticks during mock trading are wild, does not represent real market circumstance. So I guess there is no point participating in it from a learning perspective.
SINCE I\’M NEW TO TRADING, I\’M LEARNING CHART IN INVESTING.COM WEBSITE. OVER THEIR WHY ADX IS SHOWING SINGLE LINE IN INVESTING.COM WEBSITE? I ALSO SAW SETTING BUT NO OPTION! WHAT SINGLE LINE SPECIFIES ?
I\’m not sure, Chanu. Suggest you check with their support desk. Thanks.
Select ADX +-DI option in indicators list
you can see 3 lines ADX ,+DI and -DI
well, it might not be in investing.com, maybe only in zerodha charting.
Let me check.
What are requirements/conditions for Margin Trading?
You need to ensure you have the required margin amount before trading. You also need to be aware of the risk you are taking while trading on Margins.
How long it will take to get active account,if I open account through online? Is it possible to start trading(intraday) immediately after opening an account? or I have to wait till my demat account is linked ? How can I know whether demat account is linked to my trading account or not? will I recieve any confirmation message?
Once you e-Sign the application after filling the relevant information and documents, your account will be verified within 24 working hours. You will be able to trade from the next day after the verification is complete
I want to open an account with zerodha
Kindly reply me, sir, No one is replying
1) I am an intraday trader. Is it required to have a demat account? As intraday shares are squared off on the same day itself, moreover it won\’t go into demat account.
2) I am prepared to open an account through online… on last we have to sign and send demat form, within 7days..what will happen? If it is not reached within 7days, will the account be fortified?
Hoping for reply
1) Yes, because at times you may be required to take delivery of shares (think of a situation where you are unable to sell owing to liquidity situations).
2) No, it wont. The physical document is the POA of your DEMAT. The sooner you send the better it is for you. Good luck.
Thank you,sir
Welcome!
Hi Karthik!
You have produced such good content; Kudos to you. Now, where can I find detailed information on every tool (i.e. drawing tools and indicators).
Thanks and regards
Thanks, Madhuri. Most of the important indicators are already covered in this chapter. Is there anything, in particular, you are looking at?
Hey Karthik,
I am facing some issues on Kite. I tried contacting support with screenshots and all but all I got was a ticket opened, which is probably automated I guess. This is the second time I am posting about this. The first time I did with links to the screenshot the forum
didn\’t accept the comment.
Now to the issue…I was looking at SILVERMICAUG2018 contract (default daily time frame, non-continuous data) and yesterday and today\’s candle at a specific position but when I chose for continuous data of the same contract on the same time frame, the candles just shift their positions. the OCHL all gets redrawn and at different levels thus making it difficult to take a trading decision. I am currently short on this contract and I am unable to decide on my target. I am not posting the links to the charts else the comment will not be posted.
Could you please look into this? I know this is not your department but then I am not getting any response from the support time…all I have is a ticket no.: 20180702577545. Any help would be highly appreciated! Thanks.
~Abudhar al Hassan.
I was checking ATR for ACC. It was 9. Current stock price is 1339. Does that mean it will move in range between 1348 or 1330?
When I checked the charts in kite there was a 40 point movement in this stock on 29th. AM i interpreting this wrongly?
Yes, ATR gives a volatility based range for the stock or index. In this case, it is 9 and yes, 1330 to 1348 is the range.
But it overshot the range.It went above 1348 and closed at 1360
Possible Shyam, remember there are no guarantees here, just probabilities.
can we use average trading range for banknifty and nifty index? or is this applicable only for stocks?
Yes, you can use this over indices as well.
Sorry sir I have still not understood this concept
The movement of banknifty is huge .
26300 CE- Open was 206 and low was 77
ATR – 32
How shd i interpret this?
Which part is confusing you, Shyam?
Supposing in bank nifty i am using super trend .what shd be the period and multiplier. I am using 15 min chart.
SHd i keep the default (7,3) or shd i change this for generating more signals?
Shyam, I;d suggest you use the default parameters for this.
Hi Karthik
Why vwap is not in pi? Why is it so difficuilt to put it in pi? or have you guys stopped working on Pi. I see there are no updates on pi for long time now?
Pi use a 3rd party charting engine, Vinay. So the inclusion should happen from their end. I\’ll check if this can be done soon. Thanks.
Hey Karthik,
Is there a way I can share the screenshot of a chart with you? Wanted your insight on a trade I took. Tried uploading the file to my drive and sharing the link here but guess the forum doesn\’t allow links in the comments. Any other way to share a screen shot with you? Thanks.
Abudhar al Hassan.
I saw the image and responded to your query.
https://drive.google.com/open?id=1seDuZ83fR6KQhL3oIjzjRXxQ1NqVtBU_
Hey Karthik,
Need your insight on this. Please have a look at the screenshot above, which is a 15mins SILVERMIC chart on which I took an intraday trade yesterday. Allow me to explain my approach…
*. Had constructed price action zones based on my readings from varsity, and the lower zone is actually a major support zone if you look back in the chart, not showing in the screenshot though.
*. CMP was at the lower zone, and so was the stochastic and I was bullish on it because the zone was time tested and not broken, at least not recently.
*. The A candle formed. A hammer if I am not mistaken. There was a volume spike above average level, D, right beneath it. So a hammer after a downtrend at a support level with a volume spike indicates a reversal, but I waited for confirmation.
*. The doji right after A suggested indecision, so I went ahead and placed a SL-BUY order at the high of the doji, which was hit by the bullish marubozu candle B (not exactly a marubozu though).
*. So blue line is where I bought and the red line was my SL which is right below the low of the hammer (with a buffer of 1-2 ticks).
The green line was my target as it was the next immediate price action zone, above. Also, I kinda felt that the price is ranging between the two zones. The R:R was 2.6 and was very satisfying for an intraday trade.
Now, I had a lot of conviction on this trade and you would see it did pan out, but only after hitting my SL. So my questions on this are…
a) Is my approach right? Did I miss something? Should I have waited for more confirmations?
b) Had you been in my place, how would have you approached this trade? Would you have taken the trade? If yes, then where would you have taken the trade?
c) What other factors would you look for here? Do we need to look at any non-technical parameters before initiating a commodity intraday trade such as this?
As always, your insight would be highly appreciated.
Thanks & Regards,
Abudhar al Hassan.
Interesting 🙂
I would have initiated the trade just like the way you did and probably I\’d be lying if I said I\’d not be tempted to get out of the trade at candle c. But here is the thing, a 70 point move over a 40K odd priced stock/commodity is too small a price. It can get taken in a tick. Hence, what I\’ve have done differently is to choose a stoploss which cannot be taken away by regular swings. I guess you should see this video for better understanding – https://www.youtube.com/watch?v=IrSZBgFCf00&t=1s
Hey Karthik,
I am glad you posted the video. Had seen this long back and actually had some queries..
1. Let\’s say we have calculated the absolute daily volatility value of a particular equity in 15mins interval to say, Rs. 5/-. Now does this mean that the price of the shares would fluctuate +-5 from the CMP or from the O/C/H/L of the day or from the O/C/H/L of the candle that\’s being formed?
2. If we placed volatility-based SLs and Targets, the R:R would always be 1:1 right? Is that advisable?
3. Can we just use the built-in ATR study of Kite to determine the volatility at any interval and skip the whole volatility calculation part (the way you\’d mentioned in the video)? Or they are two different things?
4. This is off-topic. When we know that we are trading a range, then is it alright to ignore waiting for above-average volume spikes when price reaches the upper or lower level of the range and just take a trade based on a recognizable pattern/candle forming at either of the levels?
5. Would you say that a resistance level which has turned to a support or vice versa is a more reliable/stronger price action zone than the S&R that we would plot otherwise?
As always, your insight is highly valued. 🙂
Thanks,
Abudhar al Hassan.
1) You are comparing two things here – daily volatility versus 15 mins volatility. Both could be different hence you need to convert daily vol to 15 mins vol. I\’m really not sure how effective this would be. Anyway, to answer your question, its on EOD OHLC.
2) Use Vol to set up the SL, not target simply because it would be a 1:1 RR
3) Yes, you can use ATR
4) Yes, you can take leads from your gut, but I\’d suggest you look at evidence to back the thesis
5) Agreed, tested S&R is always more reliable
Good luck.
Hey Karthik,
Thanks for responding. I have an issue though. I know this is not your department but I am unable to get any response from the Zerodha support team. They have opened a ticket and all but I can\’t see their response at my end. The thing is, when I look at the SILVERMICAUG2018 chart, I see today\’s candle (daily time frame) at a certain place but when I select continuous data from the display menu, the candle redraws itself (again in the same daily time frame) at a different place. Had send the screenshots to the support team but, as I said, either they haven\’t responded yet or I am unable to view their replies…I am posting the links to the charts here. If you could kindly look into this or kindly let me know whom to contact so as to escalate the matter, it would be of great help.
Thanks.
https://drive.google.com/open?id=1QS1AgT_5OTcxdhY-u5R-0-jxkUVvRi7D
https://drive.google.com/open?id=1Ht2kDfoNUdR__KPxJNFyBr7Mf9-bvka3
~Abudhar al Hassan.
Hassan, I believe Arockiya from our charting team has resolved your query over the phone.
I happened to see some videos on you tube on Elliot waves. Seems complicated but interesting.
Any plans of including this study here in varsity? Ne books or materials that you could suggest?
Its been on the list of things to do, Shyam. Will try and do that sometime this year. Thanks.
Eagerly awaiting kartik.
Hi Karthik,
What is the best way to adjust options \”iron condor\” strategy if the market is moving in one direction? please clarify me with examples.
Thanks in advance
Satya.
If you are talking about a hegde, then you will have to note the direction of the market and initiate a futures position to match your P&L.
Yes your pivot point calculation is different from others.. Kindly reply me what formula zerodha pi uses?
I tried O+H+L+C/4, H+L+C/3 it didn\’t match them.
The Pivot Points formula on Pi:
Pivot point § = (H + L + C) / 3
First support level (S1) = (2 * P) – H
Second support level (S2) = P – (H – L)
Third support level (S3) = Low – 2(High – PP)
First resistance level (R1) = (2 * P) – L
Second resistance level (R2) = P + (H – L)
Third resistance level (R3) = High + 2(PP – Low)
There are different ways to calculate pivot points (so both ways are correct), As both kite and pi is powered by different charting engines and hence they differ.
Thank you for providing quality material…
Kindly clear my doubts..
1)Your pivot point calculation is different from others.. I tried all available calulations, it didn\’t matched your calculations.. Kindly say how you r calculationing?(intraday)
2) I mostly use norml intraday.. place target and stoploss after executing order…. Isn\’t possible to move stoploss above the order (what I mean, is it possible to move stoploss in to profit)
suppose i place a order at 1000 with target of 1015 and stoploss of 994, stock moved to 1007.. Isn\’t possible to move stoploss to 1003.. so that i can end up in profit if stock moves down.. i never tried thinking about fines (zerodha charges for improper quantity , margins etc.).. I know it is possible in BO orders as it has trailing stoploss.. but what about normal intraday orders..
Kindly reply sir..
Hi Mr Karthik,
It is really very insightful by reading your material on TA. Please keep it up and provide some more TA strategies. Also why can\’t you lower your brokerage from Rs 20/- per trade to say 5 or 10 per trade? Axis Direct is offering for Rs 10/- per F&O trade only and that too Zero for intra-day trading. As most of the budding traders told above, transaction cost is eating into the profits made in intra-day trade/positional trade.
Jagannath, we offer the lowest brokerage. Did you know the brokerage for equity delivery is already 0. It cannot go lower than that. Also, as a budding trader your focus should be on capturing the trend, not really about brokerage costs 🙂
kindly reply this sir..
1)you are saying brokerage of 20rs or low for intraday order executed but in zerodha brokerage calculator it showing as 40rs..
Is this 20rs additional than that calculator?(intraday)
2) suppose if square off by clicking x mark(market price) in a trade other than what i fixed target/stoploss.. will additional 20rs are charged for this type of orders?
1) 20 per executed order.
2) Yes, like I mentioned, its 20 for buy and 20 for sell.
thanks for reply..
is 20 a fixed ? if i do with less no.of shares , will the brokerge be lower? How do you calculate , I mean percentage?
Yes, it is, in fact, Rs.20 or 0.01%, whichever is lower. You can check the tariff sheet here – https://zerodha.com/charges
Thanks for replying
0.02% calculated as this way..
suppose I buy 10 shares of xyz at 300…. 300* 10*0.02 + additional zerodha brokerage charge which shown in zerodha calculator
sell 10 shares of xyz at 304….. 304* 10*0.02 + additional zerodha brokerage charge(brokerage calculator)
It means charges are levied twice for one order.. am I right?
plz reply this… I want to start with low budget first and then I want to increase my amount (practised a lot in virtual trading).. want to practice some days in real trading first..
Buy and Sell are separate orders
You will be charged:
a. Buy- 300*0.01%*10 shares= ₹0.3
b. Sell- 304*0.01%*10 shares= ₹0.31
I believe you would have found the same values in the brokerage calculator.
ya.. I too found same values..
I think there are no extra hidden charges
Thank you
Good luck!
hi
One more small doubt. I hope u will be able to clarify. Is is really possible to be profitable after deduction of applicable charges in intraday? I have been observing that applicable charges are always eating way the profits and are invariably more than profits. The charges are to the tune of at nearly Rs.1,000.00 , if one trades with capital of Rs.20,000.00 intraday. Or should I say that intraday is profitable only if one earns more than Rs.3,000.00 intraday. I have been trading for the past 5 months nearly. Maybe, I am overtrading. Does that mean that I have to improvise my trading skills and make as fewer and refined and correct moves as possible? I am now of the opinion that trading with a capital of Rs.1,00,000.00 and making profit of at least Rs.3,000.00 at one instance only will enable one to take home some amount after deduction of applicable charges. Pl correct me if i am wrong.
Thnx.
Rs.1000 as charges is quite high, Abhishek. Either you are over trading or paying more brokerage. If you are paying more brokerage, then maybe you should consider shifting to Zerodha – https://zerodha.com/?ref=varsity
From my experience, keeping Rupee targets never really works in the longer term. You will fall under pressures and end up taking irrational trades. Stick to strategies and trade according to what the strategy demands.
With your guidance i have learnt technical analysis and have tasted both profit and loss in intraday upto Rs.3000.00 when genuine trade was there. I know how to earn profit and how to avoid losses in intraday now with ur help. Will u please guide me if this profit can be increased to more than Rs.3000.00 to let us say 5000, 10000 and more than that (of course , it can be done only if genuine trade is there). I request you to pl give me a straight answer, not a diplomatic one.
Thnx.
Abhishek, my help will be to the extent of giving you the answers (which I think is right) when you post your queries here. So feel free to continue posting your queries here.
Good luck and stay profitable 🙂
What should be the time frame for Volume Weighted Average Price for intraday purpose?
Normally what time frame you prefer?
I\’d personally prefer 10 or 15mins VWAP for intraday.
Dear Team,
Most of the tools are added in 1 single dropdown. Please split each tools on the Top Tool bar. So that people could use tool by selecting from the tool bar.
Will pass the feedback. Thanks.
Dear Team,
There are lot of space available on Top tool bar, that space can be utilized for adding more tool on the display for each parameter. Same as in Investing.com Like:
1min – 5Min- 30Min-1Day……
Chart Type, Renko, Candle, etc
All these options are available anyway, Gautam.
Hi team,
1) How to change date format in chart as per my convenient format.
2) How to change scroll of mouse forward/backward(vise versa) to expand/decreasing chart as per my convenient.
1) I\’m afraid, date format cannot be changed
2) You can use the zoom option (with + & – symbol) to zoom into the required chart area. This is available at the bottom center of the chart in Kite.
1. Is there any indicator in Pi, which shows Fractals as aligator in Kite.
2. How to change color of -DI line to Red for Directional Movement System in Pi
Vinayak, Fractal chaos bands are available on Pi
2. Change in DI +ve and -ve bands is not possible on Pi as of now. Will pass it as feedback to the product team
Dear sir,
Using RENKO options of application only start from 1 minute and it erase privious printed boxes.
If you include tick by tick facility it helps know correct position to enter buy and sell stock better way.
Can your team can add this.
Thanks,
Angayerkanni
There will be no difference in the bar even if tick-by-tick data is used as the brick is only formed after the completion of the timeframe. read more on the brick formation here
Pl show some examples to do correctly and where put stoploss.
Thanks
Angayerkanni
Dear Karthik sir,
We need HMA colour change option is useful for all our subscribers.
Please try to add at earliest possible.
At present I am using Kite mobile app.
Thanks,
Angayerkanni
HMA?
Yes hull moving average
That\’s call hma
Dear sir,
We need HMA colour change option is useful for all our subscribers.
Please try to add at earliest possible.
At present I am using Kite mobile app.
HMA meaning is hull moving average
Thanks,
Angayerkanni
We don\’t have the colour change option in Kite. Will forward this as a feature request to the development team
Ok, will look this up.
First of all thanks for providing a good quality material, its easy to understand
I want to open online account through aadhar based.. I saw account opening process in zerodha youtube channel..
In some other youtube channels say you must be a kyc verfied before opening online account opening but you have not mentioned it. i am not kyc verified
Do kyc verification automatically processed by zerodha (as KYC is done through a SEBI registered intermediary (broker, DP, Mutual Fund etc.)
if not how can I get kyc verfied or where should i go to get verified.. please provide me a link sir.. I am new to this kyc process, heared but i dont know the process
Kindly reply me sir
Hoping for response
Thank you
You don\’t need to be KYC verified to start off with the online account opening process. You can start the signup process on our account opening page here.
Hi Karthik
I am trying to understand VWAP in kite(Android Version). What is the start point of weighing the trading prices in kite(Andoroid version).Is it start of a day or is it start of whatever option is opted in the screen- eg ( 1 day, 5 day or 1 month).It doesn\’t appear for 1 year.
Tarak
Its usually run on a cumulative basis, starting of the day. Its rest to zero at EOD.
I placed a buy cover order.. Can i placed a regular stoploss sell order for that cover order? or i have to place/exit as cover order only… Kindly reply me sir.. I am confused about it
what is the difference between Limit Bracket order and SL Bracket order as both showing same expect trigger price..
Can we use SL bracket order for placing orders like normal bracket orders or it can be used only for placing stoploss?
Kindly reply me sir
1. Bracket order, in general, comes with a stop-loss and target order after the position is entered. Limit and Stoploss BO orders only differ in the way you enter the trade. In Limit BO, you can enter the buy price below the market price and the order is executed if the price falls to that level. In SL BO, you can enter a higher trigger price and if the stock hits that price, your order is executed
2. No, you cannot. The cover order comes with its own stop-loss order that goes becomes open once the entry order is executed
Thank you Karthik, hope the wait is short
I hope so too 🙂
Hi karthik
I tried back testing the code I wrote in zerodha pi but the software didnt give me any result
There wasnt any error message either.
Even when i ran a simple code like volume>100000; the software didnt return value. can you kindly
guide me through to resolve this issue?
Tarun, I\’d suggest you reach out to – [email protected]
Thank you karthik. another query. Is there an option to get the alerts created on expert advisor on mail or on my kite account?
The thing I can use only kite when I am in office(cant download on office pc. against the rules). And there are no such features on kite.
so if there could be an option to get the alerts on gmail , that would help me a lot!
kindly bring in this feature
Tarun, request you to wait for few days, you may just get what you want 🙂
Karthik Sir,
How r u ?
How to set ADX for weekly chart ?
The same way as you\’d with EOD. Use the default values.
Ok Thanks sir.
Hi Karthik! I have a doubt on stock splits.
When I see some line charts in Google I see some sharp price drops of good quality midcap stocks to half. When I search for date of stocks split of that particular stock the date mention there is irrelevant.
So can you please explain me stock split with an example?
There could be instances where the data for the stock chars are not cleaned up. The data has to be adjusted to splits and bonuses. Why don\’t you look at the charts in Kite?
Okay thanks!
Welcome!
In supertrend what should be the default settings, Day or Hour or 30 min to get best results?
Default is day, but you can change this to any frequency which suits you.
I am not kyc registered.. whether i am able to open paperless trading and demat account ? Does zerodha provide e kyc process also? Kindly reply me sir..
You need to be KYC compliant. Zerodha will help you do that. Do you have an AADHAR number? If yes, get started with your account opening process here – https://zerodha.com/?ref=varsity
I would like to know what should be strategy for intra trading? which indicator should we use for intra trading out of so many . I really appreciate your effort of sharing your knowledge in simple words but still am confused about the strategy during live market. Using supertrend and macd they are time lag indicators they may indicate the signal too late .Which indicator or what should be strategy to action on time if not with little delay and what should be the time frame as well. Plz if you could solve my queries.
Shweta, you can use any of the candlestick pattern for trading intraday. Indicators are best used as a supplementary tool. Yes, these are lagging indicators and it won\’t help you identify the exact entry and exit points. However, the point here is to capture a part of the trend and not really the entire trend.
Thank you for replying. What should be time frame of the chart & indicator . And if we talk about your experience which indicator is best among the list .
I\’m not a big fan of indicators, Shweta. For intraday I prefer 10 or 15 mins charts, otherwise the EOD chart.
Dear sir,
Before more than three months on (3 Dec 2017) below request was send. Till date it is not updated. Will it update? In general after how many days you are releasing updated version as par past experience.
Please add vwap value (which is available with you) in DEPTH view. This is essential for customers.
with best regards,
ulhas khupase
Ulhas, VWAP data is available in Kite 3 in the market depth and below the charts. It is shown as Average Price. Check this screenshot
Dear sir,
This is required on mobile which is not avaible now.Need to shift screen very time.
pl check.
Thanks
ulhas
Dear sir,
There were many request to update software by adding features. But it is too late.
Need also icon to move chart towards left & right. There was also request of adding vwap with 4 digit accuracy at any time frame. It is now available only for 1 min chart & need to zoom. Request of adding alert is pending from many days.
This all required in mobile app.
Please request to take follow up with developer team.
regards,
Ulhas
Passing this to the tech team, Ulhas.
sir,
This is required on kite on mobile.
why we can not see VWAP chart separately like rsi,stoch,macd.
Need to see VWAP separately , will help better to take decisions.
Also need value of ATP in 4 digit like (245.7845). As this is available on chart but not at depth. please do this in depth also.
Regards,
ulhas
1. VWAP is a price indicator, hence it is formed as an overlay over the stock price chart(Just like moving averages). RSI and others have their own values and are displayed separately.
2. The Kite mobile app update will have the VWAP in the market depth too.
Dear sir,
VWAP value is not available in mobile app but it is in desktop.
It is only 2 digit accuracy but need 4 digit.
It is available with you but not providing.
VWAP with 4 digit is available on chart only for 1 minute timeframe.
regards,
Ulhas
Dear sir,
Charts on mobile must be continues update in the back process of mobile. Need to update in your software.
Need to release which is updated & tested till today.
regards,
Ulhas
Ulhas, your feedback about VWAP and Charts has already been forwarded to our development team. The next mobile app update will add most of the features you requested
I am not a regular trader/investor…
Is there any option of alert message available in zerodha? becoz its difficult to place stop loss daily for my order…( in Zerodha stop loss is valid for one day only)
Alert message to the phone that your order is crossing etc. It will be good if there is an alert message…
If available kindly say where can I find it in kite chart? if no kindly think about… It will be extremely helpful for people who are doing jobs like me…
Reply me, sir
I understand, Venu. In fact, we will have something along these lines very soon.
What is the difference between trigger price in Nrml MIS and CO? In cover order, there is range mentioned?
will order not executed if we don’t place trigger price specified by zerodha?
kindly reply me, sir
Trigger price is when your stop-loss order gets triggered and becomes an active order. The stop-loss(market) order is the same for all three products, NRML, MIS and CO but since CO is a leveraged product, the stop-loss needs to be in the range and orders placed beyond this will not go through
HI Sir,
If we enter a long trade and if the candle low coincide with in and around S&R level and if Close- ATR value differs from SL.then
1.If (close- ATR) value is below the candle (pattern) low,what should be selected as SL(candle low or Close-ATR value)?
2.If (close-ATR) value is above the candle low then what can be set as SL?
1) Candle low
2) Candle low
In other words, the order of preference for placing SL is –
1) Volatility based – explained here – https://zerodha.com/varsity/chapter/volatility-applications/
2) S & R levels
3) Candlestick patterns
4) Other techniques
Please clarify this doubt too sir..
1) Until now I am placing market orders it is getting executed in different orders separately…
But I never tried Limit order(Thinking order not executed)… But I want to try this… what happens if there are fewer buyers/sellers for the order at that price? will order gets executed?
Suppose if want to place a BUY order for 500 quantity at Rs 100… But sellers at that price are only 150… Will 150 be executed or it executes only when complete 500 available? Kindly reply sir I want to use BO from now?
2) Can we close BO and CO orders before Target / stop loss hits?
1. While using Limit orders, if sellers are not available for the whole quantity, your order will be partially executed and the order will remain open for the rest of the quantity.
2. Yes, BO/CO can be exited before either Stoploss or Target is hit. You can click on pending SL or Target order in the orderbook and click on the exit button
Thanks sir..
What is the difference between trigger price in Nrml MIS and CO? In cover order, there is range mentioned?
will order not executed if we don\’t place trigger price specified by zerodha?
I am using REGULAR order for MIS…We can edit profit and stop loss in it …
whether there is any chance of editing take profit and stop loss in BO after executed?
One more I am confused when I type margins for BO or CO… Suppose if I place an order for 100 quantity at Rs 100 and stop loss at 96
Their margin displayed as 480 .. Will if stop loss hits Rs 400 deducted or whole 480 deducted?
Kindly reply me, sir, I am confused with it?
1. Yes, you can edit stop-loss and target(profit) for BO orders after the first leg is executed.
2. Rs 480 will be blocked from your account when you take the position. Since there is a loss of 400, Rs 80 will be credited back to the account after the stop-loss is hit.
Thank you sir
Loving it. thanks to you sir.
When can we say there is an uptrend or downtrend?
If I am using day candles, how many continuous previous blue/red candles represent uptrend/downtrend?
If there are many continuous blue/red candles and then 1 or 2 red/blue candles then again 2 or 3 blue/red candles can we still consider it as uptrend/downtrend?
Mahesh, I\’d look for at least 10-15 trading session, contributing to at least 5-8% movement in price. This percentage figure can be much higher for stocks.
Please add Super Trend alert. It will be very helpful for options trading.
Thanks&Regards,
Kuldeep BB
We will soon have something around this. Request you to please stay tunned.
I wanted to place a buy order of a script and at the time of placing order, I wanted to give two conditions. Let me explain. Say I wanted to buy Ashok Leyland in between 137 to 137.50. While I place this order, I also want to tell the system that when Ashok Leyland will reach 150.00 it should be sold out automatically, and I also want to add that, If Ashok Leyland comes down to 130.00 it should be squared off to prevent my loss. And I want to place this order with for Good till date option. Say today on 27th Feb I place this order and I till the computer that this order with all its condition to remain valid till 7th of March.
My question to you, is this possible in any broker\’s software?
Everything is possible with a bracket order, except the GTD part. Bracket order is intraday order. Check this – https://www.youtube.com/watch?v=2TrYyOHA7P4&index=8&list=PLkxTRam6E2V-okv6gwQlt6dLTsn0v6CD1
Here in Zerodha … I bought 100 stocks at market order it got executed in 5 different orders… There are edit and exit option for each order separately… But I want to close my position all at once… Isn\’t possible to close all 100 at once?
Plz reply
Yes, please go to the positions/holdings tab and exit at once.
Hi Karthik,
You are doing great job man. Please help me to clear some doubt. I m trying with three super trend in crude oil with 10 minute chart and I feel it is working fine. Right now I am watching it, after so many bad trades.
Question is the what is best time frame for stock market 5 min is not reliable and 10 min is too late. My view is that if we can add
macd or adx or any other indicator and use 5 min chart will be very good, please share your view.
I m trying my hand in algo trading also do u know if we can buy successful trading setup which someone already using it in
streak.
Regards
Nisar
For the streak bit, you wil have to contact their support.
I personally would not like to use an indicator over an indicator. That may kind of complicate the whole business. I agree 10mins feels delayed, but as a trade off, you have looking at a slightly more stable chart. Shorter the time frame, like 5 mins, lower is the stability.
Sir, please reply me…
Here for bracket and cover order, there is more margin when compared to regular intraday… Suppose I placed RS 2 a stop-loss for 100 stocks took cover order, the margin required is 800… Will you take entire margin amount or Amount deducted by stop-loss(i.e., is 100*2 =200)
I am confused.. kindly reply me, sir
Suppose Stock price is at Rs 150.20 .. I decided to place MIS buy Limit order at 151.70 and stop loss at 150.70 and Target price of 153.20… Which order is executed first? Either Buy order or stop loss order?
I am confused about it… How can we place predetermined orders? Is it possible in MIS(Regular)?
Kindly reply me, sir
For this, its best you use a bracket order, Padma. Check this – https://www.youtube.com/watch?v=2TrYyOHA7P4&list=PLkxTRam6E2V-okv6gwQlt6dLTsn0v6CD1&index=8
If we were in profit during at the time of Autosquare off(3.20pm).. Will profit is added, or Loss(low of the day is calculated)?
I just started trading in zerodha… But in my area Power cut is from 2-3.30pm.. Incoming summer it will be maybe more…
Kindly reply me, sir
Yes, your P&L will be adjusted to it.
Sir, please reply me..
In zerodha s youtube channel.. They are not giving reply..
1)If we place MIS order(Regular)… we can place stop loss by clicking on exit order button… But how can we place Target?
Can we place two exit orders (one for stop loss and one for Target ) for one MIS order?
2)Whether we have to cancel Stoploss order if target hits or it will be auto-cancelled?
Kindly reply me sir…
1. Yes, you can place both stop-loss and target order for one MIS position.
2. You have to cancel one of the order if the other one is executed. You can alternately use Bracket Order where the other order is cancelled automatically
Thanks for the excellent module…
1) whether we can use Bracket order for market order placement since we can define take profit and trailing stop loss only in BO, it\’s not available in cover order
2) I want to do intraday trading… When the moment I press MIS will it use only margin amount or Total amount blocked as seen in Cash and carry(suppose if SBIN is trading at 260 margins required for 10 stocks is 760.. will only 760 blocked or 2600 blocked?
3) I heard that Call and trade(Rs 20 ) are charging for intraday trading? Isn\’t it true? Will intraday trading come under Call and trade?
4) Kindly make a video on All order placements, it is confusing ?
Kindly reply
1. You can place a market order with BO by entering you buy price higher than the LTP. This will trigger a market order.
2. Only the margin will be blocked for MIS orders
3. Call & Trade charges are charged for intraday orders not squared off only. If you square off your order before 3.20 PM, this charges won\’t be levied.
4. Check out our demo at 2.30 PM and 6.30 PM to get used to Kite (Order placement is clearly explained
Thank you, sir…
I missed the demo… Is there any link? kindly provide me…
Please do subscribe to our channel and you will get a notification when the demo is live – https://www.youtube.com/zerodhaonline
Please reply to this doubts also…
1) I failed to square off before 3.20 due to some power issues or technical issues for intraday trading, what happens to buy and sell orders(leaving Call and trade charges)? If I was in profit by that time, will profit be given? Nowhere/No one has it is mentioned/explained…
2) I heard intraday can be converted to CNC(cash and carry) trade if we have sufficient amount, but I didn\’t find any option in Order window(in zerodha kite/zerodha pi) for conversion to CNC… Kindly reply where it is available…
3) Sometimes Bears are continuous.. Will we can hold Sell order for some days for positional/swing trading?( I practiced in money bhai it\’s completely different from that)
Kindly reply me, sir…
Thank you
1. If you don\’t square off, our system will square off the position with a market order.
2. Check this screenshot on where you can find the conversion option.
3. In Equity, you cannot hold a short position. You can however, do the same in a Futures trade
If we were in profit during at the time of Autosquare off… Will profit is added, or Loss?
In money bhai (practice site) there is Loss calculated i.e… if we buy a stock they are autosquaring with Low price of the day.. Its end up in loss…
Kindly reply
I saw the \”valuation Line\” as indicator in Kite3.0..can someone elaborate what is it exactly. how is it supposed to be used.
Also I noticed one anomaly…the valuation lines\’ value changes as you zoom in/out in the page!! that shudn\’t be happening right?
kindly elaborate on this
I\’m not sure about the valuation line, maybe I should do some reading up on this.
Hello Karthik,
Any updates on this…
This looks like a simple standard deviation plot – very similar to the Bollinger bands.
Yeah, but why are values constantly changing?….shouldn\’t the values be static….i.e values change even when I zoom in/out of the page. Because of this \”ever changing\” nature it becomes very confusing when I try & understand ..& perhaps look for a trade setup.
Kindly help on this.
The values changes because when you zoom in and zoom out, more data points are loaded, hence they change. However, let me check this once again!
Whether we can place stoploss for Cash and carry? If yes kindly reply sir how can I place… Here stoploss & target available only for intraday..(in zerodha kite)
Hoping for reply
Thank you
Rajesh, you can place a stoploss and target for both CNC(Cash and Carry) and MIS(Intraday). However, the orders will be valid only for a day, it will get cancelled(if not completed) at the end of the day.
Meaning you have to update/edit stoploss regularly each day for same order
Am i right?
I want to do positional and swing trading….
Yes, this is because all the orders which do not get executed during the day are flushed out of the system.
Meaning you have to update/edit stoploss regularly every day for same order
Am i right?
In cash and carry whether order can be carried forward for some days or it is valid for only one day?
Confusing..
I want to do positional and swing trading….
Kindly solve my issue
Thank you
Hi
am an active option trader
what happens if i am able to make huge return on options :
i.e. say started with 5000 rs multiplied 5 times to 25000
25000 to 75000
75000 to 150000
150000 to 750000
750000 to 3000000
3000000 to 15000000
here in above illustration i could make 1.5 crore with investment of 5000 rs , i just illustrated round figures for you to get an idea, whereas the actuals are having losses also , i just drawn the end result.
i was doing paper trading this since many months
this happens in bank nifty weekly options and just assume that i traded like the above in 2-3 months time and what would be my tax treatment, any issues i will face etc.
pls explain will i enter into any kind of trouble if i execute trades like above
regards
ashok
Well, this is easier said than done, but good luck with it anyway 🙂
For taxation, I\’d suggest you check this – https://zerodha.com/varsity/module/markets-and-taxation/
How can I add VWAP on PI.
Please help
VWAP is currently not available in Pi.
However, you can find it in Kite
I have seen Traders Giving Targets. But I don\’t know on what basis the Targets Are Given. Is their any Indicator Giving Targets.
Usually, the S&R plays an important role in here, Aditya.
Ya! That\’s I understood. But what If a stock has never Reached a point but The Traders are giving Target of that point.
Than How they managed to give such a Target where the stock has never reached.
I\’m really not sure about that Aditya. I guess its a blind guess, disguised as intelligence 🙂
I am not able to install PI on my laptop. May be i am referring wrong download link. Can anybody provide me link to download Zerodha PI !
Use this link.
You can alternately find this in the Downloads & Resource page
Hello Sir,
I am a CA Final Student and started trading 2 months ago, learned everything about TA from you and Steve nison and John j murphy\’s book.. Lately i have been developing a huge interest in capital markets and I want a job in AMC\’s / Investment banks.. For that which course would be better.. CFA or CMT?
This question is not related to any of the concept discussed in the module… I am asking it here because i don\’t have any other medium to discuss with you.
Thank You
Sarthak, I\’d advise you to start preparing for the CFA certification. This is a long process, but in the end, this is totally worth it. CFA certification is recognized world over, and I think its one of the best if you aspire to get yourself a job in the asset management industry.
Good luck!
Ok, thank you!
Cheers!
Hi
I want to do swing trade as well as BTST. I use adx and candle stick but some time it goes wrong. So suggest me appropriate indicater for correct trade.
You should emphasise more on CS patterns, dont stress much on indicators.
Hi Team,
Do we not have Camarilla pivots in Kite charts?
Camarilla Pivot Points aren’t available in Kite but are in Pi. You can right-click on any chart in Pi and select Pivot Points>Camarilla Pivot
karthik sir,
why bracket order facility is not in commodity?
If you think about it a Bracket Order is an algo. MCX is not comfortable with algos. Hence no BO.
Hi ,
I have started my Zerodha account and I got my client id and password. But now I am getting frequent mail asking (Power of attorney ) POA document physically signed and it is mentioned that it is required to sell the shares from my demat account.On the other hand on the POA document, it is written \’voluntary\’.Can you give some clarification on this .
Deepak
Let me check up on the usage of the term \’Voluntary\’. However, you need to sign a POA for debiting shares from the DEMAT account, so this is really required.
Hi Karthik,
POA has many other clause apart from debiting share from DEMAT account.
How to provide POA for only debiting share and not the other clause.
Regards,
Mukesh
Which clause are you talking about, Mukesh?
thanks sir,
fibbanaci retracemnt pattern are not avl in this..
any idea about this fibbanaci pattern…..
Not available where Kumar?
Hello Sir,
How\’s John J Murphy – TA of the financial market book?
Or any specific book you want to recommend?
And also what are your views on sintex plastic… Breakout from inverse head and shoulder after a downtrend suggesting trend reversal?
looks like a breakout from a double bottom.
It is one of the best books. I highly recommend the book! Happy reading.
sir,
Is it Atr stops and super trent are same calculations ?
Thanks
No, they are different.
kartik sir,
I wrote in previous message that support team is not responding & also not solving problem, so I comment here.
Yet it is pending.
I\’ll follow up, Ulhas.
I\’ll follow up on this, Ulhas.
What are your views on HDIL… Breakout from triple bottom on huge volume today?
What target to expect?
Yes, that looks like a sweet breakout 🙂
A 5-8 buck rally looks possible in the short term. I\’m basing this on the content discussed in the Support & Resistance chapter. Good luck.
karthik sir,
I think I attached wrong aadhar no to my account. This happned as I am handling many accounts. So I want to confirm aadhar no. This is also not visible at q zerodha. Is it possible to delete current attached aadhar no? If so I will again update correct no. I try to call support but no response. How to solve this issue? please do the needful. why it is not visible in q zerodha account.
regards,
khupase
Ulhas, you can call or write to our Support team and they will respond back to you with the information.
Sir,
Can you please suggest the books for technical analysis? and the all indicators analysis and how can we use it for our trading purpose? what are the possible combination that we can fit in the scanner for some trading systems?
Aslam, I\’m assuming you have read through all the content in the TA mule here. In case you are looking for more, I\’d suggest you pick up this book called \’The Japanese Candlestick Charting Techniques\’, by Steve Nison.
Hello sir..
I\’m fresher in Zerodha… Would you like to help me out to know which indicators should be used in which range to make profit…
Cant really answer that 🙂
sir,
It is very very important in commodity for me. As this is available with you, need to only show seperately & also in DEPTH area.
Sure, have passed the feedback to the tech team. Thanks.
Sir, Thanks for promt reply.
As I observed that some times VWAP value shows 2 digit & some time 4 digit in charts. (56.15) & (56.1348) Why it is like this?
Ah, need to check this. But for all practical purpose, you don\’t have to go to 4th decimal, unless you are trading currencies.
Mr. Karthik,
Thanks for your content regarding trading. It is helping alot of beginners like me in understanding stock market in a better way than ever before. I really appreciate you and your team at zerodha for making it possible for everyone.
Here comes my query.
1. I have completed technical analysis module and i decided to put all the knowledge on the real time stocks. But, when i started analysing the chart, i was unable to replicate what has learnt in the module and couldn\’t able to identify patterns and predict what is going to happen. Guide me how to put everything that i learnt in the practise or provide any other additional study material which gives practical implementation guide.
2. Even though you suggested newbies to not to try intraday but my mind is putting a lot of pressure on my thought process to move against the waves and learn the stuff from the risk. Now comes this tricky part. I want to learn yet not to fail disastrously(little failing and learning is okay though but not too much). Tell me how to have a plan for this.
3. Initially i\’m planning to invest 5000 as a part of learning process and expecting 100 INR as an overall profit for a day. Kindly tell me how i can achieve this target with an intraday strategy.
4.
a. Tell me how to choose different stocks for the portfolio or regular intraday stocks and how to bet money based on trends.
b. Help in finding patterns easily with the help of predicting indicators.
c. What are the basic parameters, indicators, patterns, trends, identifications that i should know everyday (not taking much time) to get min of profits?
d. Im always getting confused with stoploss, stoploss-m and other advanced options while placing an order either buy or sell.
Thanks in advance.
1) When you look at the chart, concentrate only on the last 2-3 candles. Look at what pattern they are forming, then look for the associated prior trend, the look for support and resistance. Do this for 50 charts for 2 months continuously. I\’m sure this will set you on the right path
2) I dont know how this can be done safely :). The harder you fall, the stronger you raise, provided you willing to learn from mistakes.
3) Nothing can substitute practice
4) Have explained this in the previous chapter
I\’d suggest you reread the chapters on candlestick patterns.
Dear sir,
Please add open interest & vwap value (which is available with you) in DEPTH view. These are essential for customers.
I understand, will pass the feedback to the development team. Thanks.
I want to take VWAP in seperate window like rsi or macd or willams%r.
I want to seperate it from candles.
Is there any idea to do this?
If not will you please consider it as customer requirement. How many days will it take to do this. Are you updating customers requirement in software?
Thank you,
regards,
We are always eager to hear our customer\’s feedback/requirement. VWAP is certainly high on priority. Unfortunately, I cannot comment on timelines involved.
is in market any leading indicator
and how to use for trading
I\’d suggest you start with RSI.
Hi Kartik,
Could you please help me with the following…
1. Could you suggest any indicator which would help in determining whether the trend is moving sideways? Other than ADX that is.
2. Could you explain briefly about the Elder Ray Index as it is plotted on Kite? I have an idea from whatever I read on other sites but there the bull and bear powers were plotted separately and its kinda difficult to understand while looking at the way its plotted on Kite. I know writing an article on it would be tough but even if you could tell the basic interpretation (in accordance with how it\’s plotted on kite), it would do. Thanks in advance.
~Abudhar al Hassan.
1) If Moving average or MACD flattens out, then it means the markets are flat
2) Will try and put up a note on this sometime soon.
Thanks Kartik. Appreciate it.
Just one more thing…supposing I open positions in FnO segment and I intend to hold it for a couple of days. Right now, since we don\’t have a GTC or similar order I have to login everyday and place a fresh stop-loss order when the market opens. What if I place the stop-loss order for the open position(s) as an AMO order after 4pm current day and before 9am the next day? Will it be considered as a fresh order and be executed or the exchange would understand that it is actually a stop-loss order for the open position that I am holding.
The reason I am asking is because it\’s easier to place the stop-loss order in d evening or night rather than every morning when you are in a rush for other works. Please let me know. Thanks.
~ Abudhar al Hassan.
Yes, you can place an AMO stoploss order for your position after 4 PM and before 9 AM and a fresh order will hit the exchange at 9.15 AM when F&O market opens
Hey I just completed the Technical Analysis module. Just want a suggestion.
Should I start using this knowledge and start short term trading or should I complete all the modules and then start my quest.
I\’d suggest you start with identifying short-term opportunities using TA. This will help you as and when you learn other topics.
Sir, if i want to enhance technical analysis knowledge then can you refer any course for same?
And whether supertrend indicator can be get applied to mid term holding to long term holding ?
You can take it a step further and look at a certification from CMT – https://cmtassociation.org/
Yes, you can use ST for medium-term trading.
Yeah, Thanks..
i am confused in between CMT or CFTe.
what will you suggest?
I\’d say CMT. But please do your research as well.
Sure sir, and also suggest me some books on technical analysis and future-options. i have japanese candlestick charting by steve nison, but want to read more n more. Really inspired beacause of your knowledge.
Check this – https://www.amazon.in/Technical-Analysis-Trends-Robert-Edwards/dp/0814408648
Sir,Iam following a trading strategy and it is working quite well.But,main problem is that Iam unable to ride on winners for long time.Example,if a trend is working in my favor,then Iam getting out of positions with less profit because of the fear of \’trend reversal\’.But actually the trend is continuing.I loose tons due to this sir.Even trailing stop loss is not working,because my stop loss hits and trend continues…\”Cut your looses and let your profit run!!!\”…Iam doing the first one correctly,but unable to let my profits run.Please suggest me a a way to solve my problem.Which indicators or others I have to use???
Ah, there are two things that you can do –
1) Have deeper stop losses – which also means you should be willing to take higher risks.
2) Have a mental stop loss – dont place them on the system, but have it in your mind and get out when you know its not working in your favor.
I\’d prefer the 1st one.
Thank you sir…:)
Cheers!
Hi! Kartik,
I have been tracking markets for last 10 years, i opened and closed lot of demat account with several brokers but \”Zerodha\” is different amongst all of them. Thank you for your kind support and guidance.
I also want to ask that if I want to go ahead and learn technical analysis in depth please recommend a good institute or professional who can teach.
Sorry, I mean Karthik in Gujarati we spell Kartik.
Whats in the name, Varun 🙂
I know but there is something in the name Karthik …☺
🙂
I\’m so happy to note that Varun 🙂
Check this – https://cmtassociation.org/
Ok, thank a lot …??
Happy learning!
Hi,
I actually encountered this website when i was searching some topics related to Options. I was so impressed by the lucid explanation that i devoted time to read other chapters as well. Took my learning a notch higher when i decided to open a trading account with Zerodha, hoping to apply the same. Finally i have some good material that i could relate to.
To cut a long story short, great work team! Cheers!
Thanks for the kind words, Soby! Hope you continue to enjoy learning here.
Good luck and happy learning!
Iam new to zerodha.Yeterday I start my first trade in zerodha.Iam a scalper and did minute to minute trades with nifty and bank nifty.My profit was 2298.I felt very happy.But today i got mail from zerodha.Taxes were very high and actually iam in a loss of 928..:(.Pls help me sir.
Well, taxes are a reality and no one can avoid it. Maybe you are over trading. Take fewer trades with high conviction. Focus on profitability and not really on \’number of trades\’.
hi!
on 26.Aug.2017,
You have replied to one Sunil,, that FIBONACCI, is available on kite.
However, it is NOT available, despite my intense searching through kite charts.(So, this makes me to ask
the same question:- \”How can you help me, to get FIBONACCI chart onto my kite??)
I shall be grateful, for your answer ,which would enable me to really have FIBONACCI chart.(instead of the same cliche answer).
Also,I would like to place on record,my highest appreciation for your peerless & exemplary efforts in your,VARSITY. Your BEACON of KNOWLEDGE ,has LIGHTED up ,the candles of the market!!! thanks & regards
Hhaha, thanks for the kind words, Chandra! I hope you will continue to like Varsity!
To find fibonacci, click on Draw (right-hand top), this will open up the drawing tools (on your left-hand side), in the drop-down, click on Fibonacci and use it 🙂
Sir,Please suggest the check list for nifty intraday trading to catch atleast ten point movement.I will take it as thum rule.Thank you
Trading for a 10 point move can be very tricky 🙂 What will be your risk to reward ratio?
1.As it is intra day,risk reward ratio between 0.5 to 1 is ok for me.But please give your opinion regarding this sir.
2.Consistency is more important me.Please suggest me the check list.I will treat it as Bhagavadgeeta ..☺
1) irrespective of the timeframe, I think a RRR of over 1 is desirable
2) I would suggest you tweak the checklist given chapter 19 slightly for intrday. For example, you could consider overlaying 9×21 minute as your intrday MAs.
Thank you so much sir.
Welcome!
Can I use the same check list for trading nifty futures.Is is it good sir?
Of course!
How to assure that a positive supertrend crossover is true or false. What other indicators can increase the degree of surety.
Regards
Hmm, you can cross check this with candlestick pattern perhaps.
Supertrend indicator cannot be used in expert advisor in Pi trading system. That\’s why i moved to amibroker. There are meny AFL regarding supertrend . I also coded mine . But there is some differences in signals. We know that olivier seban developed supertrend, but u try it on ami there are no one to authorise or to verify. So it will be so helpful if u guys provide original engineered Supertrend in AFL for ami. It will be okey if its in TradeScript but i assume it will be very hard. Thank u.
This could be tricky, Dipayan. I\’ll pass on the feedback though.
Thanks for reply. That would be very helpful. I\’ll be waiting.
Cheers.
Hi Karthik,
I have noticed that the VWAP value which I calculate manually does not match with the one collecting from Nest Trader. For example please find the INFY SEP FUT data which I have collected from nest trader on Sept 9th, 15min interval. the first column is the Vwap value from ZT and the last column is the wvap value calculated manually using above method. Can you please let me know why there is a difference?
Vwap Value Open Rate Close Rate High Rate Low Rate Date Time Differential Vol Cumulative Vol VWAP Manual
901.87 902.00 904.35 904.70 898.50 07-Sep-2017 09:30:00 545500 545500 902.52
903.44 904.40 903.05 904.75 902.00 07-Sep-2017 09:45:00 222500 768000 902.73
903.34 903.05 903.50 904.20 902.50 07-Sep-2017 10:00:00 213500 981500 902.88
902.22 903.50 901.70 903.50 901.60 07-Sep-2017 10:15:00 157500 1139000 902.79
901.20 901.70 900.95 902.00 900.20 07-Sep-2017 10:30:00 96000 1235000 902.66
899.73 900.95 898.00 901.60 897.55 07-Sep-2017 10:45:00 208500 1443500 902.14
898.53 898.00 898.15 899.35 897.80 07-Sep-2017 11:00:00 93500 1537000 901.91
898.52 898.15 898.80 899.70 897.65 07-Sep-2017 11:15:00 77500 1614500 901.76
898.62 898.80 898.00 899.05 897.90 07-Sep-2017 11:30:00 69500 1684000 901.62
898.86 898.00 899.30 899.30 898.00 07-Sep-2017 11:45:00 52500 1736500 901.53
899.00 899.30 898.75 899.45 898.75 07-Sep-2017 12:00:00 23000 1759500 901.50
897.96 898.75 898.65 899.10 897.05 07-Sep-2017 12:15:00 108500 1868000 901.31
898.42 898.65 898.00 899.30 897.90 07-Sep-2017 12:30:00 59500 1927500 901.22
898.20 898.00 897.70 898.50 897.60 07-Sep-2017 12:45:00 36500 1964000 901.16
898.44 897.70 898.35 899.05 897.70 07-Sep-2017 13:00:00 44000 2008000 901.10
898.33 898.35 898.30 898.50 898.05 07-Sep-2017 13:15:00 30000 2038000 901.06
898.26 898.30 898.30 898.45 898.00 07-Sep-2017 13:30:00 39500 2077500 901.01
898.33 898.30 898.40 898.65 898.05 07-Sep-2017 13:45:00 49000 2126500 900.94
898.18 898.40 898.00 898.80 897.25 07-Sep-2017 14:00:00 115000 2241500 900.79
898.16 898.00 898.25 898.50 897.75 07-Sep-2017 14:15:00 43500 2285000 900.74
898.73 898.25 898.95 899.00 898.25 07-Sep-2017 14:30:00 65000 2350000 900.69
898.75 898.95 899.20 899.25 898.10 07-Sep-2017 14:45:00 64500 2414500 900.64
898.87 899.20 898.70 899.25 898.50 07-Sep-2017 15:00:00 46000 2460500 900.61
900.07 898.70 900.40 901.20 898.60 07-Sep-2017 15:15:00 324000 2784500 900.54
900.06 900.40 899.55 900.80 899.05 07-Sep-2017 15:30:00 268000 3052500 900.48
You will have to discount for minor errors, Anoop. This is because one cannot capture all the tick data.
Thanks Karthik
Welcome!
hi sir,
please tell me if i should invest in stocks which are at 52 weeks high if they are just increasing after long time(1-2 month) and volume is satisfactory.?
how should i interpret it? as an uptrend or just a noise in market?
It really depends on your conviction, Suresh.
1. What should be the time spacing (5m, 15m or 30m, 1D etc.) when using different indicators mentioned here?
2. What should be the period(1D, 5D, 1M etc) since for example some indicators are for 14 days, then if we select 1 year period for the stock price, is it okay? How does it work? The indicator will still show for 14 day period only? Or should we change this 14 days to 365 days?
3. Should all these like the super trend be used along with the other 6 point check list like candlestick pattern volume etc or on its own?
Thanks,
Ash
1) Depends on your trading temperament – ideally, it should be the same frequency as your price chart
2)Yes, that should be ok
3) Yes
helo sir
fibonacci tool is not found…its a very good tool.pls do something about that
Not found where? It\’s there in both Kite and Pi.
Can you suggest few books or website for technical analysis education
Check out Japanese Candlestick Technique by Steve Nison.
Is VWAP indicator available on Pi? If not is there anyway we can get the same on Pi? Thank you
VWAP is available on Pi.
Is this (VWAP) really available in PI.. please clarify
No, Sudheer, unfortunately, this is not available on Pi. However, Kite has this indicator.
Is there any plan to get this indicator on pi ??
Not sure, Vikas. Let me check with the team.
Is there any TDI (Traders Dynamic Indicator) in Kite.
Don\’t think so, but I\’d suggest you run through the studies once and double check.
Sir,
Which one is the best between RSI, William%R and Stochastic indicator to identify overbought and oversold zones?
Nothing like the best…each indicator works under different market conditions.
Hey this is Sahil ,
I am interested more in commodity so, Can I start commodity module after this or I have to follow the sequence of module .
I\’d suggest you go through the Futures module before getting into commodities markets.
Sorry investing.com
Hi, Karthik!
Thanks for the wonderful material!
Is candlestick pattern analysis is good for someone looking to hold the position for 1month to 3 months?
which is an ideal time frame to be selected? If not which technique to be used for analysis.
Please reply
Regards
keerthan
I\’d suggest it\’s best suited for trades under 4-6 weeks. Although, I\’ve noticed the beginning of a long and sustained momentum runs based single candlesticks patterns.
Thanks a lot for the prompt reply as usual (::
If I want to start trading with time duration of 1 to 3 months what analysis should I go for?
Regards
keerthan
I\’d suggest you start with Technical Analysis.
Sir when will we have Stochastic RSI indicator as its on inveterate.com on kite?
We depend on a 3rd party vendor for charts. Let me check with the team on what best we can do.
hi,
is ADX indicator available in pi?
Yes, its called Directional Movement Index in Pi.
Also, any plan to include Relative strength Comparison(RSC) indicator. I think it is available only in Metastock.
We use 3rd party charting engines so it really depends on them to add indicators.
Hi Karthik,
ADX indicator is missing in PI in the study option. Could you please check and confirm.
I am using latest version v1.0.0.6 update on 7/17/2017
Look for the directional movement system. It is the same thing.
Thank Karthik 🙂
Sorry to bother again,
Now I see Alligator Indicator is missing in PI however it is available in Kite.
I remember seeing it last time 🙂
Karthik, just a QN pop up in my mind…..can I buy shares in delivery (CNC) by not entering the quantity of shares I want to buy but the amount of money I want to invest in a company???
For ex rs 25k at cmp in a company instead of the QN of shares …
No, you will have to specify the number of shares you want. However, you should check out Smallcase, they allow you to do something similar to what you are asking for – https://www.smallcase.com/
Lot of things to study, it is very useful to beginners like me, Today i learn lot of thinks, thanks Zerodha team to develop such a study material.
Happy to note that, Rajesh!
It is very difficult to differentiate between paper umbrella and spinning top.
Can you please help me to find out the best way to differentiate between both ?
Spinning top has a wafer thin body and short shadows, paper umbrella, on the other hand, has a small body, short upper shadow, and a long lower shadow.
Yesterday\’s AMBUJACEM chart showed a bullish engulfing pattern. I entered CNC trade at 266.5 with a stop loss of 258 as suggested by \’the lower of the two rule\’. Today the stock closed at 272.10 and I am planning for a BTST trade.
My SL-M order cancelled automatically at 4pm by Kite. So probably I will need to place a new AMO SL-M for tomorrow . My question is that for the new SL-M order should I stay with the 266.5 suggested by earlier rule or should I increase it to the low of today\’s green candle (264)?
You can certainly alter the SL to suit your convenience. But do make sure there is a logic behind what you do.
Hello Sir,
First of all, Thanks a lot for all your efforts you have put in for Varsity. This is very helpful.
I am not able to clearly decide on Support and Resistance level, Can you let me know any more parameters which I consider to get more affirmation on S/R levels.
Thanks once again for all the efforts.
Abhijeet, glad you liked the content on Varsity. Have you read this chapter on S&R? https://zerodha.com/varsity/chapter/support-resistance/
Ok Sir thank you.? but sir my last question is what moving average setting do you mostly prefer in 15 minutes chart.. Exponential, double exponential or triple exponential.. What is the most accurate one..
I\’d prefer the EMA over simple MA.
Sir please tell me some about your trading strategies, time frame, indicators and entry and exit, risk to reward ratio.. Please sir.
Everything I know is documented here, Sourav 🙂
Karthik, may I know the conditions for abnormal candle
Never heard of it!
And what is the indicators to see volume in chart
You can plot the volume indicator below the price chart.
And today I saw doji appear in uptrend but still market is moving high why? actually what doji does and how can I predict what next candlestick should be bullish or bearish..
Well, patterns are only predictive in nature, they do not guarantee movement in any particular direction.
Sir What intraday chart time frame do you mostly prefer for mcx nickel copper etc.etc.and today I saw alligator is it good can trade to depend on it..
15 mins chart gives me the comfort!
karthik,
I can see there is some technical error in dis module as the comments page is same irrespective of different chapters i.e support & resistance chapter, volume chapter comments page are all same…..
plz resolve dis issue soon
I think its sorted, can you also kindly confirm? Thanks.
No sir, its not sorted till now
Sir kab tak thik hoga??? I am not able to move to next chapter as I used to read each and every word of chapter & comments…
Its already 2 daysss…
We are working on it, Arun.
Thanks, will look into this.
Sir, I am an orthopaedic surgeon with keen interest in stocks..
Q no. 1:- Please guide me how to follow the trend using ADX indicator, Should I keep the trade on till the ADX is rising and exit as soon as it reverses?
Q no 2 :- If the candlestick has already crossed the SMA but still my supertrend is in sell region, should I initiate a long position of should wait till supertrend indicator says buy?
Q no. 3 :- May also use the slope of supertrend itself to follow the trend, as I have seen that steeper the slope better moving is the trend, and whenever it goes flat, a moment of indecisiveness comes in; should I stick with this methodology or please give your kind suggestions..
Doc,
1) ADX is best used to gauge the strength of the momentum. The decision to buy or sell has to originate from somewhere else…ADX is only complementary to that system
2) I\’d rely more on candlesticks
3) Slope again points to the momentum. You may as well look at MAs.
Its like if I start trade by using MACD and supertrend, and then remain in trade using ADX? as it keeps on growing I shall keep my long/short positions intact and whnever it goes down I will quit as it will show the losing trend? isnt it ?
how would you start and exit a trade? pls explain..
I\’ve explained this for each and every candlestick pattern. Request you to kindly give it a read.
Absolutely. However, you may want to use candlesticks as your main decision-making engine.
Thanks karthik.. You guys are awesome.. I am pleased to have a broker like zerodha.. thanks
Thanks for the kind words, Doc!
Dear sir,
I did not get the VWAP, I have point wise doubts:-
1.-Is not the points 4 ,8 and 5,7 are contradictory to each other.
I mean in point 4 you say the if the price is below vwap then the stock is in downtrend , but in point 8 you say if you want to go long the stock it is efficient to long at a price lower than vwap, मतलब कोई स्टॉक downtrend में हैं तो भला उसको buy क्यों करेंगा ??
SAME DOUBTS FOR OTHER TWO POINTS, IT WILL HELPFUL IF YOU COULD ELABORATE EACH POINT WITH THE HELP OF CHARTS.
REGARDS
The assumption is that you are trading based on another system and you are looking at VWAP only for the sake of efficiency of the fill.
Dear sir,
thanks for becoming our guide in the jungle of stock market, I have few doubts :-
1.) Say, I have identified a stock and S&R levels and other related research, finally I am bullish on the same, and as per our general convention the first resistance point should be our target, now, what I want to know is that Is there any way to determine or predict the period it will take to hit the target??
(Source of doubt: Generally we hear from analyst and experts that ये 4 से 5 महीने का टाइम फ्रेम ह, इसका 6 महीने का होल्डिंग पीरियड ह etc etc.)
2.) The market depth generally shows top 5 ask and bid price, if the total number of qty for sell is say 3000(top five), now if I place a market order for 5000 share to buy then the remaining 2000 shares will be fullfilled from upper side or lower side .
How the large qty market orders affect the price?
Secondly, which one we should prefer market order or limit order?
3.)I am little bit confused about pre and post market orders , the kheechdi that cooks up during 9 to 9:15 , and , moreover who can and should place pre and post market orders and their merits and demerits.
Regards
1) Not really – it is really hard to predict the timeline during which your SL or target could get triggered
2) Only top 5 are shown, the order book is usually deeper. So the rest of the shares are filled at higher prices. For this reasons its also best to place limit orders
3) Check this – https://zerodha.com/z-connect/queries/stock-and-fo-queries/pre-marketpost-marketafter-market-orders
Dear sir,
I did not get the point no.8 in ADX:
\”The trade stays valid till the stoploss is breached (even if the +DI and –DI reverses the crossover)\”
Say I go long when the +DI crosses the -DI, after few candles the -DI crosses over the +DI then as per rule the sell signal is generated then How can the the first trade (based on the buy signal) be valid ?
Regards
ADX just confirms the trend, it\’s best used in conjunction with a trading system where the signal to buy and sell originates. Depending purely on ADX is not a great idea.
hi sir,
every educational tool provided here is awesome, and i\’m looking for contents about zigzag. can\’t find it. is it available?
Thanks for the kind words Selva. Yes, the ZZ is not available. Maybe I will add it one of these days.
Sir, do you think stochastic is a good tool to practice charting? If yes could you please explain it along with the other indicators?
I tend to depend more on candlestick patterns rather than indicators…so generally speaking, I look at very few indicators. Most of the times, I restrict to just the moving averages.
Hi karthik sir,is it possible to earn RS 1000 per day from stock market consistently with a capital of RS 50000 by selecting a good trade a day?just one trade a day and no over trading. Is it easy and possible please suggest me?
We are talking about 2% daily return or about 504% return for a year. A very very very tough task if you were to ask me.
1. Please update with using Heikin Ashi charts
2. I am not able to find EMA, kindly let me know how to add to chart
3. Whether weighted close is same as Weighted Average Price?
Regards,
Soujanya
Both HAC and EMA are available on Kite. Please look at the chart types and studies for more information.
How can we apply ichimoku charts on Pi?
We do not have ichimoku on Pi yet.
when you planning to add. because i use this charts and have to see other software for the trigger
Cant really commit a timeline here, Amit. We use vendor\’s charting engine, so the update has to happen on their end.
ATR that we get from Kite is different than that of Pi. I downloaded OHLC data from Pi and used it to calculate ATR for different periods of my choice. The ATRs were calculated using the simple average of the true ranges of previous periods, which was matching with data from Pi, but not with Kite.
Can someone please clarify how ATR is calculated on Kite? Mainly, what are the weights assigned to true range from previous periods?
Thank you,
Jay
Hmm, possible due to two different charting libraries and two different (not drastically though) formulas used.
thank u karthik for reply.
Just to clarify more for intraday and longterm which of these following indiacators work well –
Period Multiplier
1) 7 3 long term or intraday
2) 7 4 long term or intraday
3) 10 3 long term or intraday
4) 10 4 long term or intraday
Can u please suggest as per ur preference 1 to 4
If there are other values to suggest please suggest as per ur experience with supertrend indiactor?
Well, there is nothing like one shoe fits all here. For each stock a different parameter could work.
if ATR get multiplied by multiplier then how can it help me to either sell or buy the stock.
Trading signals are generated 🙂
Period refers to the ATR number of days. The default value on Kite is 7, which means to say that the system will calculate the ATR value for the last 7 days. You can input any value you deem suitable.
The multiplier refers to a value by which the ATR will get multiplied. The default value on Kite is 3, so whatever is the value of ATR, it will get multiplied by 3. Multiplier is a crucial input for Super trend. If the multiplier value is too high, then lesser number of signals are generated. Likewise if the multiplier value is too small, then the frequency of signals increase, hence chances of generating false trading signals are quite high. I would suggest you keep this value between 3 and 4.
Suppose ATR for X stock is 40 and multiplier is 3.Then 40 X 3 =120 what does this value indicate(ATR x MULTIPLIER).I STILL DONT UNDERSTAND WHAT VALUES TO BE PUT ON FOR PERIOD AND MULTIPLIER FOR INTRADAY TRADING AND FOR LONG TERM TRADING? WILL BE GRATEFUL TO U IF U PROVIDE MORE FOCUSS AND GUIDANCE ON IT?
Hi Som, I\’d suggest you stick to default values to begin with till you get comfortable with the indicator.
Hello Karthik sir
I am talking about day trading in nifty futures only.
Well we learnt a lot in this module. Now it is easy to analyse the pattern, trends etc in middle of the chart but its very difficult to take a stand near right edge of the chart where future is uncertain. As far as candle stick pattern and volume are concerned they are reliable but indicators are not so much useful. By the time they show a reversal or a new trend a large chunk of points has already gone.
I hope you got my point. Please advise me how to use these indicators or to do day trading for that matter.
Thanks
Weel, this is in fact the whole point of TA. You need to get to a position where you will be able to take a position looking at the right side of the chart. This takes time and patience and will have happen over many trading hours and studying charts. Good luck.
sir,
is there any way to find resistance levels at all time highs?
as it is not possible to predict resistance levels than how can the analysts find resistance levels in all time highs.
No, that would not be possible.
Thank you Karthikji….
Welcome!
As per your experience, Which chart patterns are more reliable to enter a trade?
Its hard to circle in on patterns…you just have to go with the flow. However, I do have a soft corner for doji/spinning top based chart patterns 🙂
Can we do codify in the Kite tool to detect the patterns in the chart?
No, not as of now.
Is there any way to find morning star candle stick pattern from numbers of stocks rather then checking chart of all the stocks.
You can codify it using expert adviser – https://zerodha.com/expert-advisors/
is there any institutions are availabe to study regarding the technical annalysis for shorterm courses
Check this – https://www.mta.org/
Sir,
Head and shoulder pattern and double bottom , here we tend to make mistake like in head and shoulder tend to take a position in Support level (double bottom) but as per head and shoulder it will break and go down further…
But in double bottom it is an opportunity to buy ….
i just want to know like how to avoid that mistake and what is the difference between those two. …
Kindly explain…
Thanks
I guess the only ways to learn how to avoid is to learn by trading. Eventually, experience will teach you which pattern to trade and which ones to avoid.
Hello Karthik,
I have a query regarding a trading strategy that I use for day trading.
What I do is, use the VWAP indicator on 5 minute charts. Then I wait for the stocks\’ price to fall to the lowest that it has been in the last two days, or allow it to rise to the highest that it has been in the last two days. I then take a long or a short position accordingly. I have been using this method for a few days now and have booked considerable profits except for when the price begins to consolidate.
I wanted to know if you see any drawbacks in this strategy.
Also, I should say what an awesome job you have been doing with these modules. It has helped me a lot.
Thank You
Sure. It sounds good here, but frankly you will have to backtest your strategy to make sure its working under all possible use cases.
Hi Karthik,
First of all thanks for uploading all the trading research material in such a simplified manner, its good to re-learn again,
However my question is totally different (rather a suggestion)
1. I have 10-15 friends who are interested to trade in the stock markets but they can\’t do so because of their working hours,
2. Is it possible, in Zerodha firm, that I log-in from a single \”sub-broker\” id and trade for them-on their behalf?
3. Logging-in from each individual id is quite time consuming and by the time I will do it the ground situations changes a lot.
4. I had also spoken to one of your representatives regarding this, but they said its not available.
5. Can this be made possible?
6. Asking you because found your brokerage rates, support to be the best (even helping in taxation arena)
7. Am sure, if you get a solution to this, lot of people who cannot trade would able to do so.
Sorry for the lengthy span of the question, but I guess it would be mutually beneficial
Thanks
Vinod Kedare
Thanks for the kind words Vinod. I understand your concern, but our risk managment policies will not permit what you are asking for. Besides, this is also not permitted by SEBI.
Thanks for your reply buddy, if it ain\’t legally permitted then no use,
However I will open an account with Zerodha and will get all my 10-15 friends registered with you at the earliest.
But there is something like Auto-Trader (Proportionate Trading) provided by foreign brokerages in Forex trading – something similiar to your Open Trade
I guess if that comes under permissible rules, it can be extended in your brokerage aswell, and my problem would be solved partially.
Thanks anyways
Looking forwarding for good trading experience through your brokerage ( Last month I got 10% returns)
Thank You
Great, I\’m sure all your friends will have a good experience with Zerodha. Good luck.
i joined in zerodha on sep 2016. As of now I am doing only on equity cash segment and also i got winners certificate too in 60 days challenge. Can i get fundamental and technical analysis training to improve my trading and investing skills.
We have put out a really good content on both TA and FA, I\’d suggest you read through these modules.
Tnks and am looking live training sessions for better understanding. Since lot of queries come while reading self material.
Please do post them here, I will reply back within 24hrs or sooner.
sure and thank you
Welcome!
Hi Kartik,
Just wanted your help as I didnt know who to approach . I use metastock s/w for analysing the charts. I want to know how to use scanners…I mean suppose if 50 MA cossed 200 MA in any stocks or if the prices are above 50 day MA and 200 MA it gets highlighted easily . I tried asking the vendor but I am afraid it has not helped. Also tried googling . Would appreciate if you could point at the right direction.
2. Also do you have any screening system in kite?
Regards,
Shyam
1) I used to use Metastock around 8 years ago, and I seem to have forgotten the layout and technicalities. So I\’m afraid, I wont be of much help here.
2) No.
Hi Kartik,
After going through TA module,I have started tracking mini crude oil may futures chart since last week. I see that sell signal is visible in 5 min chart while this is not visible in 15 min chart. Why so? Though both the charts are showing that the trend is on lowerside. Indeed oil prices have been pounded badly since last week.
2. What time frame chart is suitable for trading in crude futures?
Regards,
Shyam
This is because you are looking at two different timeframes. I;d be comfortable looking at 10mins chart or any timeframe higher than that.
Hi Kartik,
What shd one do if there is a buy signal in 5 min chart and sell signal in 30 min chart ?
You need to stick to a time frame and take action according to that time frame. Do not cross reference the buy/sell signals across time frames.
Hi Sir,
Default supertrend parameters is Period;7,Multiplier:3 .will it work for all time frames(1day,1month and 1 week)?
For intraday 5 mins ,10mins and 15 mins chart ,if we want to use super trend what are the preferable parameters ?
You need to back test this on stocks. It may work for stock 1 but may not work on stock 2. There is no \’one shoe fits all\’ kind of thing in markets.
Hi I am using Kite and I want some guidance on Supertrend parameters? I want to know if I am looking at 15 min candle of a stock and if I put 15 in the supertrend period parameter as well then what it means? Does it mean that supertrend line is plotted based on close price of last 15 candles of 15 min each? or Last 15 candles of 1 min each?
Another question about time intervals: I have seen on Kite that the first 15 min candle time shows as 9:15 am, however, some other softwares show as 9:30. However the number of candles are 25 in kite and other software. So for intraday purposes, if I have to see the first 15 min candle then, should it be from 9 to 9: 15 or 9:15 to 9:30?
Although the candle starts ticking at 9:15, the completion of the formation of the candle is at 9:30, which is 15 mins past the open.
It means it is looking at 15 mins candle of last how many ever data period you are looking at.
Do we have any co relation tools between sectors or stocks??
any sites for nse and bse
Nope, but you can build one yourself. Check this chpater – http://zerodha.com/varsity/chapter/risk-part-4-correlation-matrix-portfolio-variance/
how to use pivot points indicator in zerodha kite
Will put this up as a supplementary note soon.
how to do BTST/STBT, i m a beginner. please suggest the time frame of trading as i had already learned that intraday is surely not the thing to do right now.
If you are stating now, I\’d suggest you look at doing equity investing – i.e holding positions overnight. Once you are comfortable doing this, then maybe you can try short term swing trading before BTST trades.
VWAP: In the section – How to use the VWAP?
Point# 5 says IF CMP > than VWAP then the trend is on the positive side/higher. Contrary to this point# 8 suggests going long if the CMP VWAP.
RE-TYPING as my message got truncated: ON VWAP:
VWAP: In the section – How to use the VWAP?
Point# 5 says IF CMP > than VWAP then the trend is on the positive side/higher. Contrary to this point# 8 suggests going long if the CMP VWAP.
RE-TYPING #2 as my message got truncated: ON VWAP:
VWAP: In the section – How to use the VWAP?
Point# 5 says IF CMP is higher than VWAP then the trend is on the positive side/higher. Contrary to this point# 8 suggests going long if the CMP less than VWAP.
As per my understanding, one should go long when CMP higher than VWAP.
Point 5 implies that trend is higher, maybe you could expect mean reversion?
Not sure if point 8 is suggesting that.
Sir,
How can we choose best indicator for us?
Why so many indicators? Can\’t we rely on 2 or 3 indicators?
It is confusing too
How one can can use more than 2/3 indicators at a time, wouldn\’t it be difficult and confusing
All the indicators give signal to buy & sell, so whats the main difference between them except there unique method of giving signal??
I am little bit confused
It is very common for the indicators to give opposing views. Its best to keep it simple.
Yes, it would. Keep it simple.
It really depends on your trading temperament. I like to keep my charts clutter free…this helps me focus on price action as opposed to what indicators are suggesting. I just overlay moving averages (1 or 2) on the charts.
Dear Karthik,
Just two more things I forgot to ask was that (1) On the stochastic indicator on Kite, only the time period can be changed , colours of fast and slow can be changed and overbought + oversold values along with colours can be changed.I wanted to ask that what are the default settings of %K and %D on this indicator? Also, what is the default smoothing value?
(2) Correct me on this one :-
a) RSI(14) = RSI of 14 days on a daily chart = RSI of the last 14 Hourly candles on a hourly chart = RSI of the last 14 Five-minute-bars on a 5 minute chart and like wise….
You are right on the RSI part.
Default values for %K and %D and smoothing is 14, 9 and, 3.
I shall be very grateful if you give feedback to the development team to make provision for altering hese values..thanks
Will certainly do this. Thanks.
Dear Karthik,
1.) Which Indicator in your opinion is the best Momentum indicator on a 5 min chart for day trading which I can confirm on a 15 min time frame also ?Kindly also mention any tweaked parameters if they work better than default values on 5 min chart.
2) The technical analysis is based on a premise that a human being with his knowledge, emotions,fear and greed will repeat the actions which his predecessors have been doing in the past and it reflects in the Chart patterns and various Technial analyses that have been employed in the market. Now with more and more Computers and Robots taking upon the trading each day, the human element will be eliminated.Does that mean that the analyses and trading methodologies which are being employed today will become redundant /obsolete in the near future ? If so , how can a mortal human being who doesn\’t have access to Trading Robots/ Algorithms keep abreast with them ?
Thanks.
1) I like it simple, so I\’d always prefer moving averages. Try the 21×9 mins tweak on 5 mins chart
2) I\’d agree. Eventually we all have to find our edge and stick to it. However, the silver-lining is that most of the good algos operate in the micro-milli time frame. So in a sense larger time frame trader without the knowledge of coding still have some space to breath.
Hello, if I enter a trade as per Supertrend buy/sell call its almost sure that if I wait till the line colour to change it\’ll lead to a loss or no profit. So, how am I supposed to set a decent target once trade is initiated?
Also, what could be taken as a better stoploss instead of supertrend line? Because if a closer target is set then the supertrend line stoploss wud b pretty far making RRR bad..
You need to start calibrating your trades to identify which parameters suits which stock. It is hard to use the same set of parameters across all the stocks. So start tweaking the numbers and see which supertrend parameter works for which stock.
Ty fr the info, I checked several 5min intraday charts and EOD charts and found that long call from supertrend indicator are almost giving 80-90% or even more correct signals and hence giving a profit. So, is it worth trading as per the indicator only?
No indicator alone cannot lead you to take a trading decision.
I know we cannot trade solely based on an indicator but what could be the reason of high profit chance if someone would\’ve went according to Supertrend calls?
Also, is 3 as multiplier fine for intraday 5min? Or it should be below or aboce that
You have to calibrate these variables for each stock Aloo.
First of all, I would like to say I learned a lot with your blogs. thanks for sharing valuable information. my question is that Which one is you would suggest using as I am new to this cover order or bracket order? I am starting with an initial capital of 5K rupees. and also can we modify stop loss on both?
If you are starting with 5K, I\’d suggest you execute few simple EQ trades before getting into BO and CO.
What do you mean by EQ trades?Actually am also planning to start with 5k
Remember, there is is the EQ segment and the derivative segment. Any trade in the spot market or equity market is referred to as EQ trade. When you trade in EQ you can either do an intraday trade or you can take delivery of the stock and hold it overnight.
For smaller/intraday trend identification, ADX is working fine in 5 & 15 mins timeframe.But Adx is not working/not increasing in higher time frames like 30mins, 1 hour and 1 day. Pls suggest ur view. I used to follow only SMA 21x50x100x200 for trend identification and it\’s working fine in higher time frames.in addition to this kindly suggest for better evaluation.
As long as it works, it works 🙂
Remember, a certain indicator with a certain parameter may work for a certain stock. The same may not apply for another stock. The trick is to calibrate and fine tune (to figure out what works and what does not work) it across your watch list.
Hello Sir,
I am checking pi software but I see chart and Chart tool option in menu is disabled for me.
How to enable that ?
Please help. Thanks
Suggest you get in touch Zerodha support for this.
Sir, can I create a custom indicator in kite, Like I have to create a indicator which shows the value of (Total Buy Qty/Total Sell Qty) cumulatively, like we have ATR, VWAP etc.,
Please Guide
thanx
No, this feature is not available on Kite yet. However, you can do this on Pi, check this – https://zerodha.com/expert-advisors/
How should i combine different indicators with candlesticks and chart patterns? is there is particular thing that needs to be kept in mind before combining indicators/candles/chart patters in order to optimize the desired outcome?
Give chart patterns higher priority, the trade idea should originate from candlestick patterns. Look at indicators just as a reconfirmation to the trade setup. I personally do not prefer relying too much on indicators.
Respected Sir,
.
Thanks for honest answers of my queries !!
Not quitting job so soon (obviously) not at least until I start achieving consistent desired returns.
.
Varsity content is really very helpful & elaborate. This is something that is not available easily at one place. Sometimes, I can’t believe varsity is offering it for free 🙂
.
Thanks a lot for such a good quality educational content !!!
Most welcome, James.
Good luck and hope you stay profitable.
One more thing …
_
In addition to question 5, please tell, as per your experience, how much return is possible (common in real world) in Situation 2?
_
Right now, I am preparing myself to achieve 40-50% returns every month in Situation 2. Is it ok? Isn’t my expectation more unreal (I guess not, your experience/advice =?)?
_
Thanxx for all 3 answers in advance !!!
Q5 – Module on TA and Futures should be good for scalping.
Cannot comment on returns, James. But sorry to sound discouraging, please do not be under the illusion that you will be able to generate a return like 50% every month…and please do not quite your job to do this full time. I myself don\’t know anyone who is able to smash such numbers month after month.
Good luck.
Respected Sir,
Thanks for your kind attention !!!
_
My presumption was same. I’ll wait for the risk management module of varsity & will practice on that to perfect myself.
_
I would be glad to know the answer to question 5 as well. Also, Is Varsity content (along with practice) enough to achieve that consistency?
_
Thanxxx again !!!
Sure James.
As far I know, the contents here should give you a good start…but please do read up and start exploring newer dimensions of trading and investing.
Respected Sir,
A person X is full time scalp trader.
Situation 1 –
A person X bets its 20,000 on, say, JSWSTEEL at 10:10AM @185.50. At 10:25AM, X books profit @186.10, making about 62/- (~0.3%). Similarly, it trades again to make profit of, say, 70/- (~0.3%) at 10:50AM-11:05AM. Trading 3-6 times a day, X makes about 1% return.
At the end of the month, X makes about 10-12% returns with scalping as X trades only 12-15 days a month.
Situation 2 –
A person X utilizes margins given by brokers for intraday trades up to 10 times. In this way, X is able to make about 10% returns a day (not 1%) as its 20,000/- can now buy stocks worth 2,00,000/-. At the end of the month, X is able to make about 90-100% returns (as compared to its 20,000/- amount) as X trades only 10-12 days a month with more care.
Question 1 – Are above situations possible in real world? Please elaborate why, why not, which situation, to how much level & so on? (As per me, these situations must be common)
Question 2 – If yes, what person X need to do to be such a successful trader as it is in above situations? Or, is it too difficult for a full time trader to be like X.
Question 3 – How above situation/s, or person X, can be modified/improved to make it a common practice?
Question 3 – What is your advice to me if I really aspire to be like person X?
(I have started intraday trading 2 years back & have nice experience of being severely lashed down. I terminated my trading a/c. Later I learned how to really trade in market & its relevant basics. I have been following markets for about 1.5 years. I found Zerodha Varsity 6 months ago. It took me last 3 months to go through Module 1 & 2 thoroughly along with its relevant application & practice in real world. I am about to move on to module 3 & think to go through all module in same way before I can confidently start full time scalp trading like X.)
Question 5 – After how many modules, can I be perfectly ready for real world scalp trading with real money & should have full confidence of being equipped with almost all required knowledge for scalping? (I think after half of module 4. Obviously, I will keep on finishing the rest side by side.)
I want to start with 1 trade a day that too by considering it like a swing way.
Lots of thanks in advance!!
James, both the situations are possible…but let me tell you it\’s not easy, especially situation 2!
The trick is to achieve consistency in your trades. Even the top hedge funds in the world fail to achieve this consistency. They say in trading, 20% is strategy and 80% is risk management. So there is lot more going on than just margins and strategy. Keep at it and I hope you find success. God luck.
As I see, the Pitchfork tool is not available on Pi . Any plans to introduce it it ? Also, can I draw pitchforks on different time frame charts of say, 50 scrips and SAVE all of them in Kite ?Will they load the same when I re-login ? Thanks..
Not sure, will check with my team and get back on this. Thanks.
sir, in Pi platform, price does not change in order window according to the market price as in kite. pls rectify it .
Will pass the feedback, thanks.
Karthik Sir, awesome work on all these modules. I am a new user of Pi and have 2 basic questions.
1) can we import the scrips added in marketwatch from kite to pi?
2) is there a way to apply the study done on one scrip to all my scrips in marketwatch.
Many thanks in advance.
1) No, they both are two different eco systems.
2) Save as template should work. although I need to double confirm this. Meanwhile, please feel free to touch base with our support to clarify this.
Yeah so first of all,let me tell ya that this whole thing you guys created is totally most admirable.I\’m sure this step of yours will help people losing their most of money! Now-I do have a question to ask you out,
You see there are two major or main stock exchanges in INDIA as BSE & NSE,and the whole wonderful world trades in that.Means-people from different places and with different point of views does exchange their money and therefore the price gets updated every second,then how come NSE & BSE gives same outcome of price of every single stock everyday?!
Sorry,thats \’stop losing\’ ! 🙂
Figured as much 🙂
That because the asset is the same. Think about it – the price of Onions in shop 1 will be same as in shop 2 right? Likewise, price of Infy will be similar in NSE and BSE.
Yeah,that makes sense! Thanks for all. ???
Hi friends. What level to cross in ADX to consider trending market and level to drop below to find non trending market? Because different people will tell different levels like 22, 25, 30, 40. Getting confused. Thanks.
Just an opinion – each person has his or her own preference, its best you set up trades and optimize them to what suits you.
When adding ON BALANCE VOLUME indicator on KITE ,It is not showing values of OBV indicator.
Got it
Great, thanks.
Dear karthik,
I am reposting my query as u missed it.
Thanks for detailed explanation of the super trend and other indicators. I am new to Zerodha as opened account recently.
Today on 09-01-2017 I noticed that Supertrend chart is showing different in Kite & Pi application.
For example Nse equity stock- Auropharma the Supertrend Sell (Red) occurred at 11:45 hrs in Pi where as it is showing at 14:30 in Kite.
While the settings for both are same at 14-3. Why kite is not showing same as Pi? This has misguided me as I am using Kite very easily compared to Pi which takes lot of time for refreshing. Please is it possible to make the settings in both application same or the user should have option to use whichever he likes.
Thanks.
I\’m sorry if I\’ve missed your query earlier.
The only explanation for this is could be this – https://tradingqna.com/26497/does-charts-same-timeframe-look-different-the-same-platform
Thanks Karthik for valuable Info… i am a user of PI, and am trying to write a script across MACD,ADX and SUPERTrend indicators but am not able to find \’keyword code\’ for SuperTrend Indicator ( checked even in Tradescript manual).. Pls help
Request you to write to – [email protected]
Dear Karthik, I am awaiting for ur reply on Supertrend indicator query which I posted on 10 jan 2017.
Sorry, I must have missed this…and I\’m unable to find the link. Can you please repost the same?
karthik sir, i want to ask that according to you the combination of a lagging and leading indicator such as MACD and stochastic will help in taking decision or not? because i read in an article that it is very accurate in trending markets.
Nothing is accurate Tarun. These tools are there just to help you support your decisions making process, over dependence on these can actually get counter productive.
which indicator should be used with STOCHASTIC OSCILLATOR to eliminate whipsaws ?
You could try moving averages.
Dear karthik,
Thanks for detailed explanation of the super trend and other indicators. I am new to Zerodha as opened account recently.
Today I noticed that Supertrend chart is showing different in Kite & Pi application.
For example Nse equity stock- Auropharma the Supertrend Sell (Red) occurred at 11:45 hrs in Pi where as it is showing at 14:30 in Kite.
While the settings for both are same at 14-3. Why kite is not showing same as Pi? This has misguided me as I am using Kite very easily compared to Pi which takes lot of time for refreshing. Please is it possible to make the settings in both application same or the user should have option to use whichever he likes. I would have uploaded the screen shot but I donot know how to do it here.
Thanks.
I need to check this. Will get back to you shortly.
karthik sir, is it better to perform technical analysis on the candlestick chart of index or the futures candlestick chart of index. like banknifty index chart or 29dec2016 BANKNIFTY FUTURES CHART
It makes sense to apply TA on the spot market chart.
sir how can i get supertrend alert in kite
No alert feature in Kite, yet.
It would be great if standard deviations bands could be added to the VWAP.
You can try experimenting with Bollinger band overlays.
how good is renko chart with the combination of super trend indicator for trading?
Sorry, as I mentioned earlier, I\’m not too familiar with Renko.
what is the significance of time frame in the renko chart, lets say i plot a 5 point brick, for every 5 point movement it will form a brick irrespective of the time frame, so where\’s the catch?
Unfortunately I\’m not too familiar with Renko…so cant really comment on this.
HI IN KITE HOW TO ORDER PADDING ORDER AND STOP LOSS ORDER IN KITE CHART
Request you to refer to this – https://kite.trade/docs/kite/
I am a existing client of zerodha and my request is teach us ICHIMOKU indicator.
Please send reply to my mail also.
Sure, we will try and do that sometime soon. Thanks.
Thanks for adding VWAP in the chart. Its such a powerful indicator for intraday trader. it is my humble request to please add preset order in kite in which script is pre selected including order type, Stoploss etc and only one click order get places.
Thanks for the suggestion, will bounce this off with the tech team.
Sir,
What is Volume Weighted Average Price , and what is the use of it ,Kinldy explain Sir ?
When you multiply the volume along with the price and divide it by total volume, you get the volume weighted average price. Check this for a detailed explanation – http://tradingqna.com/2512/how-to-determine-closing-price-in-f%26o?show=2513#a2513
dear sir,in kite ,in the list of charts,ther is one by name VOLUME CANDLE.can you please explain how its different from regular candles.how can we use them for trading decisions..thank you
Volume candle combines the volume + price action in a single candle. Fatter the candle, the higher the volume for the day and vice versa.
Sir,
Your work is so great as you / zerodha team also cannot think what a best work you have done by providing good knowledge in simple way on technical analysis. It is very difficult to say greatness of your work in few words. It is useful for enlighten thousands who was in dark. भद्र पुरुष ही महान कार्य करते हैं । Thanks a lot.
Sorry for taking your valuable time to ask – one should take average of 10 days volume for a share from BSE and NSE both or from a single exchange is sufficient.
Thanks for the kind words Tejvir 🙂
One exchange should be good. I personally prefer NSE.
Hi Team,
Kindly let me know how add new study in zerodha
Thanks,
VP
I guess you are talking about charts in Kite, check this – https://kite.trade/docs/kite/#charting
Sir,
ATR is useful for choosing correct Stop loss and understanding the Volatility , How can i take correct SL by using ATR , Can you explain and give one example , Thanks
Check this chapter – http://zerodha.com/varsity/chapter/volatility-applications/
Market Guru,
My request is teach us ICHIMOKU indicator on varsity
Will do this sometime soon 🙂
Karthik sir, thanks for your valuable advice on our various queries. Sir, though I will be the new to chart based investments.Sir, can I follow supertrend indicators for medium to long term investments in large as well as mid cap shares?
Yes, you can. Give it a try and but your experience.
i read about adx ,but i dont find it pi..is it not there in pi???when can we expect it if it is not there?
It should be there, I\’d suggest you email my colleague – [email protected] for this.
Hi karthik. Please I have a requirement on Pivot points from your technical team. I want to refer the values of 3 days pivot points with a time frame of 1 Hour. But if I take 1 hour time frame on Kite I can see a unique pivot values for the past 4 days. Till 15 Min chart we can see the different values but not 30 minutes and 1 Hour. Please inform this to your technical team.
We use a 3rd party charting platform over which we have very limited control, hence customizing the charts will be a challenge. However, you can use the Expert Advisor feature in Pi and build a work around for yourself, check this – https://zerodha.com/expert-advisors/
Dear Sir,
I would like to know that ADX based trading what would be the SL can i give , Both buy & Sell ?
ADX indicates the strength of a trend, not a great tool to identify points to place your stops!
Can every chart that we open give the ticking time of the market on top.
selection of the scrip of 2nd/3rd list does open in case we want to view chart of other scrip for quick view in popped out charts, we have to go to original charts .
can you incorporate these suggestions.
thanks
Are you are talking about the charts in Kite?
yes.
The timing of net and that of mkt is different by 1.5 to minutes. so every chart should idealy having timing in hr,min,sec.
as rgdsd my first point .. v see many charts and with many time frames and this is possible in kites due to popping out features. But on these charts is there:
1) any key to open market depth.
2) any function keys to place orders or buy or sell.
3) any function keys or shortcut key to view our mtm or position.
4) while changing the scrip name in d dropbox that appears, only the list no. 1 appears, and if v mention the scrip from list no. 2 or 3, it is not accepting or does not show in the dropdown window. It should ideally show if i hv the scrip in my match list from 1 to 5 anywhere.
I hope you will into these points.
thanks for responding immdly.
Will pass the message to the developer team. Meanwhile, please do have a loo at this – lots of shortcut keys and more here – https://kite.trade/docs/kite/
sir what is your view on elliott wave does it help or it is confusing
Confuses me for sure 🙂
Can i get the AFL code for SUPERTREND so that i can test it myself. regards
I\’d suggest you email my colleague – [email protected] for this. Thanks.
Hi, Karthik sir,
First of all thank you , for your great insight and inputs.
i wanted to test SUPERTREND indicator with 5 and 21 days moving average crossover any leads how to go ahead with it.
thankyou in advance
Note sure as I;ve never tested Supertrend!
Hello
I have one confusion that how volume is calculated, is it same as number of quantity because for example 1 qty of eicher motor is more than 200 qty of ashok leyland, money infused in market is more in eicher but qty is showing more for ashok, so how this volume is calculated.
Thanks
Alok
I buy 100 share of a company and someone sells those 100 share to me, then volume is 100.
Hi,
I\’m aware of 100 qty buy and sell makes 100 vol. But my question is in comparison of 2 stocks, one which is having low price like ashokley but high qty , while another is having high price like eicher motor but low qty. So while calculating pre market volume what needs to be considered , which is having higher volume.
You could convert both to Rupee value (value traded) to assess which is attracting more money. Value traded = Volume * price.
Can i Buy shares in NSE and same can be sell in BSE in Intraday? I called you are call center executive,he told me we can do it for intraday. When i inquire out side,my friends are saying it is not possible..
Please let me know which one is correct.If it can be done, How? You are executive advised me to add the same script in Market watch for both stock exchanges NSE and BSE..While buying, Buy it from NSE and While selling select it from BSE and sell the same quantity…and the price difference is our profit…Is that true?
Please let me know…
I apologies on the executive\’s behalf. This is not possible on a intraday basis, however if you have shares in your DEMAT account, then you can choose to sell them in either NSE or BSE.
Thank you..Can you tell me how can i take advantage of Future and Spot price of the arbitrage?
Check 10.2 – http://zerodha.com/varsity/chapter/futures-pricing/
Sir,
Future and options both are derivative so i guess spot price derives them, but between future and option who quickly changes followed by other
Thanks
Alok
The one which has higher liquidity reacts quicker!
Hello Sir
How do you rate big brokerage houses giving call on different stock each and every day. Do their call overrule/impacts technical analysis
Thanks
Alok
Not sure Alok 🙂
Can we add an indicator on another indicator e.g. a Moving Average on RSI?
Yes you can overlay indicators!
Sir I m little familiar to the stock market…but new to the technical analysis..I m really happy and surprised that I m understanding this tough subject very easily…I like to play only option trading…can you explain which candlestick or other analysis pattern is suitable for me?
A combination of Candlesticks and options theory should be good! Suggest you read this module as well – http://zerodha.com/varsity/module/option-theory/
Nice and very informative module on technical analysis done with all chapters in 2 days weekend leave. 🙂
one question that OI analysis and PCR for nifty not come under technical analysis?
PCR is options related, hence I\’ve included the topic under Option Strategies.
karthik wen can we expect module 8 ,9 &10 completely??? eagerly waiting for it!!
We are working on 8th module and proceeding sequentially. So I guess it may take sometime.
Super trend working cool!!
Happy to know that!
dear sir,
I am following the supertrend of your kite for buy and sell stock , kindly suggest me which indicator would you suggest in tranding market
You can use supertrend, MACD, EMA, Bollinger Bands etc.
when will your module no 10 (strategies) release
waiting for so long
Thanks for your patience Ganesh. We are working on Module 8 now, we are working in the same sequence. So I guess you need to wait a little longer 🙂
Sir,
Candlestick pattern do we need to check 1 day candle or can we check 5 minutes candle and take a decision on that, for intraday trading.
which is the best time frame candle for doing intraday trading.
Thanks
If you are trading intraday then I\’d suggest you use 5 or 10 mins candle. However I do know intraday traders who trade based on EOD candle. I guess this depends on your trading style.
Hi Karthik, I don\’t see chapter 19 (Final checklist)
Oh oh, thanks for pointing. Will look into this right away.
Hello Karthik,
Last year, I started new after reading Varsity and earned few bucks. I traded NIFTY NFO Intraday. Similar to some other stories, I lost much more than I earned. Mostly because:
1) I wasn\’t able to make a clear analysis of market
2) Didn\’t have any strategy (like hedging)
3) Lack of clarity and a desire to earn led me to getting emotional with market
4) Emotions took a hold and I lost huge sums
And finally had to give up.
I\’m in software industry right now with 8.5 years of experience but really want to get into trading, now sensibly and slowly.
Could you please guide me how can I approach towards analysing the market.
I\’m starting the Varsity again but that\’s just technical analysis, I also want to learn analysing the market based on the news we get from the markets. How can I do that.
Also, with your experience, do you have any honest suggestion for me?
I want to honestly start again. Looking forward for your reply.
Thank you.
-Aditya
Please take my advice – concentrate on your software profession as you have valuable experience of nearly 9 years. Dont get into active trading. Start investing small amounts for long term duration, once you are comfortable with this move towards making overnight short term bets. My guess is it will take you few years to get to this stage.
Thank you Karthik…
Regarding Investing, what do you suggest should be my starting point.
Analyse the business, analyse the financial statements, develop an investment conviction …and the finally go ahead and invest. Invest with a long term perspective and nothing short term.
Sir,
This has been found that in some cases after candlestick hike for any stock followed by hammer , reversal starts, is this related with volume because as per price action inverted hammer should follow uptrend for reversal and vice versa
Thanks
Alok
Not sure Alok, I\’ve not observed this.
Sir,
Could you pls explain how to pre determine whether it is continuation pattern or reversal pattern, as sometimes its just small pullback.
Thanks
Alok
It would be hard to do this, the only way to figure this out is by experience. However, sometimes volumes give some information…for example a pullback if associated with low volumes can indicate a possible reversal.
please do not disclose personal details and trade details to 3rd party in any situation.
is it possible to add sl and target 1 2 3 on supertrend chart when it generate new signal. that will help a lot.
Not sure, as these indicators come as a standard package.
I have also mentioned about personal details and trade details since it was compromised recently. Someone from Hyderabad \”Sri Mahalakshmi Enterprises\” and R.SATHYANARAYANA AND B.RAMANI IYER – these people have obtained my address and trade details from your call center or some sources. They have even mentioned I have traded in forex. How come these confidential gone out? You need to enhance IT security and compliances. Those are fraudsters and I am one of the victim. I recommend Zerodha should send a circular to all customers so that nobody else become victim. They are working for some broker in chennai. They will try to harm other brokers and businesses.
Dileep, we are curious to know more about this, can you please mail me your phone number? my email id is karthik.r at zerodha dot com. Thanks.
i have a doubt over timeframe of 30 minutes chart. You are closing 9:15am tick at 9:30 not 9:45. but when i refer to same chart later, it shows 9:15, 9:45 correctly which is wrong. 9:15 tick must close on 9:45 not 9:30 otherwise whole chart goes wrong. You can nifty chart for example tomorrow to verify my point.
Where are you seeing this Dileep? If you are with Zerodha then both Kite and Pi will reflect closing at 9:45 AM for the the 30 mins chart.
Great explanations.. Looking forward to the day when other indicators will be added – especially MACD and MACD Histo – and how that can be used with MA crossovers for a simple strategy….
Thanks!
I need to rework on MACD, will do it as soon as possible.
Sir,
I have a doubt on Stop loss, Sir how to set a stop loss on particular stock while day trading ,
Can you please explain with an examples,
Sir which indicater can provide SL , Can i take pivot point support as SL .
Thanks
Check this chapter – http://zerodha.com/varsity/chapter/volatility-applications/
Sir,
I have read so many books of famous writers on Stock market, but the way you had explained is marvelous. Thanks for sharing your knowledge. Could you pl. explain the breakout strategy and how to calculate entry and exit levels(targets) .
Thanks
Alok
Thanks for the kind words Alok.
Check these chapters – http://zerodha.com/varsity/chapter/dow-theory-part-1/ and http://zerodha.com/varsity/chapter/dow-theory-part-2/ for breakouts.
Sir,
According to your vast experience how many minutes candle one should look for intraday trading(Both for price action candlesticks and 9 by 21 SMA)
Thanks
Alok
I personally prefer 5 mins candles, overlay it with 9 and 21 mins SMA.
Sir,
Is Pivots points mentioned in kite are same support and resistance.
According to you which pivot is better standard or fibonoci
Thanks
Alok
Pivot method is a way of identifying S&R, its not the same as like plotting it on graph. Both are good, really depends on the market situation.
Thanks Kartik
Dear Kartik, thanks a lot for your precious efforts. I would just want to know which other indicators should I add with Supertrend so as to escape false signals (or at least minimize it) generated in the flat market.
I find two indicators useful to identify trends – simple moving averages and ADX. Also, you can use support and resistance to know if the markets are flat or trending. For example the markets between 3rd to 17th March was kind of sideways b/w 7400 to 7550…and you can identify this with simple S&R on daily charts.
Dear Karthik Sir
When a buy signal is generated by a supertrend indicator should we immediately go long at the market price or should we wait for the close of the candle (eg in a 5 min intraday chart) .Also how to determine the stoploss for a buy/sell signal generated by supertrend indicator.
I\’d personally prefer to wait for the close of the candle. As far as SL is concerned, I\’d suggest you trail it as you would be locking in profits as and when the stock/index moves in your favor.
are you aware of problem with KITE? We can not modify the order. Not quanity. Not type. So I just cancel the order and place new one. But this is definitely a bug.
Kite works like a charm, you can easily place and modify orders. Please have a word with our support team to figure out how.
Sir, Which is the best candle to refer Heikin-Ashi or Normal Candlesticks patterns.
Thanks
I;d prefer normal candlesticks.
Sir, Supertrent indicater gives late buy and sell signal , as compare to MACD and ADX , do we need to change the Period or multiplier or Can we use defalut (7,3) combinations.
Thanks sir
Works extremely well when the markets are trending. If the markets are flat, irrespective of which momentum indicator you use, you will get wrong signals.
Sir , Simple Moving Average can i take time frame of 5 days and 35 days crossover for intraday trading , or something better than this according to you for intraday trade sir . Thanks
I\’ve never tried 5×35, so I cannot comment…I\’ve tried 9×21 and it seems ok.
what is 9×21?
9 minute EMA (or SMA) crossover with 21 minute EMA (or SMA).
Dear Sir, How to set minute EMA or minute SMA in kite as there is only option of days in Period ?
I\’d suggest you check these video tutorials on Kite – https://www.youtube.com/playlist?list=PLkxTRam6E2V-okv6gwQlt6dLTsn0v6CD1
Sir, which is the most reliable and accurate indicater according to you, Thanks
Each one is different and varies across time frame. However I do have a greater conviction in simple moving averages.
Hi Karthik,
I use EMA crossovers for positional trading and most of the time I see that my profits are eroded by half upon exit. Though its a winning trade, but I see there is some scope for improvisation.
Any way of getting either a stop loss or a trailing stop loss while trading with EMA Crossovers?
Thanks
Shrenik
Yup, you can always enter the trade based on EMA crossover and once the trade starts moving in your direction, start trailing it…your exit will be far better this way.
Hi Karthik,
Your assurance adds confidence. 🙂
Any particular way/method to trail the stop loss ?
Thanks
Shrenik
No particular way as such. The best way is to increase the trail by 0.5% for every 1% move in your direction.
Hi kartik
I very much like kite beta. Its very better than previous mobile app
Cheers!
i need some indicator to use for making short-term equity CNC trades ( i will hold at the max 10 days only , not more ) ….. which one is best ?
🙂 How can I answer this?
Hello.. Is the supertend indicator enabled in the pi software.. How to enable the same..
Nope, I dont think so.
Why pi is not containing ADX ?
Will check.
Hi kartik
What will be expire date of these contract. Is its trading same as nifty
Suggest you check this – http://www.nseindia.com/products/content/gi/product_DJIA_cspecs.htm
When kite app would launch???
The beta version is out there, you can give it a try. Suggest you speak to our support executives.
Thanks sir
Sir, Which is the best period and Multiplier number for Checking Current Super trend for intraday trading, and for positional trading which is the best period and Multiplier number.
Thank you
I\’d suggest you stick to the default number.
Hi kartik,
I am little confused. Please clear my doubt.
In kite, if I place a buy order with no trigger price then it buys at market price but if we give trigger price then buy when price reaches that price. Also if I want to buy at higher price than CMP but only when CMP reaches that price what should I do???
Is This concept applicable in case of placing stop loss. Can I need to place separate order for stoploss
I would suggest you speak to our support executives wrt to order placement queries.
gr8 article. Can you please explain types of charts & its utilization too? i.e. heiken Ashi, point & figure, range bars, Renko etc.
Sometime soon Shreya 🙂
How does Zerodha calculate the size of Renko bar? It is different for each ticker and is the calculations are not consistent with any formula (ATR, 1/20 or 1/25). Can someone provide some insights?
Hi kartik
Thanks for this supplement notes on indicators. It is very useful and knowledge gaining too. Will you give such description on other indicators and chart pattern on kite, it would be very helpful. Also. Kite app can also contain all features of web based platform??
We will be adding all the popular indicators in the supplementary notes. Kite App will contain all the features.
Sir, What is SMI & Donchain Channel ?. Is it available in pi an in kite ?. Can you elaborate both ?.
DL 0071
yup, very soon we will be adding notes on all popular indicators available in Kite.
I think Super Trend is the best indicator or what I would say as super Profit machine. We should see first identify the 30 min Super Trend Signal – whether buy or sell and then see 5 min Super Trend signal line to enter the trade as per the 30 min Signal. Eg. if 30 min signal is in sell mode (red line above), then in 5 min mode take every sell signal that comes with stoploss of 5 min signal line. I have minted tons with this strategy hence sharing. Karthik Sir can elaborate further if there are any chinks in this strategy. Alternatively you may combine any longer term time frame to judge primary trend and take decision as per shorter time frame supertrend eg. 1 hr – 10 mins 🙂 Thank you
Hi vipul
Your strategy is good and works well in trending and low volatile market but in range bound market with high volatility it sometime fails. So I feel if we combine it with some other indicators like donchain channel, SMI, the result would be far more better.
why SMI and donchain channel are not included in indicators section.
Guess this is already available. Did you check under \’studies\’?
Sir, can you plz elaborate the above strategy and also plz advise me which indicator from the one listed above should be my priority if i am looking for buying stock in futures.
If you are buying stocks, especially for a long-term perspective, I\’d suggest you check the moving averages.
Vipul, if the strategy is working fine with you, then best not to tamper with it 🙂
Hi sir…Sir i have one doubt that…The super trend is Available in PI or Not?…if not..when wil it wil be added..?
Its available in Kite for now. Not sure by when we can have it on Pi.
Yes its available
Vipul, do you mean keep on averaging >>if 30 min signal is in sell mode (red line above), then in 5 min mode take every sell signal that comes with stoploss of 5 min signal line>>
First of all thanks to Karthik sir for his guidance & khyatiji for appraisal. What i meant by this strategy was take every long term signal i.e buy or sell signal on 30 min chart. In case of 5 min duration enter and exit as per 5 min chart signal. Please dont average especially in case of options it may not work due to decay in premiums. I normally believe in booking timely profits hence not encouraging average stuff.. all the best. 🙂
Just to add – averaging on your losing trade is not advisable at all. On the other hand, one should look at averaging on winners.
What happens when Sell signal appears in 5 mins chart after you have entered into trade looking at buy signal in both 30 mins and then 5 mins. Are you going to square off buy trade or keep it open until new signal appears in 30 mins chart?
You should go with the primary time frame – if the decision was based on 30 mins, then its best to stick to the 30 mins time frame.
I have tried it but failed badly. lost 27490 in a single trade. It does not give signal in correct direction. nothing is guaranteed.
Absolutely, nothing is a guarantee. The only thing that comes close is constant learning and improvisation.
Felt sorry for the losses that you incurred. See basically my ideology is take all the primary time frame & trend signal & in case you have missed it then switch to lower timeframe and take the signals equivalent to primary time frame. Hope not confusing ! Also you should have defined risk taking & risk management discipline planned in advance only before trade entry.
As Karthik Sir mentioned that in the market you might be equipped by numerous tools, but dont take anything for granted & guaranteed. Proper Trade Discipline & Stoploss would always save the skin. Nevertheless you can always cover up your losses. Don\’t be disheartened. 🙂
What I have observed over a period of time, what signal Supertrend gives after 10-15 minutes, the same signal appears in Parabolic SAR 10-15 minutes before. SO you will certainly get much better price than Supertrend. So far, PSAR has been the best indicator ever I have come across.
As far as accuracy is concerned, Both Supertrend and PSAR will give same accuracy. But you can catch more points in PSAR.
Vipul, when you say \”timely profit\” and since you trade intraday, can you pls. explain your strategy, with the help of charts ( flashback feature from Q)? how & when you book ur profit or how & when you book ur losses?
Sir what is PSAR which is like super trend indicator.
Please reply
Parabolic SAR or PSAR is a series of dots placed above and below the price of the stock, indicating buy and sell trades. This is a momentum indicator. It is much less complicated compared to a supertrend.
Try to use Heikin Ashi chart and then use your strategy. Test this on some previous data, and tell if it gives better signals.
Vipul – while using 5 mins time frame, do you close out each day before 3:30 PM ? Because I think overnight position could be very dangerous for short time frames.
Mr. Vipul, could you please elaborate the logic of identifying the signal on 30 min time frame and then placing a stop loss on the 5 min candle
I did not understand how to use supertrend signal .
how long to wait for going long on the stock if signal shows green crossover .
what should be target and stoploss when using supertrend signal .
Anand, have discussed supertrend in detail in the note including all the questions you\’ve asked. Suggest you give it another read, thanks.
What is the target
The price at which you intend to book profits and get out of a trading position.
Thank you Vipul for this strategy.
In the supertrend example, if we would have waited for crossovers to exit, we would have suffered losses(or at least would have lost most of our profits) so is there a better exiting strategy?
Maybe in this case, but generally speaking the indicator allows you to capture a chunk of the trend. Larger the trend, higher the number of points you can capture.
Changing the components colour is possible?In above screenshots green,red widely used how can i on kite?
You can explore the themes in Kite and select colours based on your preference.
Supertrend in Zerodha works on close basis. Is there a possiblity of introducing Supertrend on HIgh/ Low basis ? Since stops etc ultimately get triggered on levels determined by actual high/ lows and not close
thanks
Not sure if this can be done, Devashish. The indicators come from 3rd party sources and I believe they are hard coded. Let me check this though.
hey adam
a would suggest you just take a target of 0.5 rs thats it and trade multiple times rather than trying to generate a big profit from a single trade