

7.1 – Paper Umbrella
The paper umbrella is a single candlestick pattern which helps traders in setting up directional trades. The interpretation of the paper umbrella changes based on where it appears on the chart.
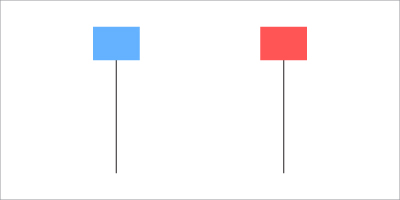
A paper umbrella consists of two trend reversal patterns, namely the hanging man and the hammer. The hanging man pattern is bearish, and the hammer pattern is relatively bullish. A paper umbrella is characterized by a long lower shadow with a small upper body.
If the paper umbrella appears at the bottom end of a downward rally, it is called the ‘Hammer’.
If the paper umbrella appears at the top end of an uptrend rally, it is called the ‘Hanging Man’.
To qualify a candle as a paper umbrella, the lower shadow’s length should be at least twice the length of the real body. This is called the ‘shadow to real body ratio’.
Let us look at this example: Open = 100, High = 103, Low = 94, Close = 102 (bullish candle).
Here, the real body’s length is Close – Open, i.e. 102-100 = 2 and the length of the lower shadow is Open – Low, i.e. 100 – 94 = 6. As the length of the lower shadow is more than twice the real body; hence we can conclude that a paper umbrella has formed.
7.2 – The Hammer formation
The bullish hammer is a significant candlestick pattern that occurs at the bottom of the trend. A hammer consists of a small real body at the upper end of the trading range with a long lower shadow. The longer, the lower shadow, the more bullish the pattern.
The chart below shows the presence of two hammers formed at the bottom of a downtrend.
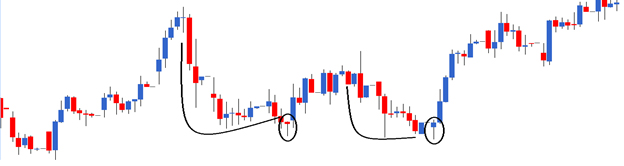
Notice the blue hammer has a very tiny upper shadow, which is acceptable considering the “Be flexible – quantify and verify” rule.
A hammer can be of any colour as it does not really matter as long as it qualifies ‘the shadow to real body’ ratio. However, it is slightly more comforting to see a blue-coloured real body.
The prior trend for the hammer should be a downtrend. The prior trend is highlighted with the curved line. The thought process behind a hammer is as follows:
- The market is in a downtrend, where the bears are in absolute control of the markets.
- During a downtrend, every day the market would open lower compared to the previous day’s close and again closes lower to form a new low
- On the day the hammer pattern forms, the market as expected trades lower, and makes a new low
- However, at the low point, some amount of buying interest emerges, which pushes the prices higher to the extent that the stock closes near the high point of the day.
- The price action on the hammer formation day indicates that the bulls attempted to break the prices from falling further, and were reasonably successful.
- This action by the bulls has the potential to change the sentiment in the stock. Hence one should look at buying opportunities.
The trade setup for the hammer is as follows:
- A hammer formation suggests a long trade.
- The trader’s entry time depends on the risk appetite of the trader. If the trader is a risk-taker, he can buy the stock the same day. Remember, the real body’s colour in hammer does not matter; hence there is no violation of Rule 1. If the trader is risk-averse, he can buy the stock the day after the pattern has formed only after ensuring that the day is a blue candle day
- Risk takers can qualify the day as a hammer by checking the following condition at 3:20 PM on the hammer day…
- Open and close should be almost the same (within 1-2% range)
- Lower shadow length should be at least twice the length of the real body.
- If both these conditions are met, then the pattern is a hammer, and the risk-taker can go long.
- The risk-averse trader should evaluate the OHLC data on the 2nd If it’s a blue candle, the trade is valid so that he can go long.
- Risk takers can qualify the day as a hammer by checking the following condition at 3:20 PM on the hammer day…
- The low of the hammer acts as the stoploss for the trade.
The chart below shows a hammer’s formation where both the risk taker and the risk-averse would have set up a profitable trade. This is a 15 minutes intraday chart of Cipla Ltd.
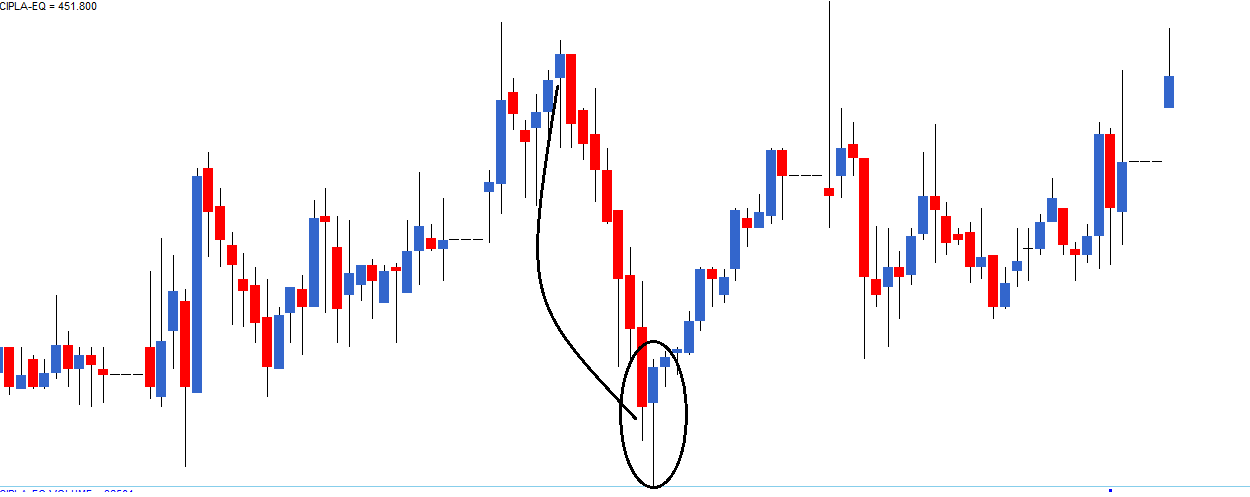
The trade set up would be as follows:
Buy Price for a risk-taker – He takes the trade on the Hammer candle itself at – Rs.444/-
Buy price for a risk-averse – He takes the trade on the next candle after evaluating that the candle is blue at – Rs. 445.4/-
Stoploss for both the traders is at Rs.441.5/-,, which is the low of the hammer formation.
Do notice how the trade has evolved, yielding a desirable intraday profit.
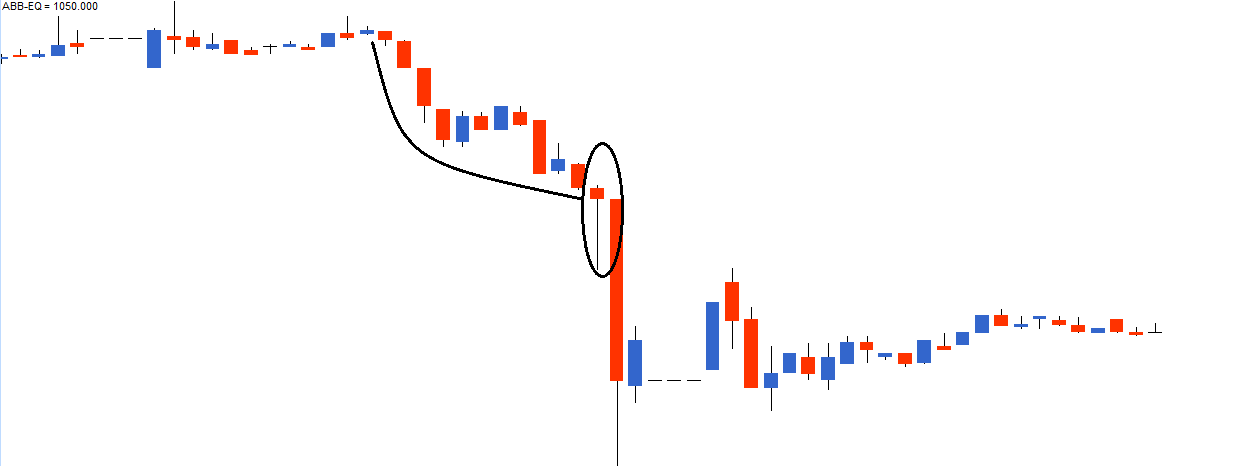
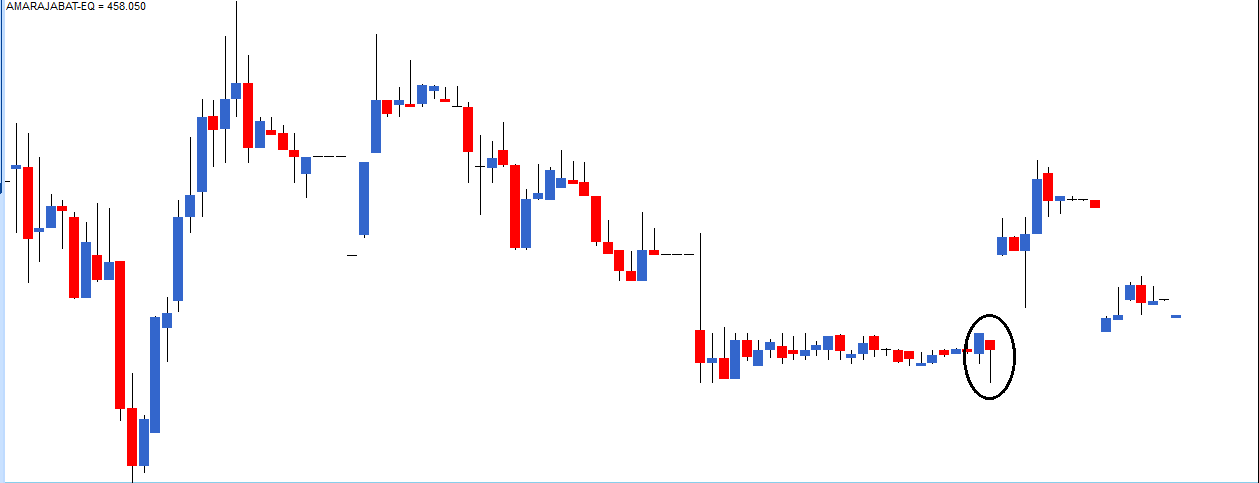
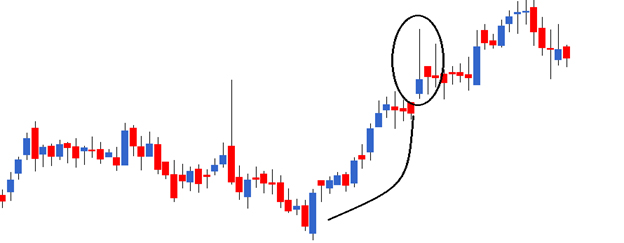
Here is another chart where the risk-averse trader would have benefited under the ‘Buy strength and Sell weakness’ rule.
Here is another interesting chart with two hammer formation.
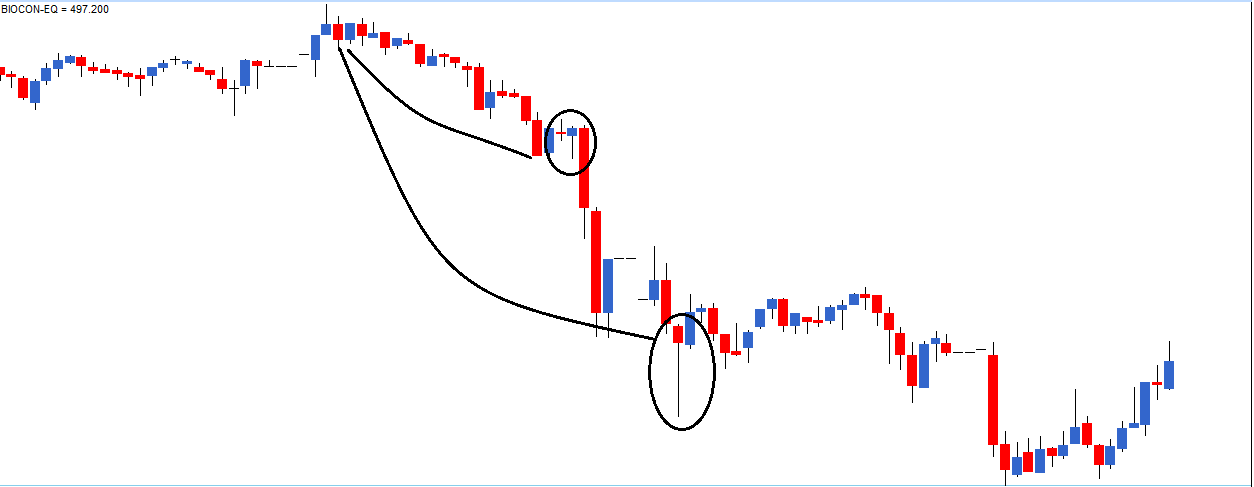
Both the hammers qualified on the preconditions of a hammer, i.e.:
- The prior trend to be a downtrend
- Shadow to real body ratio
The risk-averse trader would have saved himself from a loss-making trade on the first hammer, thanks to Rule 1 of candlesticks. However, the second hammer would have enticed both the risk-averse and risk-taker to enter a trade. After initiating the trade, the stock did not move up; it stayed nearly flat and cracked down eventually.
Please note once you initiate the trade you stay in it until either the stop loss or the target is reached. It would help if you did not tweak the trade until one of these events occurs. The loss in this particular trade (first hammer) is inevitable. But remember this is a calculated risk and not a mere speculative risk.
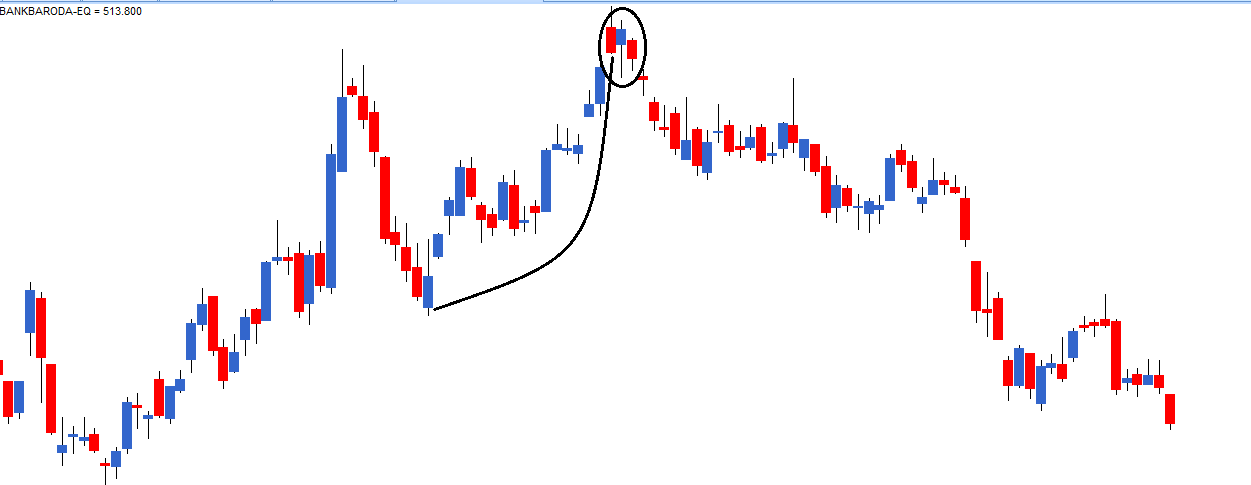
Here is another chart where a perfect hammer appears; however, it does not satisfy the prior trend condition, and hence it is not a defined pattern.
7.3 – The Hanging man
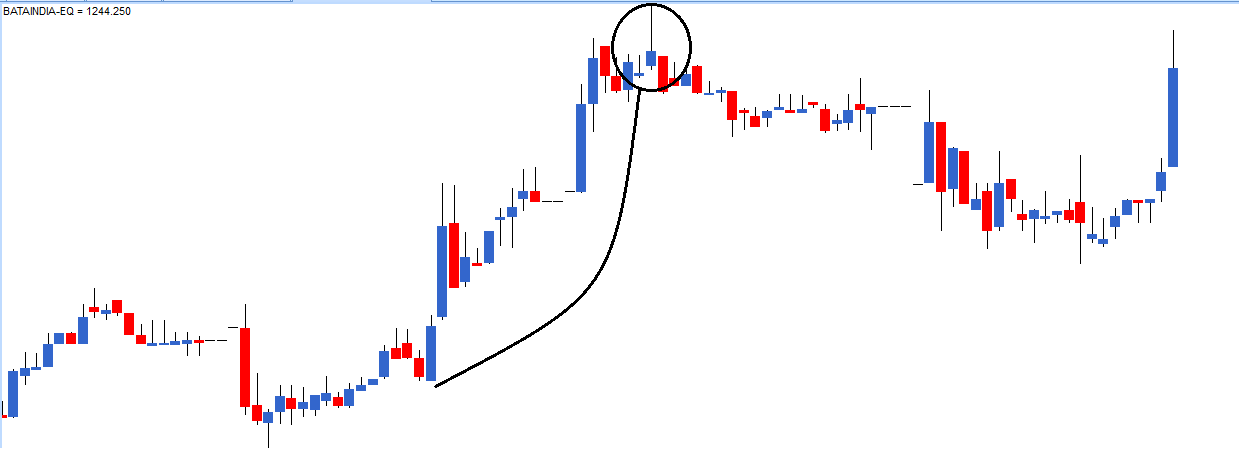
If a paper umbrella appears at the top end of a trend, it is called a Hanging Man. The bearish hanging man is a single candlestick and a top reversal pattern. A hanging man signals a market high. The hanging man is classified as a hanging man only if an uptrend precedes it. Since the hanging man is seen after a high, the bearish hanging man pattern signals to sell pressure.
A hanging man can be of any colour, and it does not really matter as long as it qualifies ‘the shadow to real body’ ratio. The hanging man’s prior trend should be an uptrend, as highlighted by the curved line in the chart above. The thought process behind a hanging man is as follows:
- The market is in an uptrend. Hence the bulls are in absolute control.
- New highs and higher lows characterize the market.
- The day the hanging man pattern appears, the bears have managed to make an entry.
- This is emphasized by a long lower shadow of the hanging man.
- The entry of bears signifies that they are trying to break the stronghold of the bulls.
Thus, the hanging man makes a case for shorting the stock. The trade set up would be as follows:
- For the risk-taker, a short trade can be initiated the same day around the closing price.
- For the risk-averse, a short trade can be initiated at the close of the next day after ensuring that a red candle would appear.
- The method to validate the candle for the risk-averse, and risk-taker is the same as explained in a hammer pattern.
Once the short has been initiated, the candle’s high works as a stoploss for the trade.
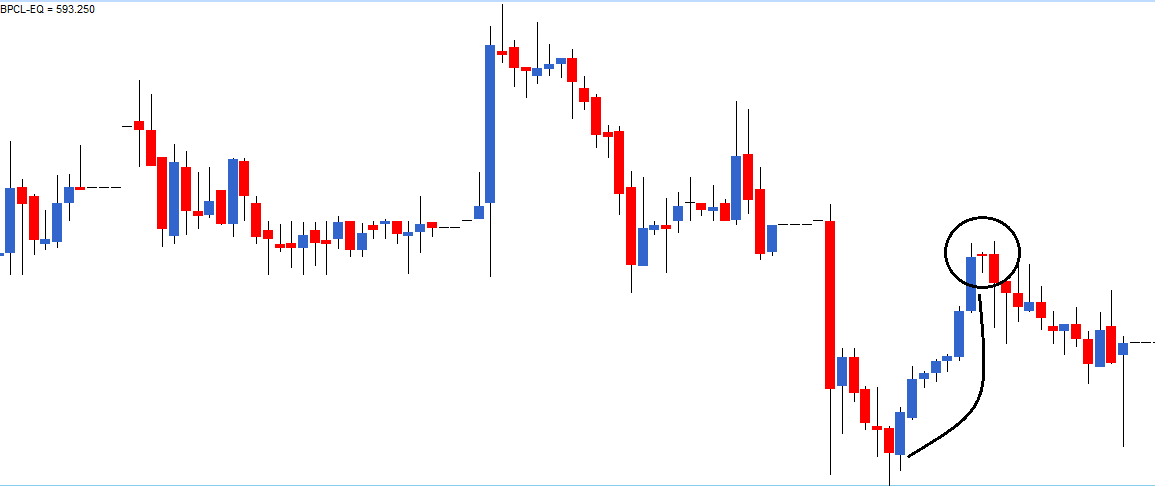
In the chart above, BPCL Limited has formed a hanging man at 593. The OHLC details are –
Open = 592, High = 593.75, Low = 587, Close = 593. Based on this, the trade set up would be as follows:
- The risk-taker initiates the short trade on the day the pattern appears (at 593)
- The risk-averse initiates the short trade on the next day at closing prices after ensuring it is a red candle day
- Both the risk-taker and the risk-averse would have initiated their respective trades
- The stoploss price for this trade would be the high price, i.e. above 593.75
The trade would have been profitable for both the risk types.
7.4 –My experience with a paper umbrella
While both the hammer and the hanging man are valid candlestick patterns, my dependence on a hammer is a little more as opposed to a hanging man. All else equal, if there were two trading opportunities in the market, one based on the hammer and the other based on hanging man I would prefer to place my money on the hammer. The reason to do so is based on my experience in trading with both the patterns.
My only concern with a hanging man is that if the bears were indeed influential during the day, why did the price go up after making a low? This, in my opinion, re-establishes the bull’s supremacy in the market.
I would encourage you to develop your own thesis based on observations that you make in the markets. This will help you calibrate your trade more accurately and help you develop structured market thinking.
 7.5 – The shooting star
The shooting star is the last single candlestick pattern that we will learn about before moving to multiple candlestick patterns. The shooting star’s price action is quite powerful, thus making the shooting star a trendy candlestick pattern to trade.
The shooting star looks just like an inverted paper umbrella.
Unlike a paper umbrella, the shooting star does not have a long lower shadow. Instead, it has a long upper shadow where the shadow’s length is at least twice the length of the real body. The body’s colour does not matter, but the pattern is slightly more reliable if the real body is red. The longer the upper wick, the more bearish is the pattern. The small real body is a common feature between the shooting star and the paper umbrella. Going by the textbook definition, the shooting star should not have a lower shadow. However, a small lower shadow, as seen in the chart above, is considered alright. The shooting star is a bearish pattern; hence the prior trend should be bullish.
The thought process behind the shooting star is as follows:
- The stock is in an uptrend implying that the bulls are in absolute control. When bulls are in control, the stock or the market tends to make a new high and higher low.
- On the day the shooting star pattern forms, the market as expected trades higher, and in the process makes a new high
- However, at the high point of the day, there is a selling pressure where the stock price recedes to close near the low point of the day, thus forming a shooting star.
- The selling indicates that the bears have made an entry, and they were actually quite successful in pushing the prices down. This is evident by the long upper shadow.
- The expectation is that the bears will continue selling over the next few trading sessions. Hence the traders should look for shorting opportunities.
Take a look at this chart where a shooting star has been formed right at the top of an uptrend.
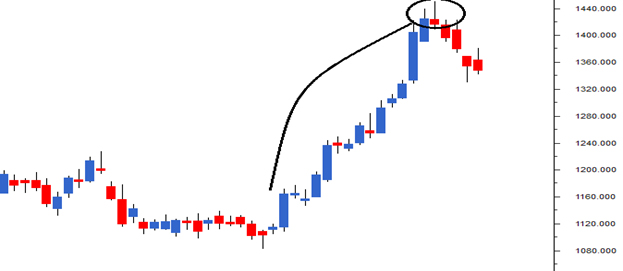
The OHLC data on the shooting star is; open = 1426, high = 1453, low = 1410, close = 1417. The short trade set up on this would be:
- The risk-taker will initiate the trade-in 1417, basically on the same day the shooting star forms.
- The risk-taker initiates the trade the same day after ensuring that the day has formed a shooting star. To confirm this, the trader has to validate:
- If the current market price is more or less equal to the low price
- The length of the upper shadow is at least twice the length of the real body.
- The risk-averse will initiate the trade on the next day, only after ensuring that the 2nd day a red candle has formed.
- The risk-taker initiates the trade the same day after ensuring that the day has formed a shooting star. To confirm this, the trader has to validate:
- Once the trade has been initiated, the stoploss is to be placed at the pattern’s high. In the case, the stop loss is at 1453
As we have discussed this before, once a trade has been set up, we should wait for either the stoploss or the target to be triggered. It is advisable not to do anything else, except for maybe trailing your stoploss. Of course, we still haven’t discussed trailing stoploss yet. We will discuss it at a later stage.
Here is a chart where both the risk taker and the risk-averse would have made a remarkable profit on a trade based on a shooting star.
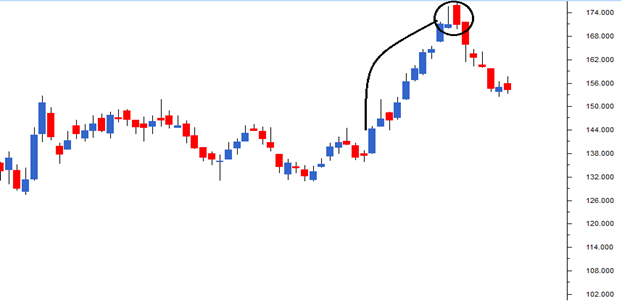
Here is an example, where both the risk-averse and the risk-taker would have initiated the trade based on a shooting star. However, the stoploss has been breached. Do remember, when the stop-loss triggers, the trader will have to exit the trade, as the trade no longer stands valid. More often than not, exiting the trade is the best thing to do when the stoploss triggers.
Key takeaways from this chapter
- A paper umbrella has a long lower shadow and a small real body. The lower shadow and the real body should maintain the ‘shadow to real body’ ratio. In the case of the paper umbrella, the lower shadow should be at least twice the real body’s length.
- Since the open and close prices are close to each other, the paper umbrella’s colour should not matter.
- If a paper umbrella appears at the bottom of a downtrend, it is called the ‘hammer.’
- If the paper umbrella appears at the top end of an uptrend, it is called the hanging man.
- The hammer is a bullish pattern, and one should look at buying opportunities when it appears.
- The low of the hammer acts as the stop-loss price trade.
- The hanging man is a bearish pattern which appears at the top end of the trend, and one should look at selling opportunities when it appears.
- The high of the hanging man acts as the stop loss price for the trade.
- The shooting star is a bearish pattern which appears at the top end of the trend. One should look at shorting opportunities when a shooting star appears.
- The high of the shooting star will be the stop loss price for the trade.
Hi sir, In the hanging man\’s last graph, risk taker would have triggered the stop loss at Rs. 493.75 on day 2 right and could have booked the loss
Yup, we have discussed that in the comments.
My question is that how do we set the target you mentioned about the stop loss but what about the target?
For target, one of the things you can do is base it on things like support and resistance.
Hi Karthik,
Do we trade this Hammer?
1. Body is between 0.5% and not between 1-2% that you mentioned.
2. Satisfies shadow to body ratio
3. Has a prior downtrend
4. Has a slight upper wick hence there is a slight difference between close and high
Yup, assuming the volumes are good and you have the conviction to pull the trigger 🙂
ok Thanks
Hi Karthik,
Thanks for the detailed explanations. It is really insightful. However, I notice that though these candlestick patterns indicate where the stock price will head towards, there is interim reversal of that trend which later goes back to original trend indicated by the candlestick. For eg, I see charts where a hammer forms at a downtrend indicating that the stock will turn bullish and it also stays blue for 1-2 days. But then there are few red candles after which again the bull trend continues. My question is how do I know that bull trend will continue after the few interim red candles? As a beginner, how do I stay put with the bull trend with few interim red candles?
YOu will get that only by experience and as you spend more time in market. Also, there is no definitive way to do this, its largely gut and instincts 🙂
Hi Karthik,
EOD Chart for INFY on 17th March, 2026 is O=1245, H=1245, C=1232.9, L=1215.1
I see a hanging man in a downtrend and it satisfies the \”shadow to real body ratio\”. Assume, I set the stoploss at low. After 17th March, the chart has gone up till date but after two days there was a candle whose low was = 1215.1. In this case my stoploss would be triggered and I will have to exit right as we have no control over these situations? What can we do in these situations so that our stoploss does not hit as I see the trend has gone up?
Sorry- Quick correction, the candle is \”Hammer\” and not \”Hanging man\”. I could not edit my comment there hence had to add another
I figured as much 🙂
One thing you can do is to use ATR based SL.Example – you can consider to use the 14-period ATR to set a volatility-adjusted SL.
SL = Low − (1× or 1.5× ATR)
If INFY\’s ATR around that period was ~₹15–₹20, your SL would be ₹1,195–₹1,200 and that gives your trade room to breathe.
Ok, I will check this out in the upcoming chapters. Thanks
Happy learning!
I am understanding about these candle patterns, now I am very curious to know that how after day trades happen and how it affects the open price on the next day as I am getting very confused to see that sometimes the open price is higher than the previous day\’s close and sometimes the open price is lower than previous day\’s close?
Open price is fully dependent on the overnight supply demand dynamics and not about the pattern as such.
Hi, you mentioned trailing stop-loss earlier, but I don’t see any specific topic covering it in the technical analysis module. Could you please explain what it is and suggest any resources where I can learn more about it?
Also, I’m planning to start swing trading in the Indian markets. I believe the content covered in this module is good enough for me to get started, but are there any additional resources you would recommend before I begin trading? I would also really appreciate any advice you have for a beginner.
Thank you.
Let me give you an example of a trailing SL. Assume you enter a long trade at 100, SL is 95, target is 110. Stock moves in your favor, target of 110 hits, you feel it will go higher. You now move the SL to 102 or 103, where in you are locking in 3 as profit, while still in trade. Stock moves to 115, you push the SL higher to 105 or 108. So as and when the movement happens in your favor, you push the SL higher and higher. This is trailing SL.
I\’d suggest you get started with this, once you start trading you will know if there are any specific gaps in your understanding, which you can selectively address at a later stage. But most importantly, start with small amounts and scale slowly.
Thank you, Sir.
Happy learning 🙂
Hi
mr karthick ;im in state of dilemma,if colour does not really matter for candlestick then how can we able to identify the the market sentiment,where colour of candle&volumes also plays a crucial role in trading in my observation.let me give u example for ur understanding.
assume;u go for long trade so ur buy price is100 suddenly there is huge selling volume pressure rise so stock should go down right!when this occurence take place in particular stock, does bullish candlestick will play its role? in my intraday observation morethan candlestick volume also plays a pivotal role.if i\’m wrong plse illustrate with an example.
Colour does matter no? Only in case of doji and spinning tops, it does not matter, but it does matter in most of candlestick patterns.
Thank you ❤️
Sure, happy learning 🙂
Hello Karthick sir,
I have one question
If shooting star (either Blue or Red Candle) appears at the bottom/downtrend what implies that pattern.. if so what is my setup for trade?
It just emphasis more bearishness, and my trade intent would be to short.
Do these courses on fundamental and technical analysis work for US Markets also? or in general any market in the world, since the main thing is psychology on the buyers/sellers?
Yes, the techniques and principals remain the same. Does not really matter which market.
In the hanging man\’s portion ,the example of BPCL displays a candle after the hanging man pattern which has higher wick than the high of hanging man due to which SL is triggered ,even though the market went down. could you please explain this situation
thanks
Thats ok, as long your stoploss rule allows you to hold the position. In this case, the close should be higher than the P1 candle high.
Hi Karthik,
In general, What is the suggested candle time frame(I mean 1min, 3 min, etc) for intraday trading to use these candle patterns?
Thanks and Regards,
Yogaraj
It depends on your risk appetite. For someone like me, I\’d still prefer EOD charts to even trade intrday. If not, them maybe something like 10-15 mins time frame.
Hi Karthik
So effectively both \”shooting star\” and \”hanging man\” ( after an uptrend ) servers the same purpose of suggesting that there is a high probability of downward movement , correct ?
Regards
Sushant
Thats right, my personal preference is the shooting star 🙂
Hi, I had this general question that in just seeing candlesticks particulars, we miss the relative position of the the current candlestick wrt the previous one. What I mean to ask is, in all this, we ignore the overnight price movements, weekend price movements. Can you please give more insight on this?
The assumption is that the price you see at open reflects all overnight sentiment in the stock, so its kind of factored in.
Hi Karthick Sir
Should we exit the trade when the candle crosses the SL level or close with EOD candle?
What is your method?
Please give an answer.
If you delay to reply this query, kindly give the answer in my whatsapp if you dont mind.
90370 22131
I\’d prefer EOD candle, but thats just my personal preference. Advantage is that you can wait for a clear confirmation, however, the disadvantage is that it can be too late sometimes.
Please clarify on candle colour in cases of Hammer, Hanging Man and Shooting Star
The colour for these candles does not matter.
Open = 592, High = 593.75, Low = 587, Close = 593. Based on this, the trade set up
would be as follows:
o The risk taker initiates the short trade on the day the pattern appears (at 593)
o The risk-averse initiates the short trade on the next day at the closing prices after
ensuring it is a red candle day
o Both the risk taker and the risk averse would have initiated their respective trades
o The stoploss price for this trade would be the high price i.e, above 593.75
The trade would have been profitable for both risk types.
If Iam a risk taker and I buy the stock for 592 and set my target as 593.75 so I make a profit, and I can set the stoploss and trigger price below the 592, let\’s say 591. My doubt is why the stop-loss price is high? The stop loss price has to be below 592?
SL is usually at or below your purchase price.
the chart just above the 7.4 topic is just the best example that could have been used to explain shooting star better
Thanks Tanmay. Happy learning 🙂
MR.KARTHICK Shooting star is similar to doji,so what if both forms on nearby near is there any other to find out both specifically
Not really, both forming together suggests more bearishness 🙂
hello sir,
can you explain the 2nd rule – be flexible?
That is in terms of how matching the pattern you see on trading terminal to the one text book defines. There could be minor variations and thats ok. For example a marubuzo as per definition should not have a lower shadow, but a if you see a small shadow, then it should be ok. The only thing you need to ensure is to define what is considered as small.
hello sir,
the only priority in case of umbrella is having a shadow 2 times the real body and not the colors as said above, but in the video it states that hammer should appear in case of down trend and vice versa. so can you kindly clarify that.
i have understood the price action logic behind this but does the colour really matters? or is just a candle indicating the price action and reversal of the trend
Candle colour also matters, Abhishek.
Hammer is a variation of the paper umbrella, and it appears at the bottom end of the rally.
May I know about Inverted Hammer concept?
That would be a shooting star right?
The inverted hammer candlestick pattern is a bullish reversal signal that appears at the bottom of a downtrend. It looks like an upside-down hammer, with a small body at the bottom, a long upper wick, and little to no lower wick. The pattern suggests that buyers are starting to exert pressure, potentially leading to a price increase.
Similar as Hammer, appears at bottom of the downtrend, whereas shooting star appears at top of the uptrend.
https://commodity.com/technical-analysis/inverted-hammer/
Hey, so we know that we should exit a trade only when either the stop-loss or the target is triggered, but throughout the theory so far, we have been discussing the entry point and stop-loss for a particular pattern. How do we know what the target should be for a specific setup?
Dishant, for target you need to look at things like support and resistance. This is one of the methods of identifying targets. Other techniques can include fixed percentage targets, trailing targets etc.
Hi Karthik,
What if a shooting star appears at the end of a downtrend? In that case, it should indicate the entry of bulls in the bearish market. So, applying the same logic as the hanging man, it should indicate a possibility of a reversal, right? After all, it\’s an inverted paper umbrella, so the same logic should work…in reverse.
A shooting star at the bottom end of the rally indicates more bearishness. Think about it from the price action perspective – you should check this – https://youtu.be/z0Rwoz6PduM?si=AboHlJCWzM4SoeRm
Here\’s how I understand it:
Candlestick psychology isn\’t symmetrical…at all.
A hanging man appearing in an uptrend is a red flag. It signals that sellers have entered the scene, even if the day ends with a recovery. That’s important because selling pressure showing up in a strong bullish trend is new information, and new behavior is what alerts traders to potential reversals.
Now flip the scenario:
A shooting star appears in a downtrend, showing that buyers tried to push prices up but got slapped back down. But this doesn\’t carry the same weight. Failed buying attempts are expected in a bearish market; they don\’t change the character of the trend.
Maybe it\’s because pushing prices up takes sustained effort and strong sentiment, while pulling them down can happen fast and with little resistance. Reversals happen when there\’s a shift in control, and a shooting star in a downtrend doesn\’t show that. A hanging man in an uptrend might.
Yes, thats right. The point is to understand the price action of the candle and not just the pattern it forms. Once you take this approch, knowing what the pattern is does not really matter as you go with the what the price action suggest.
Hello Karthik
I have a thought on your below statement.
\”My only concern with a hanging man is that if the bears were indeed influential during the day, why did the price go up after making a low? This, in my opinion, re-establishes the bull’s supremacy in the market\”
The price went up after making low because of amateurs bought on seeing buy on dip in an established uptrend?!. But pro traders only know there are entry by bears.
What do you feel?
Regards
Nishad
Kochi
9037022131
Well, eventually you see the price action and the end result, which is what the candles help up do 🙂
For min of what days we should take to see the trend and i could understand the stoploss thing but target is not clear yet. Means we know the stoploss but we never knew till when our predicted trend will continue ahead so when should we square off or exit from our trade ?
Chirag, I\’d suggest you start with at least 6 months of data and use EOD charts for this.
Hi, I have a simple question — as a beginner in trading, which time frame should I use to analyze chart patterns for intraday, swing, or positional trading?
I\’d suggest you use end of day chart to begin with.
Hi,
I have a doubt about this part.
In the chart above, BPCL Limited has formed a hanging man at 593. The OHLC details are –
Open = 592, High = 593.75, Low = 587, Close = 593. Based on this, the trade set up would be as follows:
The risk-taker initiates the short trade on the day the pattern appears (at 593)
The risk-averse initiates the short trade on the next day at closing prices after ensuring it is a red candle day
Both the risk-taker and the risk-averse would have initiated their respective trades
The stoploss price for this trade would be the high price, i.e. above 593.75
The trade would have been profitable for both the risk types.
If you entered as a risk taker on the same day at say 593. The Stop loss is hit on the next day as the prices went above the stop loss 593.75. Are we considering a stop loss on closing basis only?
You can choose your closing price between the day\’s close or day;s low. My personal preference is day;s close.
How to know the duration of the trade? For eg, I have see a Hammer in the downward trend and put money when should I exit the trade?
Trade exit is based on your target, which should ideally be identified before the trade itself.
Hi Karthik,
I was not able to reply to your prompt reply and answers, but many thanks! FYI, you have answered my queries, and none have been left. Thanks again!
Happy to note that, Raja. Good luck and happy learning 🙂
Hi karthik,
Please do reply to the above questions when you have time. Thanks.
Sorry, lost the context, can you please elaborate on this?
Hi Karthik,
Thank you for the excellent content.
Is multi-time frame analysis truly helpful in determining winning probabilities?
Thank you!
Happy learning! By the way, these are all just odds. No guarantees 🙂
Hi Karthik,
Thank you for the excellent content.
I would like to ask you whether you use technical analysis (TA) on indices when trading options. If so, have you noticed any differences between using TA on individual stocks versus indices? Please share your insights based on your experiences.
Thank you!
It does not really matter. But if I was forced to pick something, then the only thing is that for indices, the liquidity is far higher than an individual stocks. Hence, TA on indices could be slightly challenging.
Hi Karthik,
Thank you for the great content.
I have a few questions. You mentioned that you left trading because you didn\’t have time to develop a new trade setup, correct? If human psychology hasn\’t changed over the years, then shouldn\’t the established trade setups also remain effective? If a trade setup was efficient and successful before, it should still work, right? Please clarify this for me.
Thank you!
Not necessary. While human psychology remains the same, other things like number of trades, volatility, demand, supply, liquidity changes, and that does seem to have an impact.
Sir You said that in Hammer pattern longer the lower shadow means more bullish pattern, but I have seen there are around and 3-4% of lower shadow and so using stoploss as low of the hammer is risky should we avoid that?
Yes, with longer shadows the stoploss becomes deeper. But the thought here is that the bulls were in full swing.
Do we have any way to identify if any of pattern occurred like any formula or indicator
There is. Check section 22.2 – https://zerodha.com/varsity/chapter/the-central-pivot-range/
Thank you so much
Welcome, and happy learning 🙂
Thank you so much Karthik for your incredible content
sometimes, just after one pattern for eg. Bearish Engulfing a 2nd pattern forms- bullish harami,what should we do in these kind of situations?
Thank you
Ankita, this is quite common. What I do in such cases, I stick to the pattern that I have initiated a trade on. Once the trade is in place, stick to it until your SL is triggered or target has been achieved. Until then, you can ignore the 2nd pattern.
Both hammer and hanging man seems to be same, but their position is the only difference? So, why not a shooting star better for an downtrend after an long and hammer better for a long after an downtrend?
Vasanth, do check this – https://youtu.be/1kQjXFL4Mfc?si=62Lo99nXCztHwyer
What if shooting star has formed in a downtrend?
Thats ok, it indicates more bearishness. Do check this video on how to use Candlesticks – https://youtu.be/1kQjXFL4Mfc?si=62Lo99nXCztHwyer
suggest the time charts to be used for differnt trading methods ???
like time frame for intraday, swing , long , scalping , short term …
I\’d suggest you use end of day charts for this.
If we are shorting as a risk-taker right before the market closes then how would we get the time to square-off?
YOu can short via derivatives market and carry forward the position overnight.
Hello Sir, What if the shooting star formed at the bottom of a downtrend. Or usually it doesn\’t form like that , could you please clarify
It can form anywhere. If it does at the bottom of the downtrend, it just means more bearishness 🙂
Hello Karthik Sir
In my experience, no single candlestick pattern can guarantee the direction of a trade—each one only provides a rough probability. Relying solely on candlestick patterns to enter trades can be risky. However, by combining candlestick analysis with volume data, we can better assess risk and make informed decisions about position sizing. This can helps in determining whether to choose ATM, OTM, or ITM options based on the potential reward-risk scenario. A 5-minute timeframe candle offers insights into the market\’s current sentiment, while daily, weekly, and monthly candles provide a broader perspective on trend and momentum.
Yes, thats right. There are no guarantees in the market.
Risk takers can qualify the day as a hammer by checking the following condition at 3:20 PM on the hammer day…
from the above line why is important to check in at 3:20pm. is it necessary that we should check at 3:20pm?
Yes, that helps.
I didn\’t understand the following part. can you please explain in detail
\”My only concern with a hanging man is that if the bears were indeed influential during the day, why did the price go up after making a low? This, in my opinion, re-establishes the bull’s supremacy in the market.\”
It just means that the conviction of bears was not strong enough. If it was, then maybe the stock would have close at the high point of the day itself.
If there is a green candle of a shooting star in a downward trend 📈. what\’s the meaning of this or this is useless
The colour does not really matter in a shooting star.
I found hammer failing frequently in intraday for 5 and 15 min. In two days I have found the candle at the bottom of the trend but always failed. Resulting to losses. Disappointing.
Patterns don\’t give guarantee, Ashish. In fact nothing in markets are guaranteed.
Thank you for the response:)
Cheers!
Can you please explain the following?
December 25, 2023 at 12:56 pm
On a weekly chart of the nifty looks like a hanging man is formed ? Is this correct ?
Reply
Karthik Rangappa says:
December 26, 2023 at 6:58 am
Just that the opening is not closing wrt to the previous week is not very convincing 🙂
It means that the the opening is not where its supposed to be for a hanging man. I\’m guessing this is with reference to the previous day\’s candle or something like that.
Thank you 🙂
Happy learning 🙂
Hi Karthik, thank for taking time to respond.
I might\’ve put the question in a wrong way, sorry for that. My question is how can I decide the previous trend and how many candles should I look at to decide the previous trend. It is just a little confusing:(
No, the number of candles does not really matter. End of the day, it is all about the price action.
Thank you for responding. But are 3 candles enough to identify a trend?
Yes, like I mentioned, you can identify a trend with 1 candle (marubuzo), or with 3 candles (evening star).
Hi Karthik, how can I identify the trend it sometimes gets confusing, how many candles should I consider to decide a trend?
Trading signals are generated by either 1, 2, or 3 candles.
In 7.3 – The Hanging man
In the second chart, BPCL Limited has formed a hanging man at 593.
You said Both the risk-taker and the risk-averse would have been profitable.
But the stoploss price for this trade was the high price, i.e. above 593.75.
For the risk-taker for the second day candle went above the stoploss, right?
Then he would have exited from the trade. Right?
Then how would it be profitable for him
The stop loss would not have triggered if you are looking from a close perspective.
Close perspective meaning.?
From the closing price perspective I mean.
Great content karthik, kudos to you.
My question is
Would it still be an uptrend if there are more red candles than blue but price is moving upwards ?
Hi Karthik,
In the shooting star section, you said that \”once the trade is initiated, either wait for the stoploss or the target to be triggered\”. I understand the reason for that is the stoploss in the trade because it serves as a failsafe in case things don\’t go the way we expect, but \’the target\’ here refers to the same thing as well?
Let\’s say I short around the shooting star and have placed the stoploss. Consider that the market became bearish after the shooting star but in order to make profit we must exist the trade at the right time i.e. when the market starts to become bullish. It seems my (normal way) is countering to what you said \”Once the — triggered\”.
I know I am misunderstanding some stuff, it did be great if you can clarify things up.
Archit, I think you are getting confused with shorting as a concept. In shooting star pattern, you short the stock by keeping the high of the pattern as a stoploss. In order to make a profit, you need to wait for the prices to come down. You will make a loss if the stock prices increases more than the price at which you\’ve shorted.
Yes, but can you explain the logic of that? Am not clear on the \’Why\’
Its the price action, and we combine that with how traders have reacted to price action historically and take a trading call.
Hi! I am still confused about the shooting star\’s stoploss. Why would it be at the high of the shooting star?
I saw your previous comments before where you stated \”either you square off an existing position or you can initiate a fresh short position. If it is a fresh short position, then you need to have a stop-loss.\” – but am still not clear on the concept.
For all short positions based on candlestick patters, the stop loss is the high of the pattern candle.
Hi,
I have a basic query. We have a bullish as well as bearish pattern for the paper umbrella candlestick. Similarly, we should have a bullish as well as bearish pattern for the shooting star. However, a shooting star signifies only bearish pattern in an uptrend. Isn\’t it logical to assume bullish pattern when a shooting star forms in a down trend?
Not necessary. Eventually you should move away from identifying patterns to identifying price action. Candlesticks will start making a lot of sense if you look at it from price action perspective.
how to do the trade the same day unless the pattern has been formed
You have to take cues from the patterns, that is one of the ways to setup the trade.
In 7.2 there is a chart (chart no. 4) where 2 hammers are shown, first one is blue and second one is red. I am not able to understand that why a trade won\’t enter a trade after he/she sees a blue hammer after a downtrend. And how on the basis of rule 1 the trader will guess that they should save themselves from loss making.
If we generally see a blue hammer after the downtrend logic says that the market will go up.
Kindly answer my query.
For the 1st blue candle, the SL was triggered right? How can you enter a trade?
I suggest we come out with a book or a pdf covering entire module (technical analysis) which would be a great tool.
The PDF is available for free, feel free to print 🙂
Realized My mistake that I didn\’t decided stoploss I was just waiting for the red candle appearing.
Sure, no problem. There is learning in every trade 🙂
And why did There is a gap down opening in BSE when everything is going well whereas In NSE there is a Regular Opening.
I wish I knew the answer to this 🙂
Hi Karthik
My question and request to you is that look at the Britannia Chart On 06 May 2024 the long candle appeared I did a trade and I goes long with 5079.85 because there was a Gap Up Opening and the volume also in the Favour of going long but I wasn\’t able to draw S&R Because I didn\’t find any Good Price Action points and Indicators were also suggesting for a trade. I was waiting for the red candle day to Sell the Stocks but today it was A Gap down Opening in BSE Chart and It formed a Shooting star However in NSE there is Regular Opening.
Should I consider these 3 previous candlesticks as bullish Trend?
Should I book Loss? because if this is a shooting star it Would Probably Fall further.
As this was my First Trade After learning Some TA and I want your help to know if I did any mistake with the trade?
And another question is that Should I consider volume on selling days also on red candle?
What is your SL? You should identify one and stick to your SL level. Also, if your SL is hit, you should get out of the trade as soon as possible, irrespective of the volume.
Hi, if a shooting star candlestick is formed in a downtrend or bearish trend then what signal does it send about the future trend?
Going by the price action, it would indicate more bearishness. Check this – https://www.youtube.com/watch?v=1kQjXFL4Mfc
Hi! Shreyas, I Think it indicates more bearishness in the future.
like the 7th last candle in the last chart for example
hi!
My question is,
what if a shooting star appears at the downward region following a downward trend where the upper shadow is relatively higher than the body?
would this indicate a future upward trend because the bulls would seem to capture the stock.
Check this – https://www.youtube.com/watch?v=1kQjXFL4Mfc
ohh!
Thank You Brother.
Hi, I want to ask that you mentioned risk taker can make position by doing shorting in shooting star on the same day before closing of the market and it will be profitable. How it will be profitable in such a short time because the movement in prices will be very less. Explain It please.
You short and hold position in derivatives segment, Saurabh.
Hi Karthik,
What should be the time frame that we should be maintaining to identify the hanging man and hammer pattern\’s while taking a trade in indices?
I\’d suggest end of day, in fact, the end of day is good for all patterns.
I have one doubt, the difference between open and close of a candle is 0.5% and the lower wick is thrice the size of the body. should I consider it as hammer or doji?
Hammer is ok 🙂
Hii sir,
Should we consider this prior trend for shooting star sufficient
https://drive.google.com/file/d/1e-tnyX4kWLmfNwlQebXX2vHPAomyic_k/view?usp=sharing
Thank you
Yes, prior trend is something you need to consider.
sir, IF THE CANDLE IS BULLISH ENGULFING OR CANDLE AND AS A RISK AVERSE TRADER I NEED TO WAIT FOR PREVIOUS DAY CLOSING OR PREVIOUS DAY HIGH CLOSING OF P1(BULLISH CANDLE) BY P2(NEXT CANDLE)
Can You Explain me further about these,
simple DCF technique for valuing stocks, you told me previously for calculating intrinsic value of a stock
Have explained here – https://zerodha.com/varsity/module/financial-modelling/
Sir,
I am finding difficulty in prediction for whether a candle is doji/hammer (in terms of body length). As for a doji, the body should be a thin wafer and for a hammer the lower wick>= 2*body length with ideally no upper wick.
Could you please help me with analyzing whether I should consider a candle is hammer/doji in terms of body length or if there are any more things to look for to predict the difference. Many a times, I am getting confusing with the body length to consider if the same is a hammer/doji. Please help.
This should help –
1) If body is wafer think where in the close and open are near the same, then its a doji.
2) If the real body is wafer thin or a very small real body with the lower shadow nearly twice the length of the range of the small real body, then its a hammer.
Acoording to your view, How to calculate the intrinsic value of a stock ?
Stick to simple DCF technique for valuing stocks, thats what I prefer 🙂
Hi, when we are saying wait for the next day candle for confirmation in case of risk averse trader, which time frame candle we need to look at on next day? Minutes / Hourly / Daily ?
I\’d prefer daily Brahma.
what if Shooting star forms at bottom & pattern is already bearish.
It indicates more bearishness 🙂
In Red hanging man you have given OHLC as In the chart above, BPCL Limited has formed a hanging man at 593. The OHLC details are –
Open = 592, High = 593.75, Low = 587, Close = 593. Close should be less than the open isn\’t it?
Suneel, the actual colour of the candle does not matter as long the open and close are near each other.
Another question that hesitate me from the beginning of these journey i asked everyone but not get expected result, hope to get it from you
I am a equity trader (actually options fu** me)😂 so i need to select stock everyday for intraday trade. now i try software like chartink, screener, but not getting any expected result, i try many methods like put 5 sectoral stocks in a watchlist and watch if the sector grow on that week, blah blah …
can you suggest me any website or app or any method to select stock for intraday trading.( it is not for any paid promotion, its just a suggestion for me )
Thank You
You can try streak, its free anyway. Give criteria that you think are important for identifying stocks and the software will help you backtest it. You can even write to them asking for a demo.
according to you, what are the checkpoints of learning trading from basic to advance. Just share your view as an educational purpose, and can it be available on varsity, or partly available in varsity and partly in other website, if so then please share the link of the website(no paid promotion)
Jeesu, I\’ve put up everything that I think are relevant to know here on Varsity, including the books.
street expectation is less than the result, ITC did a massive quarter profit
Yeah, things like this is a positive surprise.
In the last one year, my analysis says that when some company earn a good quarter profit, there share go down consecutive days instead of going up, which is natural, and when some company make loss in quarter, there share rise,
As a example take ITC, few days ago it announce a good quarter profit and there share comes down more than 15%,
i like to know why market behave like these ? i know its market anything happen it here by those crazy market participants, but what was the human psychology behind these ?
This is not natural, its all based on what the street expects and the actual company results. For instance, the results could be positive with 100Cr quarterly profit, but if the street was expecting 120crs, then the stock price reacts negatively.
in kite, i have 3 share of ITC, one i buy at 490 another i buy at 450 and another i buy at 400, now i want to sell 1 share out of it, which share will be sold first, and how did the whole calculation happen.
i mean as of now ITC trade at 410, so if i want to sell a share of buying price of 400, then i can make a profit of 10 rupees, but if kite sold the 490 wala share, then i incurred loss. so how did the calculation happen ?
This works on FIFO basis, Jeesu. So your first share purchase of 490, will be considered sold.
i want to ask after 9:00 to 9:15, stock price go up and down, that means someone was placing orders on that 15 minutes, same goes for the end session at 3:15 to 3:30, the stock price fluctuate, but the marker got closed for retailers, so who place those orders ? and can i place order on that 15 minutes time slot
9:00 to 9:15 is pre market order and does not really get transacted in the market. All transactions are between 9:15 AM to 3:30PM.
Sir,
Let\’s say every trader knows about hammer pattern , and there is a buyer and seller in the market, so both of them know this thing, then why will the seller sell when there is a hammer pattern , if the seller knows that the the market will reverse. 🙂 It\’s a psychological question as I questioned myself in trading there is a buyer and a seller , to make profit we need to enter as a buyer or a seller. If both of them know all the strategies , candlestick patterns who will win then.🙂
Its just that market is big enough to attract all sorts of different opinions, thats why its called market 🙂
Different opinions is what actually moves the market.
can you tell me who place trade on 9:00 to 9:15, and 3:15 to 3:30… and can we place order on that time ?
Who as in? Not sure what you mean, can you kindly elaborate?
does the colour of paper umbrella matters?
Not really. It does not matter much.
Hello Karthik, in the explaination for the last chart, what exactly does stoploss has been breached mean. Could you kindly explain that ? Another stoploss breach example would be of great help. Thank you
The Stoploss here is the high of the shooting star, which over the next few trading sessions has been taken out as the price trended up. Thats what I mean by SL breech.
I have two questions
1. Which is the best time frame to find these single candlestick bullish/bearing patters for buy and sale. Is it day TF or is it an intra day TF.
2. Out of the thousands of stocks on the bourses how do i identify the stocks which i need to see a particular candlestick pattern. Meaning, I want to find which stocks have formed a Bullish Marubuzo candle, i cannot scan each and every stock. So how do i scan the entire range of stock and find out which stocks are forming the Marubuzo candle
1) I\’d suggest End of Day candles, Snehal.
2) You can use Streak.tech for screening this I guess.
Hello Sir,
What if the prior trend for a hammer is a single candle of more than 5% length with above 10-day average volume, just like in the case of CANARA BANK, will it be a prior trend or a sharp reversal
Thanks
We need at least a few days of sustained downtrend before we can call a hammer a hammer. One day candle should not be considered.
Psychologically what is the difference between a shooting star pattern and a hanging man?
They both indicate bearishness in the coming session. Personally, I prefer the shooting stat over the hanging man.
When trading intra-day, How can we find the target of the trade? (We know what will be the stop loss but the target price?)
One technique is to keep a fixed intrday target like 1 or 2% moves. Alternatively, you can look for intrday support and resistance points to infer potential target and stop loss points.
Hi Karthik,
If you can suggest few platforms which are best for backtesting?
Check this – https://www.streak.tech/home
Hi Karthik,
Love the simplicity and clarity of the lessons. Appreciate the effort.
I am new to trading, so can you please explain these patterns with relation to the time frame of the chart because the candlestick changes when we change the timeframe, it confuses me.
Thank you in advance.
The good thing about candlesticks is that the pattern remains the same irrespective of the time frame. So you can change the time frame and still interpret the pattern as explained.
On a weekly chart of the nifty looks like a hanging man is formed ? Is this correct ?
Just that the opening is not closing wrt to the previous week is not very convincing 🙂
in the hanging man section of an uptrend, why both the risk-takers and risk-averse would have been profitable?? as the very next candle hit the stop loss of 593.75.
Not really, it is a short trade right?
hey what should be the stop loss in case of hanging man
The low of the hanging man or the nearest support, Nithil.
your teaching and examples are wonderful. thanks a lot sir and your team
Thanks for letting us know, glad you liked the content. Happy learning 🙂
my query is regarding hanging man, its written as bears enter in the lower shadow but if bears enter the price should move down and make a red candle or a shooting star leaving a long upper wick, I PERSONALLY feel long lower wicks are formed as a buying trail, please explain
Yes, but the bears are shorting right? The stock price is expected to go lower when more people short.
I have a confusion regarding shorting that you have used example of risk taker that he can short the stock on the same day of umbrella or shooting star but is overnight short an intraday, and if it is then what is intraday. Can you figure out where my confusion lies?
Thankss..
If you\’d like to short and carry forward the position, then you\’ll have to ensure you do that trade derivatives and not equity spot.
Thanks for the great learning material, Mr. Karthik.
I\’ve a dilemma understanding the candles b/w the hanging man and the shooting star.
both looks very similar with small real body and lengthy upper shadow.
both the candle sticks prior trend has to be upper one.
both the candles can be used for shorting opportunities.
The reason you\’re written the shooting star is indirectly telling me that please use shooting star than the hanging man candle.
How does both really have their differences? Can you help here?
Yeah, b/w the two, I somehow prefer to short based on the shooting star, but its just a personal preference 🙂
Do check this video – https://www.youtube.com/watch?v=z0Rwoz6PduM&list=PLX2SHiKfualEyD05J9JsklEq1JFGbG6qJ&index=3
the support you provide is awesome
i also have another question
how can i know that candlestick is short or large (below 1% and above 10%)
is the formula to calculate is same?
You can use this formula –
Range = (Difference b/w open and close)/Close.
In 7.2 heading of hammer patter under trade setup point 2a i open and close should be equal (within 1-2% range) what is the formula to find range is it (open-close)/close*100
Yeah, this works – (open-close)/close*100
Ensure the numerator is the absolute difference.
How to caculate the Wick size compared to that of the body to determine if its 2x times greater than the body
Assume you want to calculate the lower wick size of a bearish candle. Assume the OHLC as –
O = 405
L = 375
H = 425
C = 380
Lower wick = (380-375) = 5
Higher wick = (425-405) = 20
Real body = (405-380) = 25
Now you can make the comparison.
Sir, great contents, Thanks.
Can u pls.clarify this :
Under 7.1 about paper Umbrella, example given is reproduced below,
\”Let us look at this example: Open = 100, High = 103, Low = 94, Close = 102 (bullish candle).
Here, the real body’s length is Close – Open, i.e. 102-100 = 2 and the length of the lower shadow is Open – Low, i.e. 100 – 94 = 6. As the length of the lower shadow is more than twice the real body; hence we can conclude that a paper umbrella has formed.\”
From what I understood from content is that in case of a bullish paper Umbrella, the high should be within the close and then only umbrella will be formed. But in the example high is 103 and close is 102 which will result in a wick at the top. Can you pls. clarify?
A paper umbrella on its onw is neither bullish or bearish, these attributes are given when you place the paper umbrella in the context of the prior trend. The main qualifying criteria is that the length of the shadow should be at least 2x the length of the candle\’s real body.
Hello Karthik, As we have seen the case \”The Hanging man pattern\” has longer lower shadow and \”The shooting star pattern\” has longer upper shadow but in both patterns inference is to short the stock. Means either of the shadow functions is bearish?
Please clarify and correct if I\’m wrong.
Yes, in both cases the idea is to short the stock but the price action is slightly different in each instance.
If hammer is formed in downtrend and you mentioned that range should be 1 to 2 percent. If open is greater then close then how could calculate the range of candle.
Range = Difference between open and close/open
But even after attempting to push the prices lower, still bulls manages to take it upward. Then why trend reverses ?
These are probabilities, Ankita. No guarantees in market.
Thanks Karthik, but my question was, what is the concept behind hanging man ?
Hanging man is seen at the top of uptrend, it clearly says that, bears try to push the market down, but bulls over-power them and hence the closing is much above the low, thus creating an umbrella like pattern.
So, if bulls were in control, why the trend reverses ? It should continue to go upwards, right ?
Yes, but the chances of that happening reduces as the bears have made an attempt to push the prices lower.
Lets not consider it hammer, let\’s say –
What if a green paper umbrella pattern appears on the top after a bullish trend, what does it signify ?
@Rohit, I\’m correcting because hammer is only formed in downtrend.
A paper umbrella at the top end of the rally signified bearishness and its called a hanging man 🙂
Same doubt!
If the hammer appears on the top after a bullish trend. What does it signify further trend ? Bullish or Bearish ?
Bearish, since its a hanging man.
Thought process behind a hammer is as follows:
The price action on the hammer formation day indicates that the bulls attempted to break the prices from falling further, and were reasonably successful. This action by the bulls has the potential to change the sentiment in the stock. Hence one should look at buying opportunities.
Thought process behind a hanging man is as follows:
The entry of bears signifies that they are trying to break the stronghold of the bulls. This action by the bears has the potential to change the sentiment in the stock. Hence one should look at selling opportunities.
Isn\’t these statements contradicting?
What changes between the two is the prior trend they occur in. Hammer is in a downtrend, and hanging man is in the uptrend. So there is a difference.
Hi karthik,
To determine whether it is uptrend or downtrend, how many previous sessions do we need to look. Does the number of prior sessions changes when we change the time period of the chart?
If you are interested in looking at longer-term trends, then look for at least 2 years. For shorter-term trades, maybe 6 months is also ok.
Hi Karthik,
Can you please add feature to attach the screenshots in the comments section which would make easier to post or ask the questions specifically when something happened in the market.
That maybe tough, but you can upload on drive and share the link.
thanks karthik! i think, i mistook the \”bearishness\” as \”bullishness\” & asked a silly doubt. again, thanks a lot!
No problem, happy learning 🙂
if so, isn\’t it a good idea to look for buying opportunities. but you have also mentioned that Shooting star is a bearish pattern & hence prior trend should be bullish. can please elaborate it bit more with ref. to my doubt
A shooting star in a down trend signifies more bearishness. So look for shorting opportunities.
Hi Karthik, I am just curious to know that what happens when shooting star appears in the downtrend? what does it signals?
It just signifies more bearishness 🙂
Hi Sir,
could you give the explanation why hammer has more impact than the hanging man.
Hi Karthik,
Can a Shooting Star not appear at the end of a down trend? Thus signalling the possible beginning of an uptrend?
Asking because it says above that a Paper Umbrella can appear at the end of an uptrend (hanging man) or a downtrend (hammer). And further says that the Shooting star is the inverse of a Paper Umbrella.
These patterns can appear wherever Inder. The point is to look at the overall context of the chart and identify the price action. Check this – https://www.youtube.com/watch?v=z0Rwoz6PduM&list=PLX2SHiKfualEyD05J9JsklEq1JFGbG6qJ&index=3
Hi Karthik,
If I am not wrong, EOD charts means 1-day interval chart, is my understanding correct?
Yes, thats correct.
Hi Karthik,
I have some confusion on how to identify paper umbrella and shooting star. If I am looking to trade for 2-3 week, should I be looking into 15 min chart or 1 day candle stick chart. Thanks.
For 2-3 weeks, I\’d suggest you look at EOD charts, Vinayak 🙂
what does this mean that when the stoploss triggers and why the risk averse trader will trade on the closing next day of the formation of hanging man ?
Hmm, when the stop loss triggers, neither risk averse or the risk take takes the trade, right?
I am unable to understand exactly this line. Can you please elaborate on this?
\”My only concern with a hanging man is that if the bears were indeed influential during the day, why did the price go up after making a low? This, in my opinion, re-establishes the bull’s supremacy in the market.\”
Its just that the closing is near the high point, a bearish patter would be more convincing if the closing is near the low of the day. This is not the case with a hanging man.
can you explain the diffrence btw hanging man and shooting stars as they both are bearish trends.
The conviction in a shooting star is higher as the close of the day is near the low point of the day.
Sir,
Can the shooting star be considered for a prior down trend pattern too like, we considered the Hanging man in uptrend.
Yes, you can. I\’d suggest you also check this video on how to use the candlestick patters – https://www.youtube.com/watch?v=z0Rwoz6PduM
Hi Karthik ,
What is the duration of long trade sessions here in case of swing trading ?
Duration for a swing trade can be a few days to a few weeks.
Thank you Karthik.
Happy learning, Paul!
I went through the video you recommended. Very useful one. I have had a bad experience (intraday) with such stock (SPARC) where there was more than 10% abrupt stock movement.
Are these patterns good to apply as is for the intraday trading? It makes me to think that these pattern makes sense for short term or slightly long term (may be few months) trading or perhaps the F&O (which I’m yet to learn). I’m wondering how reliable these patterns are within an intraday chart of, let’s say, 5 mins chart that’s formed within the day? May be these are covered in the later lessons.
Paul, you can use these patterns across any time frame, including intraday. That said, I\’d prefer to look at 10 or 15 mins patterns as opposed to 5 mins.
👍
Ok, I just realised that I was talking about shooting star 🙂
Yeah, it is 🙂
Hi Karthik,
The varsity series of lessons are absolutely top notch. They lay the perfect foundation for any new trader and thank you very much for the content you have created. I can see that the lessons were crafted with lots of passion to pass on the knowledge. These lessons are the best!
Question: When you say \”My only concern with a hanging man is that if the bears were indeed influential during the day, why did the price go up after making a low? This, in my opinion, re-establishes the bull’s supremacy in the market.\”, would a reverse of paper umbrella on the top of up trend would be more appropriate to call as \’hanging man\’ indicating that the bears were successful in pulling the trend down? Just a thought, may be wild one 🙂
Glad you liked the content, Paul. It does, but it is just the naming convention 🙂
I\’d suggest you take a look at this – https://www.youtube.com/watch?v=1kQjXFL4Mfc&list=PLX2SHiKfualEyD05J9JsklEq1JFGbG6qJ&index=12
Sir,
What should be target?
For Example:- in Shooting star Stop loss is Pattern high. we have to exit if stop loss is triggered. But if market goes in our side(lower) than at which point we have to book profit?
Mohit, you can check for immediate support levels for setting the target.
If both the hanging man and shooting star are bearish patterns what do both of them imply? aside from their difference in shadow to body ratios?
These are two different patterns indicating bearishness, Prachi.
If the hanging man and shooting star candlesticks are both bearish patterns and have a prior trend of bullishness, what do both of them imply in terms pf market scenario? (Aside from their difference of upper and lower shadow to length ratios)?
Maybe i am not looking at it properly but would appreciate an answer. Thanks 🙂
Eventually, you will have to look at these patterns from a price action perspective. I\’d suggest you take a look at this – https://www.youtube.com/watch?v=z0Rwoz6PduM&list=PLX2SHiKfualEyD05J9JsklEq1JFGbG6qJ&index=3
Both signify bearishness, but you need to figure why bearishness, and the answer to that is attributed to the price action 🙂
Understood, Thank you Karthik!
Happy learning!
What if Shooting star appears in downtrend? Can that considered as buying opportunity with the similar thought process as Hanging man?
I\’d consider that as a selling opportunity. Do check this – https://www.youtube.com/watch?v=1kQjXFL4Mfc&list=PLX2SHiKfualEyD05J9JsklEq1JFGbG6qJ&index=12
Sir,
i have a doubt. As I read shorting has to be done intraday only. Then does that mean as per your illustration when Risk taker is initiating a trade based on Hanging man pattern , its only for few minutes as you mentioned arounf closing price of stock. Also in 2nd chart of Shooting Star for OHCL, Trader will short at closing price of 1417, its confusing. Please clarify. Also in 3rd chart of Shooting star, the open price next after shooting star formation is much higher than previous day closing price, does that not go against the methodology that Bulls are now getting control of market.
Nitin, you can short using derivatives (futures or options), and you can hold the position for multiple days.
For a risk averse trader does he have to wait for the close of the next day to make the trade only if red or blue candle day it is?
Around the 2nd half of the day, after confirming the trend.
Hi ,Are we considering 1day candle stick charts in the above discussions?
Yes, unless specified.
Thanks Kartik for your response. A kind suggestion; an email alert mentioning you replied to a comment at varsity would be excellent!
We had that earlier, but because of the number of comments on each chapter, these notifications get spammy, so we stopped 🙂
Hi Kartik,
What would be a definitive indicator to evaluate downtrends ans uptrends? How many previous candles one shall study to evaluate a trend?
Thanks.
I\’d say moving averages does a fine job at this 🙂
Want to understand, can shooting star formed after downtrend be considered as bullish, if not why?
No, if you go with the price action, it indicates more bearishness.
Query: In Umbrella Patter, it reverses both direction, Uptrend (Hanging Man) and Downtrend (Hammer) , But in case of Shooting Star is always Bearish, Why? Can you please help us with this understanding.
Shooting star is not a paper umbrella. It is a different pattern, although it looks similar to a paper umbrella.
Hi, In the last chart, what should be the trade position of a risk-averse trader on the 2nd day (around 3:20 pm). Is it at the closing point or a bit below the closing point or low point of 2nd day? In either case, the stock would have been traded in the next few days and SL would not have been breached. How have you mentioned the stop loss is breached when much before the SL breach trade is executed?
Please correct me if I\’m missing something.
Sorry, but which pattern are you referring to?
My intuition says checking 1 month chart with 1 day candlestick would define the trend. From there, we can check for intraday positions using 1 day chart and 15 minute candlesticks using the above mentioned patterns.
For intrday, you can even check 15 mins chart for last five days, that\’s good enough to give you a sense of intrday trend.
Hi Karthik,
Thank you for such an amazing quality and quantity of content. I think I\’m too late to ask this but I\’ll shoot it anyway. What time frame in your experience can be used to define uptrend or downtrend of a stock? 1 month? 2 month? more? less?
Kunal, you can assess the short trend by looking at both 2-month and six months data.
hii, karthik,both shooting star and hanging had the same criteria regarding setup
1.both are bearish patterns
2.both will form after a bullish move
can u plz tell me is there any specific difference between them?
Its just that in a shooting star, the bearishness is a bit more pronounced. I prefer a shooting star over a hanging man.
Dear Sir,
First I have never seen such an active comment section going on for more than 5 years anywhere on the internet. Kudos to you sir and big gratitude.
My doubt
Module Technical Analysis
Chapter Single Candlestick patterns (Part 3) 7.2 section the hammer formation
In the 3rd chart of hammer example by name \” ABB -EQ\”
There is a red hammer within the circle , but after that there was no up move, and it would have made a big loss , but the above text says , risk averse trader would have benefitted ! how is that sir ? both would have made loss know ?
Thanks, Ashwin!
The risk-averse trader would go by the buy strength and sell weakness rule. Under this rule, the risk-averse would not have bought the stock, given its a big red candle. Figuring out which trade not to take is itself a trade 🙂
Sir How to make use of trailing Stop Loss ? How to do it Actually?
Suresh, I\’d suggest you watch this – https://www.youtube.com/watch?v=rSYyB9fBsSs&list=PLX2SHiKfualEyD05J9JsklEq1JFGbG6qJ&index=6 also keep an eye on Varsity Youtube channel. We will put up some interesting videos.
PLease watch this video – https://www.youtube.com/watch?v=rSYyB9fBsSs&list=PLX2SHiKfualEyD05J9JsklEq1JFGbG6qJ&index=6
Hello Karthik sir just wanted to ask as mentioned in the pdf module its written that opening and closing prices are similar in paper umbrella then doesnt that become bit difficult to differentiate between spinning top and paper umbrella and even in patterns they resemble bit similar size help me out with this query..
Yes, it does. Hence the only differentiating factor is the shadows. YOu need to pay attention to that.
In the hanging man example, the BPCL chart has formed a red hanging man at 593. The OHLC details are Open = 592, High = 593.75, Low = 587, Close = 593, just curious if the open is @592 & close @593, shouldn\’t it be a blue hanging man stick since open is higher than close ?
Yeah, but also check with y\’day\’s close. If today\’s close is lower than y\’day, it will still be a red candle.
Hi Kathik,
In the Shootin Star example (open = 1426, high = 1453, low = 1410, close = 1417), how can a risk-taker initiate a trade at closing price (@1417)? Can a risk-taking trader initiate a buy or a short trade with the closing price after 3.30pm (say 4pm)? Or when you say initiate a trade at closing price of that day, you mean the price at 3.20pm?
Thanks,
Prasad.
No, the idea is to initiate the trade just before closing. You can trade via F&O to carry the position forward for the next trading day.
Hi guys,
other then above mentioned candles,
How can somebody should see shadow in decision making.
likewise their are many kind of candles do take place with shadow, some of them decision making candles u had mentioned above and in previous chapters. so how do we read the remaining candles shadow.
hope so u have understood my question I have tried to write
Check this Ronak – https://www.youtube.com/watch?v=z0Rwoz6PduM&list=PLX2SHiKfualEyD05J9JsklEq1JFGbG6qJ&index=3
dear sir how to check range ?
Difference between open and close is divided by either the open and close.
can be their upper shadow in a paper umbrella after qualifying the lower shadow criteria ( this is twice the real body ) ?
A tiny upper shadow is ok, but not anything longer would make that a regular candle right?
Dear Karthik Rangappa sir.
As this module says – During a downtrend, every day the market would open lower compared to the previous day’s close and again closes lower to form a new low.
my question is :
can this happen that the open price in the downtrend is a bit more than the previous day close but the stock closes by forming a new low than the previous day ?
AS i am analyzing CONCOR stock dated 13th april 2022 in the downtrend.
Thank you so much for your support and love.
Of course, it can. Perhaps I should have specified that it is not every day, but as a trend overall, the market makes lower low in a downturn.
sir, what to choose – color does not really matter or blue(in case of hammer) and red(in case of hanging man) are a bit reliable?
Yes, not to worry about it. Just look at the closing and opening of these candels.
How to short a stock of it\’s not for intraday? Like if you\’re a swing trader.
YOu can short via Futures, Arnav.
What is difference between hanging man and shooting star?
The hanging man has a lower shadow and a real body at the top. The shooting star has a long upper shadow and a real body at the bottom.
sir,
your explanation for not replying much on hanging could be applied also to hammer, if bulls were so effective than why did the price closed on low…right?
Not really. If you look at it in the larger context, a hammer appears in a down trend and prices pick off from a low price. Which goes well with the bullish narrative. But in a hanging man, the bulls still do manage some control (because price retrace back) hence not as convincing as a hammer.
Dear Sir,
Module Technical Analysis
Chapter Single Candlestick patterns (Part 3)
In the chart of Hanging Man example in 7.3 section s there is red candle formed which is circled but In OHLC details Open<Close . But it happens in bullish candle but in chart there is red candle formed. let me correct if i am wrong .
In the chart above, BPCL Limited has formed a hanging man at 593. The OHLC details are –
Open = 592, High = 593.75, Low = 587, Close = 593.
Abdul, the color of the hanging man or hammer does not matter. What really matters is the price action.
No guarantee for anything but only probability & capability of teaching
Sorry, dint get that. Can you eloborate?
This is by far the best tutorial. 🙂 Thanks @Karthik Sir
Happy learning 🙂
Thanks for the prompt reply and guidance.
Happy learning 🙂
Pl read \”doji) . Doji because open and close are almost equal. Or we shall call it a hammer?
Its good to consider it as doji 🙂
On May 13th, I bought M&M at 202. On 23rd,a long green candle (Marubozu) appeared confirming my move.The very next day, shooting star appears followed by a long bearish candle. But I did not sell the stock,for the stop loss(low of the bullish morubozu) did not breach. Today a diji appears.
Please comment on my trade.
You hold the trade till SL is intact, AShutosh. Sell it when your target is close by. No point in doing anything else.
Okay, sorry but i have another doubt, in the last chart, the stoploss happened after few candles… but the price did go down a bit, they could have bought back the shares and made profit, why didnt they do that?it wouldnt have hit the stoploss if they didn\’t wait that much
But whats the cue basis you would buy?
im really confused about the last 2 charts, can you explain? especially the last chart. amazing content btw
Hey, loving the content
just had a doubt about the last chart, is that a paper umbrella right next to the shooting star? if that happens what are we supposed to do?
also, the stoploss has been triggered in the last chart after a few trading sessions, right?
Yes, that\’s right. So it really depends on what you are acting upon. Is it the hanging man or the shooting star, basis that you need to set your SL?
how to put a stoploss at the low of the hammer when we are trading in options?(like how to decide how much points below the actually buying premium price should i put my stoploss )is there any formula to convert the low of the hammer into option premium price?
So, you keep the SL basis of the movement on spot. For example, when the spot breaks the low of the hammer, you square off the position irrespective of how the option is positioned.
So,what we can say is in case of Paper umbrella and shooting star there is a strong chance of trend reversal where as there is a minor chance that market can stay flat or further go down in case of hammer.Is that a right?
There is a possibility and you need to be prepared for that. The extent of the move happening (probability) depends on many other factors. Do keep the checklist in mind.
Good afternoon sir, Sir can I learn fundamental analysis directly because I want to invest for 4-6 years rather than trading? Please give your suggestion about this.. Should I stay here and learn full technical analysis then move to fundamental analysis or I can jump directly to fundamental analysis directly from this point ? And if you think any of the chapter of technical analysis are important which will help me in my fundamental analysis then also please kindly tell…
You can skip directly to Fundamentals and start learning FA rick. You dont really need to learn TA.
Just like in the case of spinning top and Doji after identification of the pattern we can speculate that either the trend will be continued or a trend Reversal will happen.
Similarly in case of Paper umbrella and shooting star once we identify a particular pattern chances are a trend reversal could happen,However a particular trend may continue or the market would remain flat.Right?
Guide for the same
Thanks in advance!!
Paras, paper umbrellas are decisive, unlike dojis and spinning tops.
Hi Karthik, Thanks for the amazing work, just wanted to know how the risk averse trader will ensure the next day is a red candle day before the close of the day(as is written in the section of \”The Hanging Man\” on how to enter into a short position). Thanks in advance.
Thanks Shubham.
You can look at the price around 3:20 and make a guess on how the stock will close for the day, given that the market won\’t change much in the last 10 minutes.
What is basic different between hanging man and shouting star both have bearish pattern if both bearish why need both Why not stick to one of both bearish
If you think through this from the price action perspective (which I\’ve explained in the chapter), these are two different patterns.
Thnx sir , for quick reply and for the helping attitude in every doubt related to the stock Market. God bless u sir .
Happy learning!
Thnx a lot sir, nicely explained, sir another question is how can I calculate the real body (hammer) range of 1% -2% plz tell me the formula.
Take the difference between the open and close and divide by either open or close, you will get the range.
Sir, thankyou for your efforts. The way you have explained these theories, specially adding your experience, makes it really easy to grasp.
Happy reading!
Is a Shooting star pattern after a downtrend valid? As in, the stock has been in the bearish trend for a while and the latest candle formed is of a Shooting star pattern with a blue real body and a long upper shadow. Does this mean the stock can become bullish in the forthcoming days?
Nope, the shooting star in a bearish trend indicates more bearishness.
Sir
Perfect hammer is T
1. But what happen it has ( wick=1% body=2% shadow=4%) & (wick=2% body=2% shadow=4%) both are perfect hammer
2. What happen when 3,4 hammer candlestick are consolidating in bottom
??
3. What happened if it\’s taking support on 50&200ema
4. Which will more stronger wick support & body support (50&200 ema)
That\’s all
1) I\’d consider both these as spinning tops
2) I\’d still look at it as a bullish play
3) Even better for long calls
4) 200 if you as me 🙂
sir, i am reading these patterns in 2022. is it still practically same rn?
Yes Sir. As long as human reactions remain the same the patterns will also remain the same.
Hlo, sir u told in case of hammer candle stick pattern \”Open and close should be almost the same (within 1-2% range)\” sir if u plz tell me the math behind this, that must be very helpful for me to understand. Nd this range is same for the any other paper umbrella?
Pari, the logic behind the hammer is that the market made an attempt to go down (bears in control), but that dint hold, and the stock retraced back to the top. But neither the bulls took over since the stock kind of dint make a high point. So its a struggle between bulls and bears and hence the open = close. But the point is that bulls did make an attempt to lift the stock price from the bottom albeit it dint sustain. The idea is that the bulls will make similar attempts in the subsequent days, therefore hammer is a bullish sigh.
Hey karthik. Is it necessary that the shooting star pattern is relevant only if the prior trend is up trend. Today on the nifty 50 chart I sense a shooting star pattern is emerging (long Upper shadow & red real body). However, the market has been bearish since many days. Does this mean that there is a high possibility that the market will continue to be bearish for coming sessions. Thanks 🙂
Its good if the chart showcases the necessary prior trend, Raj. But in this particular case, a shooting star after the decline in market only emphasis the bearishness in the market…although its not a recognised candlestick pattern.
What is the name of that candle in which there is big real body upper side without shadow and having a medium size shadow at the end . Which is shown in 3rd chart of hammer
Just a regular large candle 🙂
In shooting star, How risk taker can initiate the trade(I am expecting trade mean intra-day) on the same day, at day would be ended in 10 min after 3:20.
My other question is \”Wait until target and stoploss triggered\” but I can\’t see where we are defining what should be the target
Thanks
Manish, intraday may not be possible, you will have to initiate an overnight position. For target and SL, please check the chapter on Support and Resistance.
Thank you for the clarification. I am quite new to all these topics and terminologies. Had to go through your other modules and your comment is very clear to me now. Brilliant work!!!
Glad you liked it, Kumaresan. Happy learning 🙂
Thank you Karthik. This stop loss is however applicable only for people who use shorting to gain profits. Because if someone uses rule 1 which says sell weakness and just proceed to sell at the closing price they wont be needing any stop loss. Is this the right understanding?
Thats a different strategy where the position is closed by EOD. What if you short futures and carry it forward to next day?
Why stop loss for hangman/shooting star or any single bearish pattern has to be set up at high of the session.
The high point indicates the maximum price at which the stock reversed directions on a short-term basis. Hence we keep this as the SL.
Thanks Karthik for sharing such a wonderful Knowledge material. I have few questions
1. If I want to do Intraday , How can I buy(or short) at 3:20 pm ? Most Intraday trades are to be executed by 9:30 am – 10:30 am
2. For Intraday , 15 min time frame candlestick to be used ? For trading (swing) , we should use 1 day candlestick ?
1) Thats right. The trades at 3:20PM or towards the close of the market is for overnight positions with say futures or options. YOu can even do BTST trades in the situation demands BTST
2) Yes, that works
If we look at PRESTIGE on daily timeframe, we could see 2 clear shooting-stars in last 4 days. Lets consider, D1, D2,D3,D4 (todays i.e. 17-01-22 trading session candle). Now check candle for D1 i.e. 12-01-22, even after the candle next day not crossing the high of shooting star formed on 12-01-22 still the stock remained in an UPTREND. Now, isn\’t that contradicting what was explained?
Shashank, these candlestick patterns only increases the odds of setting up a profitable trade. There is no guarantee as such.
Great work Kartik… I have a question please… There is no mention here about an inverted hammer ??? Is there a specific that it has been left out or has it been missed? Would like to know your opinion about inverted hammer
That\’s the shooting star, Prakash. We have discussed that I guess.
Hellow karthik sir Thankyou so much for teaching in simplest way 😇 I’m so greatful, zerodha doing really well
So my question is – if i find any recognisable candlestick pattrn like hammer on support zone and its wick’s low is SL in 1D tmf
So during the intraday if price toches the hammer’s low, like in between 11-12pm thn is it consider as SL hit ?
Or I should wait for 1D candle close to check if there’s really sl hit or not ? Coz I took trade in 1D tmf ??
If it\’s an intraday, then you may want to pay attention to it, else you can consider waiting till the end of the day. Of course, depends on your risk appetite.
What should be our target? I got where to place the stop loss, but where to place our target?
You can use the concept of Support and Resistance to place both target and SL.
Sir, how many years taking if i become a profitable trader..can you explain elaborately..
Depends on the quality time you are willing to spend in the market. Unfortunately, there is no straightforward answer to this.
Hello Karthik sir. Can paper umbrella appear at the middle of any uptrend or downtrend as I see many similar looking paper candle in the above images.
Yes, it can. In fact, it can appear anywhere in the chart.
About paper umbrella, Open and close should be almost the same (within 1-2% range) so what\’s the exact formula for calculating that 1-2% range?. And what is the max accepted length of upper shadow?
Jay, take the difference between open and close, divide that by either open or close. That will give you a % range. The upper shadow should be less than 5 – 10% of the range. Lower the better.
Hi Guru,
Appreciating your effort first of all;
What would happen when shooting star appear on down trend?
Thanks Shihab. In case of a shooting star in a down trend, the bearishness is more pronounced.
Thank you so much
Happy learning!
Hi Karthik,
I have two questions.
1. When you say a risk averse waits for the next candle to be formed. Does it mean a risk averse waits till the next day end and places an order end of the next day of a candle forming..?
2. In case of me being a risk taker and i enter a trade (considering the BPCL example above in Hanging man example) as per theoretical SL i will end of hitting stop loss and my trade ends. The reality is that after a SL being hit the trend actually is achieved and the market has fallen down. Do i make an entry as a risk averse again at the end of the in this case..?
Thank you so much for patiently answering all the questions from each and every chapter. Its so nice of you. Thanks in Advance for answering this question as well
1) Thats right
2) You need to be clear on your stance. Risk taker or risk averse. Wait for EOD candle for SL triggers or intraday. These are things you should be clear about before taking the trade.
Hi Karthik,
What happens if shooting star kindof formation happens after bearish trendat the end of vally… E. G. See BataIndia chart above and the last few blue candles
After a spinning top red candle it has 2 shooting star kind ofhigh upper shadow and thin real body candles in blue and after that upword rally has started…. Have seen this in some other charts as well… Is there a single candle pattern of this kind?
While it is not a specific pattern, it conveys more bearishness from a price action perspective.
Hi,
In shooting star i have some questions
To confirm this, the trader has to validate: If the current market price is more or less equal to the low price
What does this actually mean. Can someone elaborate?
If the current price is more or less equal to the low point, then it means to say that one of the conditions for bearish mrubuzo is satisfied (other being high equal to open). If both are true, then we have a bearish marubuzo.
Thank you for your reply sir. I researched more about this.
What you recommend for beginners sir…
1.Trading basis stoploss or 2.Closing basis stoploss?
I\’d suggest closing basis, Yathish, unless a move like IRCTC happens.
Sir, here is my swing trade. link – https://www.tradingview.com/x/OSZuDQYI
(took only 1 Quatity for learning purpose, Entry is not proper i think)
stock opened below my stoploss and breached the stoploss and wen\’t up.
so my trade ended in loss.
—My question—
I heard about \”CLOSING BASIS STOPLOSS\” here in comment section.
what is that and how it\’s different from normal stoploss?
A stock can swing during the day across many different prices (thus forming high and low), but what matters is the closing price of the stock. Any stop loss that is on the basis of stop loss is the closing basis stoploss.
sry sir the above is for doji and spinning tops realeted not for this model candlestik patterns .
Got it, but please do check my previous reply for a generic SL technique. Good luck.
thank you so much for such easy explanation of such complicated topic of TA.
so my question is how to set stoploss for these two candlestick pattern
Nandesh, as explained, SL is kind of baked into the candlestick pattern itself. Usually, the low of the pattern (for a long position) and the high of the pattern (for a short position) act as the stop loss for the trade.
How would you make a target based on the single candlestick patterns?
Target is something candlestick patterns don\’t help you with. You can use concepts of support and resistance to identify targets.
Hi Karthik,
It is said that hammer is more reliable then hanging man, but i don\’t understand why hammer is more preferable then hanging man can you explain this. In hammer case also if bulls were successfull then market would be closed even more high.
In hanging man, the fact that the stock price cracks and bounces to close near the high puts some credibility to bulls. Hence traders prefer the hammer over the hanging man.
Hi Sir,
I have a doubt on the Hammer formation confirmation condition
In this quoted sentence \”Open and close should be almost the same (within 1-2% range)\” , How do we calculate the range?
Take the difference between open and close, and divide it over open, you will get the % range.
Above charts are depicted on which time frame ?
It\’s a mix of EOD and intraday charts.
Sir, I don\’t understand the concept of RANGE here- Open and close should be almost the same (within 1-2% range)
It means that the open and close price should be around the same price.
Hi Kartik,
Bajaj Finance today – O = 7525, H = 7674.5, L = 7483.35, C = 7519.6. Can this be considered as somewhat of a shooting star pattern? It has also rallied from around 6200 levels.
Yes, it can be.
Hi Kartik,
I am bit confused about STOPLOSS in the shooting star. Please refer Fig No 2 of Shooting Star. You quoted that OHLC data on the shooting star is; open = 1426, high = 1453, low = 1410, close = 1417. … and further you quoted that the STOPPLOSS for the OHLC data should be the HIGH of the pattern ie. 1453. In this case a trade will never get executed if downtrend continues… please clarify. Thanks
Thats good right? As a short seller, you want the stock to fall lower and lower.
Hi Karthik
If there are no news or events how effective is trading looking at candlesticks only.
Its best to trade when there are no events. In that way, the candlestick represents only price action and does not include any other distractions 🙂
HI 👋 ,
Even after the formation of the hammer does the market fall???
Candlestick patterns is just an indicator of what is likely to happen, there are no guarantee that it will happen.
W.r.t the Hanging man candle stick. My question is that doesn’t the hanging man show low price rejection (due to long lower shadow and hence the probable continuation of the upward trend? Wouldn’t a shooting star at the end of the upwards trend be more indicative of a following downward trend? Please clear my confusion.
Thats right, I personally think the shooting star is a better indicator or bearishness. Its just that its not classified as a bearish candle. But that does not really matter in my opinion, what matters is the price action.
sir shadow to real body ratio for bearish candle sir.
Hmm, no emphasis on the real body to shadow ratio.
What if a shooting star is observed on a downtrend?
Emphasis is more on the berish side.
Namaskar Karthik,
1. I was bit curious to know that shooting star is the bearish pattern. But nothing has been discussed in case such pattern is made at the bottom of the downtrend. There is no such kind of pattern?
2. What about if the said pattern is made in the middle of the trend?
3. What about if hammer/hanging man appears in the middle of the trend?
1) There is no specific pattern as such
2) Thats ok, we assume a trend reversal in place and trade accordingly
3) Same as above
Hi Karthik!
How to set target for the trade taken based on these candlestick patterns?
I\’ve laid out the trade process in the chapter itself, Ankit. Do check the same.
Isn\’t there any bullish pattern for Inverted Hammer or Shooting Start Pattern?
Hammar pattern is.
Hi,
In the hanging man and shooting star, we are supposed to see the stocks, right? And we keep the SL at the high but doesn\’t that mean if still have stocks the value of those will keep on decreasing as our SL is at high and that\’s a loss.
Please can you clarify, Thanks.
Sorry, Akash. I dint quite get your query. Can you share more context? Thanks.
How to calculate Shotting Star\’s body and shadow\’s length?
High – Open = Length of the upper shadow.
When using single candlesticks for trading should we see how the candlesticks formed for the entire day yesterday and today and then decide how to use the various candlestick formations. Or, can we do the same during intraday trading say watching a 15min candlestick formations?
Depends on what you intend to do. Intraday or swing trade.
Hi Karthik,
So Can I say, if I had to choose between the hanging man and the the shooting star, The shooting star would give more confidence for uptrend reversal.
You do take the overall market condition and then look at both these patterns. The point is its very hard to say which pattern works for which stock. Cant really classify one pattern is better than the other.
Hi Karthik
The low of the hammer act as a stop loss. Just to clarify, low of the body or low of the shadow?
Low of the shadow.
sir I couldn\’t understand clearly the risk taker and risk averse ….please explain me clearly I could not understand please explain me simply sir.
1. Risk taker enter into the trade when the pattern form in the day
2.risk averse enter into the trade after conforms the day is strong or weak and he will wait for same pattern to entered in second day. is it correct sir ?
1) Risk takes does not wait for confirmation
2) Risk-averse waits for a confirmation
What if the shooting star forms in a bearish trend (downward market)?
Then you should prepare for a bearish outcome.
I the first hammer chart, from left to right- the 12th 13th and 20th candles are paper umbrella candles, although 12th 13th candle bring some sidelines to market but 20th candle leads to uptrend in an uptrend, so should i consider it as hammer??
if yes, i can consider it as hammer then how do i figure out that its a hammer or hanging man when such paper candles form again??
Yes, but make sure it satisfies the 2:1 criteria i.e. the wick should be at least 2 times the real body and also ensure the trend is down. The trend decides if the candle is hammer or hanging man.
Hi Sir,
In your statement \”In Hanging man, if the bears were indeed influential during the day, why did the price go up after making a low?
Sir
prices going up means
Sir,
please tell, which part you are talking about in hanging man ?
I didn\’t get you
The overall prices Franklin. The prices of the stock.
if low of the hammer is SL the what is the target price?
You can use the concept of Support and resistance to identify targets.
So a shooting star is better than a hanging man to spot bearing signals in an uptrend? Is that correct?
Not really, both have decent probabilities.
Is there any other type of shooting star, like in case of paper umbrella, we have 2 complimentary types. I think we can have a shooting star appearing after a downtrend, signifying bull pressure! Is there a type for that or does it even make sense?
Not that I know off, Tanmay. The point of candlesticks to not really be aware of all the different patterns, you just need to understand the price action behind every candle, that\’s good enough.
Sir,
When we find a shooting star we need to look for shorting opportunities. But shorting is an intraday aspect. If we try to short at the end of the day by looking at the CMP/ close price, how would the trade get executed?? What kind of chart set up/timeframe we have to use for viewing the candle??
YOu can short in the futures and carry forward the position.
Hello!
A bit confused. This is the 2nd example of the hanging man picture.
It shows a red hanging man. Shouldn\’t the close be lower (lesser) than the open?
In the chart above, BPCL Limited has formed a hanging man at 593. The OHLC details are –
Open = 592, High = 593.75, Low = 587, Close = 593.
Open and close should be somewhat round the same place. There is no need for open to be higher or lower than close, as long as both the prices are near each other, its fine.
Okay Sir. Thank you so much. ☺️
Good luck!
Good luck, Ashish!
Hii Karthik Sir
It seemed that Nifty 50 index formed a shooting star pattern (with its high nearing the stoploss resistance line) on May 19th. Today, on May 21st , however, the markets are forming a bullish marubuzo. Can you please explain the phenomena? Thank you
These patterns are only indicative of the event likely to happen. These are not guaranteed. For example, market falling post a shooting star is indicative, not definitive. If you had taken a position, then you should hold to the SL and trade according to the plan.
hi, The risk-averse takes the short sell position on the 3rd day ( after confirming the red candle on the 2nd day) but for short selling, we will have to square off our position on the same day correct? then how do I take this short position?
time frame: 1D
day 1: formation of the shooting star
day 2: red candle – The risk-averse confirms
day 3: The risk-averse take a short position if via Intra trading he will have close the trade on the same day but the next few session will be in bears market
so how can I hold the short trade for more than a day? i hope I make sense
Sagar, one can always short using the futures instrument and carry forward the position.
for eg: open:200 close: 190 high: 205 and low 185.
I\’ve entered at 190 which resulted bearish trend. My question is what would be my sl. As you said high value is my sl. for suppose if the trend is keep on moving down with out having any scope to reach high value! what would be my position?
You can keep 190 or a price slightly above 190 as a SL.
if shooting star appeares at the bottom of the downtrend rally then …what will happen, should i conclude same as hammer pattern
You need to think about it from the price action perspective. The pattern just emphasises more bearishness.
Hello Sir,
Thanks for the prompt response. Appreciate it.
Good luck, Medha.
On which time frame does these candle sticks efficiently works? Is 5min TF is ok?!
I\’d suggest on the EOD chart.
Hello Sir,
Thanks a lot for your efforts. You have explained many difficult concepts in a simplified way throughout the various modules of zerodha varsity.
My question regarding this module is – what is the difference between implications of Hanging Man and shooting star, since both these candles form after an uptrend and indicate bearish pattern.
Thanks again
Thanks, Medha.
Both indicate bearishness. But personally I feel shooting star is a better patter to trade compared to the hanging man.
I am still confused a bit about short trade. Can you explain here about the process based on any candlestick pattern? I am aware that short trade is selling of the share even before you can own it. But how does it work here with respect to patterns?
Rahul, I\’ve explained it in the chapter itself. Can you please go through these again?
Hello…
I understand that you answered, \”you can short the futures anytime and carry forward the positions overnight.\” But is that applicable to Equity at all? Or We can Short after 3:20 PM since the auto-squaring has already started and we would not be impacted?
Shorting the Stocks for the next day should be called something like Sell Today Buy Tomorrow, I guess. But is that even allowed in the Indian market or anywhere in the world ??
Thanks. 🙂
Thats right, you can only short futures for overnight, cant short stocks and hold the short overnight. Thats not possible in the Indian markets.
for how much time period should we consider these single candlestick patterns?
Depends on your trading horizon.
Sir
If stock is in uptrend,ok then Marubuozu form and next candle is hanging man candle.
So what decision we take sir
If you are long on Marubuzo, then wait for the SL is triggered or your profit is hit.
A hammer consists of a small real body at the upper end of the trading range with a long lower shadow.
Why is it ?
(The longer, the lower shadow, the more bullish the pattern.)
The longer the shadow —> indicates that the bulls put in considerable efforts to bring the prices back. Hence more bullish.
I have a basic question – how do I actually check the price quotes of the candle on the chart?
Hover over the candle and you can see the prices.
Sir, What is the difference between Hanging man and shooting star ?
Both indicate bearishness.
In Hammer, the longer the lower shadow the more bullish the pattern.
How it\’s possible ?
The longer the shadow you mean?
while anlysing which closing price shoudl we use. should it be day close or pewviuos close.
measn if am anlysing five days chart , so shoild i consider today\’s close price or previus day close
Today\’s close.
1) in the last chart where the curve line(black one to point out uptrend), There i can observe one \”Hammer candle \” can we consider it or not ?
2) In this topic you clearly talk about Stop Loss. But what about Target Price ? . What should be a target price for all 3 candlestick pattern?
1) Hmm not sure if it matches the wick matches the 2x the body ratio
2) Tgt can be set by looking at resistance. I\’d suggest you look at that chapter on S&R
Sir,
in Shooting star
The longer the upper wick the more bearish the pattern.
Why is it ? Please elaborate with example.
It is just that the higher prices were not sustained and it cooled off, indicating bearishness.
Actually I needed to ask that in the following link are the arrow 2 and 3 are showing shooting star pattern
Arrow 2 – O = 1373.3, H = 1391.7, L = 1370.05, C = 1374.85
Arrow 3 – O = 1386.05, H = 1406, L = 1380.5, C= 1384
https://share.chartiq.com/KNIFEV3YI5.png
Karthik Sir still replying to comments even after zerodha becoming so big
Thanks for your knowledge, it\’s helping me a lot
This is what I love doing, and will continue doing for as long as I can 🙂
Happy reading!
If I\’m an investor who is looking for an investment of 3-4 days, can I use hammer to make my investment decisions?
3-4 days is not considered an investment, it is more of a trade. Yes, you can use a hammer.
If I\’m a risk averse trader and hammer is formed so till what price difference I\’m suggested to buy?
You need to target buying sometime around the close of the next day after the hammer is formed.
Hi, The hammer and shooting star seem analogous candlesticks, i.e, indicating bullishness (and bearishness) at the end of a bear run( and bull run) respectively. However, is there a valid pattern where the shooting star appears at the bottom of a down-trend? Can you provide insights as to it is not a relevant pattern?
I\’m asking this as you discussed two cases for the paper umbrella and only one for shooting star…
Although not an official pattern (hence not discussed), a shooting star at the bottom of the downtrend indicates more bearishness from my experience.
What if shooting star candle form at bottom in bearish trend?
It is not a defined trend.
In the last example, how has the stop loss been breached when it is placed as the high of the shooting star at the end of the day for the risk-taker? The high of the bullish shooting star is higher than the OHLC of the next day\’s red candle.
PLease do check the comments, I\’ve explained this.
But there are thousands of companies and for which how we will know at which day and which company the hammer can occur?
Hence the need to develop a quick tracking universe. Start with Nifty 50.
Karthik- A big kudos and thanks for the way you explain everything in detail, using hammer candlestick or finding out it in a previous day chart or at a particular time which can be used for giving the way chart along in upwards……..Zerodha will have data, using data analytics or anything else, can the hammer candlestick retraced?
Karthik – First a big kudos to you and the way you explain the things, Using hammer candlestick for the previous day in which company chart it is present and for which it can be used to go along the chart……….Zerodha will have the data, maybe using data science or anything, the hammer candlestick can be retraced?
Thanks Neeraj. You just have to look at the charts for this right? YOu can easily identify the hammer.
1. What do you call the occurrence of Paper Umbrella when the price movement of the stock stays flat?
2. Am jut getting this validated- Greater the time frame, Reliable results? is this correct?
3. What will be maximum time frame of all these trades? Eg: How many Weeks ? Months? or days?
1) It has no significance as such
2) Generally true
3) Depends on your trading style
can we use this in crypto trading?? If yes then what time frame should we use?
I guess so, although I\’ve not tried. Check this – https://www.streak.tech/
In hanging man the BPCL the OHCL are given as Open = 592, High = 593.75, Low = 587, Close = 593 so if it closes above the open price so how it is shown a red candle in the chart that forms the hanging man pattern that is encircled. Please can someone explain me this i m confused.
That\’s a good spot 🙂
I suppose the Open and close numbers are interchanged. By the way, the colour of the hanging man does not really matter.
In section 7.3 (second example) , there is a bearish hanging man , for which data points are wrong .
Data points are — O=592 H=593.75 L=587 C=593
Because C>O , it should be a bullish candle , but it is a bearish one as pointed out in the diagram.
The colour of the candle does not really matter for a hanging man.
Karthik, I was thinking, more the traders, better the market would be😃. But too less isn\’t good either, correct?
Yes, that is because of lack of liquidity.
Karthik, thanks for the previous reply. What is the safe strength of traders if I want to invest? Lesser traders shows overvalued or undervalued price, so what should be the minimum number of traders ?
Thanks for your service
While there is no straightforward answer to that, I think lesser the better works 🙂
Thanks for the answer about the hammer, sir😊.
Good luck!
Sir, I am sorry to intervene between u and Mr. Arun but in a doji there r same number of buyers n sellers?
The number of buyers and sellers may vary, but what\’s important is the fact that the markets did not move and remained at the same price range.
Karthik ji, even a small hammer at the down trend is convincing for a risk taker? I would personally prefer a medium sized hammer. Your thought?
Yeah, regular-sized one 🙂
Karthik, in a Doji candle both buyers n sellers r equally fighting so can I say there r both equal buyers n sellers?
Yup, same is the case with spinning top.
Yes if buyers are paying to higher and higher amounts the length of the candle will certainly increase. But the thing what I want to know will it make a difference if 100 buyers and 10 buyers in different scenarios buy higher n higher prices n increase the length of the candle differently bcz of the differenct strengths(100 vs 10)of the buyers?
The number of traders do not matter. Quantity traded and the price at which it got traded matters.
Hello,
Karthik, you said the wick can derive it\’s length even from a single trade, now I have a doubt. Suppose there are only ten traders in a session n if there is more buying pressure, will the blue candle be big or not so big since there are not many traders? I am starting to assume the buying or selling pressure doesn\’t affect the size of the candle owing to the strength of the traders? Please be elaborative.
Thank you so much.
The length as such depends on the price the buyers are willing to pay. If all trades happen at around the same price, then the candle\’s length will remain the same. However, if the buyers are willing to pay the higher and higher amount then the length of the candle will increase, leading to a bigger sized candle.
So you only focus on the body if it\’s big? I am sure you cant rely only on the body if it\’s on top or bottom of the candle, right?
Besides karthik ji, from what I can deduce from your comment, even a single big trade can bring about a big body Or it\’s only applies to the wicks?
The body is formed by connecting the opening and closing price. Remember, both these prices are monitored closely, there is a pre-open session and closing avg taken, hence I\’d give the body more importance over wicks.
Hey karthik,
If a green hammer candle indicates the price could hike in the coming candles, what does a red hammer candle indicate?
Thank you.
In a hammer formation, the colour of the candle holds little significance.
Karthik , suppose a candle\’e 50℅ is covered with green body n above 50℅ is a wick despite the positive growth I don\’t think this is a good entry point bcz the above wick represents selling pressure or price reduction so it\’s 50-50, is my assessment correct? I mean the next candle pattern could be anything.
Thank you.
The wick can derive its length due to 1 single trade also, which could be a freak trade. So I usually don\’t give much importance to the wick.
What is the difference between Hanging man and Shooting Star as both having a prior trend as a bullish??
The placement of the real body with respect to the shadows is different. In Hanging man, the real body is closer to the high, and in shooting star its closer to the low of the day.
Hanging Man BPCL example – how is it profitable for risk taking as his trade is executed at 593 and if the candle is formed around end of day, next day the stop loss would be triggered? Kindly elaborate the point I may be missing
SL is not triggered, right?
1. Hammer and hanging man candle pattern trade is applicable for all time frames.if yes, can you explain entry and exit criteria.
2. What happen shooting start candle formation at down trend?
3. Along with candle stick pattern do we need consider any other factors before placing trade? Or just candle stick pattern is enough to place trade?
1) Yes, the same criteria holds good.
2) Indicates more bearishness
3) Yes, please do look at the checklist at the end of the module (last chapter)
Can this be applied for trades within the same day instead of over night delivery ?
MIS trades.
Yup, you can.
Hi Mr.Karthik,
kindly try to arrange latest comments should comes top, it will help us to read latest comment easily.
Noted, passing the feedback to the team.
Here is a link for a daily time frame chart of Jubilant Foodworks:
https://drive.google.com/file/d/1eguxRJLkATU_ic5VlIx0kyN2QiSVw77l/view?usp=sharing
Look at the last red candle, which is a hammer. This hammer has not occurred at exactly the S1 level but a little over S1. Would it be advisable to take the trade here?
Thanks,
Kiran Hegde
Yup, you probably can.
Hi sir,
If a shooting star with a green real body is formed at a downtrend, can we consider it is as a sign of bullish trend reversal??
Trend reversal. The size of the real body won\’t matter.
Okay, 7th chapter is over and I am enjoying them. I am feeling like warren buffet though he\’s a fundamental investor lol. Thanks, Zerodha and Karthik sir.
Happy reading, hope you turn out the next Indian Warren Buffet 🙂
Hey karthik, please tell me
What does that mean by \’look for prior trend- if you look for bullish pattern, prior trend should be bearish and vice-versa.\’
It means that the trend should be opposite to the pattern you are looking for. For example, if you are evaluating a bullish pattern, then the prior trend should be bearish and vice versa.
Open and close should be almost the same (within 1-2% range)
can anyone pls give me an example using numbers ? 1-2 pct of what exactly?
1 or 2% of the opening price.
Hello Karthik,
Thanks for answering my questions so far.
So the range of the real body does not really matter as long as the lower shadow is twice the range of the real body? Is that what you are saying?
1)What if the range of the real body is 0.5 and the lower shadow is 1? Would that still be considered a hammer?
2)Going by the definition of the hammer, wouldn\’t a lot of Doji or spinning tops also get classified a hammer?
Remember Doji/spinning tops have a real small body and from what i have seen on the charts, most of the Doji/spinning tops will have a lower shadow which is atleast 2x the range of the body.
Kindly clarify
Regards,
Kiran Hegde
1) Range should be 2x. So yes, this would. Do keep the prior trend in perspective
2) Nope, hammer needs to have a real body. Doji\’s don\’t have a real body. Spinning tops have an upper shadow.
If the whole idea is to follow smart money . why technical analysis then ? Just follow the smart money ?? Please advise
The technique to follow is via TA 🙂
Hello Karthik,
I am reposting my question in response to your previous comment.
Link to the chart :https://drive.google.com/file/d/1bfaoB9RT3B-EcftVF4bDw2U99jAKbqSf/view?usp=sharing
You have stated in one of your previous responses that the highlighted part is a hammer. I want to piont out that the body of the hammer is just 0.4% (Open – close)/Open. As per your explanation in this chapter, for a candle to be considered a hammer, the body should be within the 1-2% range.
So my question is, can we consider this candle a hammer even though the real body is just 0.4 %?
Thanks,
Kiran Hegde
The key point to note is that the ratio of body to shadow should be at least 2x. Meaning, if the range is 2, the shadow should be 4.
Hello Karthik,
Could you please clarify on my previous question(The question above Vekatesh\’s question)?
Hope i am not bothering you a lot.
Regards,
Kiran Hegde
Ah, can you please repost the same?
Can we use hammer in weekly charts?
Yes, you can.
Hello Karthik,
Thanks for responding back.
Your answers are kind of contradictory.
Yes, but would have been more satisfying to see it right at the bottom of the downtrend. – This response gives me an impression that the highlighted part is a hammer.
1) Kind of, else it won’t be a paper umbrella – This gives me an impression that the highlighted part is not a hammer, as the real body is just 0.4 %.
Which among the above two responses of yours is correct?
Please clarify if i have misunderstood something.
Regards,
Kiran Hegde
Hello Karthik,
In the chart at:https://drive.google.com/file/d/1bfaoB9RT3B-EcftVF4bDw2U99jAKbqSf/view?usp=sharing
Can the highlighted candle be considered a bullish hammer?
1)The body of the hammer is just 0.4% (Open – close)/Open.
As per your explanation in this chapter, for a candle to be considered a hammer, the body should be within the 1-2% range.
Is this a strict requirement?
2)Assuming that a candle has just a lower shadow and the open on the candle is very close its close.
How do i distinguish between a Doji and a hammer?
Regards,
Kiran Hegde
Yes, but would have been more satisfying to see it right at the bottom of the downtrend.
1) Kind of, else it won\’t be a paper umbrella
2) Ensure the real body is small and the lower shadow is at least 2 time the real body.
Karthik ji you are very good teacher.
My question.
1) Is without knowing graph or any pattern can we invest (not trade) for long term (2- 20 years), because every one is looking at graph then whose probability can be right. ?
You don\’t need to know about patterns to invest for long term, you only need to know the business fundamentals.
I found this statement a bit contradictory, \”The risk-taker initiates the trade the same day after ensuring that the day has formed a shooting star\”. If I would like to do shorting then it can be done only in intraday.
You can short using futures, which you can carry forward overnight.
When do you say placing the trade on the same day , does that mean placing the trade in between 3:15 to 3:30 or do you mean placing the trade on the very next day at the opening of the market?
Thank you very much for your valuable knowledge
The same day implies placing orders around the close of the day. YOu can initiate the trade the next day as well. Good luck!
Which is the best timeframe for seeing candlestick for day trading and for short team investment ?
I\’d prefer the EOD charts.
Hi Kartik,
I don\’t see any chart here ?. which chart you and ankit is referring ? Kindly answer below query too.
(1) How to add picture in our comment ?
(2) I am not getting any notification when you reply my answer so each time i have to do ctr + F and search.
I guess that image was uploaded on G Drive.
What is the key difference(other than shape) between the \”The hanging man\” and \”The shooting star\”?
As both:
1)have a bullish prior trend,
2)have bearish nature/pattern
3)makes selling pressure
Please answer
The key difference is their appearance on the chart. At the top end of the chart, it is called a shooting star, indicating bearishness. At the bottom end of the chart it is called the hanging man.
What happens if a inverted hammer appears at the bottom instead of at the top?
It emphasizes more bearishness.
Hello @Karthik Rangappa Karthik Rangappa
The varsity mobile app doesn\’t seem to be updated.
Could you please update the app with all the latest content. I generally use the app and don\’t use the website directly.
Helps me to track my progress in app well.
Siddharth, which part of the app are you talking about?
The colour doesn\’t really matter in a paper umbrella pattern right?
Thats right.
Hello Sir,
I am new in trading. Regarding trends sometimes I got confused. Can you please elaborate in details how to accurately identify prior trend?
You need to look at the last few candles and identify the prior trend. I\’ve explained this in the earlier chapters, Devesh.
Continuing with above question-
So when to exit will also be an important factor to book profit, will that be discussed in subsequent chapters? As per read you said targets will be studied later?
Yes, we have discussed this later in this module..in the support and resistance chapter.
Hello Karthik,
Few questions-
1. All these patterns from marabozu to shooting start are applicable on 15 min time frame? If yes, then at least in next 2 sessions (i.e. 30 minutes) we should see the impact of those patterns right?
2. If we can\’t consider 15 min time frame then which is correct timeframe to consider?
1) Yes, these patters can be applied to intraday as well. Yes, next 3-4 candles at least. Do not forget to maintain the SL
2) 10 or 15 minutes is good enough.
Hi, Can we automate trading based on these patterns?
No, complete automation is not allowed for retail. However, you can check this – https://www.streak.tech/
Sir
reading the concepts given here thoroughly and practicing will give me enough knowledge to take trades?
As a lamen, I\’m so confused with all other courses present in the market.
Please guide me through it…
Yes, please do read through this and set up a few paper trades. Place a real trade once you gain some confidence.
Thank you.
Good luck!
I am sorry, could you be more clear? standalone?
What I mean is that the shooting star does not have a bullish peer. Like Bearish engulfing pattern has a bulling engulfing patter. Likewise there is not bullish counter part for shooting star.
Hi,
Why aren\’t there are two cases in The shooting star candlestick pattern unlike paper umbrella pattern (Hammer and The hanging man)?
Amazing content by the way.
Shooting star is a standalone pattern 🙂
Thanks Karthik for prompt reply. However, I am bit confused with answer 1. Why you have given question mark in last ?
Thats because I\’m also not sure 🙂
Once again thank you so much for creating such a useful and easy to understand content and clearing our doubts through responding to our queries. I feel really privileged to associated with Zerodha.
My current queries are :
1. What is plain vanilla chart ?
2. Can we refer to Candlestick screener in ET for EOD patterns ?
3. Regarding backtesting, is it like we can do virtual/paper trading and evaluate progress of any stock ?
1) Is it just a chart without any indicator/moving averages loaded on it?
2) I guess you can, have not used it myself. I\’d suggest you use Kite instead 🙂
3) Thats right
Happy learning!
Thank you Karthik. I understand the closing price is at or around 1417 however the follow-up questions is around time of the trade.
What do we mean by \”Same day\”? I mean is it around closing of the day which is usually 3:15-3:20 pm as i don\’t think anyone can trade after close of the market i.e. \”Same day at closing price which is 1417\”. Sorry trying to learn it :). Thank you.
By same day I mean, the day when the pattern occurs. Ppl trade till 3:30 🙂
Hi Karthik, in the shooting star, the example data points are \”open = 1426, high = 1453, low = 1410, close = 1417\” and the trading style of a risk taker is specified as \”The risk taker will initiate the trade at 1417, basically on the same day the shooting star forms\”
I am curious to know that when the trade has already been closed at 1417, how the trader can initiate the trade on same day at the closing price?
Thanks
Kamal
Kamal, it is at or around 1417.
Hello Karthik,
It has been almost 6 long years and you are still helping new traders/investors to learn by answering thier queries. I am really impressed and inspired. I have read about you and throughout your journey you have achieved great success. The question I want to ask is how do you manage doing it all? Being the VP of Zerodha, managing your own trades & investments and taking out the time for yourself? I will also be very grateful if you could give me some advice or tips from your own experience to be a successful trader & investor, like what all it takes and which path to follow? (I know you already have created Varsity which has really helped me a lot to learn so many things but I am looking for some personal words of enlightment).
Kind Regards,
Mradul
Mradul, this has become a routine for me, I feel the day is incomplete if I don\’t respond to queries here 🙂
Also, I\’ve stopped trading because the company policy does not allow employees to trade 🙂 So my focus is only on work, which includes taking care of Varsity 🙂
Chapter – Shooting star – last chart…
trade is loss for both risk trader and risk averse however wrt shooting star, i think it did not qualify to condition 3 that the previous trend should be bullish, while the long curve is bullish, the previous trend was not bullish (RED) so it was not a perfect shooting star to initiate fresh trade….rather the next candle formed after shooting star is a perfect hanging man and calls for initiating a fresh short position….it worked also before getting into a confusion state shown by Dojis and spinning wheels where the fresh trade should exit as its not clear in such situations…
What is your view?
When evaluating the prior trend, you should look at the last couple of candles and not just the immediate previous candle. This is the reason why I\’ve marked it with the curve.
Hi Karthik, In today\’s ICICI chart a green candle followed by a red hammer is there. Can we say that its prior chart was downward and Can stock is going bullish for a long time.
The prior trend is not convincing, right?
For gauging prior trend, what is the ideal timeframe once should be looking at?
At least 5-8 trading session.
Hi Karthik, Stock chart pattern a doji followed by hammer(PAPER UMBRELLA) prior trend is downtrend. Can we damn surely say the stock is going bullish for long time.
2)Stock chart pattern a doji followed by hanging(PAPER UMBRELLA) prior trend is uptrend.Can we damn surely say the stock is going bearish for long time.
1) Nothing is a surety in markets, they are all just odds to things likely to happen
2) Same as above. No guarantee in markets.
Thank you sir for giving this useful information to us as you said that we should not hold the trade after the stoploss or target is achieved. We know how to set the stoploss but how to set the target? Help me with this issue sir!
Mohit, I\’d suggest you read the chapter on Support and Resistance in this module, that details out few steps to identify both the target and stoploss.
Hi Karthik,
I have recently started with the stock market and your articles are really helpful.
I have completed reading the TA Module and as the market is low I wanted to try them out on EOD candles.
The major issue I\’m facing is unable to identify the trend and quantifying the candles.
1.How many trading sessions should a stock go up or down to call it a trend?
2.Marking the S&R levels is very difficult in the present market, can you provide some examples for marking S&R in the present scenario?
3.what can be allowed upper shadow and lower shadow lengths when compared to the body length of the candle?
4.what should I do when I see a bullish Marubuzo has formed 2 days ago, a green candle a day after that, and the target price is not reached?
1) You need to look at a minimum of 5-8 sessions, for a price decline of at least 8-10% before calling it a downtrend, same way for uptrend where the price increase has to be around 8-10%
2) Where are you finding the difficulty, Nitin. The process is the same irrespective of which market, the market cycle you are looking at.
3) There is no definition for this. The lengths can be anything.
4) Tough call, if the market has not moved much from the closing price, maybe you can still consider a trade.
Hope it helps and thanks for the suggestion.
Good luck, Vinay. Happy reading 🙂
Hi Karthik, I have a problem that whenever I study and understand the patterns it was cool and I am able to understand totally but when I try to pick in the real time charts I was confusing and sometimes I predict the patterns say ex: with some spinning tops and doji after that the trend is going to change but it does not changing like as I predicted and you know I was the new trader trying to put the analysis and patterns what I studied till now in paper trading the patterns doesn\’t seem to workout need some guidance from your side. Any help would be appreciated.
Vinay, firstly stop looking at charts on a real-time basis. Get comfortable with EOD charts, try and apply the principals on EOD charts before you start looking at real-time charts, this makes a huge difference in my opinion.
Hi Karthik, it\’s absolutely exciting to study the patterns and candlesticks. I just have one doubt bugging me. Consider this scenario, I observe a bullish hammer in the chart in the middle of the day and I\’m a risk-taker. So according to the theory, I must wait till the end of the day i.e 3.20 pm to make a move. But at 3.20 pm the market price would have moved much forward compared to the middle day price. So at that time, what is the price that I should be opting to buy the stock? and if suppose the stock changed from the bullish to bearish at the end of the day. Should I still buy it?
Yeshwanth, you should buy only if the candle confirms the trend, else it won\’t be based on price action, it will be based on an arbitrary notion 🙂
Cool, thank you !
Hey,
What is the difference between the shooting star and the hanging man ,apart from its shape?
When we see a market rally and ,either one appears on the chart,both indicate the same thing right ?
Yes, they are essentially the same, especially given the fact that both have small real bodies.
\”My only concern with a hanging man is the fact that if the bears were indeed influential during the day, why did the price go up after making a low? This according to me re establishes the bull’s supremacy in the market.\”
To avoid the above problem, can we tweak the definition of a hanging man and consider it as a candle with the upper tail being two times of its real body and the lower tail being negligible?
This makes more sense intuitively.
Hmm, maybe you can. Just that you need to study how the prices behaved historically under such conditions.
Because, out of 5 trades I execute (as a risk taker) with a 15min time frame, maximum 2 trades follow the candlestick patterns.
This resists me to trade as a risk taker.
Also, I am just 6 months old into trading world.
2 out of 5 is still very good 🙂
Hello Karthik,
Firstly, I want to heartily thank the whole Zerodha team for such essential pen downs.
Also, a special thanks to you for your consistent and quick replies.
In the whole notes when you try explaining the candlesticks you used a day\’s time frame in your statements. My question is, while intraday trading what time frame best suits the trading techniques explained ? In my experience with a 15min time frame intraday trade, SELDOM these techniques work ! How can I correct my technique to book high probability profit trades ?
The good part about candlesticks is that the patterns work across all assets, all time frames. Why do you think it does not hold up on 15min time frame?
This is a script of RSI with EMA from Expert Advisors
Buy script – SET A = RSI (CLOSE, 7)
SET B = RSI (CLOSE, 14)
SET D = EMA (A, 10)
SET E = EMA (B, 10)
CROSSOVER (D,E)
Sell Script – SET A = RSI (CLOSE, 7)
SET B = RSI (CLOSE, 14)
SET D = EMA (A, 10)
SET E = EMA (B, 10)
CROSSOVER (E,D)
My question is – Can we change the EMA A and EMA B from 10, 10 to 9, 21 by editing?
Will the code be correct for backtesting?
Yes, I guess you can. Please give it a try and experiment.
In \”Shooting Star\”section, what does this refer to\” More often than not exiting the trade is the best thing to do when the stoploss triggers.\”\”
It means that a trader should respect the his SL and exit the trade.
Hi sir, in (7.3) Hanging man, 2nd chart
You have mentioned that the trade is profitable for both type of traders. But the candle next to the hanging man, breaches the stop loss and so doesn’t it is loss making trade.
Am I missing anything. 🤔 Kindly explain, Thanks!
Risk-averse would have initiated the trade at the end of the day after ensuring that it is a bearish day.
Hi Karthik,
All the trade setups mentioned in Technical Analysis chapter of Varsity are based on identification of Trend Reversal using candlestick patterns and support/resistance lines (except for Marubuzo pattern trade setup, where we may go along with the ongoing trend).
But can you please shed some light on how (or whether or not) to enter trade setups where a trending stock ( in uptrend or downtrend) crosses a resistance/support level.
For example – Daily candle of an uptrend stock opened below the resistance level and closed above the resistance level, with volume support. (please use this link to see the chart – https://invst.ly/q-om1 )
Now can I enter this setup expecting that this level, which earlier was acting as resistance level, will now act as a support and the stock will go up to the next level resistance level?
If yes, then should i enter the same day or the next day when an entire green candle is formed above the resistance level (with volume support )
If No, what is the reason for not entering such a trade?
Thanks
I have discussed pullbacks as well, especially the ones backed by low volumes. Please do check that out.
Thanks Karthik!
One more question though. In this shooting star pattern, if the color is red, then dose the length of the body w.r.t the upper shadow will matter? I mean even if the body is long relative to the upper shadow but as long as the body is concentrated towards the lower price band, we can still take the same Short Sell trade..right? Or am i missing something.
The colour does not matter at all. What matters is price action. Yes, the body should be concentrated towards the lower half. It is a short sell trade.
Hi,
It is mentioned that either the target should be met or the stop loss be triggered for a trade, and one should not do too much of tweaking while the trade is in between. However, while I got the hang of the stop loss but how does one set the target? Please clarify. I do not know if it is getting covered in subsequent cards
Thanks!
YOu can use S&R for setting both target and SL, Ritwik.
One general query sir. I have read ur technical analysis module for 2 times. This is the 3rd time and now reading it along with comments. Sir initially i just want to trade in cash market, would you suggest to read the option and future and other module also for this. Or teachnical analysis module is sufficient to start in cash market?
TA is good enough to trade cash market, Siddharth. Good luck!
Hi Karthik
I have few doubts.
1)Does the length of shadows for Doji has any conditions like they need to be equal like Spinning top?
2)Regarding Shooting star you told the red is more realistic.I feel the same for Hammer..If the Hammer is Blue is i feel its more realistic Pls correct me if am wrong??
3)What showuld be the approximatle gap between open and close for paper umbrella in terms of (Open-Close)/(Average of Open & Close).
Kindly suggest
1) No, they don\’t
2) Nothing wrong, it is a matter of comfort, remember the colour of the candle does not matter in a hammer pattern
3) The open and close price should be close to each other, maybe separated by less than 0.25%.
hi kartik, what signal we get , when in a downtrend stock, 3 consecutive dojis have formed.?
Indecision in the market, that\’s what the doji\’s signify.
In Hanging man which appears at the top in an uptrend, we can say that bear has made an entry which is shown by long lower shadow but since the real body is small that means the closing of the trade happened near its opening, doesn\’t it means then even though bears tried their best to lower the market bulls again gained their momentum which is shown by the small real body?
Yes, hence the hanging man in the uptrend is not the greatest bearish signal.
Hello karthik. #correction
In 7.2, Why we have to set stop loss @ the low of the hammer, Cant we set the stop loss at any higher position than the low of the hammer so that I can minimize the loss if the trade goes wrong?
The low point signifies the reversal of the price, hence that serves as a SL price.
Hello karthik.
In 7.2, Why we have to set stop loss @ the low of the hammer, Cant we set the stop loss at any higher position that the low of the hammer so that I can minimize the loss if the trade goes wrong?
Hi Karthik,
Firstly, thanks a lot for all the information you have put in place. This was of great help.
My question is:
What if a shooting star appear at the bottom of the downward trend?
Then it is not a valid pattern, its just that \’maybe\’ it emphasises more bearishness.
Sir one more question
How can we make a short trade near the close in hanging man, if we can\’t carry the trade overnight?
You can short in the Futures and Options segment.
Sir is there any difference between hanging man and bearish hanging man?
If it is you earlier said that we don\’t have any concern with the colour
Hmm, hanging man can either be bearish or bullish based on where it appears in the chart. So you need to look at it from that perspective.
\”The risk taker will initiate the trade at 1417, basically on the same day the shooting star forms\”
hi Karthik, on above statement, how can the trade be initiated the same day, given that on shooting star the trade is to short, but in spot market we need to close the short position the same day. So how come the benefit be realized if we are initiating the trade the same day.
You can initiate the same in the futures market, Ritesh.
Hi, can we assume Hanging man and Shooting star pattern at end of bullish run serve same purpose?
Which is they predict bearish run
It is based on historical observation. No guarantees as such.
Hi Karthik,
Do you also take classes online/offline for Technical Trading ?
No, everything is on Varsity 🙂
Sorry in the thought process point no. 4 of hanging man.
Sir I think in hanging man trading setup point no. 4 there should be long upper shadow at the place of long lower shadow kindly check and confirm it to me also.
And thank you for the great material.
Hanging Man/Hammer are all paper umbrella pattern, has no upper shadow.
Hello,
Do you have some chapters to better understand Stop-Loss? I am not able to understand the concept of Stop Loss during a bearish phase such as Hanging Man or a Shooting Star
Some of the examples that you gave described:
Initiating a Trade: 1000 (I assume its a Buy trade)
Stop Loss: 1050
How can Stop Loss be higher in the Buy trade?
Thanks,
Rohit
Hello Karthik Sir,
Thanks for the wonderful content.
1. I have a question regarding shooting star.
We know it indicates upcoming bearish direction if its came after bulllish direction
Isnt it possible to use shooting star (as Inverse paper umbrella – hammer) for other part also ?
I mean if its at downtrend then can\’t we predict upcoming bullish trend ?
2. I think I got a shooting star here ?
Is right to say say so ?
Img: https://pasteboard.co/J5Q4DY1.png (the right most candle)
O: 1434
H: 1475
L: 1423
C: 1429
1) If you spot a shooting start in a downtrend, then its not really a pattern, however if you look at it from a price action perspective then it kind of indicates more bearishness.
2) Yes, it looks like it.
Many thanks Karthik.
Welcome, Udit!
Hi Karthik,
My doubt is wrt the second (and the last) chart on page no. 43 from Chapter No.2 Technical Analysis.
In context of the chart given right below it, it reads :
\”Here is another chart where the risk averse trader would have benefited by virtue of the ‘Buy strength and Sell weakness’ rule.\”
After the Hammer appeared, the next session/day has a red candle. My doubts :
1. A hammer is supposed to reverse the downward trend. Why couldn\’t it happen ? Since the Bulls may have entered the market, as a result of which a hammer came into existence !
2. How was the Risk Averse trader supposed to have benefited as per the BUY STRENGTH & SELL WEAKNESS Rule ? Is it because, had it been a blue-candle day, only then he would have BOUGHT to strengthen his position* ? If yes, this* is the answer to my question, what was he supposed to do after the day when the hammer appeared ?
Thanks in advance
1) There are no certainties in the market, Udit. A hammer (or for that matter any pattern) is only a probability, not a guarantee
2) Its because he would have avoided entering into a position, only to realise that he would have to exit due to SL.
Thanks Karthik, are there more training modules on candlesticks by where we can learn Doji\’s, shooting star, engulfed patterns and more??
Thanks,
Debesh
I\’m not sure if there are any other material online, but do check out the book on Candlestick Patterns by Steve Nison.
Hi,
I have a doubt on the candlesticks, I hold a SUNPHARMA Call Option and it ended up with a candle like inverted hammer but in green color, can you please look in the file uploaded in the google drive below and suggests the importance/impact of this candle, this candle has neither formed in the uptrend nor below, you can view this chart SUNPHARMA APR 490 CE.
https://drive.google.com/file/d/1F5duVZiJL4rw2RF0S70EdJ-sxlBgV3wt/view?usp=sharing
It is quite confusing, so thought of seeking your advice.. Thanks,
Regards,
Debesh
This is not a valid pattern. Traders tend to look at it as a shooting star, but it is not because there is no prior trend.
Hi,
I am unable to see the charts posted by other people . Need to see them to have better understanding. Pl help.
Thnx
Users upload on Google drive and share the link. Unfortunately its, not something that we control.
Thanks Karthik, today\’s movement in Britannia was still bullish so few queries as below:
1. Any other patterns (in addition to Shooting Star) to be checked before taking a final call on shorting?
2. If next day also forms shooting star but at same level as previous day, what should be analysis? Is it same case as Doji or Spinning top appearing after creation of any pattern?
3. Since STBT is not allowed in equities, what should be position taken by risk taker for shorting? Should he/she be selling it st start of trade next day?
Thanks in advance for answering my queries.
1) Prior trend, range of the candle, and the volumes
2) Yeah
3) Short futures would work
Hi
If we refer to today\’s (23rd April 2020) Candlestick chart for Britannia, is it right to judge that shooting start pattern is being formed?
Thanks
Yes, but looks like the range is quite a bit to set up a trade. Your SL will be quite deep.
Just an observation: IRCTC formed a shooting star on 15th April 2020, then a hanging man on 17th, and as of writing this, it is forming another hanging man. The trend is continuing to be bullish, while our technical analysis suggests that the trend should have reversed.
It would be great if someone can explain if my understanding/interpretation is wrong.
Thank you.
Look at it from an overall perspective, it is bouncing by hitting circuit limits. You should not be shorting here.
implying that the bulls are in absolute control or implying that the bears are in absolute control. what does statement mean exactly in real life or practically?
It means that the prices are strongly surging up (bulls in control) or going down (bears in control).
In Paper Umbrella and Shooting star, is there any criteria for body ? i.e is it necessary that the open and close should be within certain range ?
Not necessary, the real body should be small.
Hi,
Great insights,
For Hanging man: risk taker and risk averse scenarios should be vice versa?
Risk averse will sell the stock on the same day noticing a hanging man formation
Risk taker will wait for the next day ensure it is red, and will sell the stock.
Ah, let me run through this again.
What should be the trade set-up if shooting star appears at the bottom of down trend?
It just emphasises the bearishness, no trading setup as such.
What does it mean that the trader can go long? Is it a signal to buy the stock? Please help. I am new here.
Long means that the trader buys a stock or futures to profit from the increase in price.
Tentative percentage ??
What should be the Y axis width to be used to study candlesticks??
That depends on the price range of the stock.
i\’m confuesed here what if market was trending up and it went in sideways and then and shooting star is formed or paper umbrella how will i defin it. sry but my english is not good
Prior trend is important for candlestick patterns, Siddharth.
How is it possible that stop loss is more than the trade price. Stop loss is to ensure that the trader doesn\’t suffer much loss. If the SL is more than buying price it means profit. I\’m a bit confused.
It also depends on the direction of your trade. If you are short, then the SL is higher you than the entry price.
Sorry for a silly question. But how to short a script for multiple days?? I am aware about shorting for intraday trade only. Pls throw some light on it.
Tapan, you can do that with a futures contract or an options contract.
Can a shooting star preceded by a low trend signal bullishness?
Hmm, not really.
Sir, I am not able to understand this.\”Once the short has been initiated, the high of the candle works as a stoploss for the trade\”.
Short the trade means, right now you are selling the stocks with the intention to buy it back at a lower price. Please correct me if I am wrong. I don\’t understand that when we are selling a stock then how can we put stoploss.
I\’d you read this chapter once – https://zerodha.com/varsity/chapter/shorting/
Is it necessary to look at daily charts or can we look at hourly or shoter intervel charts?
If you are trading intraday, then you can look at the hourly charts or even shorter-term charts like 10/15 minutes.
Hi Karthik
The articles you have posted are very meaningful and educative. Thanks for the same.
Can you tell us if you are trading, based on your knowledge which is of course much more than us, what is your win / loose percentage on your technical trades and at the end of the day are you making money more than lending rates each year.
Thanks.
Dipan, thanks for the kind words. I\’m still learning and evolving 🙂
I\’m not actively trading these days but I do actively invest. Things have been fairly decent for me…and I\’ll refrain from quoting numbers 🙂
Nice information about candlesticks. but, karthik there is one confusion while using MACD indicator.
In 30 mins chart, MACD is giving a sell signal but in 15 Mins chart, it\’s showing to buy !! Which one should I Follow?
From:
Apk Downloaders
I\’d prefer to look at the 15 mins one.
How do you identify whether the trend is downward or upward (in case of trades like the paper umbrella)?
Is there any way to check it (such as the trend of past 5/6 days ) or just a visual cue to identify it
You just have to check the trend for the last few session and evaluate the % change. In fact, a simple MA also helps.
Don\’t you think, the shooting star and the hanging man are contradicting themselves?
The contradiction bit, I\’m not sure, but I\’m not a big fan of the hanging man.
In a bearish trend what is the significance of stop/loss, cos already trade is done n how SL will help. Thank you
You\’d probably initiate a short trade in a bearish trend, so to protect yourself against an up move, you\’d need a stop-loss.
Hi,
If the hanging man is preceded by an uptrend and colour of the candle does not matter, then still bullish sentiment should be stronger, right? Because the closing was much higher than low of that candle suggesting that bulls were able to increase the price before the markets close.
The only question is if the trend was strong enough, why did the bulls give way to the bears and let them drag the prices to a low point?
Sir
You told about entry and exit but how do we know about target price?
Later in this module, I\’ve explained the concept of support and resistance. You can use that for identifying the target price.
Dear Sir,
I am quite new to this subject. I don\’t have any trading experience. I just want to know how a short trade is initiated at around 3:20 PM as we have to square off the position by the end of the day? Will it be done in the derivatives market?
Regards,
Rahul Mishra
Rahul, you can initiate the short trade in the Futures contract.
Hi Karthik,
Do, the candlestick patterns have to be at the very end of the trend or can I be flexible for a few more candlesticks?
If a stock is in an uptrend, then trends sideways for a few days and finally a candlestick pattern is formed at the end of it, can it be considered as a genuine pattern or should I ignore it?
I am talking specifically about the end of the day chart of AdaniPorts for today. Can it be considered as a Dark Cloud cover?
Thanks,
Nikhil
You will have to take the call as is because it is quite a challenge to call the top and bottom of a trend.
How many hours candlestick pattern would this work most accurately on? (I have peronally been using 1hr, is that accurate enough)
This can be applied across all assets, across all time frames, Natasha.
We known more often than not shooting star is bearish reversal pattern and hammer is bullish reversal and we also know the probability of price reversing after these patterns are encountered is high.However there are cases where these patterns do not suffice the reversals and stoplosses are hit.How do we limit such damage and find a fine line or balance to negate the false trades.
This is exactly why you need to look at the checklist, Bismoy. The checklist ensures you are looking at the right set of parameters before initiating the trade.
🙂
And Karthik by the way I was going through a article about the supertrend indicator and the article stated that the indicator is better used off with Heikin-Ashi candles (Yeah I read it _Heineken Ashi_) 🙂 . I couldn\’t quite understand the Heikin-Ashi candles, So could you please give some insights on the Heineken Ashi Candles (pun intended) 🙂
I\’m yet to figure out Heikin – Ashi, I\’ve just been soon used to the candlesticks. But I can guide you through Heineken – Ashai 🙂
But Karthik, when I was going through a number of company\’s 5-10 year old charts I saw that the supertrend indicator gave right signals and the stock rose quite generously. Like when the supertrend indicator gave a positive signal to INFY in 2018 and the stock rose from 460 to 600 in the span of a year
Hmm, maybe. For instance, I love the moving average cross over system for exactly this reason. Maybe ST works on similar lines, its just that I\’ve not figured this out yet 🙂
Hey Karthik,
Can the Supertrend Indicator be used as a fundamental in Fundamental Analysis?
No, there is no use case for super trend in fundamental analysis.
Small typo in the section on Paper Umbrella – Hammer Formation
\”The risk averse trader should evaluate the OHLC data on the 2nd If it’s a blue candle, the trade is valid and hence he can go long\” is what was given in the section. I think, you meant to say \”OHLC data on the 2nd day\”.
Ah, thanks. I will make that correction.
Open = 592, High = 593.75, Low = 587, Close = 593. Based on this, the trade set up would be as follows:
the paper umbrella should be in blue colour but in graph it is showing red color.
Let me check, but the color of the candle does not really matter when you are looking at a paper umbrella.
Hi,
What if shooting start appears in a downtrend , just like a hammer ?
Omkar, this in my opinion just reemphasises the bearish trend.
Sir, how can we plot the candlestick pattern for intraday, as we know the high, low and close price at the end of the day
You can load the intraday chart and check for the same. Check this – https://zerodha.com/varsity/chapter/chart-types/
Sir bad candle has formed at top resistance even though market didnt fall…ots bn current chart..
https://drive.google.com/file/d/1k7NKIjlayRG570TFYtjSJH1Murzfa-0p/view?usp=drivesdk
So sir i want to ask do they sometimes doesnt work???….abd how to get from this false breakput….plz suggest and correct sir🙏
Satish, the entire TA is based on probabilities. There are no guarantees in markets 🙂
Kindly check now. seems some access issue . Sorted now.
https://drive.google.com/file/d/1mfdB4KDTAwHvIa6MajkTS7nv6leJvNLf/view?usp=sharing
I can see an inverted hammer (2nd from last), although it does not get qualified as it does not have a prior trend. I can also see a bearish Marubuzo (9th candle from last), which seems to have worked.
What do you mean shooting star is inverted hanging man but I looks both same because in both upper shadow is 2 times the real body
Yes, both are the same, Pankaj.
Hi, I am bit confused after reading all the single candle charts. Can u help me pattern/candle stick which is visible by you. I am attaching today\’s BNF chart with 5 mins.
Thanks
Ritu, can you upload the image on G drive and share the link?
Hi Karthik, Uploaded the image at the below shared path. Kindly suggest.
I have gone through single candlestick pattern yet.
https://drive.google.com/open?id=1mfdB4KDTAwHvIa6MajkTS7nv6leJvNLf&authuser=0
Unable to view this file.
\”On the first hammer, the risk averse trader would have saved himself from a loss making trade, thanks to Rule 1 of candlesticks.\”
How does the risk-averse trader evaluate the next candle before the actual candle formation in the above case?
Buy price for a risk-averse – He takes the trade on the next candle \”after evaluating that the candle is blue\” at – Rs. 445.4/-
How can the risk trader evaluate that candle is blue before the end of the day?
These are all EOD trades, Harry. However, the risk-averse trader may find himself in a tricky spot if the price has moved up quite a bit the next day.
Did heromotors formed hammer on 26.4.19.
(Volume was above avg)
It does look like one.
But the trade went down trend, does green body of hammer would have made difference?
No it would not have. Perhaps the prior trend was not satisfactory?
Oh… One query..how many days end of day candle should be examine for prior trend..
At least 7-8 trading sessions in my opinion.
Hi,
I refer to the example taken in this module:
In the chart above, BPCL Limited has formed a hanging man at 593. The OHLC details are –
Open = 592, High = 593.75, Low = 587, Close = 593. Based on this, the trade set up would be as follows:
The risk taker, initiates the short trade on the day the pattern appears (at 593)
The risk averse, initiates the short trade on the next day at closing prices after ensuring it is a red candle day.
My query is , what is meant by \”short trade\”? MIS under Equity segment?
Is it Short sell?
Yes, the short trade is short sell. You sell first and buy later. Best done with futures.
is there any need to confirm the volume?
Volume confirmation always helps.
hi Karthik,
i just started going through the this material (very new to stocks), which i have got to know from my colleague. became a fan of your writing.
I have a question.
there are two candle sticks for
1) paper umbrella – Hanging man (which is a bearish candle seen after bullish trend) and Hammer (a bullish candle seen after a bearish trend).
2) doesn\’t shooting star has also two scenarios. How to infer if i see this candle (blue) after a bearish trend. does it have different term?
i am sorry, if my question doesn\’t make sense.
Glad you liked the content, Madhu 🙂
1) Yes, that\’s right
2) The shooting star at the top end of the rally indicates bearishness. The same at the bottom end of the rally, according to me indicates more bearishness.
In the hanging man example chart no-7 where BPCL stock Open = 592, High = 593.75, Low = 587, Close = 593 then how it became a red candle?
Ah, must be a typo. Let me check.
Please check if JSW steel\’s chart was a shooting star on 25th Feb 2018.
Yes Sir, it looks like one.
Hi Kartik Sir ,
Sorry didn\’t get time to read above questions and comments and i am not sure if anyone had asked already the below question :-
What does \”Shooting star\” mean in a downtrend . I am observing candles , can see Shooting star formation in lots of downtrend as well .
Shooting star in a downtrend does not really mean anything, Ajeet. However, you can assume that the downtrend is probably intact.
how to mathematically define a hammer sir, so that I can backtest using my kite api subscription. My understanding is that considering the body the lower shadow should be at least twice but how to quantify upper shadow sir?
Here is a starting point –
The range of the body = X
The range of the lower shadow i.e open (or close) – low = 2x
Prior trend = downward
Thank you sir, but I figured that out, upper shadow is the problem sir, how much of upper shadow(very tiny upper shadow) can be allowed ie 0.2 or 0.1 times of body or something like that sir.
Upto 0.2 is ok, Mani.
I am starting to learn Intra-day and trade only one or two trades a day when I can find some big movement in Nifty & bank Nifty. But I am not able to find the correct entry or exit timings. I am confused with the different time frames such as higher time frame and lower entry time frame. Can you suggest What should be the correct time frames so that I can analyse the proper candlesticks and enter/exit at correct time before the momentum starts in nifty & bank nifty
I\’d suggest you look at 5 minutes or higher time frame, Gaurav. Use an EMA cross-over to identify trends.
hi sir,
i\’ve a issue that in the 4th chart of the shooting star, there is a bullish shooting star candlestick and sir,you said to in this chapter that when the shooting star appears the trend will go down but in that case (4th chat) the trend go up and also prior tend is bullish.
can you sir explained me i,m confused.
I\’ve also said that there are no guarentees in the market 🙂
CS patterns only enhance the probability of a certain directional move, but there are no guarentees.
then sir how i can choose the correct way to the make a profit?
If you are trading technicals, you will have to stick to the pattern and do as it suggests. This is the only way to enhance the probability of success.
thankyou sir, for your great advises and also varsity to make traders easy to trade.
Good luck and happy reading 🙂
Can you guide about Time period (15 minutes,30 minutes, etc ) candlestick pattern for intraday ,delivery
Please check section 3.5 in this chapter – https://zerodha.com/varsity/chapter/chart-types/
Sir What is your preferred option ?
For intraday, I\’d prefer to use either the 10 or 15 mins time frame.
Hi Karthik!
I wanted to know if there are any prior probabilities regarding these candlestick patterns? Like if the hanging man is a bearish signal so it will be successful 70% of the time and 30% of the time it\’ll fail or such, given there are large number of trials?
Thanks.
In fact, you will have to work towards this, Amey 🙂
You will have to backtest each pattern across stocks and come up with a repository of which patterns works on which stocks. For example, the hammer may work very well on SBIN, but may not on HDFC Bank.
Thanks Karthik!
I will work towards it. Actually prior to posting that query, I was trying it out on excel but it got too complicated after a while.
Any guidance on how can I go about it? Can TradeScript help here? How would you do it?
Trade script probably can, I\’ve never used it so cannot comment on it.
I used to run this on excel, agree its a pain but with my limited skills, this was the only option for me 🙂
Hi Karthik,
I am not able to recognize whether the pattern formed on TATA ELXSI on 7-12-2018 is Hammer or Hanging Man.
Op: 1014 Hi: 1020 Lw: 995 Cl:1008
prior trend being an uptrend but on 6-12-2018 stock correct.
Thanks.
Neither, because there is no prior trend.
In some uptrend or downtrend there will be no confirmation of patterns like hangingman,hammer or shooting star but the indicators will be in overbought or oversold and rallies will be started on downside or upside is it because only on the indication of indicators in overbought and oversold region and can we go short or long only because of indicators.
Not true, you can spot candlestick patterns within trends as well. In fact, CS patterns help one decide ideal entry and exit opportunities in the secondary trend.
Sorry for the confusion between SL and SL-M sir. It\’ll be really helpful if you could give an example in which the next day (next to hanging man formation) pssibilities is mentioned.
Ankit, I\’m bit confused, can you please elaborate? Thanks.
Sir, Just to avoid any more confusion, I am jumping straight on to my question: what\’s bothering me is to understand how shorting will help me when a hanging man is formed. I want to understand this with an example. I know we have examples like that of BPCL given by you above but they don\’t tell what happens the next day of the Hanging man depending on the stop loss set by me. If feasible for you can you give a few examples of the possible scenarios the next day where I have set the highest of the previous day(hanging man formation day) as my stop loss (as suggested in the paras above).
Ankit, the idea is to short the day or the day after the hanging man is formed. The expectation here is that the stock price will go down further and you can buy it back at a lower price and therefore profit from it. Please remember, hanging man increases the probability of the stock price going down the next day, there is no guarantee as such. I hope this helps.
Thank you sir.
Welcome!
Hi Karthik,
Can you tell me what do you mean by directional trade?
Thanks,
Manish
A trade which is dependent on the direction of the market for its profitability.
Thanks Karthik
Welcome!
Hi Karthik sir,
I just tried to summarise the stop loss we can set as per the pattern and I have the below queries after it:
Hammer: stop loss is the lowest of the day – I understand this as, whenever the stock reaches that lowest point again the trader should buy it so that when the stock goes up again, he can have the maximum profit.
Hanging man : stop loss is the highest of the hanging man day. Here, if I set the stop loss as the highest point of the previous day, will the stock not be sold the very next day when the market opens at a price better than previous day close but lower than previous day high? Does it not have a chance to still go up? Should we not call that previous day high price a \’Target\’ instead of stop loss?
Shooting star: Same query as I have for Hanging man.
Please guide me in this regard.
Regards
Ankit
Not really Ankit, as you would short based on a hanging man, which means the SL has to be a price higher than the entry price. In the case of candlestick patterns, the high of the pattern marks as the SL for short trades and the low of the pattern marks as the SL for long trades. Given this, the high is an SL level for hanging man, and not really the target.
Good luck.
Thanks for the answer, sir.
I believe I haven\’t understood the meaning of stop loss. Please let me know what needs to be changed in my understanding here – stop loss is the lowest price at which you would want to sell your shares automatically so that you do not bear a greater loss.
Going by this, when I set the highest of the hangingman as the stop loss, should the shares not be sold the moment they go below that mark?
That\’s why I doubted that if the shares open at a price lower than the highest they will be sold right away the very next day.
Please let me know if \’stop loss\’ works any other way.
Ankit, I get a feeling that you are not familiar with the concept of shorting. In all the bearish patterns, the idea is to short the stock and buy it back later. I\’d suggest you read this chapter in which a \’short position\’ is explained – https://zerodha.com/varsity/chapter/commonly-used-jargons/
I read about short trade sir. I believe that when we say we set the high of hanging man as the stop loss we mean \’stop loss market\’ with setting the trigger price and the stop loss both equal to the high of hanging man because we cannot set a stop loss greater than the latest price of the stock if we choose just the \’stop loss\’ option. Please let me know if anything is missing in this understanding.
I am not able to see few charts, I see names instead. M2-Ch7-Chart3, M2-Ch7-Chart5, M2-Ch7-Chart8.
What could be the problem?
Can you please do a hard refresh on your browser? That should solve the problem. Thanks.
No, that did not work. I even tried to clear cache/cookies and navigated back on this page. There are few charts in each chapter which would not open.
Its weird cause I checked thin on multiple charts, seems to be working fine. Let me check again.
Resolved. It was google chrome specific issue. I am able to see charts in internet explorer.
Thanks.
Ah, glad it worked 🙂
if you apply the thought process used for paper umbrella to shooting star, how is it bearish always ?
In a shooting star, the high point of the day was not sustained plus the stock closes near the low of the day. Both these points lead one to believe that the stock could retrace.
thanks for making time to respond.
I read some more, i was referring to the inverted hammer pattern(shooting star in a downward trend), isn\’t that bullish?
inverted hammer not included as it is not a frequent pattern, is it ?
A shooting star at the end of a downtrend is not really a valid pattern, but if you were to think about it, I\’d still be bearish for the exact same reasons quoted earlier.
Hammer formation on Apollo Tyres on 12 of Sept 2018 is perfect example of above theory.
Shared moved 10 Rupees on 14th of Sept 2018.
Yup, hope you were able to profit from it 🙂
Dear Karthik,
In the whole \”Checklist\” at the end, Is there any other method or Indicator that replace the Support and Resistance Part to confirm the trade and identify the target?
I\’m having a really hard time with Support and Resistance. I\’m getting a grasp on the candlesticks and that it\’s not just about the patterns you described, it\’s about the way the market thinks that\’s reflected in each candle.
Rahul, I would not suggest that. The S&R is a critical technical trading element, you have to ensure you get comfortable with it. I understand it takes time, but do pursue and get through with it, trust me, you\’d be glad you did 🙂
Ok Sir, Since you are much more experienced than me I will trust your judgment and move forward in the same path as you have described.
Thank you.
Good luck, Rahul. Do your research as well 🙂
Sir,How to set stop-loss in hanging man pattern.Because the prices consolidates n if we take high of hanging man it gets hit n then prices starts to fall down.
I made mistake today in M&M .
Dhaval, it is best if the hanging man high coincides with the resistance for a more meaningful stop-loss.
Hey, If there is a downtrend or a uptrend in a stock price and paper pattern forms after 3 to 4 days of sideways movement of stock price.(the closing price did not move as it did during the trend) Do we consider this a buy or sell signal? Or should I see, whether the body or the shadow should be above the rest of the days to consider it a signal?
Will this be applicable to all the patterns?
Cheers.
Yes, you can still consider that as a valid bullish pattern.
can you please explain about reverse hammer pattern
That\’s the shooting star, have explained the same in the chapter.
How do you set a target for hammer?
None of the candlestick patterns gives you a target, you will have to identify one yourself by looking at other things like the support or resistance level.
Karthik – can you please explain the significance of Stop loss? In case of bearish, article suggests us to make the high value as Stop loss. Why do we need to make the high as SL?
Stop loss is when you want to get out of the trade in case it goes wrong. So if you buy at 75 and the stock slides down to 70, you want to restrict your loss and get out at 70. 70 becomes the stop loss. In case of bearish signals, you short the trade because you expect the stock price to go down…hence the high becomes the stoploss. Suggest you read this chapter to understand how shorting works – https://zerodha.com/varsity/chapter/shorting/
Thank you very much Sir..
Good luck, Prakash!
Sir. i have not understood this point clearly
\” More often than not exiting the trade is the best thing to do when the stoploss triggers.\”
Why we should not exit the trade when stoploss triggers.
You need to exit the trade when SL triggers, Mohit. Afterall, that is the purpose of the stop-loss 🙂
He meant, \” More often than not, exiting the trade is the best thing to do when the stoploss triggers.\”
It was not \”More often than not exiting the trade is the best thing to do when the stoploss triggers.”
Comma was missed, it is making room for the confusion. He was asking to exit the trade when stoploss gets triggered.
Hi sir,
Looking at the EOD Charts of Nifty 50, chart suggests that a Red candle (on 13th July) is formed after an inverted hammer (on 12th July). I believe it is a Shooting star followed by a red candle. When Pivot points are plotted on the chart, on both the days, it just managed to touch 11062 (resistance 2 as per charting software) after which it started moving down. Possibly it is a resistance. This suggests me that One has to turn bearish for the index. Working out the PCR ratio, it comes out to be 1.584. But, I have read that PCR is generally a contrarian approach. So, as per PCR, one should be bullish on the Index. Secondly, Index has been in a good rally for the last few sessions, Looking at the index composition, hardly 20 listed stocks have shown any signs of recovery from the correction, while other 30 have only moved marginally. Chats suggest me a downtrend, PCR suggests me Uptrend. Calculating the Max pain as per OI, I have arrived at 10800. What kind of stance is to be taken as of now ? Could it be bullish? Or bearish?
Disclaimer : I haven\’t taken any real positions. I\’m just trying to relate all the concepts that I have learnt on Varsity and few online Webinars. I wanted to know if I\’m analyzing stuff in the right approach. I personally believe it should be bearish from now on. for few days (atleast a week). Kindly correct me if I\’m wrong. Thank you
Prabhu, I like the fact that you are training your mind to arrive at a set up by considering different approaches and not just plain vanilla charts. However, in this particular case, I\’d not pay much attention to Max Pain and change in OI. For all you know we would have a small pullback backed by low volumes before the index takes off again.
1. Does the shooting star compulsorily have to be in a downtrend? Because today at around 3.15PM, the 15minute chart of Bank Nifty formed a near perfect shooting star but on a downward trend and immediately the next 15 minute was a big drop and a bearish marubozu was formed.
2. How long does the effect on a CS pattern stay on a 15minute/30minute/1 day chart? For instance, above the shooting star was formed at 3:15 then the price dropped but do I expect it to drop even tomorrow or in a few trading sessions of 15 mins if it wasn\’t EOD
1) A shooting start at the end of a downtrend hints at a bigger fall. However, this is not a recognized pattern. A shooting start at the top of an uptrend indicates a reversal.
2) It is best if you consider the pattern just for the day and not carry it forward to the next day.
Hello Sir,
In above provided details for \’Shadow to real body ratio\’ the calculation is provided for Bullish candle (Hammer pattern) as below: –
Open = 100, High = 103, Low = 94, Close = 102 (bullish candle).
Close – Open i.e 102-100 = 2 and the length of the lower shadow is Open – Low i.e 100 – 94 = 6
So how to we calculate for Bearish candle (Hanging man or Shooting Star pattern). Will the calculation be like below:-
O – 134.20, C – 133.95, L – 133.60, H – 137.10
open – close (134.20 – 133.95 = 0.25) and high – close (137.10 – 133.95 = 3.15).
Please let me know if my understanding and calculations are correct.
Thank you.
Regards,
Harshajeet
Yes, this looks fine to me. All you need to do is measure the length of the shadow with respect to the range.
Thank you for the confirmation!
Good luck, Harshajeet!
Hi,
I have been trading in equities from some time. As per I know, we can short shares using MIS option(intraday). But, in many of the lessons here, you told to short at end of the day, so that we can buy back after few days(which is not possible in CNC), when the market starts bullish again. Can you please help me here?
Thanks
Srikrishna
You can always short and carry forward the positions in the futures market.
Thankyou Karthik?
Dear sir,
what are the \” open, close, high and low\” prices ?
these are specific to the candles range or day range ?
could you please explain bit these prices ?
Thanks
NH
These are different price points of the day, I\’d suggest you start from here – https://zerodha.com/varsity/chapter/chart-types/
Dear Sir,
I have studied from beginning.
My question in detail is as follows.
At 9:30 market will open, the open market price is X and market is bullish hence price @ 1:30PM is X+2 and hammer will form here. here open price is X and hammer formed @ X+2, still we have 2 hour to close the day and if it closes for the price X+3.
here open price was X and close price is X+3.
1) is it good to buy the stock @1:30 or 3:20 ?
2) next day open should be equal to close price (X+3), If next day open price is X+3, is it good to buy here ?
Thanks
NH
Is my understanding is correct ??
Dear sir,
I feel hanging man and shooting star is same. am I correct ?
The shooting star is an inverted hanging man.
I mean, both indicated that market will go down.
Why doesn\’t the shooting star has two forms like Paper Umbrella. Doesn\’t the shooting star at the bottom of a downtrend is not an indication that trend is going to reverse?
A shooting star at the bottom of a trend indicates more bearishness.
Hi Karthik Sir,
This is just out of curiosity that I\’m writing. I believe its better to analyze the candles with an approach of buyer/seller perspective, rather than just memorizing the pattern shapes and trying to hunt for them, which might actually miss the crux of charting analysis. I believe just memorizing that formation of hammer after a particular trend reverses the earlier trend might not be apt. Looking further, shooting star at the bottom of the trend only means that bears are in complete control until the day before inverted hammer is formed, and on the day of inverted hammer, the buyers have tried to bring the price up (Indication of long upper wick), but the sellers are so strong in dumping the shares that the candle closed near its Low for the day indicating more bearishness (Even though the prior trend is downward and an inverted hammer is formed after the trend, trend won\’t reverse). On contrary, A hammer formed after uptrend is not necessarily saying that trend will reverse (Even though the vanilla charts are saying so). The reason behind this is, until the day the hammer was formed, buyers were in complete control. On the day of hammer formation, Sellers have desperately tried to bring it down (Indication of long lower wick), but the buyers were strong enough to help the scrip close near its day\’s High. I would believe that buyers are still in driving seat despite the formation of a hammer after uptrend. I believe this approach would help minimize wrong interpretation. Of course, there are only 2 possibilities after a trade has been initiated. It either works our way or not. If it works our way when a trade is placed only by memorizing patterns and not understanding buyer/seller perspective, it only increases the danger of placing more wrong trades as we start believing more on structure of charts rather than understanding what they are trying to tell us. Hope I have understood your work (varsity) in the way it was intended to be.
Thanks
Absolutely, Kiran! In fact, I have been trying to convey the exact same point in multiple ways 🙂
CS patterns manifest out of the price action, so once the price action is understood, the pattern does not really matter.
I am unable to post the link to the screen shot, still I\’ll give you the day and date of the candle:
https://drive.google.com/file/d/1CHI5fTy8JtzvYigIc8ARD6kUn7VRRz-M/view?usp=sharing
O: 0.00 H: 0.00 L: 0.00 C:84.85 V: 100 D: 05/17/1999
Scrip: TataPower
That shooting star OHLC data example you gave us is a bit confusing. We know that the bear is going to take control, then why would I stoploss at the high of the shooting star day?
Thats because you can short it and profit from the stock price decline.
First of all, thanks for the replay. I don\’t know about others, but I couldn\’t understand how to take advantage of the trade when the bear is taking control. So can you please tell me which chapter number I should study, in order to get a clear picture? Thanks
You should check this chapter, Aravinth – https://zerodha.com/varsity/chapter/shorting/
Ok thanks, Karthik. Really appreciate your work.
Good luck, Aravinth!
Great initiative by zerodha.
I have a doubt that how the stoploss for a bearish candle is the high ?
For all bearish candlestick patterns, the high of the candle acts as the stop loss. Likewise, for all bullish candlestick patterns, the low of the candle acts as the stop loss.
Hi,
If you see the cipla chart from April to May in 1 day candle, it has created multiple shooting stars still Price gone up need to understand this..
Maybe there is exhaustion in the chart?
Hi,
What if the proper hammer candle seen on top or slightly lower than top of chart? Should I consider it bullish ? Or it has to be on downtrend only?
Bhaskar, best you combine it to establish a pattern.
Hello Kartik,
I am sorry if this has already been asked but couldnt go through all the comments.
In the last example, how could SL be triggered the next day or the following few sessions?.
The shooting star\’s (days high) is higher than subsequent trading sessions. wouldnt the trader book a smaller profit in the next few trading sessions and not going long?
Regards,
Syed
I am so sorry, as trader we were supposed to wait until either the Target or the SL was hit.
I forgot that important lesson of not messing up the Target and SL.
Sorry
Cheers!
Syed, you short based on the shooting star. But as you can see, the stock eventually moved up, beyond the SL. Hence SL was triggered.
Hi, Karthik. What is the best intraday timeframe for BN. 5,15 or 30 min?
Thanks,
Venkata
I\’d suggest 15 mins.
Why Stoploss is placed at High when Shooting star is formed (Refer to figure 2 of technical analysis part 1 shooting star?
I have already gone through Zerodha varsity module but couldn\’t get it! Can someone explain?
SL for long trades is always at patter lows and SL for short trade is at pattern highs. Hence shooting star has SL at the high of the pattern.
Hi,
Just went through your modules for single candlestick patterns. My questions is-
Is it necessary that we trade while the market is closing? (as you have mentioned most of the times to buy the stock at 3:30 pm based on patterns its following). If we put a 15 min chart, it might as well show the similar patterns during the day. So what is the ideal thing to do?
Are all the charts that you show in your examples 15 min? or 1 day charts?
*3:20 pm
Most of the candles are EOD charts, but you can use it across any time frame. It is not necessary to take the position at EOD, but if you need confirmation of the trend, then maybe it does makes sense.
Hi karthik, sorry for asking a second question,
Here it is. My question is wouldn\’t a shooting star be formed and relevant in a bearish downtrend. Wouldn\’t it mean that the bulls are trying to make an entry and we should go long from here.
Let me know your thoughts about it.
Thanks
Hi karthik,
Thanks for posting these wonderful concept in such simple manner. I have one doubt regarding to a statement mentioned.
(When bulls are in control, the stock or the market tends to make a new high and higher low)
I understand that new highs will be formed because the bulls are in control and the are buying all the time so prices will go up and hence new highs will be formed. However I don\’t understand how can new lows be formed IF the bulls are in control.
I suppose higher low means if the low price yesterday was 100 then today it will be 110. So a high low is formed which means bulls have taken the control and even the low price for today is higher than yesterday.
Yes, if today\’s low is higher than y\’day\’s then we have a higher low.
That may not be possible. Where did you read that?
Hi Karthik,
Thanks a lot for these tutorials. They are of immense help. I really appreciate your efforts to share knowledge in the most simple ad lucid way possible 🙂
My question is: What is the time frame for Technical analysis predictions. Can I use TA for long term investment horizons (say I hold on to my investment for 2 years). I assume that TA is useful only for shot term investment horizon (like intra day to few weeks).
If I have a long term investment horizon, should I use Fundamental Analysis only or can I use a mix of TA & FA. If yes, how can I make use of TA for long term investment horizon.
I\’d suggest you use TA only for short-term trading. For long-term, you need to look at the companies fundamentals. A mix of TA and FA always help, but don\’t rely solely on TA for long term.
Thanks a lot for your suggestion!
Good luck!
A follow up question on this. What is the short term investment horizon to consider for TA? few days to few weeks? Could you specify hard numbers which are followed in general by Technical Analysts and the time horizon you personally follow?
Really appreciate your response 🙂
I\’m most comfortable with running TA for short-term trades – like intraday to trades lasting for at the most a week.
Hi Karthik,
As I setup trades for few trading sessions and using 1 Day charts to identify patterns. So How should we manage stop loss for few days session. For E.g. Hammer pattern formed and according to pattern stop loss setup. Now trade is move on my direction and did no reach to stop loss and target also not reached then in that case I thought to wait for few session so in that case how stop loss should be managed?
Thanks in advance.
Hi,
Can you provide the numbers for Cipla in the example above? the OHLC of the candlestick?
Ah, cant really figure the OHLC here, the y-axis is chopped off 🙂
However, from the text that follows the chart, I can see the stock was around 440.
hi sir kindly look at these link
https://drive.google.com/file/d/1nhnh9WpC3fz3HzY8h-tTyST9JqjUc6eO/view?usp=sharing
Yes, this is a hammer, although not very convincing as the lower shadow is uncomfortably long. Both 1st and 2nd trend plays an important part here.
sir if u see link again there is also second question about engulfing pattern,whts your view on that
and yeah u also said that prior trend shouldconfirm having last 5-6 trading days or ther is 4%difference
so how we calculate these difference from lower shadow to lower shadow
or from close to close.
thanks
I\’d prefer to look at close to close. Remember, the closing price is a more logical one (which is the weighted average of last 30 mins), the low could just be a swing during the day. For this reason, looking at close makes more sense.
\”The risk averse, initiates the short trade on the next day at closing prices after ensuring it is a red candle day\”
question is upto what time red candle day can be ensured
i.e if next day on 10:00 am it is showing as red candle so should i take a trade at that time?
I\’d suggest you wait for the confirmation till 3:20 PM.
Hey Karthik,
I was wondering if the shooting star or the inverted hammer (somewhere in the comments you said there is no inverted hammer) is formed at the bottom of a downtrend, will it lead to a reversal. Is an inverted shooting star a real technical indicator?
P.S – You\’re a great teacher. Congratulations on that. So many of us have so much to learn from you!
In addition to the last comment, if you could please check HINDUNILVR\’s today\’s candlestick (7th March 2018), it has an inverted hammer at the bottom of a downtrend, is forming on the support levels, and Bollinger bands confirm.
Volume, MACD and RSI and not so well.
Do you think the inverted hammer is valid in this case as you said in one other comment (yes, I read all the comments) that inverted hammers are not of great significance?
You\’re the best!
Thanks for the kind words 🙂
Yes, that certainly is an inverted hammer. In this case, I\’d give more importance to the support level, especially since its a phycological figure of 1300.
End of the day, all candlestick patterns are just a manifestation of the price action. Given this, you can find your own pattern. If I spot a shooting star at the end of the downtrend, I\’d be tempted to think there is more downside to come.
Hi,
I\’m sorry if this has been asked earlier, but I have a few concerns with the definition of Risk Takers and Risk Averse.
As you have mentioned in previous chapters as well, Risk taker would initiate the trade at Close of same day while Risk averse would initiate the trade at Close of next day. However, I am not able to understand as to how could someone trade at Close? To elaborate my query further, if I am choosing MIS or CO option to trade, I am supposed to square-off my positions on the same trading day, right? So, suppose I am able to identify a Hammer pattern at 3:20 pm when shall I initiate the trade? with what option (MIS/ CO/ NRML)? By when do I have to square of my positions?
I am a beginner so sorry if this question is trivial, I\’d really appreciate if you could clear my doubts though.
Cheers!
Saket, since you are required to carry forward the position overnight, you will have to initiate the trade with NRML as product type.
So if I want to trade intraday, can I initiate the trade whenever I identify a pattern (say hammer) or is its importance reduced if I use 15 min candles instead of 1-day candles? What timeframe makes the most sense for these patterns?
Yes, you can. Candlestick pattern is applicable on all time frames.
What is the acceptable length of a wick(the opposite side of the shadow – just to be clear enough) in single candlestick patterns?
What is the acceptable length of a wick in single candlestick patterns?
Nothing like that. Generally speaking, avoid candles with long upper and lower shadows. Long shadows indicates higher range for the day, which sometime transaltes to higher volatility.
Thanks a tonne Karthick Sir!
Welcome, Apurva. Happy learning.
In the last shooting star, could you please explain how the SL has been breached for risk taker and risk averse trader?
After the trade was initiates, the stock moved up, as opposed to the expectation that it would go down.
Hi Karthik,
You may have already answered this question, sorry if I missed.
1. Do you have video classes of these tutorials ?
2. Do you do any interactive online sessions on these tutorials ?
Also it would have been better if an email triggered to the comment owner when you respond to a comment 🙂
Arun
Arun
1) Sort of – check our YOutube channel – https://www.youtube.com/user/zerodhaonline
2) Nothing planned for now.
Email trigger should be in place I guess. Let me check this.
The real body of a candlestick(Hammer/Hanging man and a shooting star) is located differently, so what does that mean?
Why are those respective bodies formed in the locations that they are(upper or lower end) and not anywhere else on the trading range?
The location is really dependent on the price action, Apurva 🙂
Hi Karthik,
Despite of price rejection at lower level still we term it as bearish(Hanging man) reversal pattern why it is so, though you have mentioned above that hanging man pattern is not reliable enough but is there anything that makes hanging man candle more reliable if we look at previous candle together with hanging man.
I can share a personal view here – I\’m not a big fan of hanging man, for the exact reasons you\’ve stated. However, a hanging man followed by a Doji makes it a tad bit interesting for a short trade.
Thanks Karthik.
One thing is sure how easy these pattern look on paper it gets damm challenging during 9:15-15:30 while accomplishing. However, Varsity is creating a huge huge difference completely in understanding basics. Hats off for this.
Can u also pls tell how to learn price action trading? I mean any useful resources, books to refer etc. One thing I have understood that only practice can make more confident and better here but if can get some head start in the right direction that would be quite satisfying rather than walking blind folded.
Prateek, really happy to note that Varsity is making a difference in your trading 🙂
Candlestick patterns are in fact, a manifestation of price action. I personally feel, this itself is a great way to start learning price action.
Karthik – I am not able to attach chart screenshot as there is no icon to attach file. i just see – Name,Mail and text box of Comment where I am writing. Could you please see nifty weekly chart? the last candlestick(7th Jan – 12th Jan 2018) is a bullish maruboju?
Yes, it certainly looks like a Marubuzo.
The hanging man(preceded by uptrend) is not a very strong pattern right? It says bears tried to make an entry but were unsuccessful since the close price is still close to high.
For the same reason I feel you didn\’t include a pattern(preceded by downtrend) that is opposite to that of hanging man.
The hammer(preceded by downtrend), I feel is a stronger pattern and it has an opposite shooting start pattern(preceded by uptrend).
Yes, not a big fan of hanging man seen on an uptrend. Haning man in the downtrend is indeed the hammer.
\”Remember, the color of the real body in hammer does not matter; hence there is no violation to the Rule 1.\”
Actually this should be considered as an exception to rule no 1 for the risk taker.
Rule 1 says that buy if it is a blue day. A red hammer is a violation only right?
What about the flexibility rule 😉
I agree with the flexibility. What I meant was that instead of writing it as \”there is no violation to the Rule 1\” it is better to say we are relaxing rule 1 like you mentioned for Marubozu(rule 3 violation. But we add this as exception to rule 3).
Tricky, but yes you can. However, the best way to validate this by actually backtesting the logic.
Hi Karthik,
What would it signify if we have reverse paper umbrella (longer upper shadow & smaller body in the lower bottom) ?
That would be a shooting star, we have discussed this as well.
Hello,
I could not understand \’prior trend\’. What does this term imply? U have repeatedly mentioned it in most of the charts illustrated above by a black curve with candles at both the ends. Since both the candles show different patterns why is it considered a \’prior trend\’? Please explain.
The black curve does not point to the two candles, rather the entire set of candles within the curve. If you notice, the candles within the curve have either moved up or moved down, indicating that the prior trend is either up or down.
Hi SIr,
If the hammer/ hanging man is formed(due to huge market volatility) in most of the stock tday, due to gujarat election result anticipation ,then can we consider that and enter a trade or should we avoid it?
You can since you should try and avoid being subjective about these patterns. Having said this, I\’d suggest you avoid taking trades when you have corporate actions.
Hi sir,
1) If the shoting star is a blue colour or hammer is a red coloured one then selling and buying respectively on those days, doesn\’t conflict with the rule buy strong and sell weak?
2) If we are a risk averse trader and say a shooting start is formed with blue colored candle and followed by that on P2 day (on which we are suppose to enter the trade)also a blue candle is formed ,without touching the high of the shooting star(where our SL should be placed) ,then can we go on a short trade or should we avoid it?
1) The color of the candle does not really matter in a paper umbrella since the real body is expected to be very small.
2) The day you take the trade (P2), it should form a red candle. Assuming it does, then you can short the stock provided it has not crossed the high of the previous day.
Is there any specific reason that you have not discussed bearish alternative of shooting star?
The shooting star is a bearish pattern. I guess you are talking about the bullish alternative. You can consider the hammer as the bullish alternative.
suppose i saw shooting star like candle after bearish pattern.obviously it will not be hammer(it has long tail but shooting star like structure has long head). So what can i infer from that?
A shooting star occurring after a bearish pattern indicates more bearishness.
Hi Karthik, If you look at the chart (5 minute interval) of Bharti Airtel on 8th December, a shooting star was formed at 3.20 PM, and as per the above observations, is this a shorting opportunity?
Also, could you please suggest what time interval for the charts is suitable for intraday trading and which candlestick patterns should I watch out for to trade during the day.
Thank You.
Yes, shooting star indicates more bearishness, although I prefer to see that on a EOD basis. For intraday, I prefer 10 or 15 mins chart.
Thank You! And for intraday trades, which candlestick patterns are more beneficial? Single or Multiple? And like mentioned in the chapters, do we have to make observations for two days (at 3.20 pm the first day and the opening observations on the second day) and then continue with the trade on the third day? Or, we could perform intraday trades by observing continuous intervals of the same day?
Both these types of candlestick patterns are quite useful. You need to track the continuous charts for this.
how to find hammer/paper umbrela/Hanging Man ,shooting star/inverted hammer,spinnig top/star Doji in candle stick chart.all are always same,kindly help
Well, you need to scan the charts everyday 🙂
Hi Sir,
What is the meaning of a shooting star in a downtrend ? Is it similar to a hanging man in the uptrend?? Mean the bull have emerged and tried to push the price up, but failed to make a higher close ,but they we successful in not allowing the price to drop further?
From my experience, a shooting start in a downtrend only indicates more bearishness.
Icici bank forming perfect hanging man pattern on 1day candlestick…. Will it go down monday?
Even all the stocks in the bank nifty forms the same pattern and even bank nifty also..
Your guess is as good as mine!
Shooting star*
However i am worried about the moody rating and paytm team up with icici for providing providing short term credit facilities?
Sarthak, you will have to look at things in a holistic way. On any given day, there are several factors that influence the market. You should be in a position to look at these and decide which has a higher impact than others. In this case, Moody\’s rating upgrade has a higher influence on markets than the shooting star, or so I think.
Sir can i start trading with this amount of knowledge(up to single-candlestick-patterns-part-3 ) or do i need to finish every chapters in varsity.?
I\’d suggest you complete TA module completely before getting started.
What is expected when the the shape is exactly reverse of hammer? It has long upper body and then square shaped normal body? The trend is downward in the past two trading session
That would be a shooting start, indicates more bearishness in my opinion.
Hi Karthik,
What do you mean by \”If the current market price is more or less equal to the low price\” in case of shooting star?
Its means just that – CMP = around the close price 🙂
Should we consider companies profile also for short term or intraday trades or just identifying opportunities through charts is sufficient.
Just the charts should help.
If the stock is in downtrend and the shooting star pattern emerge than what does it mean?
If you take chart of Lupin – 29/10/2017
Open – 1002
High – 1021.45
Close – 1001.1
Low – 999
Its previous day close was – 993 … the stock did open gape up and the gape sustained during the day.
Shooting star in a downtrend indicates more bearishness.
Shooting Star comes with an upper shadow which is double the length of the actual body and eventually potential sellings, hence shooting star after downtrend means more bearishness!!
does that mean shorting opportunities??
I\’d be tempted to short based on shooting start, at least on options!
But dont take my word, please do your backtesting 🙂
Cheers Karthik
Hi,
Thanks for this valuable and easy to learn chapters.
i would like to know what time frame we should look at while analyzing the single stick patterns OR What is the general time frame we should look at while doing technical analysis
If you are starting new, I\’d suggest you look at it from EOD perspective.
Hi Kartik,
I really benefitted from your lecture today. Sun TV had formed a hammer yesterday and today it was an opportunity to buy. I just tried with one stock and it worked. My question is , Sun TV was mentioned in Economic Times today that it had formed a hammer and it was the time to buy. But in normal course, in so many stocks, how do I shortlist such stocks as that of Sun TV?
Glad to hear that Vivek!
To scan for patterns, you need to use Screeners or manually track the charts of stocks. Back in the days, I;d spend about 30 mins to quickly scan the charts of Nifty 50 stocks.
Hi Kartik,
Can you please suggest me some online free screeners that I can use ?
Few good ones –
1) https://screener.smallcase.com/welcome
2) Ratestar
3) Screener.in
PVR – 25th September 2017
Is it hammer ?
Still didn\’t work and breached SL.
Am I right ?
And other info for this.
Yes, it did form a hammer but the stop was taken out and eventually, the stock seems to have rallied.
\”Open and close should be almost the same (within 1-2% range)\”
what if the difference is less than 1%?
Also is there any way I can take out the OHLC data of my watch list/workspace for last 3 days to excel from Pi?
I have tried the Link to excel from workspace, but it is coming as N.A in all cells.
Sorry the first question was answered above.
Second question was about getting OHLC data to excel,
I have tried google finance web query.
Works fine except the closing prize.
The closing prize showing in PI is somehow different than the one getting from google finance.
But If I see the last trade prize in Pi it matches with google data. Why this difference?
Does the exchanges calculate the closing prize with some other parameters rather than last traded prize?
Have you looked at this – https://support.google.com/docs/answer/3093281?hl=en
Closing the weighted average of last 30 mins, maybe Google is picking up the last traded price instead?
Thanks karthik.
Feels really good to have some guidance.
I am thinking to automate and detect candle stick patterns through excel VBA, so as to shortlist stocks for detail study.
Hope that works out.
Appreciate your efforts, invaluable for starters like me 🙂
Good luck, Deepak.
Less than 1% is not really a problem. It should work on Pi. I\’d suggest you speak to [email protected].
Hi Karthik!
Under chapter 7.2(hammer),
Risk takers can qualify the day as a hammer by checking the following condition at 3:20PM on the hammer day..
1)Open and close should be almost the same (within 1-2% range)
2)Lower shadow length should be at least twice the length of real body
3)If both these conditions are met, then the pattern is a hammer and the risk taker can go long.
Now as on 15th september 2017 powergrid EOD chart, O=212.70,C=212.50,H=213.45,L=208.10.
This satisfies rule (2) but what about (1) because I really did not understand that \”(within 1-2% range)\” and also how much of an upper tail flexibility is fine?
Thanks Sir.
The difference between open and close expressed as a percentage of open is (213.45-212.5)/212.5 about 0.5%, which is well within the 1-2% range. So you can consider this as a hammer.
Thanks Sir!
But what about the upper shadow flexibility? How much of it in terms of % could we accept?
Thank you
You can have a similar flexibility with upper shadow as well, Siddharth.
Hi Karthik,
Just to confirm, So 1-2 % upper shadow flexibility is fine?
Yes, it certainly is.
if the percentage wise it comes around .5%,as u mention on here in comment cant be that pattern comes under spiningtop?
Yes.
Hi Karthik,
Stop loss seems too close in this pattern. What happens if there\’s a gap down opening?
Thanks,
Ash
The stoploss would trigger 🙂
Say the stock closed at 100 and opens next day at 104 and my stop loss is 102, are you saying the stop loss will still trigger? How would that happen/work, since the market didn\’t give even give the stock a chance to trade at 102 in the first place right? Is that how it works?
No, if the stock directly opens @ 104, then your SL will not be triggered.
Yes, that was what my initial question was. Thanks. What should be done in such cases, will stop loss trigger price work?
SL market is a better option. However, the price you exit at could be really bad.
As we learnt in earlier chapters open value of a particular share should be same as close value on last day, but I have seen in practical difference between open value and close value of last day of an particular share. Please explain what I am missing ?
No, the closing of the previous day and opening of today will be different.
Hi Karthik
When you talk about the position of a risk averse trader, for example in case of a shooting star, the risk averse trader will initiate a trade on the second day after ensuring a red candlestick has formed. So on the second day, we need to see in the start itself if the market is going down, or are we to wait the whole of second day to determine that a red candlestick has formed? And then place an order at the end of the day or third day beginning?
Also, thank you so much with coming up with such an initiative to educate us. Really appreciate it a lot.
If you are risk averse, it is always a great idea to wait for the confirmation. Afterall, you are trying to play super safe here 🙂
Thanks Karthik for the advice. But I always start thinking that if we are waiting for so long, would it get too late to enter the market? For example, Infosys, it has formed a bearish marubozu on Friday, now I am not able to understand what would be the good time to enter. I want to short it, but, I am not sure if it will still fall more down, considering it has already touched a 3 year low. Any advice on this?
Well, this is exactly what defines the risk tolerance 🙂
i have a confusion in rule #1 buy strength and sell weak..this mean buy when the there is bullish trend and sell when it is bearish trend? in this case why i will book loss ? or this means i will profit bcz my selling price will be anyways greater than the price at which bought my shares.
Rule one ensures we stay with the trend. However, we need to stop loss for every trade.
In section 7.3(2ND GRAPH), for BPCL Limited which has formed a hanging man at 593 you have mentioned that both risk taker and risk averse investor will book profit. But I see for the risk taker stoploss would be hit as the next candle’s(3rd candle in the circle) high was above the high of candle of trading day i.e Stop Loss. Please clarify if I\’m wrong. And secondly, how long data consideration you take while determining whether the previous trend is bullish or bearish?
If the SL has been hit, there isn\’t much one can do. You will have to respect the SL level and get out of the trade.
If you are doing a short term trade, then at least 5 – 8 trading session should be considered.
I would like say thanks for sharing this deep chart informating and replys.
If Prior tread is bullish and shotting star pattern made on chart so meaning is bearish will come.
But my question is when prior tread was bearish and shooting star made on chart so what is the meaning?
Regards,
Mehul Kansagra
When prior trend is bearish and a shooting star forms, then it indicates a continuation of bearishness.
Hi Sir, On June 9th has Ultratech cement formed a bullish hammer pattern (on daily chart). Please share your opinion. Thank you.
Sorry, I\’m not tracking that stock.
sorry for the mistake ….it is doji in the uptrend followd by Harami Pattern
Yeah!
For harami formation one of the condition is that the
Open and close should be almost the same (within 1-2% range)
How to calculate the range in terms of percentage?
Is it (Open-Close)/Close?
Yup, you can use the difference between the open and close and divide it over close.
Dear Sir
Has eicher motor formed a bearish harami chart today? As in one year daily chat the harami pattern is followed by a doji formed at the uptrend. should it be read as bearish market to folow in eicher motor.
Not so convincing I guess. Eicher is no way looking close to weak!
I have doubt. In the last chart of this article, the shooting star is highlighted in the circle.
Let\’s assume, If a trader enters the trade by shorting the stock on the next day, he would have entered the market at the opening price of the stock for the day and set his stop loss as the high of the shooting star. Right?
If I observe the candlestick at the end of the day, the stock price has surged. However, it has not breached the stop-loss price (if I understand that correctly). How would the stop-loss get triggered in this case?
If I have misunderstood the chart, Please correct me.
Thank you
Rajan Balana
Quite simple – once you initiate the position, you hold on to it till your target is hit or SL is breached.
Alright. So you mean that we are not doing intraday trade in the above example, right? Because intraday position gets automatically squared off at the end of the day.
Not necessary. You hold till one of it (SL or Tgt) is triggered.
Hello Sir,
Should we use normal Candlestick or Heiken Ashi Candlestick ?
Thanks
You need to read this entire TA module to understand that 🙂
I have read it, you never mentioned heikan candlestick, so we should use normal candlestick but i read it on internet that heikan is better therefore I asked.
Thanks
Yup, I know. We have not covered Heikan, will probably do this sometime soon.
Hi sir,
Incase of hammer and shooting star having very thin vapour upper body (I mean open=close approx)
apart from this all trading setup is same as you explained above for the hammer and shooting star.
my doubt is whether this very thin vapour upper body works fine or makes any differance comparing to small upper body.
It should be ok, not of a concern. Use your best judegment.
Hello:o)
So here I started a trade in LIC at the marked candle with its info visible. Here, it was a perfect prior uptrend, perfect shooting star pattern, perfect above average volume, RSI indicator was even above over bought.
So, after all the \’Yes\’ signals from every technical perspective it was a pretty good trade. But as you can see in the chart it didn\’t go as per the indication. Why so ? It was a pretty perfectly formed trade, agreeing on 5 out of 6 checklist points.
Link
https://drive.google.com/open?id=0B0bePrdjZCDoZWZ0Qy1QRC1MMnc
Well, TA only enhances the probability of a trade, no guarantees in the market 🙂
Oh 😐 as the checklist was agreeing highly my expectation was pretty high 😮
Also, here in this chart. I see a decent prior uptrend, above avg volume, overbought and dark cloud cover but the only problem I see is that the red candle is not covering exactly 50% or above of the previous green candle, it\’s like 1 point higher than the half of previous green candle. So can this be a valid trade as other aspects are pretty good ?
Or as the pattern isn\’t 100% right so it isn\’t a valid trade ?
Link – https://drive.google.com/open?id=0B0bePrdjZCDoYXNOSFBpQjhJNkU
I\’d at the most take an intraday trade hoping for a quick reversal. Trend continuation in charts like this can be sharp – you cannot really time it.
So what you mean to say is that you would go long on this as intraday ?
Also, it formed a doji yesterday with below average volume, so does it catalyze the pattern now ? What should be the perspective now ?
Intraday because the reversals could be quick and therefore I do not want to carry the risk of overnight positions.
But is the intraday even valid ? because the pattern as I mentioned is not covering 50% of the previous green candle.
No, its not. This is only if you were forced\’\’ to take a position.
well i think it can be sayas sa shooting star because the percentge of real body is less than 1%,
m i right?sir.
Yup.
well i think in LIC stock thats not a shooting star because the percentage of real body is not more than 1%,maybe we call it spinning top
m i right sir?
I\’m guessing you are talking about the 13th March candlestick. It looks like hammer to me 🙂
hi Sir, let us assume the daily candle forms a shooting star pattern but on the same day has hit 52-week high and then formed a shooting star pattern. can we still go and short it? or should we just ignore the trade since it has hit 52-week high. Please share your thoughts. Thanks.
Frankly, ATH is a bullish sign. If I were to short this, then it would be because I;d expect a quick reversal – I\’d watchout and be quick to take profits (if any) off the table.
Thank you Karthik, please correct me if I am wrong.
Higher high means, on any time frame if there is an uptrend and present candle which closes above the average number of N number of days and the high of the same candle.
However I am confused in identifying or understanding higher lows.
Please help. Thank you
Higher highs simply means today\’s high point of the day is higher than y\’day high point of the day….and the high for tomorrow is also higher than today\’s high – excuse my sense of past and present sense here – but you get the picture right? This happens when the stock is trending upwards.
Likewise for higher lows.
Hello Karthik,
Could you please explain what is
1. Higher Lows and Lower Highs
2. Higher Highs and Lower Lows
With example please?
Regards and thanks in advance
Higher lows / Higher Highs = means stock is trending up
Lower highs / Lower Lows = means stock is trending low
Look at any trending stock and you should be able to observe this.
Buy Price for a risk taker – He takes the trade on the Hammer candle itself at – Rs.444/-
Buy price for a risk averse – He takes the trade on the next candle after evaluating that the candle is blue at – Rs. 445.4/-
Stoploss for both the traders is at Rs.441.5/-, which is the low of the hammer formation.
Do notice how the trade has evolved, yielding a desirable intraday profit.
How is this a profit ?
It also depends on the profit target for each trader. Also, candle formation is just one variable that you need to check, you still have the checklist which contains all the other variables which has to fall in place for the trade to qualify.
Does lower shadow mean, the lowest price at which bears try to buy or sell share.
It indicates the lowest price point at which a trade occurred.
Does different time frame have different closing price?
Is it like 15 min time frame have the close price of previous 15 min time frame?
Yes, each time frame will have a different close. This is a continuous process, the closing of one time frame is not related to another.
Shooting star example, Are we selling when the shooting star is formed? If yes, then why do we have stoploss to the HIGH when even higher value would give more profit?
Yes, SS pattern suggests you to short. For all short, the high is set as the SL.
I want to ask them all at Zerodha Varsity comment section but from almost a month the comment section is not working. Tried asking for support from Zerodha support but nothing has really solved it.. So, please I\’ll be highly obliged if you can answer my queries here.
1) In the chart below of BPCL
Link – https://drive.google.com/file/d/0B0bePrdjZCDoLVpqSjYzam81SEc5Z0FCNEFYN19Iamx0dFJz/view?usp=sharing
a) The downtrend I\’ve marked is correct ?
b) Is the arrow I\’m pointing to is a red hammer ?
c) The arrow towards volume signifies that the bulls got the price from deep low back to form a doji ? So it\’s bullish and complimenting the red hammer ?
d) By the downtrend, hammer, close to support, fine volume and RSI showing near over sold, I thought it was increase. It increased today so was I logically right ?
e) Stop loss for BPCL was 10-15 points lower. So was it fine to trade ?
2) In the chart below of Cairn
Link – https://drive.google.com/file/d/0B0bePrdjZCDoZ05UUldldWNvQ251aC1nRmM1QW8tTmUtQ3JV/view?usp=sharing
a) Is the uptrend I\’ve shown, is it valid/correct ?
b) The arrow pointing to the candlesticks form a shooting star and a hanging man together ?
c) By the uptrend, shooting star, hanging man, fine volume, close to resistance and touching top bollinger band. I thought it would decrease today. It did decrease till -3 then increased EOD. So was I logically right ?
3) In the char below of Zee
Link – https://drive.google.com/file/d/0B0bePrdjZCDoMGFUWHpDM09pVkNLTlJCUHhQUWM5cVl1bzhr/view?usp=sharing
a) Is the downtrend correct ?
b) Is the 2nd last candlestick forming a green hammer ?
c) So, by looking at the downtrend, a hammer, maybe a dow flag patten, pretty close to resistance and a fine volume I thought it would be a bullish day(that is today). So, was I correct logically ?
4) In the chart below of TataPower
Link – https://drive.google.com/file/d/0B0bePrdjZCDoZWFCWGVVYXFKR04tXzR0OUZZeTY0SGRNMEpR/view?usp=sharing
a) I saw all the checklist ans aspects totally agreeing that it will increase. Which are… Piercing pattern, volume above avg, near support, dow flag patter and even the fibonacci retracement was showing it exactly at 38.2%
So, am I logically right that it\’ll keep increasing as it did today ?
General questions related to charts.
1) If a red hammer pattern forms after a downtrend, it means further the trend is bullish. What I\’m getting confused at is that the volume to be complementing the red hammer should be below the average volume. Because, as it was a red hammer the volume being lower than average would mean that selling is getting weak so therefore it would compliment the red hammer bullishness.
Whereas, if the hammer was green, the volume being greater than the average volume will compliment it as green candle with high volume means bullish.
Am I correct ? Is this same for shooting star and hanging man too ?
BPCL
1) Yes
2) No, it is a long legged doji
3) Yes, but doji;s signify indecision
4) Yes, as long as other trade conditions are satisfied
CAIRN
1) Yes
2) Yes, both the patterns are present
3) Yes, it did seem like a good trade (assuming other checkpoints were valid)
Zee
1) Yes
2) Yes
3) Yes
Tatamotors
If everything aspect of trade is aligned, then it should be good for a trade as the conviction is on the higher side.
Good luck.
Hello, if a red hammer forms that means its gonna b bullish. So to compliment it shouldn\’t be the volume be below average? Because below average volume for red hammer will mean weak hands selling which will compliment bullish hammer instead of above average volume for red hammer. Same thing for shooting star and hanging man?
No, both are kind of mutually exclusive. One should not associate a pattern with \’likely\’ volume. Analyse it as it happens. Any pattern with low volume indicates less conviction in the pattern (price action).
tried a little bit sir. i works well on trending market.
any others indicator sir with its paramaters ?
MACD, Bollinger Bands etc.
kartik sir please suggest some indicators that works comparatively well in intraday chart and their parameters based on 5 min and 15 chart?
Have you looked at simple moving averages?
sir,
you are saying to go for short around 3.20pm if hanging man appears. but the shorting is only for intraday. does that mean that the trade is only for appx 10 mins?
Yes, shorting in spot is only on an intraday basis. However, you can short the futures anytime and carry forward the positions overnight.
Hi Karthik,
Is their a facility available with Zerodha wherein I can automate trades based on TA. to give a perspective if Zerodha has a facility wherein if Marubozu is formed in NIFTY option the trade is automatically initiated with target and SL?
Not exactly, but you maybe interested in this – https://zerodha.com/expert-advisors/
Does fundamental analysis required in commodity trading? I mean should I go for learning fundamental analysis for intraday trading in crude oil (15 min chart)? Please give me full advice as there is inventory? But what about balance sheet as I am not trading in equity.. Please clarify me… Thanks in advance..
If you are trading intraday or even for few trading sessions, then TA will help.
hii i found a pattern with following detail
O: 3,636.00 H: 3,638.00 V: 1.60k C: 3,632.00 L: 3,632.00 D: 24/01 13:45
CRUDEOILM17FEBFUTVOLUME
volume is below 10 period average ( moving average)
it is a red candle marubozu pattern??
can i enter the trade for sell @3632 with sl 3638and tgt 3623 ????
well thanks today also made profit of 11 point
For the given stock price, I would consider this more as a spinning top and not a Marubuzo.
Sir which strategy will work best for mcx crude oil? Can I trade only using single patterns specially rectangular one(marubozu)…. Can I use only marabou for crude oil mcx with support and resistance ????
All Ta patterns work on Crude!
please provide me back testing detail for this statergy in pi and can i use this stetargi in kite ? which will be better kite or pi?
for intraday 15 min chart
I WANT SCRIPT CODING FOR FIRST SINGLE CANDLE STICK PATERN i.e marubozu for both bear and bull
Please email – [email protected] for this. Thanks.
Both are excellent platforms. Pi allows you to backtest. We do not have this feature yet on Kite.
I found a marubozu pattern and hammer and it\’s goes positive got 20 points profit thanks thanks thanks thanks a lot… I placed sl as you said but was unable to place target as I can\’t find resistance and support level. Please provide any indicator that can give me resistance and support level for 15min chart in intraday (crude oil)
A lot of people appreciate pivot calculator to identify the S&R levels. I\’m personally not a big fan of the this. However, you could give it a try and check if it works for you.
Good luck.
Could any one please explain how short trade will work out in the bearish pattern if we buy the stock on closing price of p1 day.if i\’m not wrong in short trade we will sell first and then buy but these two actions to be completed on the same day otherwise it would results in short delivery
Hemanth – yes, if you are shorting the spot, then it results in short delivery. However, you can short the futures and continue to hold it overnight.
Hi Karthik,
Why should there be a \”stoploss\” set (hanging man pattern/shooting star) when the trader is initiating short trade.
When you short you expect the price to go down…what if it goes the other way i.e the price goes up? Clearly, one needs a stop loss.
From your reply I understand here stoploss means \”buying\” the stock. (Squaring off in terms of \”Short\”)
Yes, specifically in this context you square off in order to contain the loss.
Dear Sir
https://kite.zerodha.com/share/T7HNPNBLD1.png
is it making a hanging man correctly at around 2:30 PM and is it right to check the intraday movements with 15 min chart??
It is a hanging man. Yes, 15 mins is a lot better compared to 5 or 10 min time frame.
In the shooting star second chart what should be the target price if there is stop loss 1453 & buying price 1417?
In the last chart of the shooting star why is it going on in up trend after shooting star because the shooting star is a bearish signal?
Thanks
The target can be any price that you think is realistic. Also, a chart pattern does not assure returns, its just that odds of being successful increases.
I see
Thanks for reply
Welcome!
Hi karthik ,
In the above chapter you explained about the shooting star appearing in an up trend (then there is a possibility of the stock to become bearish).
now my question is, if the same pattern(shooting star) appers in a down trend then what we have to expect out of the stock (POSSIBILITY IS BULLISH OR BEARISH)????? please give me some clarity on this sir.
Thanks&Regards
Shooting star as such indicates bearishness…its more pronounced when it appears at the top end of the rally.
Hi Karthik,
In all your examples you have quoted that \”The risk taker initiates the trade the same day after ensuring that the day has formed a shooting star\” with respect to all candle sticks. I am little confused here. What benefit does he get if he initiates trade after pattern is formed on the day.On a bearish day or the candle forming which indicates bearishness how does the sell high buy low work if we were to trade at the end of the day.Sorry if this sounds silly or dumb 🙂
By initiating the trade the same day, a risk taker gets a better price and therefore a better return on the overall trade. However, as a trade off, he also stands to lose a lot of money if the trade goes against him. Hence the term \’risk taker\’.
You need to short the stock to benefit from bearish patterns.
Thanks karthik
Welcome!
is there a chart which gives values of support and resistance for a particular stock
No, you will have to use the charts to identify the S&R points.
thanks kartik for your response but you did not answer
Is the length of real body a representation of the volume of trade.
Is the real body a net result of buying and selling.I find the real body color fluctuating between red and blue and then ending with a red or blue..
On checking i find many candles with long real body show less volume than candles with small real bodies.
also noticed that some shadows or patterns like Doji show high volumes.You said these shadows are part of price action then why there is no real body.
Am i un derstanding it clearly? Pls clarify.Thanks
Sorry, I missed that. Length does not necessarily translate to volumes. The candle evolves during the day (note its a function of the price action)….so the color gets decided only after the closing prices are fixed.
Dojis are formed when the opening and closing prices are one and the same. I\’d recommend you read the chapter on doji\’s to understand them better, along with all the different variations of Dojis.
Does the shadow signify real trade taking place.
Is the length of real body a representation of the volume of trade.
Can the umbrella, shooting star patterns be applied to intraday trades.
The shadows indicates trades – in fact it is a part of the price action. Yes, you can use these patterns to execute intraday trades.
thanks kartik
Welcome!
i find u have mentioned the hanging man reverses the uptrend and hammer reverses downtrend. however does the shooting star validate the end of only an uptrend??? what if a shooting star is formed in a downtrend?? kindly explain kartik
There is no shooting start at the end of a downtrend. However, if you do find a shooting star in a downtrend, it just indicates that the downtrend is likely to continue. This is because the shooting star is characterized by large upper shadow and the closing is near the low point of the day.
For 7.5 – The shooting star under the example of OHLC share, why is the Stop Loss set at high 1453? I mean, the actual purpose of Stop Loss is to prevent a major loss, right? So, shouldn\’t it be set for a value 1410?
The beauty of candlestick pattern is that each pattern suggest a stoploss that would suite the pattern. So as per the shooting star, the SL is best when placed at the high of the pattern, hence 1453.
The job of a SL is to prevent losses, and it has to be placed where it is deemed relevant, and you take such trades only if the reward also seems good enough.
Hi Karthik,
The material out here is just outstanding and written in such easy to understand lucid language, congrats to you and your team for putting these up together.
I have a question here though, I am talking about Nifty50 candlestick pattern for yesterday i.e. 5th July 2016.
Market is on a downtrend and at 2:15PM what we see, is it a shooting star and does that mean the market can do down further from here?
Thanks Puneet!
The pattern on 4th is more like a shooting star/grave stone doji, which suggests that the market is likely to go down.
If I am not mistaking, then the blue color hammer indicates a buy call and the red color hammer indicates a short call. Am I right?
Blue indicates bullishness and red indicates bearishness. On a standalone basis, they do not really give out a buy/sell signal.
Hi Karthik Sir,
Can i consider Day candle of Indusind bank is Doji or Hanging man?
Regards,
SaikiranGarapati.
Looks more like a hanging man to me!
Hi Karthik Sir,
Can i consider Yesterday HDFC BANK formed a Hanging man? Small tail is there in uppers side of the candle. Can i flexible about that tail?
Regards,
SaikiranGarapati
It does, you could consider a short…but it would be scary to carry the short position overnight as the reversals could be sharp and you would be caught with a wrong trade.
May i know reason behind why reversal could be sharp and on what basis?
Usually when the trend is strong, traders always wait for opportunities to enter a trade in the direction of the primary trend. Hence reversal in secondary trend could be sharp.
So How do i know whether trend is strong or not? Do we have that one in our Varsity modules? Please tell me the diff b/w Primary and secondary trend?
Suggest you read this – http://zerodha.com/varsity/chapter/dow-theory-part-1/
Hi….I know we can sell shares even when we do not hold them but we need to buy back on the same day. Now imagine a stock which is following a bullish trend and I happen to spot something that tells me that the stock would go down in the next few days (but I do not know exactly when). Now is there a way I can sell this stock and then wait for some days to buy it back?? (I mean a case where I do not have to buy in on the same day)
Thank you!
Yes, you can hold short positions and roll over in the Futures market.
That\’s correct but all stocks do not allow you to trade in Futures and Options right?
Yup, not all stocks are in F&O.
Dear Karthik,
One question on shooting star.
As you mentioned the stock/index has to be in a prior uptrend/bullish trend for the validation of a shooting star when it is formed.
Now consider this continuous downtrend in JAN 2016, after such a long downtrend there would be 4-5 days of upside/up candles ie an uptrend in a downtrend, if the shooting star is formed after this 4-5 days uptrend will it hold good as a reversal pattern and if yes how strong would it be. Can we trade that with confidence.Thanks
It does, but typically I see this as a low volume retarcement and I expect the prior trend to continue. More details on this in the Volumes chapter.
in the checklist its mentioned that with candlestick pattern formation see also for high volume.
so this rule will be applicable for hammer formation also or not as hammer has small body and long shadow( so that means low volume) ?
Volume criteria is applicable to all CS patterns.
so this pattern will not be a good trading opportunity as volume is not higher than previous days?
Its hard to conclude that Rohan. Yes, volumes are important but one has to look at things from a larger perspective. Consider everything in the checklist and then take a call.
Hi Karthik,
1. If i doing nifty option intra-day trading. where i can apply the 5min or 15min time frame. I mean Underlying (Nifty) or contract price chart (Nifty JAN 7400PE) and which one is most reliable?
2. Which combination of indicators and overlay most suitable for intra-day and Moving Average Combinations.
1) Always the underlying
2) I personally like the 9 x 21 minute EMA crossover.
Sir, you said 9*21 minute EMA crossover, my doubt is if I am looking on 10 min chart , then how can I draw 9minute*21minute crossover??
After the first nine 10 mins candle, you can develop a 9 EMA of a 10 mins candle. Similarly, after twenty one 10 mins candle, you can develop a 21 EMA of a 10 mins candle.
21 ten mins candle means 210 minutes or 3+ hours. That means to form a 9*21 minute candle, I will have to wait upto 12.30 in the noon?
Not really, Vishal. This is where the continuous charts help. You can always plot these EMAs on continuous intraday charts.
length of body= 10
high-low-= 55
body % = 10/55 *100= 18%
so will this candle qualify for hammer?
Yes, you can treat this as a hammer.
Hi Karthik,
Can i consider last candle as a Hammer?
Regards,
SaikiranGarapati.
Looks like the upper shadow is not meeting the criteria. Can you please double check for that?
Ok..Thanks..
Hi Karthik, I can see a hammer formation in TCS chart with prior down trend but not sure about the support level. Volumes and RSI looks good to me. Am I correct?
Sorry, Tata motors chart
Yes Sir, things are aligned here.
Hi karthik, how will you interpret this chat
Hello,
In order to confirm that a prior trend is DOWNWARD(or UPWARD), for how many trading sessions does the stock need to trade BEARISH(or BULLISH)
Check for at least the last 5-7 trading sessions.
Dear Karthik,
1).You had earlier advised me, as a newbie, I should first try my hand at Swing Trading before going for Intraday If it takes 5-7 trading sessions to confirm a trend, does this mean for swing trading I have to wait 5-7 Days to initiate a trade? Does this mean a max of only 4 trades in a month? (I am planning to do this full time – after I fully understand everything of course)
2) As a newbie, instead of starting of with Swing Trading can I start with Options? Or would you still recommend I begin with Swing Trading before Options? If yes, could you tell me why?
Options is a tricky subject, there are many factors at play. I\’d suggest you get familiar with it before attempting options. Yes Swing trading requires patience both in terms of trade identification and trade evolution, but its this patience that will teach you greater things about market. Good luck.
Dear Karthik,
OK sir, So I should start out with Swing trading. Pls give me some more clarity on points below: (sorry if they sound too silly)
1. If it takes 5-7 trading sessions to confirm a trend, does this mean for swing trading I have to wait 5-7 Days to initiate a trade? Does this mean a max of only 4 trades in a month?
2. You have said in your lessons that the lookback period for swing trading should be 6months to 1 yr+. If I\’m looking at say 6months, is it monthly candles(6 nos) or EOD (120+ candles)?
3. And what we are looking for in the Look back period is for similar patterns /candle formations . Am I correct?
4. How many such identical occurrences should be present in the Look back period for us to initiate the trade?
1) If you have a basked of 50 stocks in your watch list, then I\’m certain on average you can find at least 1 opportunity per day
2) EOD Candles for at least 6 months
3) Yes patterns, support, resistance, and other technical cues
4) Depends upon the pattern
Hi,
I believe that short selling is only possible for a one day trade. i.e buy in the morning and square off before 3.15 then how come in the Hanging man section the author has mentions to short at the close of the next day.
\”For the risk averse, a short trade can be initiated at the close of the next day after ensuring that a red candle would appear \”
How can we short at the close of day ?? am I missing something ??? Please reply
If you short in cash segment, then you will have to buy back by 3:15. However of you short in derivatives (futures segment) then you can carry forward the position.
Apart of single and multiple candlestick patterns
Please throw some light on heiken ashi pattern, I have observed they are more reliable and strong as compared to standard single and multiple candlestick pattern for long or short term as trend is more clear there.
Sure Varun, maybe sometime soon. Currently working on Option strategies.
also, if i am only doing intrday-trading, is knowledge of single candlesticks enough?
Regards,
dian
No, you will need to develop an overall understanding. Suggest you learn both single and multiple candlestick patterns.
Hi Karthik,
For intrday trading, what time frame should i select for candlesticks?
Regards,
Dian
Sorry i forgot to attach a Screen shot?
Still don\’t see the chart!
Can i consider attached TCS Screen shot as formed a Hammer? and Please let m eknow target and stoploss,Support and Resistsnace
Sir
Great going.I want to do swing trading.wat time frame is perfect for that?is look back period of 6months OK?
I would suggest you use both 6 months and 3 months data.
Thank you for creating this wonderful tutorial. I have one query though. In the given daily chart of PIIND,
i) There is a clear downtrend before P1 and P2.
ii) Volumes of P1 is above 10 day\’s SMA and P2 is around 10 day SMA.
Which pattern is more prominent here? Should we consider P1 as hammer (body:tail = 15:25)or P2 as bullish engulfing (though opening of P2 is not below P1-close)?
Rajat – the chart looks good, I suppose its take from Kite 🙂
For all practical purpose, I would have initiated a long trade based on the hammer (on P1) but upon seeing the Bullish engulfing on P2, I would be encouraged to hold the long position. I would take the lower point between the two i.e P1\’s low as the SL for this trade.
Thank you for replying. Yes, that was Kite\’s chart. Zerodha is providing everything to traders, software, technical knowledge, community. Very happy to be with Zerodha.
Good luck Rajat!
Excellent explanation of candles -to see the candles as INDIVIDUAL. Thought process behind candles is thought provoking.
Thank you karthik
Glad you liked this and thanks for the encouragement.
Pls. refer to section 7.3 – \”The hanging man is classified as a hanging man only after it precedes an uptrend\”.
Shouldn\’t it read as \”The hanging man is classified as a hanging man only if it is preceded by an uptrend\”.
Or maybe \”The hanging man is classified as a hanging man only if the prior trend is an uptrend.\”
Makes sense, will do the change 🙂
No pattern is a sure shot pattern to win.
Agreed. Like I mentioned, the odds increase but not guaranteed.
Karthik, Cipla as can be seen is trading in a channel. as indicated by the red arrow a shooting star was formed and the stock did correct the following day albeit, with lesser volumes. in such cases do you go short with the lower trend line as the target? or should we also worry about the trend continuing and treat the correction as a retracement? what are your views?
Since the stock is in a good up trend I would hesitate to short the stock. Instead I would look low volume retracement maybe till the lower channel to initiate a buy.
ok, and the previous resistance at 740 levels, wouldn\’t that matter?
I\’d keep an eye at that level, however I would pay more attention to the channel\’s lower level as the stock is trending upwards.
low volume retracement till lower channel,what does it mean, kindly elaborate?
This indicates weak hands getting out of the system – possible reversal in the market.
Hi Karthik,
Stop losses which you suggest, are they based on closing basis or just trading basis…
Regards,
Afshin
Closing basis ideally.
Hi Karthik, after a sustained up move a shooting star was formed yesterday. The volumes were strong too. today, though it was a black candle day the volumes were poor. my question is, could this be a re tracement after a strong upsurge, which would mean the bullish trend would continue or can we conclude the bearish trend has set in. how would you play this trade?
From a 1 – 2 day perspective I would look at setting up a super quick short trade on Futures…but would be quick to book profits and get out. If the stock declines on low volumes, I would be happy to initiate a long.
appreciate your views Karthik. my follow on question is , when an identifiable candle stick pattern is formed on either a new high or a low , is it to be treated differently as opposed to the same being formed at a major resistance or support level? The dilemma is to know weather the reversal , either bearish or bullish is a minor retracement or a genuine one. please comment.
Karthik, would like to read your comments on the above.
Madhu – If the formation is at a recent new high/low then do watch out for previous S&R levels for cues. Else if it is a \’All time\’ new high/low then look for super short trades (maybe frequent but make sure you book profits). The reason I say this is when a new high/low is formed the sentiment in that direction is strong and the secondary reaction to this market sentiment may not last long…in fact the trend can reverse back to primary with a sharp reversal. Hence one needs to be diligent while trading all time high/low.
Hi Karthik,
Is there any specific reason why Inverted Hammer pattern is not discussed. Is it not so important?..
Inverted hammer found at the top end of the rally is called the \’Shooting Star\’. We have discussed the same. Inverted hammer found at the bottom end of the rally is not really of any great significance, hence we have skipped it.
Sir if there is red hammer at the bottom of a downtred what does it signifies?
The colour of the Hammer does not signify anything. Just treat it as a regular hammer at downtrend (bullish).
A Question
Shouldn\’t the closing price for the day and the opening price for the next day be the same? I saw a few graphs here which are not following this.
Take the last graph of morning star for example, the open of the candle succeeding the morning star is way above the closing price!! Why does this happen?
It closing and opening price need not be the same. They would vary due to various overnight demand supply situation.
Hi Karthik,
Is SHOOTING STAR and INVERTED HAMMER the same?….If not, what is the difference?
Thanks 4 ur time.
ROBIN
Yes they are the same, an inverted hammer formed at the top end of the rally is called a shooting star. However an inverted hammer formed at the bottom end of the rally is not called a shooting star.
Hi Karthik. Keep going with this nice work. Pl clarify my doubt given below.
Why should I keep lower of the pattern candle as a stop loss. Whynot mid value between low & close ( incase of red candle ) or open(incase of blue candle)?
by this way i could save some more money incase pattern fails na?
Or is there any science beyond this?
– Kgm Kishor
The low of the pattern (in case of bullish patterns) is that point where the bearish sentiment was low and bullish sentiment got a bit stronger..hence it is intuitive to believe prices would bounce back whenever it hits this low point. For this reason, the low point acts as a good SL.
_/_ Karthik
🙂
In the above chart can i consider the highlighted candle as Bullish harami?
After confirming the candle as bullish harami with sufficient volume, i took position on that point but ended up in loss.. Any specific reason behind that?
Well, remember by employing TA techniques you are enhancing the probability of success, while success itself is not guarantee. So yes, trades can result in a loss even if factor involved in making a trade decision is perfect.
Regret for the wrong query.. As highlighted initially there is a formation of Bullish harami with sufficient volume & can look for buying opportunity & immediately there is a hammer formation… But the prior was not the downtrend, there is a small uptrend.. whether can i again consider this as also the buying opportunity?
There is nothing like a wrong query, we are all learning and evolving 🙂
So, the same thing holds true here – cant be considered as a trend because we need at least 5-6 candles prior to the pattern.
Image for the above comment..
No, an uptrend should have at least 5-6 upward trending days…likewise the downtrend should have 5-6 downward trending days …before you can classify them as an uptrend or downtrend.
Can i consider the highlighted candle as Harami & can go for long, eventhough the prior is the small uptrend?
Im actually 21.. Just studying the basics.. {in the previous comment its \’morning star\’ nt \’morning start\’ . Im nt into infesting fr long time..l prefer intraday trades… . Suppose i but some shares (selecting MIS) .is it mandatory that i should sell the same day..can i sell after a couple of days, weeks or even a month.. ?
can i have an email id of urs so that i could ask doubts through..
mine\’s [email protected].
Im actually 21.. Just studying the basics.. Im nt into investment..l prefer itraday trades… . Suppose i but some shares (selecting MIS) .is it mandatory that i should sell the same day..can i sell after a couple of days, weeks or even a month.. ?
can i have an email id of urs so that i could ask doubts through..
mine\’s [email protected].
MIS should be squared off the same day. Also, I would sincerely suggest you try out buy-hold strategy to begin with. Graduate to intraday once you are comfortable with it. Please ask all your queries here…I usually respond as quickly as possible.
Sorry Kartik pl see this chart instead
Same answer as above.
Why dint u mention about morning start in the chapter
.. But many people have mentioned in their doubts and comments
im sorry i coudnt find it in the chapter.. Went twice… ,
2nd one is.. I need some free software\’s to plot graphs..by which i mean candlestick patters… It should be colourful (my ease) 😉
im interested in itraday trades… So i would like to plots 10mins graph fr whole day…say it can be 5min,10mins,15mins.. Any timescale to be precise… I would just like to input the last traded price every nw and then and the software should make a graph fr me.. R8 nw , say today… I made graphs (oscillator) for 1min graph fr 2hr time span. Just kept refreshing the last traded price every second.and plotted. .
waiting for ur comments on this.. ..
Morning star is a multiple candlestick pattern and we have discussed the same here – http://zerodha.com/varsity/chapter/multiple-candlestick-patterns-part-3/
Check out wwww.chartink.com, they are quite good….although I\’m not sure if they provide intraday data.
Dear Mr.Kartik,
Kindly see the chart ( Nifty daily chart of 6April, 15. There is a Hanging man in uptrend but there is strong support is there, also MACd has crossed and pointing UP.( below zero line.) In this case how do u interpret this for next day?
Like I have mentioned in the chapter, my dependence on hanging man is low, in fact more often than not I would treat a hanging man in an uptrend as as indication of continuation of bullishness. Also considering the fact that it has broken above the support, my view is biased towards being bullish….or to put it another way, I may avoid initiating a short trade under such circumstances.
Hi Karthik, What does a shoting star mean after a downtrend?
I believe a shooting star in a downtrend further emphasizes the fact that the market is weak (bearish). Think about this – if the market is indeed trying to showcase strength then the long shadow of the shooting star would not have formed.
This is reversal or not
This looks like a morning star although the last candle should have been higher than the red candle.
Hi Karthik,
First I must congratulate you and your team for putting up a tremendous effort in building such a reference on Stock trading et al.
Can you explain if we can use ATR(Ave. True Range) to get the Stop Loss as 1.5 times ATR. How far is it dependable as compared to Support /Resistance method?
Thanks.
Thanks for the kind words 🙂
ATR is a good method to place a SL as it incorporates the recent volatility of the stock while placing a SL. I would tend to believe this is sort of more dependable than S&R. In fact in the \’Options Theory\’ module (which is work in progress) we will include a chapter on volatility and a method to place SL based on this. I suppose this will be a better technique to place SL.
Hi Karthik,
Can i consider this as Hammer ?
Thank You,
I guess you can, it also appears to be a nice trade set up, good luck with that 🙂
Thank You 🙂
Hi Karthik,
Section 7.3 Hanging man. In the second chart (BPCL Limited), wouldn\’t the risk taking trader who would have initiated trade on the same day when hanging man has formed book loses on the next day. High on day 1 is lesser than the high on the next day. Basically stop loss would have been hit on the next day for the risk taker. Can you please let me know if I\’m missing something.
Day 1 high is greater than day 2 high so SL would not have been triggered for the risk taker on day 2. However on day 3 the high was almost the same as day 1 high. But my guess is this would have just peaked and cooled off almost immediately. Also it really depends on how you manage SL. If you take SL on closing basis then I guess the SL would never have been breached. However if you are the kind of trader who tracks SL real time, then my guess is the trade would have been closed due to a SL breech.
How come day 1 high is greater than day 2 high ?? I t is visible to me that day 2(risk averse day) high is more than day 1 high or SL . As such SL will have breached
Quite a possible scenario, Arun. Can you elaborate with an example?
Hi Karthik, this training is absolutely mind blowing effort of yours. I do have one request can you please explain about the philosophy of stoploss in a bit more detail and with some examples (graphic as well as written), as it sometimes becomes confusing when clarity on stoploss is not available. For me stoploss simply means that whenever i buy a stock i should put a stoploss at some % after which it will get sold automatically.
Thanks Rahul!
1) I have explained the logic of keeping a SL here – http://zerodha.com/varsity/chapter/support-resistance/
2) I will also explain the logic of keeping a SL when I talk about Volatility and its application in the Options module
Hearty Gratitude for prompt reply. I was going through the modules stepwise and hence not reached that chapter. Waiting eagerly for your options module . 🙂
Thanks Rahul, the first chapter on Options will be out next week.
oh… just understood when I read it again… the long shadow on paper umbrella is on down, and in shooting star its on top… right?? thanks
Absolutely 🙂
Hi, Thanks for providing great info on tech trading.. After reading the lesson, it feels like shooting star and hangman almost similar… Could you please advise me how to differentiate between a shooting star and a hangman in a chart. Thank you.
second last image in shooting stars was confusing but got clarified in comments, would be better if you replace it for future references, thanks
Will do 🙂
More often than not *exciting* the trade is the best thing to do when the stoploss triggers – correction *exiting*, thanks
Sure, thanks again 🙂
How trade set up be if we see shooting star on weekly chart.. Where should be stop loss and target??
Sorry I meant stoploss and entry point…
Same as that of an EOD chart.
As a thumb rule – the longer the time frame you are looking at, the deeper the stop loss. So even if you see a SS on a weekly chart the SL will be at the high of the candle. Its just that the SL will be a bit deeper.
Hey,
Please see the chart and let me know whether the encircled pattern can be considered as Hammer or not? And does next candle in making nullify bullish impact if at all previous one is hammer?
My argument for considering it as hammer is there was substantial downside from top 8600 in nifty to 7900 and than we saw this candle on WEEKLY chart.. Being higher time frame chart, does it have more impact on overall trend of market?
Considering you are looking at a weekly chart, yes you can consider this as a hammer. If this was on a EOD chart it would NOT be a hammer as the downtrend is not really satisfactory. I would like to see at least 5 – 8 downtrend session before a bullish patter emerges.
If we are looking at weekly chart, as in chart how come we can consider it as hammer as there should be a downtrend prior to it and i can see only two candles in downtrend prior to it?????
Two candles of downtrend in a weekly chart are quite a bit – it represents 2 full trading weeks of data.
could u please explain what is meant by long trade in \”A hammer formation suggests a long trade\”??
A long trade is when you intend to buy a stock at a certain trade with an intention of selling it at a higher rate at a later point and thereby make a profit on the transaction. A hammer patter is used to identify such opportunities.
Hi CHVSSR,
The second one is not a shooting star as it appears in a visible downtrend. Shooting star\’s prior trend must be up. But, that can be considered as bullish engulfing pattern considered the first green candle after the inverted hammer.
CHVSSR – I would agree with Jagadeesh.
SHOOTING STARS RIGHT
sir in your chart in shooting star there are shooting star in between the trend how to identify the real shooting star to trade , as you have said ss will be formed at the top of an up trend , how could i know that is the top to trade in next candle , can any body predict the top and bottom in stock market , post mortem is okay when it is happening how to identify the real shooting star .
You are absolutely right. Timing the market is a tough job. However, whenever a candlestick pattern (like shooting star) appears after a supporting prior trend, you just make an assumption that the trend\’s top or bottom may have been formed…and go ahead and trade with conviction. If you do not make this assumption then you will be stuck in a dilemma not knowing what to do.
sir you can avoid 50 % of your false shooting star by , taking the position above or below the ss candle on closing basis .
sir you can avoid 50 % of your false shooting star by , taking the position above or below the ss candle on closing basis .
Not sure about the 50% claim, but yes one should look at initiating actions on a closing basis. In fact that is the reason why through out the module I have specified the time of entry as around 3:20 PM…which is very close the the market close (3:30 PM).
Do we not have an analogous pair to shooting star at the bottom of a downtrend like Hammer @ bottom -> Hanging man @ Top. Or that candlestick does not have a practical significance?
Interesting, think about it..a shooting star in a down trend can only mean more pain 🙂 Hence I guess it makes sense to consider it as a confirmation for the trend continuation.
could call it \’Dead man\’!!
🙂
I was a staunch fundamental analyst , but reading your article made me want to learn about technicals also.
Very informative and interestingly put modules from you. Great work and thanks.
I would like to learn one thing at a time ,, so have started with candlesticks.
Validating if I have learnt right
1) that which occured today(21-11-2014-) on Kotak Mahindra Bank is a Shooting star Theoretically?
Though there is a small lower shadow there i m ignoring it because of the size of the upper shadow
2) that which occured today (21-11-2014) on Karnataka Bank qualifies to be called a Morning star ?
If yes then even though DAY 3 was gap up opening but DAY 2 was not a gap down opening. Is day 2 being gap down an important criteria?
REGARDS
Thanks Guatam, I\’m glad you are liking the modules.
1) Yes, Kotak has formed a \’sort\’ of a shooting start but trading this is not easy as the stoploss is quite high.
2) No because the morning star formation should have a prior downtrend which is missing in this case. Therefore it does not qualify as a morning start.
Thanks but funnily I traded in ktkbank today making a good profit only thinking that it was a morning star pattern (completely missed the downtrend part) ….. seeing Gap up opening , morning itself took a position………now feeling like laughing at myself … LOL
Anyways thanks a lot.
lol 🙂
Sir reading GAUTHAM K S comments.. by mistake he has taken a wrong call [morning call confusion] and still made a profit.. how come ?? so how reliable are these candlestick charts and patterns ?? Also I have been observing from last few days these candle stick pattern formations for intraday in live market.. on 5 min chart and a few times have seen that even after a pattern [satisfying the required conditions] is formed like bullish marubozu, hammer or shooting star the stock dosent moves in desired direction. for example.. after a perfect hammer I expect the price to move up for atleast next 2 candles on 5 min chart but the price moves down after hammer or even in some case after a bullish marubozu.. Sir please explain this… Regards
Sameer – candlesticks or any technical factors only enhances your odds of making a profit but never guarantees a profit. If you have made money and still cant figure out why, then attribute it to luck. As far as patterns are concerned – the higher the time frame the higher is the reliability.
Sir thanks a lot for the prompt reply.. Regards..
🙂
if suppose same case occured in downtrend then is that called morning star
Downtrend = Morning Star, Uptrend = Evening star.
HI Karthik Got IT how to upload image , now see today\’s Chart Can u please help me with few candlestick Patters in intraday where i would have got benefited
I glanced through the chart, and was able to spot few marubuzos and shooting stars 🙂
Hi Karthik
Sorry to ask this silly doubt , i want to attach one chart from Google finance here but not able to do so can you please help me how to attach here
The easiest way is to take a screenshot and save it as jpeg 🙂
Hi Karthik
In Intraday which indicator is More Supreme candlesticks or Oscillators( RSI , Stochastic) from the time varsity was lanced i am following the charts can see that oscillators are very powerful and almost superseding any other indicators
I would suggest you pay more attention to candlesticks.
Sure but what to say feeling more confused when I get to candlesticks it will be of great help if you can help with few screen shots with diffrent types of candlesticks in intraday and the market following accordingly
Sure, will do that as soon as I can. Thanks.
So that means, when a particular stock is range bound, we need to consider the trade only after the appearance of marubozu or a range breakout as this pattern doesn\’t need any prior trend. Am i following you Karthik sir??
In fact you can trade the range itself, check this chapter where I\’ve discussed about it.
i have read it like 4 times sir. i can say excellent is an understatement for all these articles..
Thanks Jagadeesh, please stay tuned for much more to come 🙂
what does rangebound means?
If the price oscillates within a range, then its called range bound.
Dear sir what is the main difference between hanging man and shooting star.as they are bearish in uptrend.
Both are bearish patters. The shooting star has a long upper shadow which emphasizes the bearishness a bit more than a hanging man.
This is a Chart from 15minute time frame, the stock made an Intraday low and then it started moving up, however after 3 bars, it made a Paper umbrella, so should i look at this as a Hammer (bullish signal) or as a Hanging Man (bearish signal) and why?
That would be a Hammer and not a hanging man. It is not a hanging man because a hanging man requires a well defined up trend which is missing in this case.
Thanks a lot Sir for your timely help 🙂
I didn\’t understand this chart can you please explain this chart sir
Ronnie – we are discussing about the 8th candle from the right. It has formed a bullish hammer which as per the pattern suggests the trader to go long on the stock. In fact the same chapter section 7.2 discusses this pattern in detail.
Karthik – what about 13th candle from right? That also seems to be a hammer followed by downtrend. But after that stock moved down?
I\’m not sure if we are looking at the same candle, are you referring to the one with a very small upper shadow? Anyway, candlestick patterns do not guarantee price movements, it only enhances the probability of the move to happen in the expected direction.
hi ,if candlestick dont garante the price movement then who gurantee the price movement?
No one guarantees anyone anything in the markets.
don`t u think that the stop loss would have been hit as per SECOND LAST CHART?
SL should be on closing basis or intra basis?
Yes, in fact someone else has pointed that out in earlier comments…
sorry didn`t read previous comments 🙂
Let us look at this example: Open = 100, High = 100, Low = 94, Close = 102 (bullish candle).
how can high be 100 if close is 102??
Oops that a typo, thanks for pointing this out. Will rectify it right away.
Sir,
Any study on relation between candle stick pattern in different time frames?
Candlestick can be applied to any timeframe. However my experience says higher the timeframe, the better is the reliability of the signal.
In the shooting star lesson, consider the 3rd chart : an example with scrip price of 174…
For the risk taker stoploss would be hit as the next candle\’s high was above the high of shooting star high. Plz clarify if am wrong.
Thanks…
Charles, you are right. The SL and the candle\’s High are very close, SL could have been breached for risk taker.
Thanks. Also need to know do any of the candlesticks work intraday.
Yes, they do..as long you are looking at the candles in the right way.
what about multy time frame strategies with candle stick ?
Keeping it simple is the key 🙂
I guess the last two example patterns in \’The shooting star\’ candlestick are interchanged. Its causing confusion.
Let me check this, Prashant. Thanks for pointing it out.
How to acurate in 5mn or 15mn …look for 5mn in hammer candlestick but in 15mn there is no hammner candlestic…help
I\’d suggest you stick to 15 mins charts.
Hi Kartik,
I have a basic question. In case of shooting star you are talking about shorting the trade. As the stock is turning into bearish we are coming out of the trade. Hen e why is stop loss set at higher price? A little confused with this explanation.
Rekha, either you square off an existing position or you can initiate a fresh short position. If it is a fresh short position, then you need to have a stop-loss.