
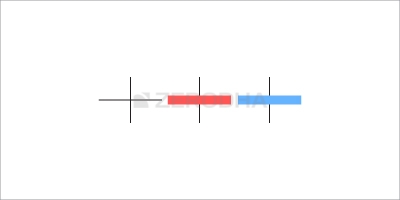
6.1 – The Spinning Top
The spinning top is a very interesting candlestick. Unlike the Marubuzo, it does not give the trader a trading signal with specific entry or an exit point. However, the spinning top gives out useful information concerning the current situation in the market. The trader can use this information to position himself in the market.
A spinning top looks like the candle shown below. Take a good look at the candle. What observations do you make concerning the structure of the candle?

Two things are quite prominent…
- The candles have a small real body.
- The upper and lower shadow is almost equal.
What do you think would have transpired during the day that leads to creating a spinning top? On its face, the spinning top looks like a humble candle with a small real body, but in reality, there were a few dramatic events that took place during the day.
Let us follow these events:
- Small real body – This indicates that the open price and close price are quite close. For instance, the open could be 210, and the close could be 213. Or the open could be 210 and close at 207. Both these situations lead to creating a small real body because a 3 point move on a 200 Rupee stock is not much. Because the open and close price points are nearby to one another, the colour of the candle does not really matter. It could be a blue or a red candle, what really matters is that the open prices and close prices are near to one another.
- The upper shadow – The upper shadow connects the real body to the high point of the day. If it is a red candle, the high and open are connected. If it is a blue candle, the high and close are connected. If you think about the real body in conjunction with the upper shadow ignoring the lower shadow, what do you think had happened? The presence of the upper shadow tells us that the bulls did attempt to take the market higher. However, they were not really successful in their endeavour. If the bulls were truly successful, then the real body would have been a long blue candle and not really a short candle. Hence this can be treated as an attempt by the bulls to take the markets higher, but they were not really successful at it.
- The lower shadow – The lower shadow connects the real body to the low point of the day. If it is a red candle, the low and close are connected. If it is a blue candle, the low and open are connected. What do you think had happened if you think about the real body in conjunction with the lower shadow ignoring the upper shadow? This is pretty much the same thing that happened with the bulls. The presence of the lower shadow tells us that the bears did attempt to take the market lower. However, they were not really successful in their endeavour. If the bears were truly successful, then the real body would have been long red candle and not really a short candle. Hence, the bears’ attempt to take the markets lower can be treated as an attempt, but they were not really successful.
Now think about the spinning top as a whole along with all its components, i.e. real body, upper shadow, and lower shadow. The bulls made a futile attempt to take the market higher. The bears tried to take the markets lower, and it did not work either. Neither the bulls nor the bears could establish any influence on the market as this is evident with the small real body. Thus Spinning tops are indicative of a market where indecision and uncertainty prevails.
If you look at a spinning top in isolation, it does not mean much. It just conveys indecision as both bulls and bears were not able to influence the markets. However, when you see the spinning top concerning the chart trend, it gives out a compelling message based on which you can position your stance in the markets.
6.2 – Spinning tops in a downtrend
What if the spinning tops were to occur when the stock is in a downtrend?
In a downtrend, the bears are in absolute control as they manage to grind the prices lower. With the spinning top in the downtrend, the bears could be consolidating their position before resuming another bout of selling. The bulls have also attempted to arrest the price fall and have tried to hold on to their position, though not successfully. After all, if they were successful, the day would have resulted in a good blue candle and not really a spinning top.
So what stance would you take considering that there are spinning tops in a downtrend? The stance depends on what we expect going forward. Clearly, there are two foreseeable situations with an equal probability:
- Either there will be another round of selling.
- Or the markets could reverse its directions, and the prices could increase.
Clearly, with no clarity on what is likely to happen, the trader needs to be prepared for both the situations, i.e. reversal and continuation.
If the trader has been waiting for an opportunity to go long on the stock, probably this could be his opportunity to do so. However, to play safe, he could test the waters with only half the quantity. If the trader wants to buy 500 shares, he could probably enter the trade with 250 shares and wait and watch the market. If the market reverses its direction, and the prices start going up, then the trader can average up by buying again. If the prices reverse, the trader would most likely have bought the stocks at the lowest prices.
If the stock starts to fall, the trader can exit the trade and book a loss. At least the loss is just on half the quantity and not really on the entire quantity.
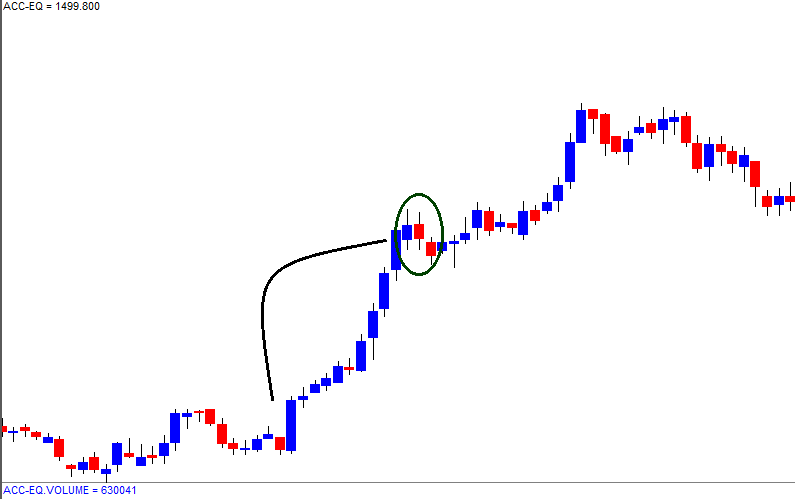
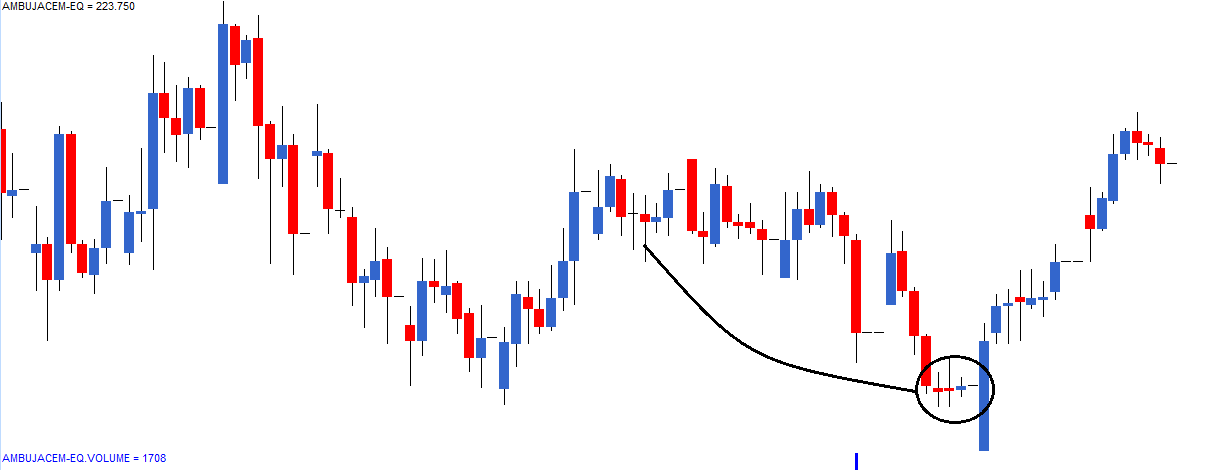
Here is a chart, which shows the downtrend followed by a set of spinning tops. The stock rallied post the occurrence of the spinning top.
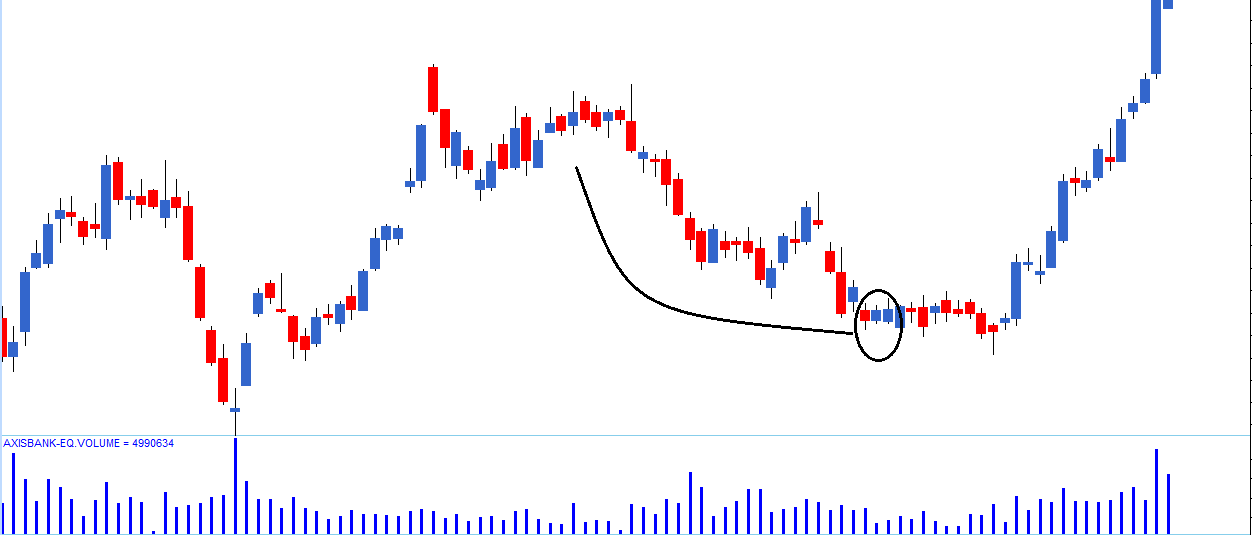
Here is another chart which shows the continuation of a downtrend after the occurrence of spinning tops.
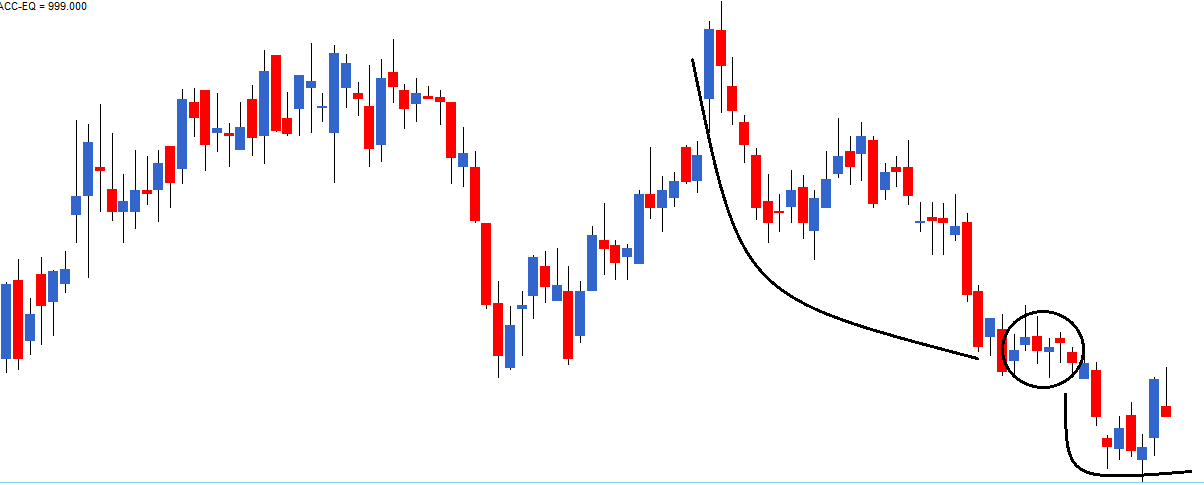
So, think about the spinning top as “The calm before the storm”. The storm could be in the form of a continuation or a reversal of the trend. In which way, the price will eventually move is not certain; however, what is certain is the movement itself. One needs to be prepared for both situations.
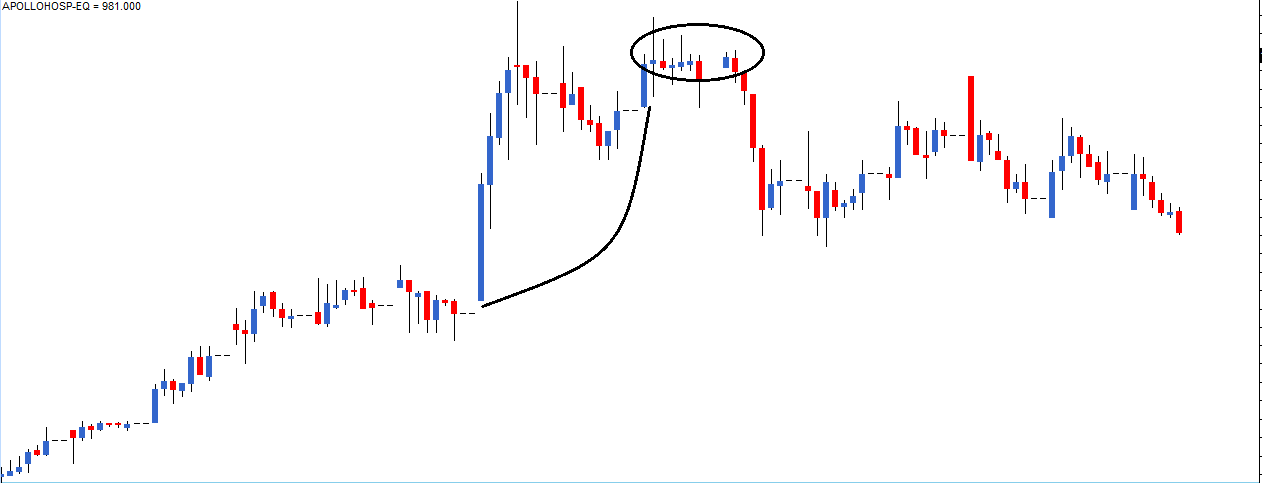
6.3 – Spinning tops in an uptrend
A spinning top in an uptrend has similar implications as the spinning top in a downtrend, except that we look at it slightly differently. Look at the chart below, what can you see and what would be the inference?
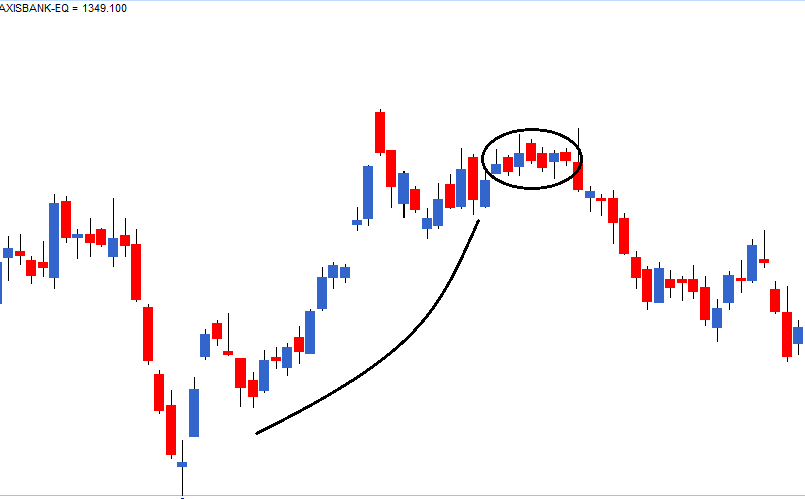
An obvious observation is that there is an uptrend in the market, which implies the bulls have been in absolute control over the last few trading sessions. However, with the occurrence of the recent spinning tops, the situation is a bit tricky:
- The bulls are no longer in control; spinning tops would not be formed on the charts if they were.
- With the formation of spinning tops, the bears have made an entry to the markets. Though not successful, the emphasis is on the fact that the bulls gave leeway to bears.
Having observed the above, what does it actually mean, and how do you position yourself in the market?
- The spinning top basically conveys indecision in the market, i.e. neither the bulls nor the bears can influence the markets.
- Placing the above fact in the context of an uptrend, we can conclude two things…
- The bulls could be consolidating their position before initiating another leg of the up move.
- Or the bulls are fatigued and may give way to bears. Hence a correction could be around the corner.
- The chances of both these events taking place are equal, i.e. 50%
Having said that, what should you do? The chances of both events playing out are equal, how are you going to take a stance? Well, in such a situation, you should prepare for both the outcomes!
Assume you had bought the stock before the rally started; this could be your chance to book some profits. However, you do not book profits on the entire quantity. Assume you own 500 shares; you can use this opportunity to book profits on 50% of your holding, i.e. 250 shares. Two things can happen after you do this:
- The bears make an entry – When this happens the market starts to slide down, and as you have booked 50% profits at a higher price, and can now choose to book profits on the balance 50% as well. Your net selling price will anyway be higher than the current market price.
- The bulls make an entry – It turns out that the bulls were indeed taking a pause and the rally continues, at least you are not completely out of the market as you still have the balance 50% of your holdings invested in the markets.
The stance you take helps you tackle both the outcomes.
Here is a chart showing an uptrend, and after spinning tops, the stock rallied. By being invested 50%, you can continue to ride the rally.
To sum up, the spinning top candle shows confusion and indecision in the market with an equal probability of reversal or continuation. Until the situation becomes clear, the traders should be cautious and minimize their position size.
 6.4 – The Dojis
The Doji’s are very similar to the spinning tops, except that it does not have a real body. This means the open and close prices are equal. Doji’s provide crucial information about the market sentiments and is an important candlestick pattern.
The classic definition of a Doji suggests that the open price should be equal to the close price with virtually a non-existent real body. The upper and lower wicks can be of any length.
However keeping in mind the 2nd rule, i.e. ‘be flexible, verify and quantify’ even if there is a wafer-thin body, the candle can be considered a Doji.
Obviously, the colour of the candle does not matter in case of a wafer-thin real body. What matters is the fact that the open and close prices were very close to each other.
The Dojis have similar implications as the spinning top. Whatever we learnt for spinning tops applies to Dojis as well. In fact, more often than not, the dojis and spinning tops appear in a cluster indicating indecision in the market.
Have a look at the chart below, where the dojis appears in a downtrend indicating indecision in the market before the next big move.
Here is another chart where the doji appears after a healthy uptrend after which the market reverses its direction and corrects.
So the next time you see either a Spinning top or a Doji individually or in a cluster, remember there is indecision in the market. The market could swing either way, and you need to build a stance that adapts to the expected movement in the market.
Key takeaways from this chapter
- A spinning top has a small real body. The upper and lower shadows are almost equal in length.
- The colour of the spinning top does not matter. What matters is the fact that the open and close prices are very close to each other.
- Spinning tops convey indecision in the market with both bulls and bears being in equal control.
- Spinning top at the top end of the rally indicates that either the bulls are pausing before they can resume the uptrend further or the bears are preparing to break the trend. In either case, the trader’s stance has to be cautious. If the trader intends to buy, he is better off buying only half the quantity, and he should wait for the markets to move in his direction.
- Spinning top at the bottom end of the rally indicates that either the bears are pausing before they can resume the downtrend further or the bulls are preparing to break the trend and take the markets higher. Either case, the trader’s stance has to be cautious. If the traders intend to buy, he is better off buying only half the quantity, and he should wait for the markets to make a move.
- Doji’s are very similar to spinning tops. Doji also conveys indecision in the market. By definition, dojis do not have a real body. However, in reality, even if a wafer-thin body appears, it is acceptable.
- A trader’s stance based on dojis is similar to the stance taken when a spinning top occurs.
How we can trade better if we want to trade on Spin top candle can we wait when next candle break high of spin top for uptrend or low of spin top for downtrend
Spinning top as such is not a pattern basis which you can place a trade. As explained, it just conveys indecision in the market. You will have to combine spinning top with other aspects of market and make a decision.
Hi, i want to understand that when you say there is uptrend or downtrend, it means that the observation is for a few days or trading sessions. But what if someone wants enters a trade in between just by looking at any previous candle and the trend is not clearly seen. As can been seen from the example charts, patterns have formed in between the trend you have shown. What if one enters a trade in between.
Whenever you want to enter, you can just always observe for the previous sessions right? YOu have that option.
Hi Karthik,
I have completed TA module before. Now I am again going through it but this time I am learning it practically by opening the charts and understanding. While I do that, Shall I also start FA module parallely? Or should I complete the TA module practically first, gain enough confidence and then start FA module?
I think since you are doing TA for the 2nd time, I feel the learning will be faster and better. You may as well focus fully on TA, finish it, and then move ahead to FA?
Perfect, Thanks
Happy learning 🙂
Hello Sir / Madam,
I think Takeaways from Chapter point no.4 last line seems to be incorrect
4.Spinning top at the top end of the rally indicates that either the bulls are pausing before they can resume the uptrend further or the bears are preparing to break the trend. In either case, the trader’s stance has to be cautious. If the trader intends to buy, he is better off buying only half the quantity, and he should wait for the markets to move in his direction.
I think if Spinning top at the Top means Trader need to Sell-off 50% of the qty, rather buy at these level. Can you please amend the Takeaway Point no. 4
Thanks Deepak, need to check on this again. Will do.
Hi Karthik Sir i don\’t see the above rectified or amended
This chapter is really helpful and clearly explained — thank you for the work that’s gone into creating this article.
I wanted to share one small observation as a woman reader and a technical writer.
The repeated use of “he” for a trader, even though unintentional, subconsciously creates a bit of distance while reading and makes the examples slightly harder to relate to.
Using neutral terms like “the trader” or “they” could make the content feel more inclusive without changing the meaning at all.
Sharing this purely as constructive feedback, thank you.
Shravya, I agree, its an inadvertent mistake from my side. I wrote these chapters long ago where I was less sensitive towards these aspects. But I\’ve changed overtime and all my writing over the last 5 years have been gender neutral 🙂
AT WHAT TIMEFRAMES ARE WE SEEING THESE CANDLES ?
Mostly EOD, unless specified.
Same question. But what do you mean by EOD ? We have to check them at 3.20 pm or do we select Daily ? And i am still confused about what to see: Daily, weekly or monthly charts, depending on what? Can you please clarify in which conditions we need to see Daily or weekly or monthly charts please ?
EOD = End of Day.
For this, please select daily chart.
suppose I profit target hit and again can I target another profit point and if then how ?
Of course, you can.
can you explain this point from upper shadow –
If it is a red candle, the high and open are connected. If it is a blue candle, the high and close are connected.
Thats right. Based on the day\’s movement the open and close points change but of course, the high and low points are same.
A red candle indicates that the price of the asset has decreased within that specific time frame. Therefore, the asset closed at a low price compared to its opening price. Which implies High will be near Open and Low will be near Closing Price. And the opposite is a Blue candle, the opening price will be lower than the closing price, or the Closing price is higher than the opening price within the specific time frame. Therefore, High will be near Close and Low will be near Open.
Bullish candle = Open and low will be in the same region and then close and high
Bearish candle = Open and high will be in the same region and then close and low.
How do you place SL if we are initiating a trade based on The Spinning top candlestick ?
Your SL will be based on the candle pattern you are trading based on. Spinning top itself is a not a tradable pattern, right?
Can you explain us what is trend like upword and downword trend?? how we identy is the stock is in which trend ?and if we take the factor of trend ,so time frams matters??
Hmm, have explained all this and more in this module, Prince. Request you to please check.
Is spinning top required to have a small body? and also wil unequal shadows work?
Small body, unequal shadows work and can be considered as a spinning top.
Hi Karthik ,
But you have mentioned spinning top, the upper and lower shadow is almost equal.
Almost equal is fine, but not mandatory.
Hello
I couldn\’t find the Doji and Marubuzo candles in \”candlestick pattern study\” in zerodha kite.
The candlestick pattern study shows spinning top, Piercing pattern, Engulfing. Hanging man & Harami.
Ah, these are mainstream patterns and it will show up if there is a pattern. Request you look back with more data points and check again.
so Rule 1 that states we buy strength and sell weakness does not apply here? Like we can buy or sell regardless of the colour if a spinning top or doji is spotted?
Yes, hence I mentioned that.
sometimes i feel guilty for being able to read such high quality content for free
We will take that as a compliment 🙂 Happy learning!
Very true. Thanks karthik
Sure, wishing you the best! Good luck.
Karthik, does zerodha provide paper trade facility in kite for learning trading before entering into market? If not available, can you kindly guide me on safe paper trade software?
Not really, but you dont really need one in my opinion. Try doing this – why dont you buy really tiny quantities of shares (like 2,5, or 10), and place actual trades? This way your exposure is really low plus you get to experience real markets. Way better than paper trading I feel.
If you are using Chrome browser, you can install Paper Kite extension. It would allow Paper trading on Kite itself – please go through its documentation on how to go about it – there\’s only some places which allows you to paper trade.
Suggestion: After you have done your paper trading, it might be a better idea to remove this extension.
As far as I understood, a Spinning Top signifies indecisiveness in the market, also indicating consolidation. Please correct me if I am wrong, but I think just a short real body is enough for that. Do we really need to have (almost) equal upper and lower shadows for that? Even when they are not almost equal, I think it still conveys the message. Am I wrong?
Yes, shadows are not that significant compared to the size of the real body.
Hi Karthik,
Is the colour of the candlesticks like hammer & shooting star also significant in deciding which way the trend is likely to move/continue?
For eg: if a green shooting star is formed in an uptrend, does it mean the trend won\’t reverse (since bulls are still in control)
Not really. The colour of the candle does not really matter for these patterns.
What candles are they Day wise or 1 hr or others
Most are day wise, unless specified.
Thanks Karthik.
Welcome!
When Doji or spinning top formed it says indecisive and we really can\’t make any decision.But can we make any decisions by analysing the volume and the technical indicators whether the price would go uptrend or downtrend when Doji or spinning top is formed?
Yes, you can combine doji or spinning tops with other candles and draw inferences.
I have a few questions.
1. How to differentiate between marubozu and a spinning top? for marubozu, In the comments you have given formulas and if the value is within 0.2 to 0.3 % then it can be called marubozu. Is there any range for the spinning top?
2. You have mentioned timeframes. Consider for example, I want to buy a stock. If i look at 15 or 30 min time frames, the candles may vary compared to 1 day timefame right? How should I decide on what time frame should I look at? Is it like if I want to keep a stock for 1 week, then I have to look at 1 day timeframe?
1) The distinction is very easy visually itself. If the upper and lower shadows are missing with only real body, then that is a Marubuzo. For spinning top, the real body is wafer thin.
2) You need to fix up on the time frame and then trade accordingly. You should not be mixing up time frames. For example, if you have taken a trade based on EOD chart, then you should not look at a 30 min chart and change your decision, especially after you\’ve initiated a trade.
HI Karthik,
Both in case of doji and spinning top, does the trader test their luck without have stop loss? in none of the example you have provided you have explained about SL. please clarify.
Doji or Spinning top does not suggest a trade on its own. You will have to combine it with some other pattern, and that pattern will invariably have a stoploss.
The candlestick pattern varies with respect to the observed time period, like, min, hour, day, week. to understand the position, which time period need to be observed especially for swing trading. Thanks.
I\’d suggest End of day timeframe.
can you please explain average up in detail? i tried through various rescources but could not understand it.
Sure, but you need to share the context in which you need the explanation.
Did you eventually create any tests for readers to practice and get a hang of the concepts? I don\’t see any conversation here for the past few years.
There check this – https://zerodha.com/varsity/certified/
What candlestick pattern occurs when there is no upper shadow and no body length but there is lower shadow present, so it is like in shape of T but with no body ?
Is it paper umbrella or is it doji ?
That would be a doji.
Does spinning tops need to have equal shadows/wicks?
Not necessary 🙂
kartik sir,i hav a small question as said earlier that we hav to look in EOD chart ,what it mean like last 15 mint or 30 mint chart for a fresher like me.
Thank you
It means the chart of the stock to understand price behavior around the closing time of the market.
I have a basic doubt ….i have understood all the candlestick patterns but I haven’t understood under what time period do I have to see the candlesticks so as to predict how stock will move …as 5 days ..1 week ..1 month all have differnt candlesticks …so for what time period do I have to see the candle sticks
I\’d suggest you stick to end of day, Samedh.
Hi sir
Iam new to stock market
Please provide road map to learn stock market
Like what to learn first
Please start with module 1 – https://zerodha.com/varsity/module/introduction-to-stock-markets/ and then progress to other modules. Good luck and happy learning!
I correct myself. The statement is not true when the timeframe is day as the day opening price need not be previous day closing price.
Cool. Happy learning 🙂
For whatever timeframes, closing price for Candle should be open price for the subsequent Candle. However, I do not see this happening. Sometimes it is and many times opening price of subsequent Candle is either less or mor than previous candle. Could you please throw some light?
No, thats not true as the opening price and the closing price are different and not the same.
What is the time window on which we need to analyse the doji on any trends and take action – 5min, 15mins, 30mins or a day?
You can choose any time period, Gowrish. My suggestion is end of day candle.
What exactly is end of day candle ? Is it daily charts or minutes charts? End of day means at 3.20 pm we have to observe ?
EOD charts means the chart that is formed for the given trading day. At 3:20, we do get a fair idea of what the EOD chart will look like, hence I suggested 3:20 PM.
I am unable to access chapters 5.2 onwards , is it just me ?
Try another browser?
is there any way to quantify that on a given day real body is small, for example is it the percentage limit (less than 2%) or is it in respect to high and low that if difference between high and low and the length of real body in ratio of 4:1 or more than we have a spinning top,
what I really want to understand is like in previous model we were able to create a limit of 0.2%-0.3% shadow length can be ignored in marubozu can such limits be made in this case also
Yes, you can calculate the range of the day and compare that to the overall range of the candles maybe over the last 10-12 trading session to get a sense of how big or small the candle\’s range is compared to the recent past.
So far I have found these articles so good for beginners. No need to pay to Finflue bla bla.. Just go through tech analysis and other modules(if you wish to).
Thank you Author.
Happy learning, Mohit!
Key takeaways correction!
Point 4. Appearance of Doji or spinning top on top of uptrend, One has to sell their 50% position not buying. I might be wrong or had wrong point of view.
Checking. By the way, sell or buy depends on the prior period trend.
In a downtrend/uptrend for spinning top, wouldn\’t it be more beneficial in buying 250/500 shares and shorting the remaining shares, so the trader will make some margin, if the trend moves either ways?
Ah no, spinning top indicates indecision in the market, so how can you figure which way the market turns?
Sir for entry seeing the spinning top or doji what should be ones stop loss?
You dont really initiate a trade based on these patterns, Rakesh. So there is no SL based on doji and spinning top.
If the day closes at 500 why doesn\’t it open at that price the next day?
That is because the opening price for the next day need not be the same as the closing of the previous day.
Thank you so much for you reply!! How can I get started with USDINR futures?
I\’m suggesting this only from learning perspective, so please do keep that in mind as your trade USDINR. I\’d suggest you talk to your broker and they will help you get started on this.
Thank you, another doubt here Karthik,
1. How can I figure out what works best for me- as in the trading style, considering facts that I am in my early 20s with a median salary and already invested in debt schemes and willing to put the effort and the end goal being consistent returns. I consider myself on the side of a risk taker. Is options trading worth it if you have got the knowledge around it
2. Also spare few words on paper trading and how different is it when it comes to real-life trading.
Sorry for pooling all these queries together. An in depth answer will be highly appreciated. Thank you so much in advance
1) Since you are in your 20s, maybe you should look at investing in EQ schemes rather than debt. Also, there is nothing like consistent returns. Markets are choppy, and returns can be lumpy. You need to prepare yourself for this volatility in markets.
2) Paper trading is good, but misses out on the big aspect of \’human emothions\’, as its paper money. One better way would be to consider USDINR futures instead of paper trading. The margin for 1 lot is less than 2K, and gives you the sense of real trading. of course, this is just my opinion 🙂
Happy learning!
Hey Karthik, if doji and spinning tops essentially just indicate confusion, and also that both patterns can either lead to reversals with 50% chances – then how are doji and spinning tops different?
Apart from the body size of it being wafer thin and short size respectively. I\’m sorry but why are these two made different when they ultimately bring you the same thing.
They are not very different in terms of behavior. The only difference being the presens of a real body in spinning top. But when i see these two, I kind of treat them the same.
Is a hammer and hanging man always green in color?
Not necessary, Aman.
I am not very clear with the spinning top candlestick\’s 500 stocks case. How will the trader make profit by entry of bears?
Sorry, what do you mean by 500 stocks case? Need more clarity on this. Can you share more context?
The analysis made on these patterns holds good for all time period or it is specific to certain periods like 15min 1hr or entire day?
You can use it across any time frame. But I\’d suggest you use it for EOD or higher. If for intraday, then maybe 10 or 15 min, nothing lower.
Does volume play any role in figuring the spinning top/Doji might turn a certain direction?
Yes, it does.
After how many units of any timeframe can we say that the trend is upward or downward?
At least 6-8 candles, with about 8-12% movement in prices.
Sir in this section : Assume you had bought the stock before the rally started; this could be your chance to book some profits. However, you do not book profits on the entire quantity. Assume you own 500 shares; you can use this opportunity to book profits on 50% of your holding, i.e. 250 shares. Two things can happen after you do this:
The bears make an entry – When this happens the market starts to slide down, and as you have booked 50% profits at a higher price, and can now choose to book profits on the balance 50% as well. Your net selling price will anyway be higher than the current market price.
Sir, didn\’t understand how can selling price be higher than current market price.
So assume you have 100 shares, 50 of which you sold today at 500 per share. After that, the stock falls, and it is now 400. YOu sell the balance 50 shared at 400. Your average selling price here is 450, right?
If both shado are equal and closing are near to opening. And bull a d bear try their effort to pull up and pull down. And they made equal unresulted effort, then what is the meaning of red and blue
That would result in a perfect doji, Satya. Here, the color of the candle does not matter. What matters is the price action, in this case it signifies both bulls and bears are in equal control.
In section 6.2 Spinning Top chapter it says \”If the trader wants to buy 500 shares, …\”. Firstly as per candle stick principle , \”Buy in strength and sell in weakness\” ? Why will I want to buy in \”downtrend\” firstly? Or Am I missing something here?
You\’d buy with the expectation that trend would reverse.
Hello karthik
In a spinning candle here it says that the body should be small and wicks should be equal in size but what if the wick is uneven/even with larger size?
That\’s also fine, Nithin. The main thing is that the real body should be small.
I want to buy the Chart software please let me know whom i need to contact?
Hi,
I have a few questions:
1. Regarding candlestick patterns, what should be the maximum percentage change between the open and close prices to consider it a spinning top candlestick pattern ?
2. If the open and close of a candlestick are close , at what length of upper/lower shadow (either relative to length of real body or open/close price) could we consider this a spinning top candlestick pattern ?
3. As per my understanding, spinning top needs lengths of upper and lower shadows to be approximately equal. Does Doji pattern also need lengths of upper and lower shadows to be approximately equal or do lengths of upper and lower shadows need not be equal ?
1) There are no fixed values as such. In general, the closer the better.
2) The shadows don\’t matter much. What matters in a spinning top is the fact that open and close are near the same
3) Not necessary, the shadows can be unequal in both spinning top and doji
At the cost of repetition, please include some tests in between, may be after each module. Thanks
PLease do check the mobile app. Also this – https://zerodha.com/varsity/certified/
what is the time frame in given charts ??
End-of-day charts.
Hi,
What do you mean by \”consolidation\” in the context of \”bulls/bears would be consolidating their position\”
Thanks
Sir, is it compulsory for the real body to be smaller in spinning tops and if yes than the reason for it.
Yes, a small real body is what defines a spinning top. A larger real body would result in a regular candle.
Hello
Whether it be a spinning top in an uptrend or downtrend, the probability of the market either going up or down is 50%. Then why is the explanation above indicate buying in a downtrend and shorting in an uptrend? Is there any specific reason or is it random?
Thank you
We don\’t take any actions basis spinning top alone, right?
Sir, If u put certain questions at thend of each Chapter that will do some better chance to acquire knowledge since the students trace out for apt answer looking the content again. Correct answer may be given at the end of next chapter. Is it workable?
I\’d suggest you check the app, there is a quiz at the end of each section.
Can we trade doji on demand/support zone in the direction of price movement ??
Yup, you can.
Where is it mentioned about software in this chapter?
Sorry, which software are you talking about?
Thank You Sir!
Can you please explain how range is calculated?
There are two ways Prag –
1) Take the difference between open and close, divide by close
2) Take the difference between high and low, divide by either high or low (maybe high)
They both gives you the range.
Respected Sir,
Greetings of the day. I love reading your content and thanks for sharing this valuable content for free on the internet. Could you please tell me what should be the stoploss for trades initiated because of the occurence of a spinningtop or a doji?
Glad you liked the content. For all long trades, choose the pattern\’s low point and for all short trades, you can choose the pattern\’s high point.
What all modules I should complete before jumping into trading?
I\’d suggest basics and TA.
Its been 8 years now, but tests has not been uploaded here
Which tests? Please check the Varsity app.
Got it. Thanks Karthik for explaining.
Happy learning!
Hi
Can you please explain this term in spinning top in downtrends \”However, to play safe, he could test the waters with only half the quantity. If the trader wants to buy 500 shares, he could probably enter the trade with 250 shares and wait and watch the market. If the market reverses its direction, and the prices start going up, then the trader can average up by buying again. If the prices reverse, the trader would most likely have bought the stocks at the lowest prices.\”
I got confused in last two statement in the above quoted text. if the market reverses it\’s direction mean upwards so it\’s suggested to buy more. In that case \”if the price reverse\” what does it mean, reverse to downtrend or reverse to previous statement. If it\’s reverse to previous statement\’s market upward movement, in that case traded has already bought again 250 shares at higher price not the lowest.
Can you please help me understanding those last 2 statements.
Thanks
Manish, what I\’m trying to explain here is you transact at half the quantity first and then wait and watch for how the stocks react. If it moves in the same direction as you\’d expect, then you transact for the other half (here you average the prices on the higher side), else if the stock moves in other direction, then you hold or square off, at least your exposure is for just half the quantity.
Thanks Karthik. Varsity is bhagwad gita of stock market. I really enjoyed reading it.
Big words! But I\’m glad you liked the content, happy learning 🙂
The spinning top has upper shadow and lower shadow which are equal as you said. Incase the upper body is somewhat more length than lower shadow.. based on this can we predict the market is going to be bearish?
That\’s still ok, the main criterion for the spinning top is the short real body.
These modules are great! I just wanted to ask, at what point should one pull the proverbial trigger and start investing and putting this knowledge to use? Is there a specific module, that, after we are through with it (if we are studying the modules in order), enables us to start investing or is it something else?
I think a good way to start is by actually looking at one pattern, getting comfortable with it, identify opportunities in the market based on that 1 pattern and getting started. It could be one, two or even 3 patters to get started 🙂
Hi, Karthik Rangappa thanks for this amazing and awesome unique module piece related to TA. with Great minimal Ui and unique images you guys crush the part of content marketing. You and all the Zerodha team are awesome and your ecosystem is great and works well across Mobile devices and Desktop.
Thanks for the kind words, Anshu. Happy learning 🙂
Your article’s are simple and clear to understand. Keep up this work.
Reading your article, it seems inferring market and trading are understandable and easy to learn.
Glad you found the content interesting. Happy learning, Manoj!
What\’s the time frame used in these charts? Monthly, weekly or daily?
Mix of all, Kiran.
Sir
For intraday how much previous candles we want to see for trend if any candle form. In 15 minutes chart sir
See for at least the previous 5 to 8 days.
Sir
What last 5 – 8 trading sessions .last 5- 8 candles or day
If you are looking at 5-8 days, then it will be 10 min/15 mins candles for the last 5-8 days.
Sir
How much candles we see previously in 15 minutes chart to insure it is a trend or trend will be changing .
At least for the last 5-8 trading sessions.
What do you mean by \”Consolidating the position\”?
I saw you used this term 2 times, but i didn\’t get what does this mean?
1. The bulls could be consolidating their position before initiating another leg of the up move.
2. With the spinning top in the downtrend, the bears could be consolidating their position before resuming another bout of selling
Consolidating means that you add to your existing positions and build slowly. Usually, consolidation happens at around the same price range. For example, buying a stock at say 600 and thereabouts over a 2 – 3 week period is called consolidating a long position at 600.
Hi
Can u tell whether we need just 1 or at least 2 spinning tops to confirm the pattern ?
Thanks !
There is no specific number as such, Rahul.
Thanks Sir for making such a valuable content and that also free of cost. Technical analysis is now like walking on a cake. This courses are available in market for minimum Rs5000, but you have done a great hardwork and provided us this free of cost.
If possible then please make a book published of all this content, I would love to read it and gift it to my friends who want to learn about markets without getting influenced from outside forces.
Thanks again
Thanks for the super kind words, Naveen 🙂
For now, everything we have made is available online. Dont have any plans to publish a book anytime soon 🙂
What should be the ideal size of the real body in spinning tops? for eg. 10% of the range or some percentage of the stock price? How do we quantify that the real body is small?
Smaller the better. Hard to quantify, ensure the open and close is around the same price. Make sure the length of the lower shadow is at least 2x the size of real body.
when you see the spinning top concerning the chart trend, it gives out a compelling message based on which you can position your stance in the markets. What does it mean, when it priorly says indecisive spinning top? What should be our stance, no buy or sell?
In most cases, its just wait and watch 🙂
Sir, please start online course for technical analysis on our zerodha platform. Because only theoretical it is not understanding.
That will be tough, but what is it that you are looking for?
\”The colour of the spinning top does not matter. What matters is the fact that the open and close prices are very close to each other.\”
sir,In spinning top what is the atmost size of real body in terms of percentage?
Its very hard to generalize the percentage. I\’d suggest you look at it from the open and close perspective. The difference between open and close should be very less.
What is the timeframe that is used, in charts used in this article ?
Is this something obvious that I am missing ?
Let me know please.
Its a mix of EOD and intraday time frame.
Respected sir,
First of all thank you for this material. It’s a great read.
My question is if there is spinning top/doji in uptrend can we plan to short?
Not really Nishant. These candles just indicate indecision in the market, and they don\’t really call a trend.
Do the bulls and bears(big traders or investors) control the market for real and to their tune we, the retail traders, decide whether to sell or buy stocks?
It\’s a function of all traders, Abhay.
Multiple spinning tops / dojis occurring in cluster at almost same price range – strong suggestion of calm before the storm / indecision.
Individual spinning top/doji or multiple spinning tops/dojis but at different price levels within a cluster – weak suggestors.
Is this correct? More meaningful understanding or it doesn\’t really give any additional information?
The first interpretation is correct, not sure about the 2nd one, Umesh.
Sir, In the first table theres a major gap between the closing and the opening day.
How can a stock\’s price jump that high suddenly?
and what causes it?
many thanks in advance.
This can happen due to the overnight change in supply-demand dynamics, which itself changes due to the news flow.
Hi Karthik,
It seems that the Marubozu and spinning top or TA in general, would be useful only to day traders since by T+2 days it would be too late to act on the conclusions we get from the patterns. Is my understanding correct? Or am I missing something by which I can leverage these pattern even while trading in CNC?
It is best to use TA for positions that are held anywhere between a day or up to few weeks, Surya.
I didnt understand this under the spinning tops after uptrend section.
The bears make an entry – When this happens the market starts to slide down, and as you have booked 50% profits at a higher price, and can now choose to book profits on the balance 50% as well. Your net selling price will anyway be higher than the current market price.
Shirish, its about trying to get a better average for your sell. Think about it this way – you sell some at 100, sell some more at 110, your average sell price would be 105.
So we are doing a BTST trade
BTST or you can continue to hold it.
Hello Sir,
I was reading the documentation of the technical analysis but had a doubt , i see that in the candlestick pattern following a pattern of p1 and p2 it\’s said to go long/buy on that time as 3:20 pm on the p2(for risk-taker) but if we are interested in intraday trading why are we buying on 3:20 and when are we planning to sell that trade to book profits.
Please explain.
\”Initiate a long trade at the close of P3 (around 3:20 PM) after ensuring that P1, P2,
and P3 to\” this was with regards to morning star but i observed similar sentences in all the candles stick patterns
The idea is to buy around the close and hold the position overnight, Arpit.
Hello Karthik,
What do you mean by \”bears could be consolidating their positions….\”. What exactly do you mean by \”Consolidating\”?
Best
Building up positions and averaging out the prices is called consolidation.
Hi K,
First off – love the content, I\’ve just been gobbling it up.
The context for the question is –
1. \”The bulls made a futile attempt to take the market higher. The bears tried to take the markets lower, and it did not work either.\”
2. Price is a function of demand/supply; ergo – demand > supply – prices goes up and vice versa.
The specific question is –
1. How do the – bulls attempt to take the market higher and bears attempt to take the market lower?
2. How does that attempt fail?
What\’s in my head –
# Bulls place buy orders in the market for the stock -> this is temporarily not fulfilled, hence the bulls place orders at higher and higher prices (resulting in a shadow for a high) -> however, this demand is ultimately satiated, which is why the close is temporarily unfulfilled, hence sell orders @lower and lower prices -> however, demand is able to satiate the increasing supply and hence a \”failed atempt at driving the market lower\”
Would appreciate your inputs on correcting the idea in my head if it\’s incorrect.
And once again, many many thanks for the amazing content for a newbie like myself 🙂
Glad you liked the content 🙂
1) By buying the stock at every intrday dip. So when every intrday dip gets bought, stock goes up. People who buy = bulls.
2) If there is not enough strength in buying the dip, then the stock can crack further and the bulls attempt to buy will fail.
Sir, The candlestick pattern shown above was of what duration? These patterns works on which duration candlestick chart?Is it 5 min or 1 day or 1 week chart?
They are a mix of both intraday and EOD charts.
Hello Karthik,
Thanks for the knowledge. In identifying a spinning top; the real body – what shoul be the length(% range)?
As short as possible.
Hi Karthik!
In 6.3
The bears make an entry – When this happens the market starts to slide down, and as you have booked 50% profits at a higher price, and can now choose to book profits on the balance 50% as well. Your net selling price will anyway be higher than the current market price.
Its confusing can u please explain it with example?
thanks in advance
Basically it means that you sell half the quantity now and the other half after observing the price movement.
hi, can you please provide a facility of something like when i bring my cursor on top of the candle stick patterns itatomatically gives information about that purticular pattern,which also makes learning faster.
Hmm, there is an indicator called \’Candlestick pattern\’. Have discussed that in section 22.2 here – https://zerodha.com/varsity/chapter/the-central-pivot-range/
Sir
In bullish engulfing pattern P2 day it is important to form new low. Because I saw it engulfs p1 day but not make new low.
So we take it bullish engulfing or not
Sir
In bullish engulfing pattern P2 day it is important to form new low. Because I saw it engulfs p1 day but not make new low.
So we take it bullish engulfing or not
Sir
I am in trouble sir
In candle % sir, if we are trading in currency so how much long candle is and when we trade in stocks.so give me some trick to decide candle formation is valid and mainly in intraday
Sorry, dint really get this Vishal.
In 6.3
\”Assume you had bought the stock before the rally started; this could be your chance to book some profits. \”
In above statement we are assuming that we bought stock (at spinning top candle) after which it started to increase and then after that 2 things can happen either bears enter and price falls in which we could book some profiy or bulls can enter in which we continue to rally. Right?
THats right, the probability of that happening is equal.
I needed to confirm that whether I am right in the below statement and if not then why and what\’s the correct reasoning?
1) spinning top could be of any color whether its an uptrend or downtrend. So for example in uptrend spinning top could be of red or blue. Right ?
2) And in an uptrend what really matters is the spinning top and not its color, whether it is red or blue it will mean the same that stock price can either increase or fall?
1) Yes, it can be. Colour does not matter
2) True
what does consolidating the position mean……
as you have said that \”The bulls could be consolidating their position before initiating another leg of the up move.\”
can you please explain….
Consolidating usually refers to adding more to the existing position in a side way market.
How to appear for test, I am not seeing the test after completion of module.
The test is on the app, please download the same from your playstore. Thanks.
Hello Karthik. Thank you for the fantastic content. I am really digging it and am set to complete all in course of building up a feel for teh market. I have a question though, which I am not able to grasp properly. I guess this is a fundamental question but I seem to be stuck at this concept itself. My quandary is \” When people talk about the markets, they say that bulls treied to bring the market up and bears tried to bring it down. Are the bulls really trying to bring the market up intentioanlly or is it rather just a consequence of them buying at what they feel is the right price for them at that moment? Why would they bring the prices up? Is it to be taken as given that if the bulls buy a stock today, they will do their best to keep the stocks up in the coming days so that they can sell at a profit later? But, how would they do that? do they keep on buying everyday? Or is it more of a community of bulls conspiring to raise the prices? And , why would the bears want to bring the price down? People seem to have the conviction that this is the case.\” Please help me understand this phenomena in your simple words. Thanks a ton in advance. 🙂
Ashish, I\’m glad you liked the content on Varsity 🙂
Its the collective action of the bulls which manifests an increase in the stock price. Likewise with the bears, when everyone wants to sell (desperate to sell), they will sell it at whatever price, hence the prices come down. So it is the collective action of the bulls/bears which impacts the price.
Does spinning top help us to position our existing stock or it is more helpful when we thinking to buy a new share?
It conveys indecision. So you will have to factor this in and trade accordingly.
The bulls could be consolidating their position before initiating another leg of the up move. I\’m facing problem in understanding this statement, can u explain?
This means that the bulls could be gearing up to move the markets higher.
How many no. of spinning tops are required to expect the storm is about to come ,
and what should the range of body to consider it as as a spinning top ..
Thank you
There is no range as such, depends on the market and the condition its trading under 🙂
Cannot really quantify this.
There is a downtrend n it either forms a doji or a hammer, which one is more reliance, sir?
Thank you.
I\’d lookout for the opportunities with the hammer.
Karthik sir, which is reliable trend reversal a doji or a hammer? I personally prefer a hammer/hanging man bcz of their long wicks n a lil bit of price movement. Your take, sir?
Depends on the overall market context 🙂
in the 2nd point- the upper shadow, I cannot under why the lower shadow not being there is a sign that the participants tried to go bullish but could not succeed.
and same for the 3rd point- vice versa
Please see my previous reply.
If you think about the real body in conjunction with the upper shadow ignoring the lower shadow, what do you think had happened? The presence of the upper shadow tells us that the bulls did attempt to take the market higher. However, they were not really successful in their endeavour. If the bulls were truly successful, then the real body would have been a long blue candle and not really a short candle. Hence this can be treated as an attempt by the bulls to take the markets higher, but they were not really successful at it.
why is this so sir? why long candle? Here we have ignored the bottom body and if it was there, there would have been low as well.
No Piyush, we only consider the price action here. Look at the entire move and think through what transpired with the bulls and the bears. Relate it to the price action and you will know why 🙂
Wow that\’s something I will take in to consideration , sir😊
Hmm but which is more relianble trend reversal, a doji or a hanging man?
Neither, I\’d prefer things like evening star or bearish engulfing.
Hello karthik ji, during uptrend if a hanging man forms and yet the trend continues(break out), what should I make of the hanging man?
Nice explanation btw😊
It just means that the pattern dint hold 🙂
Btw, a hanging man at the top of the rally is not really a great reversal signal.
Ok sir, thank you so much. It was helpful.
Good luck, Amarnath.
Sir you mean even one inverse hammer at the beginning of a downtrend could indicate a bullish reversal?
Yes, but do look at the market from a holistic view.
Alright sir. Sir if I spot an inverse hammer just after the formation of one big bearish candle just after the end of an upward trend, I definitely can\’t take this inverse hammer as a bullish reversal considering the fact that the downward trend has just begun, correct sir?
Not really, take it in the context of the entire market move.
Ok sir. Sir, cup pattern formation is bullish? Is this pattern something to pay more attention to ?
Amarnath, I\’d give it the same importance as I\’d to other Dow formations.
Wonderful explanation, sir. You cleared my doubt. The same principle applies for a dragonfly doji n a long candle stick, if formed at the end of the upward trend, right?
Thank you sir🙏
That\’s right, Amaranth. The concept of doji remains the same irrespective of the location of the real body. Happy reading!
Hmm my doubt is how does a hanging man become a bearish pattern at the end of an uptrend despite the long wick representing buying pressure.
In a hammer at the end of downward trend it signifies bullish reversal bcz the long wick indicates buying pressure but why does it vary at the end of an uptrend?
The idea is that the bulls, who were in absolute control all through the rally were suddenly challenged by pushing the prices down (although it does not sustain). The point is that there was an attempt, which was previously not there. Hence the signs that the bears are trying to break the market.
Sirji, I got it but what I am asking us, in the second chart, the 2nd and 4th n 5th candles in the circle are gravestone dojis n dragonfly dojis respectively, right?
Yup, that\’s right Aman.
Sirji, in the second chart of spinning tops in downward trend, I don\’t think all are spinning tops bcz the body of a few candles is away from the Centre. Let me know sir.
They are a bunch of spinning tops and dojis.
Sir, my doubt is when the hammer is typically considered a bullish candle, how is it that it indicates a bearish reversal when formed at the end of the uptrend? I want to know this, sir.
Hammer is essentially a paper umbrella. If the paper umbrella is found at the top end of the rally, it indicates a hanging man (and not a hammer).
Sorry for the late reply , sir. I was busy with work.
Sir, from my understanding if a hammer appears at the end of the uptrend it means bearish revearsal and if a hanging man or an inverse hammer appears at the end of the upward trend it means bullish reversal, correct?
Yes, that\’s right. Its indicates a possible reversal.
Sir, I still don\’t understand how a hanging man is a bearish candlestick. Please clear my doubt.
Thank you.
What is causing the confusion, Amarnath?
Sir, I have a doubt that\’s not relevant to this candlestick. I read it somewhere that a hanging man candlestick shows a bearish pattern but the long wick shows buying pressure similar to a hammer. Could you please clear my doubt, sir?
Thats right, remember both hammer and hanging man are similar patters (paper umbrella).
In what TF should we see these ?? When trading intraday is 5min perfect to watchout & take decisions based on candlesticks ?
I heard higher say 15 min is better
Yeah, I\’d suggest 15 minutes as well.
Doji’s provide crucial information about the market sentiments and is an important candlestick pattern –
What additional information do they provide, which is not provided by spinning tops?
Other than shape of the candle, what is different from spinning tops?
Noting really, they both convey the same thing.
Thank you. Besides, if a person places a highest bid, his order moves up the que. Is it the same if the seller offers a lowest bid?
Yes, it is always on price-time priority.
Hello karthik sir,
Subdued trading meaning lesser price fluctuation or less traders. Please clarify, sir.
Thank you.
YEs, thats correct.
Yes I am getting it now, if there r just 2 or 3 of them and the trend doesn\’t reverse it indicates the trend is continuing, correct?
Wherever it forms(outside of highs b lows) the doji always indicates trend reversal or continuation?
Yeah, always look at it from an overall market perspective.
Well, but even one doji can bring about a big candle or short candle
right?
If it appears as a series n stock doesn\’t make highs it means it didn\’t serve its purpose? I am sorry I am not getting it, sir.
Meaning the doji\’s should appear one after the other as a series over multiple days, then it indicates that the trend is cooling off and perhaps we may see a reversal in trend.
Sir, you mean even the very smallest ones can make as much impact as big ones?
Hello sir,
Even a very small doji after a bullish or bearish candle plays the same role than that of a medium or big sized doji?
Yes, they imply the same price action.
How important is a doji or a spinning top when not formed at high trends or low trends? Would it hold any significance?
It does, but not in isolation. It has to appear as a series, stock/index should stop making new highs etc.
Yes, that\’s what I wanted to know. Thank you karthik.
Good luck, Varun!
Yeah I understand getting lower means more sellers but if the size of the body is reducing as the candles pass does it not mean the selling pressure is reducing although red candles r appearing?
Now in your experience, could be a shift in the upward momentum?
Thank you Mr. Karthik
You can consider that, but it has to appear as a series (like 7-8 candles) to establish that the trend is reducing.
Hello Mr. Karthik, If the red candles get lower n lower then it means the sellers are reducing? Please confirm.
Now could this mean the trend could change towards bull pattern? I know anything can happen in the market but what has your experience with this been?
Red candles get lower and lower —-> this means more selling and hence bears are in control right?
Sir, I liked your explanation skills. But, if a candle is small in size it obviously means less trade so can we say there r less buyers and sellers? Does it also point to a under valued or over value price? Your take on such small candles?
No, it just means the buyers and sellers had equal influences on the price, hence the price dint move. If one of the groups had an influence, the stock price would move in a certain direction.
Dear Karthik & Team,
Hats off to your great initiative and effort to meticulously narrate the intricacies of stock market in a simple and coherent manner to common people like me.
I have one suggestion:
Why dont you create a education series about Stock Market in youtube? Perhaps, some people (like me!) would find it easy to learn these concepts through audio-video input along with reading.
Regards,
Abraham
Thanks, Abraham. We are thinking about it. Hopefully soon 🙂
First of all,wonderful content ! My question is, what exactly does\” the bears could be consolidating their position before returning to another bout of selling \” mean?
Thanks.
Thanks, Dhipika. Consolidation typically means adding more positions or averaging out. Some even call this the pressure cooker effect, where the pressure adds up slowly 🙂
Is there any fixed percentage to determine the small body for spinning top candlestick with respect to the length of its shadow
Nothing like that.
I have Question-Related to Doji
1) Long and short shadow matters in doji
2) for gravestone and dragonfly if it has littler upper and little lower shadow then can we consider those candle as doji
1) Not really
2) Yes, you can.
I want to present a scenario:
I buy 200 shares of example ABC company at 100 Rs and the stock rallies to 200 Rs and consolidates. In the consolidation period the spinning tops and doji starts to appear, so I book half qty i.e. 100 shares at 200 Rs and the stock starts to reverse from there, so what should be my stop loss to exit the remaining 50% of my quantity and if i look at the daily chart, which should be the candle i should be waiting for the confimation for?
Kindly advise
This is a tricky call, but I\’ve seen traders book out at the midpoint i.e. in this case 150. But this also depends on how bullish you were on the stock in the first place. Not all retracements are worth booking out.
Hello Karthik,
1)In the picture at: https://drive.google.com/file/d/1eguxRJLkATU_ic5VlIx0kyN2QiSVw77l/view?usp=sharing, can we take the trade considering that the last candle which is a hammer?
I ask this because the support is at 2067 whereas the closing price is around 2100. The hammer pattern has formed 1.5% above the S1 support level.
Thanks,
Kiran Hegde
Sorry, unable to open the chart, however, I think 1.5% is an ok difference, you should go ahead if everything else is ok.
dear sir,
i request yo u to please make a separate video where anyone can learn how to analyse candelistic pattern and on the besis of how can i learn money instantly .what can i do to not getting loss?
Noted, looking into this.
Sir, Which Time frame should we use for Marobuzu and other chart also?
I\’d say EOD, but really depends on what you intend to do with the trade i.e. swing or intraday type of trade.
Hi Karthik,
Where can we get access to these types of technical charts? Havent been able to find them anywhere.
Thanks.
We have this on Kite. In fact, there are two charting engines on Kite i.e. ChartIQ and Tradingview via which you can choose to look at these charts.
Hi Kartik ji,
Below is the condition for spin top :-
(1) The candles have a small real body
(2) The upper and lower shadow are almost equal
My question is upper and lower shadow will never be equal exactly, so how much difference is allowed ? And how to calculate that ?
Thanks for your patience with us. I have read entire comment section but i didn\’t find any answer for this so asking you Sir / /.
The shadows need not be equal, the only condition is that the real body has to be small.
Hi Sir,
Good evening.
69 is a target or stoploss. I am assuming you are buying at 55 and selling at 69. so 69 is a target and stoploss would be less then 55?
Thanks in advance for your patience.
That\’s right, if you are long at 55, then 69 is the target.
In what time frame would you recommend to see these candles?
End of day.
what does consolidating position refer to
It means the stock trading in a tight range for few days without moving upwards or downwards.
Hi Karthik,
Please explain how they can be considered as Spinning tops and not a Shooting star? Here the length of the upper shadow is more than double that of the body.
The shadows does not really matter. What matters is the open and close price of the candles.
Hi,
I wanted to clarify a doubt here. When you enable the Candlesticks from Studies option in ChartIQ, for daily chart of PNB Housing, the candles for 11th August and 17th August, 2020 are shown as spinning tops. But they have negligible lower shadows. How can they be considered as Spinning tops?
Yes, these can be considered as spinning tops, no issue.
\”The chances of a stock moving higher after hitting 52 week is much better than the odds of it going down\”
Interesting.
You see, my question pertained to the time before a stock hits its 52-week high. I agree that if something major (and positive) event happens in the company/economy, it motivates the bulls to push higher and higher. Unless the significance of the news surrounding the company is high, then the stock has more of a chance to fall down. So, what we need to do is understand how significant any new news report about the company is to be taken, right?
Sometimes the most insignificant news can lead to market rally – this is particularly true during bull markets. So the larger question is how is the market sentiment and how will the market react to a story associated with the stock.
Hello, Karthik. Hope you\’re doing great in life.
My questions:
1. “Or the bulls are fatigued and may give way to bears.”
So, while I’m watching the prices go up and down before buying anything, then are buyers and sellers constantly cancelling their offers, raising it up/down, as in a game of tug of war?
2. If we discover a spinning top, then it is said that there is a 50-50 chance it could go bullish/bearish.
(i) However, if a bullish (or bearish; going with bullish for simplicity) spinning top was spotted in an upward trend, and if the closing price was close to the 52-week high, then it is more probable to fall, right? (I’m assuming it’s difficult to push a little further to 52-week high, when you’re already too tall. So, a 70-30 chance could be there for it to fall, right? Or even if the trend favors the bulls, the margin of profit would be very tiny.)
(ii) Similarly, if bearish (or bullish) spinning top is discovered in a downward trend, and if it is close to the 52-week lowest price, then it is more likely to go up, right?
Thanks, Karthik, for your time.
1) Thats right, markets are super dynamic
2) The chances of a stock moving higher after hitting 52 week is much better than the odds of it going down
3) Same as above
What I mean is, “ The bulls make an entry – It turns out that the bulls were indeed taking a pause and the rally continues, at least you are not completely out of the market as you still have the balance 50% of your holdings invested in the markets”, so if the bulls continue to rise, then I book a loss on 50% of my investment right? That’s why I’m investing 50% to be on the safer side?
This is a calculated bet, Gurjot.
Sir I could not understand the trading decision for spinning tops at the top, could you please elaborate the buying or short selling 50% of investment portion for the that.
I\’ve detailed that in the post itself, Gurjot. Is there in particular that you are not sure about?
Hi Karthik,
In 1st chart in section 6.2, the 8th candle from where the circle is marked is a Hammer candle. There is a bullish trend immediately after that. So just to gain a perspective here, are the Hammer and Shooting star more reliable candles in terms of trend reversal than others? As per your trading experience obviously.
Not really. Its very hard to say that certain patterns are better than others. However, what you can do if find out the odd of an outcome give a certain pattern by looking at the past behaviour. For example, you can quantify something like, in the last 2 years, there were 10 hammer formations in SBI, out of which 8 were successful. Like wise for ICIC only 4 were successful. Hence the next time a hammer forms on both SBI and ICICI, I\’ll take the trade on SBI since the odds are better.
Hi,
I think for an indecision to have an existing rally to consolidate further or result in reversal of the trend, the shadows should be long enough and not short. Because that can show that both Bulls and Bears have tried a lot but eventually the candle resulted in indecision. Please confirm.
Yes, that makes sense. But the problem is that the long shadows can also result out of a flash trade. Hence you need to be a bit careful.
Hi Karthik,
Chart#4 Example of ACC-EQ. If I am risk averse, I see the first blue spinning top and sell 50% stock and wait till the next day candle.
1. Next day candle is a red spinning top – so again I wait next day because market is still in indecision? And next 2 days again are spinning tops so basically I just watch 2 more days till finally some candle other than spinning top is made before deciding if market is bullish/bearish?
2. If not, then on seeing the next day red candle, I should assume that it is bearish candle and sell rest 50% share as suggested?
Pl advise.
It is always better to take a wait and watch approach when dealing with spinning tops and dojis. Also avoid taking action based on just 1 spinning top or doji unless you have a prior context (like engulfing pattern).
Thanks Karthik. This is helpful.
Good luck!
One more question Karthik, sorry didn\’t include in the previous question. Do \”Spinning Top\” candles always have equal length of upper and lower shadows? Thanks
Not really, the length of the shadows can differ.
Hi Karthik,
The statement with regard to spinning top in downtrend \”With the spinning top in the down trend the bears could be consolidating their position before resuming another bout of selling\”, can you please explain with an example? Thanks
Its just that the spinning top implies a pause in the trend. Post this it could either continue the trend or reverse, each with equal probability.
Sir if a bullish marubozu is formed at the resistance of a stock what should we expect or should we ignore that trade
I\’d bet on a possible breakout.
Sir what is the name of the volume indicator used here i.e the 10 average volume one.
That is the simple moving average on the volume bar.
Sir if in the uptrend a shooting star appears and the next day a doji is formed what does it suggests?
I just saw a 1 day-chart of ONGC where on 2nd july a shooting star appeared and the next day on 3rd july a doji is formed?
So does that doji suggests a bearish trend in the next few trading sessions or are the chances equal of the continuation of uptrend or a trend reversal.
I personally feel that it is a bearish sign. Depends on the prior trend and all other parameters as well.
While the difference of shape in DOJI and Spinning top is understood. What i am trying to understand is are they important in conjunction.
What I mean is since DOJI and Spinning virtually convey the same why are 2 separate parameters needed It could be either DOJI or Spinning top, or are these tools in conjunction required for some specific reasons and convey something different. Like who would want to use these 2 terminologies together
If you think about it from the price action perspective, they are the same. Its just that they have slight variation in terms of OHLC, hence different real bodies are formed.
what do you exactly mean by the upper shadow and the lower shadow are equal in the spinning top?
They are of equal length.
Hi Karthik – Do we need to look for a certain number of spinning tops occurring together to confirm uncertainty in the market or 1 spinning top is suffice? If former, then how many spinning tops can be a ball park?
Usually, they appear in a pack, hard to quantity, but certainly not 1.
For a newnie question… Does bearish and bullish is form through the day or it is already made for the next day… Sorry just a newbie.. Willing to. Learn
I\’m sorry Lyndon, can you share more context, please? I\’m unable to get your query.
Hi Kartik,
From a risk averse beginner\’s perspective, Do Dojis and spinning tops qualify as extremely short candles which should be avoided for trading as stated in the last chapter ?
Doji\’s and Spinning tops do not qualify as trading patterns on their own, you anyway have to look at them in the backdrop of other candles and the overall trend of the market.
your above explanation is in line with daily time frame..is it right?
Yup, thats right.
sir series of spinning top overs together, is this how they usually appear?
Not always.
Hello sir,
First of all thanks for the great material.
In shooting stars for trade setup you have told the stoploss should be high of the candle but according to the last graph in the same topic the stoploss would be very deep as the market goes down the next day. Please comment on this.
Yes, but you want that to happen when you are short right?
Hey
Is marubozu and spinning top/doji applicable only to daily charts? Or can it be applied to 30,15 or 5 mins intraday charts also?
Harsh, all candlestick patterns are applicable across all timeframes. So you can use the same.
Hi Karthik, How to interpret a inverse hammer (long upper shadow and ‘no’ lower shadow) in a downtrend? Can you elaborate. As per explanation here, the candlestick is a shooting star which appears in Uptrend. Thanks.
In my opinion, it just emphasis more bearishness.
Is there any website or app which identifies these candlestick pattern?
1. So just to clarify if I own 100 shares of ABC company, in case I encounter spinning tops/dojis, I should sell 50 shares in an attempt to book profits in case market becomes bearish and if the market becomes bullish I will end up with a balance of 50 shares and won\’t be completely out of the game. Is it right?
2. What if I don\’t own any shares and I see spinning tops/dojis. What should be my stance then? ( This is what I feel is that generally after spinning tops/dojis market tends to reverse, so after an uptrend, if I see spinning tops/dojis, I should short the stock assuming that market will become bearish. Is this the right way to approach? )
1) Please look at the larger trend and then take a call. Not all spinning tops/dojis are worth taking an action
2) You can initiate a trade-in option and play this out.
Please have a look on chart of Reliance.( 30th April – 6th May 2020)
To me last 3-4 days looks spinning tops except for today.
spinning tops suggest indecision.
On 30th April , first spinning top got created. So i thought that it can move either way.
So in order to make money, I should buy call and put options both. If it move either way, mu premium will increase for that option. But it kept making spinning tops for 3-4 days and premium of both options decreased.
what did wrong here in my approach?
Did you check the volatility? If you buy options when the volatility is high, then you will lose money. You need to ensure the volatility is low before buying options.
Dear All,
Can you please help me understand how do we spot the trend in which a stock is currently running in?
You just have to look at the overall trend as seen on the charts.
Hello Varsity Team,
this whole course is well designed and this is really helpful. this course really helped me in getting familiar with stock markets and trading.
It would be better if you guys could, you know make a self-evaluation of this course so that we can justify what we learned here. it will be really helpful.
thank You.
Thanks Rajeev. Self-evaluation and certification is a part of the Varsity app. Please do feel free to download – https://play.google.com/store/apps/details?id=com.zerodha.varsity
Sir
In ch6, 6.3- Spinning top uptrend, it is written that \’Assume you had bought the stock before the rally started; this could be your chance to book some profits. However, you do not book profits on the entire quantity. Assume you own 500 shares; you can use this opportunity to book profits on 50% of your holding i.e 250 shares. Two things can happen after you do this:
The bears make an entry – When this happens the market starts to slide down, and as you have booked 50% profits at a higher price, and can now choose to book profits on the balance 50% as well. Your net selling price will anyway be higher than the current market price.
The bulls make an entry – It turns out that the bulls were indeed taking a pause and the rally continues, at least you are not completely out of the market as you still have the balance 50% of your holdings invested in the markets,
My question is that if the bears makes an entry, how are we able to book profit ? Ex- if the share price is Rs. 500/- and if the price will go down due to bearish movement, we will incur a loss. So how is that possible that we are booking a profit in this situation? And the same question for bullish situation too, How did we incur loss ? Is it a shorting situation?
Thank you
It is assumed that you\’ve bought the stock at a lower point and now you have an opportunity to book 50% profits.
Hi Mr Karthik,
Thank you so much for great content.it may be stupid question but i failed to find the answer for this.
As you said in first module promotes are raising fund for company expansion through IPO.Ones it issued all the listed shares to the public, through which company bagged the required money for the expansion.Here my doubts are
1) As per my understanding changes in the share value will not have any impact on companies performance ,but in other hand company performance is highly proportional to share value ,still i\’m not clear about this relation yet .Could you please help me to clarify?
That\’s right. CHange in share price only implies the networth of the shareholders is increasing. However, if the performance of the company improves, the share price increases.
Could you please tell me the exception (rule 2) for spinning top.
How do i differentiate about have a small real body with spinning top and doji.
Perhaps the only condition is shadow as if i see equal shadow both the side i would consider as spinning top and if shadow is unequal then consider as doji.
Go with the way it looks, a doji does not have a real body at all…but a spinning top has a tiny one. However, irrespective of the presence of real body, the end interpretation is the same.
thnks for replying, I will keep on reading it until I understand it,
Good luck, Madel 🙂
am I right the bulls are the sellers because if the demand is high than supply the sellers will make the price higher but if the theres more supply then demand sellers will be forced to make the price lower? because when I searched about who\’s the bull and the bear heres the answer that ive got ,\”Bulls are people buying stock now with the belief the stock (or market in general) is going to rise. Their buying helps drive the prices higher. They are said to be \’bullish\’ on the stock. Bears are people selling (or short selling) stock now with the belief the stock (or market in general) is going to fall.\”
Bulls are not sellers, I\’d suggest you read the definition again.
Very insightful content. Congrats to Team Zerodha. Keep up the good work.
One doubt, Sir: For all practical trading purposes, is there any difference between Spinning Top and Doji ? Or we can treat both as the same i.e. indicating indecision in the market.
Thanks, Ravindra. No, I don\’t think there is much difference between the two, especially when it comes to interpreting the price action.
the spinnig top candles shown in picture are day candles or 15 min or 30 min or 1 hour candles?
is there any specific rule that candle formation time should be 15 min or 0 min?
15 mins I suppose. No specific rule as such. As a thumb rule, the larger the time frequency, higher is the quality. For example, 15 mins is better than 5 minutes, and 30 mins is better than 15 minutes.
In the definition of Spinning top, we need to have small real body. Does small real body can be just certain percentage of the share price? or does it needs to have some relation with the length of shadow?
It needs to be a small % of the share price.
Thank you very much for this lessons sir.Responded to every single query.Your are a real teacher.Nation wants mentors like you sir.
Regards
Thanks for the kind words, Manoj!
Hi Karthik,
Thank you so much again for such detail oriented hand holding. It\’s incredible.
I have a question basis trend chart observation. Essentially, in a trend of candlesticks (bullish or bearish) for a given time period, very next candlestick of any given candlestick is expected to start (open) from the closing edge of the previous candlestick\’s body. However, in charts we see some session openings (quite a few) are not so but open from the middle or from third quartile of the previous body. What could be the reason for such behavior?
Raj, the opening may not really start from the previous day\’s close, hence the difference.
Thank you very much sir for your valuable reply
Hello sir, good day!! Thank you very much for your lessons which help traders to trade confidently. Currenty I have finished lessons up to this level. My doubt is how much is the accuracy or TA? Because, I have seen some other articles that tells, the accuracy of TA is less than 50% without Futures and options analysis. Really confused. Please help me out.
End of the day, TA is about probabilities. It improves the score of you making money, but there are no guarantees.
Hi Karthik,
Thanks for the excellent work that you have been doing. I have a basic question regarding which instrument to trade when you have a sense of index directional movement. Let\’s say based on the TA, I\’m confident that tomorrow it\’s gonna be a bullish day for NIFTY. How do I decide what instruments to trade? Should I buy Futures or buy CE or sell PE? What\’s the logic to trade a given instrument in a given situation?
Thanks
Abhishek
This depends on multiple reasons, Abhishek. If the target is expected to hit over the next day or 2, its future. If more than that then futures, if volatility is high the sell PE, if low buy CE. So things like that 🙂
Dear Sir
Great Work. I m beginer & it seems things are getting better after learning on Zerodha varsity.
No Complaints. Just praise for your efforts & hardwork.
Happy to note that, Bharat 🙂
Happy reading!
Hi Sir,
There is a statement In Page 41 on technical analysis-
With the spinning top in the downtrend, the bears could be consolidating their positions before resuming another bout of selling.
How will bears gain in a bear market if they consolidate equity shares while spinning tops are formed before resuming selling?
Thanks in advance
This was with reference to the bears holding short position in futures.
Hi Karthik
Thanks for providing such extensive content . I would like to ask about the candlesticks which has a real body neither as small as spinning tops nor big as a marubozu , I see a lot of these candles in the charts .How to trade on such candles ?
These are normal range candles,Shaik. It is best associated with the general flow of the trend.
Can we take any specific trades on them ?
If you are completely new, I\’d suggest you start with the index.
Karthik, well explained and easy to learn. I appreciate your hardwork, around 5 yrs you are answering all the questions. really great
Happy learning, Renuka 🙂
Sir,
It\’s good initiative taken by zerodha and You. All these things is informative for beginners.
All these single candlestick pattern signal is used only for days candlestick or it can be used also for 1 min or 5 min or 1 hours of technical analysis.
They can be used across different time frames, Hemant.
Considering that the candle stick patterns can be viewed upon various ranges (such as at week level, day level and also for months), what would be the candlestick range to be used, if we need to do intra day trading (i am just giving this as a example).
Similarily if we want to do some short term trading, what should be the range. What would be the typical candlestick pattern range if we want to do long term trading? Can you please through some insights. Thanks
For the short term trade (intraday), I\’d suggest 10 to 15 mins. For everything else maybe EOD chart works.
Hello,
What does exactly booking a loss means in the spinning top candle after the Bearish pattern?
If the trader has been waiting for an opportunity to go long on the stock, probably this could be his opportunity to do so. However to play safe he could test the waters with only half the quantity. If the trader wants to buy 500 shares, he could probably enter the trade with 250 shares and could wait and watch the market. If the market reverses its direction, and the prices indeed start going up then the trader can average up by buying again. If the prices reverse; most likely the trader would have bought the stocks at the lowest prices.If the stock starts to fall, the trader can exit the trade and book a loss. At least the loss is just on half the quantity and not really on the entire quantity.
The trader wants to go long so how is it a loss situation?
So you go long, and the price drops below your purchase price, you\’d make a loss right?
The body of Some blue/red candles look vertical in shape (6.1above ) and some are horizontal ( 6.4 above) What does it mean?
can you please explain sir
These are dojis, Periannan. This is a case where the open = low = high = close for the day.
Sir, are there any websites to learn more about candlestick patterns. Like a tutorial, where I can see each company\’s pattern or a particular website dedicated only for candlesticks?
What else would you want to learn, Dhilipan 🙂
Sir, a website where I can use what I learnt here to analyse my knowledge about candlesticks.
You will have to test the pattern on the trading platform. Have you checked Kite?
https://zerodha.com/kite
Okay sir. I will check.
Good luck!
Sir, can I know which min candlestick is better for spinning top , marubozu …etc ?
All are good, each comes with its own risk and reward characteristics. This really depends on the way you use these patterns and trade the market.
Hello,
All your patterns are explained very well. Now assuming i am sitting in the morning to trade. Which candle stick chart should i watch Infact you can have a candle stick for range from 3 mins ,15mins,30mins and so on so which one do you see and place your positions?
You need to take a end of day view once to get a perspective of what\’s happening in the stock and then look at 5 or 10 mins chart. Of course, this is my personal opinion.
Hi Karthik,
This is really approachable content for new beginners, thank you for this great work. I feel bad that I did not find the Zerodha varsity sooner.
Could you please tell me the time frame that you used in the chart images that have added for explanation, I believe they are EOD but just wanted to confirm. Also is single candlestick good strategy for intraday?
Vir, these are EOD of charts (unless explicitly stated). Yes, all chart patterns (single, multiple) can be used for both overnight and intraday positions.
Happy learning 🙂
pl set a mock technical analysis to help us learn
Its on the list of many things intended to be done, Anirudha.
Hi,
Are this pattern applicable to intraday, if so? kindly suggest the time frame
Yes, the patterns are applicable to intraday trading as well.
time frame in intraday plz? aslo if i use particular pattern ( hammer or hanging man) till when i should carry?? because immediately next candle might form another pattern…..plz suggest
Sanju, I\’d suggest you look at EOD charts, to begin with, even for intraday. Carry the position forward till your target. If a strong opposite pattern occurs before your target, then maybe you can cut your trade and book profits.
Hi Karthik,
If we have to do positional Trading with time frame of 1 to 2 days or BTST/STBT , then what time frame we need to select for our candle stick graph.
Thanks Manish
I\’d suggest you look at EOD charts for this, Manish.
Hi Karthik,
Can you tell where I can find EOD charts for the shares.
Thanks,
Manish
You can check the EOD charts by logging into your Kite account.
Hi Karthik, really appreciate for your patience to answer all questions in a fantastic way.
Just one thing I want know. Some brokers started Stop Loss system for one year validity. I heard that Zerodha also planning for the same. Is it true?
Vinod, I\’m not sure about the one-year validity thing, these orders are called \’Good till canceled\’ aka GTC. Yes, we do plan to introduce this, hopefully sometime soon.
Thanks for succinctly putting up the content for non finance guys.
Please validate my understanding based on the excerpt from this chapter.
This is w.r.t to Spinning Top candle during the uptrend,
\”Assume you had bought the stock before the rally started; this could be your chance to book some profits. However, you do not
book profits on the entire quantity. Assume you own 500 shares; you can use this opportunity to book profits on 50% of your
holding i.e 250 shares\”
Does it mean i already own 500 shares (bought) way even before the spinning top formed and riding the uptrend until the spinning top and decided to bet on the spinning top that prices will go down. So i sell 50% of the holdings to book profits made upto the spinning top formation.
Later when it turns in favor of my bet, then i sell the remaining 50% holdings and make profits (however in this case it might be little lesser than the previous profits made)
However, If it turns out against my favor, i.e. the prices tends to continue going up, then at least i would have the remaining 50% holdings to continue riding uptrend.
Yes, Bharath, thats exactly what it means 🙂
In the spinning top occurring in downtrend section- you said that one can test waters by buying half qty and if market reverses then exit trade ab book loss, so what should we keep the stop loss as?
Thank you
Unfortunately, both spinning tops and dojis do not suggest any SL. The best you can do here is trail your SL.
What is the time frame for candles
Check section 3.5 – https://zerodha.com/varsity/chapter/chart-types/
Do spinning tops and Doji always occur in cluster or 1 candlestick is enough ?
Thanks for the content and when are we gonna get the question system as you said you were gonna implement it?
Very soon, Ram!
Thanks for the article but I have one doubt.
We already know at any point, irrespective of downtrend or uptrend, there is always an equal chance of price moving in either direction. Spintop and Doji tell us that price can move in either direction. So aren\’t they basically useless?
They can move in any direction – this is true. But how do you know at which point? When the stock is trending, the probability is more for a move in the direction. Doji and spinning tops kind of tell you at which point the chances become equal.
If we toss a coin 9 times and every time head comes up then one would say that the probability of 10th toss being head is high but In reality, it is 0.5. Shouldn\’t the same thing apply to stocks?
Shouldn\’t it be generally true for \”spinning top\” candle stick that, if wick is longer than tail then the candle would be bullish & if it is other way round the candle would be bearish. Logic being longer wick suggests stronger bull forces & longer tail stronger bear forces. Moreover wick & tail need not be necessarily equal?
The emphasis is on the closing with respect to the opening price and not really on the range of the candle, Mangesh.
It appears that Doji or Spinning top should not be used to take a fresh position (buy or sell new stocks). It is useful if you have some existing stock.
Yes, these patterns in isolation do not convey any information, but when looked at in the context of other patterns surrounding, then probably you can make sense of it.
Hi Sir,
These lessons are really useful. Thanks for that.
Should we look at intraday charts like 5min,10min etc or look at 1 day charts to analyse the candlestick patterns. Which one would be more accurate.
Thanks
If you are starting fresh, I\’d suggest you begin with EOD charts.
Hi,
Assuming Rs. 100 as the open price what should be the maximum / minimum closing price for a candle to qualify as having a small body? Similarly, what should be the MINIMUM length of the upper & lower shadow sticks to be qualified as a \’Spinning Body\’?
Thanks!
A movement around 0.2 – 0.3% is considered as small candlestick aka spinning top. Always think of it in % terms, will be much easier.
Thanks for details.
Can you please tell us graph setting of above?
We have to check one month or one year graph with 30m or 10m measure?
If you are looking at 10-15-30 mins, I\’d suggest you look at one month chart.
Hello Kartik, to start off, Hats off to your explanation. I have praised your work in every comment that I have posted, but I still feel the urge to do the same again. Let me share a real life experience of how effective your work is. I\’m working for BPCL, as part of our corporate training, we are given a training module named \”Kalpvriksh.\” I remember a trainer who made an excel presentation, seeing which, I was amazed and was drawn into Share markets. Yesterday, I was trying to watch your webinars, to my amusement, I have found out that the trainer had presented the same stuff that you made a video on. It is, \”How much money do you need the day you retire? \” Every single word he uttered while making that particular presentation was totally copied from your content.
Secondly, I have a doubt regarding the charts. For Intraday, what timeframe is best? Is it 15 min ?
I also wanted to know if this strategy works. Alligator indicator combined with Momentum indicator with Pivot points plotted to find out the S&R (only after recognizing a standard pattern). Kindly assume that I\’m a risk taker. Could you please help me on understanding what are the Odds of winning the trade ?
Kiran, thanks for the kind words. I\’m really glad you liked the content here and finding it useful 🙂
As far as the trainer is concerned – well, he is helping spread the right message, so we will leave it at that. But I hope he at least gave some credits to Zerodha 🙂
I\’d suggest you use at least 15 minutes chart for intraday trading. Remember, the higher the lower the frequency (like 1 mins, 5 mins), the higher is the noise component in the charts. Hence 15 mins is better than for intraday.
I\’d suggest you start with momentum indicator, use it and experience it. You can start calibrating it with other components to improvise your strategy.
Sir, I have a doubt regarding the prior trend. Suppose, a stock was in a uptrend for 10 days and in the next 4 days it retraces back upto 38.2% of fib level and forms a \’paper umbrella\’. Now, what should we consider as \’prior trend\’ in this case and what should be our interpretation of this formation (Hammer or Hanging man)?
Please forgive me if I sound stupid. Thanks in advance.
Sudipta, this is a perfectly valid point. In this case, I\’d look for buying opportunities because I know the general direction of the trend is upwards. This goes well with this situation because the immediate trend is down plus the larger trend is upwards. So buying makes sense.
Thanks a lot for the explanation sir…..
Welcome!
Does a Doji on day 1 followed by a green/red candle on day 2 qualify as an engulfing pattern?
Not really. You need a good red candle on P1.
Hi Team,
Kindly provide above detail in Hindi
Vinod, translation is not really effective. Have kept this on the to-do list.
Hello Karthik,
I had a question on choosing a stop loss price.
I want to give you a hypothetical data of OHLC 60, 69, 55, 58 for a bear candle.
I would use the high as the stop loss to sell the stock right ?
What would be the entry price for the trade. ?
I would hesitate to short this candle, Jeevan because my entry would be around 58-55 and SL would be at the high ie 69…which is nearly 25%.
Thank you for the response Karthik,
I dint understand the 25 %, I assume it to be the difference between the high and the close, what should be the qualifying percentage to trade for the same ohlc data and how do you calculate it ?
The stoploss here would be nearly 25%. Considering the entry @ 55, SL at 69 i.e 14 points. So 14/55 is nearly 25%, which is quite steep for an SL for a trading position.
Sir, Around How much should be the SL and entry % be?
The best part of the candlestick pattern is that the SL is inbuilt, which is usually the low of the candle for long trades and high of the candle for short trades. Entry too is defined based on your risk appetite.
What is the meaning of shadow as used \’spinning top\’ material? Does it mean the arrow (line) above or below the body?
It just means the line connecting the open/close to the low/high of the candle. It gives a visual representation of the pullback or retracement of the day.
Hi Karthik,
Great Material and huge gratitude for being approachable.
How does one set the buy/ sell price and stop loss when encountering a spinning top or doji?
Regards
Both these patterns i.e doji and spinning tops are not patterns which give you a stand-alone buy sell signals. They are best looked at in the perspective of the larger trend.
in 6.3
1. Bears make an entry
2. Bulls make an entry
I think concepts written in alternate places.
sir, does all these candlestics patterns gives same indications while trading in options
sir, does all these patterns gives same indications while trading in options
Sorry, can you kindly elaborate please? Thanks.
Also tell me where i can practise these on charts individually.
Look at the charts on Kite. When you do so, try and identify patterns and use that to construct trades. This according to me will be a great start before you start trading with real money. Good luck.
Does it matter in spinning tops, the color of candles?
No, it does not matter. The focus here is on prie action.
Can u explain me what exactly is the price action?
The regular price movement we see on the stock when plotted on the candle results in patterns. These patterns can be used to set up trades. So this is essentially what price action is really about.
Karthik, How is price of a share a given point decided?
Ex: if price of Justdial Ltd at 10 am is 450 and at 2 Pm is 475. How exactly did the price change fro 450 to 475?
Please check section 6.3 here – https://zerodha.com/varsity/chapter/the-stock-markets/
Dear Sir, As a doji or a spinning top points out the indecision in the market, you have pointed out many times to proceed ahead with just 50% of the capital for trading but Why not stay away from the trade?
(This question striked my mind)
You can choose to stay away and wait for clarity to emerge. However, what will you do if you have an existing position in the market?
Okay Sir, I didn\’t think about that.
Thanks for answering 🙂
Good luck!
Amazing and clear explanations. The various questions and your replies have made this materials very informative and useful. Thanks
Glad you think that way, Gopalan. Happy learning 🙂
And best part is that Karthik\’s prompt reply for every single question asked by the user(reader)
Karthik,
There are separate descriptions for Spinning Top and Doji formations. What is the REAL(practical) difference between the two? I can only think of the Doji having the exact same opening and closing price, while with the Spinning Top the price might have altered slightly throughout the session.
The only real difference is in the size of the real body. A spinning top has a very small real body whereas the doji has a no or a wafer-thin real body.
Hi,
How would we know that a particular day is bullish or bearish?
You can always look at the chart to know what happened during the day. If you want to know this in advance, then your guess is as good as mine.
This is amazingly educative content and very simple to kickstart learning path in TA. It would be great though if you guys can add tests/quizzes/assignments. People would be happy to pay for the course I am sure!
Yes, this is in the pipeline. All these and more will come up this year!
And by spinning top having small real body I guess it means that both the shadows should be atleast equal to the length of the real body. If the length of shadows are more then it is better.
There is a typo. The subheading 6.2 is repeated twice.
Yes, the equal shadows is desirable, but the whole point is about price action – a lot of intraday volatility, resulting in no meaningful change in prices.
I\’ll check the typo. Thanks for pointing it out.
For spinning top you mentioned there is 50% probability to go either way. If we initiate a trade it seems to be more like a blind guess since it is 50% chance even if it involves only 50% of the principal we wish to use. Won\’t it be prudent then to avoid trading using spinning tops? On the other hand Doji you mentioned is similar to spinning tops but it is more strong. Hence Dojis lean towards trend reversal. Hence I felt it is ok to take calculated risk on Doji. Am I missing something here?
I agree with the fact that if we already have long position and we see a spinning top we can initiate 50% sell(book some profit) and wait and see how the trend progresses. But if we don\’t have any position to start with then I don\’t see an urge to go long since it is like blind guess(a flip of a coin since you mentioned 50% probability).
Yes, if you do not have any position, then you can afford to watch and wait.
You do have a point. But with 50%, you are actually prepared for any move. Think about it.
Hi, Is there a free backtesting software. Or is there a place from where we can download freely data of various stocks for backtesting. My understanding is that data for live stocks is paid but not sure for historical data.
You\’ll soon be able to backtest online, quite efficiently. I\’d suggest you wait for another 8-10 days. Thanks.
Thanks. Will wait.
Cheers!
Dear Karthik
Thanks for all your efforts in preparing this module its really helpful like a beginner to me.
How important it is to see the trading volume while i am referring to either spinning tops or Doji??
Do we really have to look into the trading volume or not??
Doji volumes are invariably quite high. Low volume doji are not so frequent.
In the above chapter in intervals i came across range (range 1.7%, range0.8%). My doubt is of what value the 1.7% is?
Guess this is the difference in terms of the open and close.
which study pattern would be good for intraday trading along with candle stick charts ? and how to incorporate in kite this study i dont understand kindly help me i am new investor
and i like varsity it provide me a different view to see the market .
thank you sir and zerodha team
Tushar, the best trades, at least according to me are the ones where the Dow theory tenets coincide with the candlestick patterns. So I\’d suggest you read up on Dow Theory along with candlesticks.
Thanks sir
And sir i want to know the which book or article or website help me to better understand the following things
1. I want to verify my strategy of candel chart with some indictor to predict intra day trend
2. I want to know how to use piot
3. Fundamentally stock is good or not
Thank you sir
1) You need a backtesting tool for this, suggest you wait for few days to hear something from us
2) Pivot is a straightforward tool, will try and document this soon
3) Read this module – https://zerodha.com/varsity/module/fundamental-analysis/
thanks sir
Welcome!
Hi,
How to find the resistance of stocks like titagarh wagon -dt. 27.11.17, NRB bearings-dt27.11.17, where they are breaking previous numbers? They are forming bullish marubuzo. How do we identify resistance for such stocks ?
Have you checked the S&R chapter?
Yes, I did. But here the higher high has broken all past record and I\’m not able to get any past reference.
Well, in that case, I\’m afraid S&R will not come handy. You will have to track the positions closely and trail your stop loss.
Dear Sir ,
I trading in options daily. I heard that above 2crore turnover in option trading per annum is chargable or restricted ?
Nothing like that.
Thanks for making these tutorials available for free.
Cheers!
Bearish spinning top and bullish spinning top have any significance of they appear in up trend and down trend.
For example if a blue spinning top appears in down trend then it may indicate that more chances of reversal than if the red spinning trend come in a down trend
There is nothing like a bearing and a bullish spinning top. Spinning tops indicate a pause in the market which could lead to continuation or reversal…the chances of which are both 50%.
Hey Karthik,
To be a spinning top, what is the min and max value of the range body?
In the example it given as 3 and what can be the maximum value.
Cheers,
siva
There is nothing like a min/max. The body should be looked at with respect to the overall length of the candle.
Thanks Karthik, for short term trading which is best suited, x- 1 day, x- 1 day chart is it fine?
x-1 means?
Sorry for confusion, Can we use the candle chart with X axis set as 1 day and y axis set as 1 day for short term trading.
Pls advise.
Thanks
siva.
You can have time on both the axis. X is always time and Y is price, unfortunately, we cannot change this.
Hello Karthik,
Thanks to your TA and the varsity concept in whole i have now started to do understand TA much better and sorry to keep buggging you with questions.
I have a doubt while analyzing Nifty50 stocks i found that in case of appearance Doji or Spinning top in many cases the volume are not high(not above or equal to 10 day EMA on vol). In this case can i overlook volume and proceed with analysis as per the rest of the checklist or should i not enter this trade.
In general too does volume need to confirm each and every time or can it be overlooked in certain cases/candlestick patterns and if yes what would be those scenarios.
Regards,
Nayan
Generally speaking, volumes on doji/spinning tops are quite high simply because of the churn on such days. I\’d suggest you keep volume in perspective, it helps in building a stringent system.
Thanks Karthik.
Cheers.
It is difficult to interpret the prior trend. As you have instructed that you see 3-4 recent candles to find a pattern, I got a spinning top on Apollo Tyres. Now just looking at 3-4 candles it seems downtrend but I am not convinced as the looking broadly I seems to be a sideways trade.
Also, there was a inverse hammer (long upper shadow and \’no\’ lower shadow) in a downtrend. As per you explanation the candlestick is a shooting star which appears in Uptrend. So, how to intrepret this one? Thanks 🙂
Well, spinning top on a stand alone basis may not be the best candlestick pattern to trade on. The prior period trend should be at least 5-6 sessions with an at least 5% price movement.
In the absence of a strong prior trend, this may not be a good pattern to trade on.
In the charts that are used for examples and also if we would do the analysis, what time duration or time frame should we select for intraday analysis? We have options of viewing charts for 1 minute, 3 minutes, 5 minutes to 15, 30 and an hour. Which is best suited?
Higher the frequency, lesser is the noise level. Given this, I personally prefer the 15 mins charts.
Hello,
The Charts shown in the module are for 1 day or for 1 week what is the duration of these charts.
There are many charts in this module, Inderjeet. I\’m assuming most of them are on an EOD basis.
hello everyone pls Guy\’s simple word\’s mai kouch bolna chahta hu zerodha is one of the Best\’s stock market broker and zerodha q.a and varsity program very in formative for newbies but trading is not a easy in real market .first you learn everything about to TA and fundamental analysis and than start Paper trading okhy friends
Sahi baat hai 🙂
Sir,hats off to your work.This material is really helpful and written in very simple language.i was searching this type of tutorials on internet.i want to ask that is there any platform which can tell thatvin which stocks doji,spinning top,hanging man or any other formation has formed.because we cant see each stock everyday..
Happy to hear that Aditya. Have you check out the expert advisor feature – https://zerodha.com/expert-advisors/
Thanks you Karthik for providing this knowledge. It was a great learning.
Happy learning!
Great work! The time-frame of the above discussion is 1 day, are these strategies applicable to lower time-frames? like 15mins, 10mins and 5mins
TA techniques work across all time frames.
yes you can use ta every timeframe but if you are using ta short time horizon like 10-15 you will face wishpaw problem
Please allow for pictures to open in popup with zoom in/out option to clearly understand the candlesticks.
These are uploaded pics, Rahul. Not sure if wordpress allows this features.
hi Sir, if we encounter a doji or spinning top in daily chart, then can we go for STRADDLE strategy? preferring a long straddle by buying ATM CE and ATM PE? (Assuming we are in the first 15 days of the series). Please share your thoughts. Thanks.
Yes, as the outcome of a spinning top and doji is uncertain, you can set up a straddle.
I would really like to appreciate the efforts that you have put for this exhaustive material Karthik. Kudos to you!!
I have a couple of doubts –
1. If I\’m looking at EOD charts that means I\’ll be able to place an intraday/positional trade the next day right?
2. If I plan to enter a trade, is looking at past 3 months data(with weekly candles) sufficient or should I increase the time frame and/or no. of candles?
Thanks!!
Thanks Gaurav.
1) Yes, you can use EOD data for both intrday/swing/BTST positions
2) Take this on a case to case basis. There is no hard and fast rules ard this. If you get a convincing outlook on EOD data, then great. Typically, the longer the time frame, longer should be your holding period.
Am i right if i am saying that most of the times when dozi pattern or spinning top formed, it is the reversal of the trend. Mostly or in 80% situations, it shows a trend reversal.
Is it true?
Hard to say, it has a 50-50 change of a reversal or continuation.
rule 1 says that buy strength and sell weak, but if that happens i will end up in loss isn\’t it. Did i miss anything here, please drop me a quick reply karthik sir
Sarat, buy strength and sell weak helps you stay on track with momentum. Apply this couple of time to experience it.
Does small real body means that there low trading of a securities in a particular day?
Yes.
Does it mean low volume?
Not necessarily.
if the real body is small but the volume is large cant we say that trading occur is high
Yes, you can.
hey hi,
I don\’t know whether others have asked this question, but please do consider and clarify
when you guys say \”prior up trend\” or \”prior down trend\” what is approx. no.of candles we should consider?
Hi Srikanth, I guess this has come up in the past. If you are looking at end of day chart (and looking for a overnight position), then I would look at at least last 5-8 trading session, which should constitute at least 5-8% movement.
Thank you & sorry as the list of comments consists of last 2-3 year comments couldn\’t go through all…
My main concern was that in the charts above some time the marked \”prior up trend\” consists of both up and down trend , but if we look at on a broader scale it would look as UP TREND only.
Correct me if my Understanding is wrong- the PRIOR TREND need not be continuous blue or red candles but when we have a broader look it should be UP TREND OR DOWN TREND ..right?
Srikanth, this depends on the time frame you are looking at. Trends can change based on the time frame. For example a 6 month chart can look completely different from a 1 year chart, which an look totally different from a 5 year chart.
Thank you 🙂
Welcome.
hi,what does it mean 5-8% constitute?
and suppose if we are lukin for 1 year chart and all candles are in weekly then how many candles can be consider for prior trends?
5-8% constitutes the range or the % move the stock has to move for the trend to qualify. I guess a minimum of 15-20 weeks should be alright I guess.
why don\’t you make videos of all this material? 😉
That would consume a lot of bandwidth, Ram 🙂
1.sir am i want to ask, what time frame is good for intraday trading with these TA.
2.whats EOD
#biku- intraday traders usually prefers 5,10 and 15 min charts for entry and exit. but for determing trend they focus on highers time frame like hourly and EOD(END OF DAY/DAILY CHARTS). EOD shows the high,low,open and close of the whole day.
thnx broh
1) If you are starting, stick to EOD
2) EOD = End of day.
I should stick with EOD? by that do you mean i should take delivery rather then intraday trading
No, if you are starting out fresh, I\’d suggest you look at EOD charts to set up intraday trades. Once you are comfortable, you could switch to looking at intraday charts to identify opportunities.
sir pls clarify my doubt-
1) most of the action in market happens within 9.30 AM, so how should i time the entry?
2)suppose a stock is in downtrend and on the day opening the stock is UP by about 2% ; so whether i should look for buying oppotunity or shorting opportunity?
3)how should i confirm that Nifty is bullish or bearish because many time i pick stock which is in uptrend and nifty also bullish But after sometimes Nifty comes in bearish zone , so whether should i pick a downtrending stock or continue with my pick? Should i confirm the NIFTY trend in daily chart and pick stock based on NIFTY trend?
1) Not true. Its a myth.
2) Depends on what the charts suggest
3) Its always best if your stock and Nifty are trending in the same direction. Give you more conviction on the trade.
Good luck.
Hi Karthik, So it is not suggested to buy stocks when it is “Spinning tops in uptrend”, right? In case we have already bought, we can sell some and watch the market?
Yes, but remember spinning top conveys indecision, so I\’d prefer to sell half and wait on the other half.
Dear KARTHIK sir…COuld you please check BHEL\’s chart for last 10 days(since 27th Dec 2016). Its primarly in downtrend. there is small bounc since 27th Dec. On 5th Jan, it created a DOJI signaling nervousness. Next day, it went down. I thought that these 2 signs should be enough to bring bull on down foot. So it shoudl now go down. But today, it went up. Could you please help me where i went wrong?
Yes, BHEL is in a down trend (primary). Every pattern needs time to evolve, I would not be surprised if BHEL cools off further, eventually.
Hello Karthik,
Is rule no 2 \’be flexible, quantify and verify \’applicable to spinning top and doji? If yes, then what should be the tolerance in terms of percentage?
Thanks and regards.
Yes, it is a general rule applicable to everything in TA. I\’m afraid, I dont have a % number for these patterns. But if I were to guess, it would not be more than 0.3%.
What could be stoploss for spinning tops?
You would not trade based on spinning top alone, so there is no question of SL.
If TA has to be treated as authentic, why is it not possible to list (predict) the top gainers and losers in an automated manner? Why I am asking this is everybody does some TA if they are into short term trading but none of them are consistently successful. So what is the basis for considering TA as authentic or scientific? Can you tell me what is the percentage success you have in this and whether you don\’t take news into consideration at all? I hope percentage success is not confidential.
TA is not really a science, its more of an art form. This is exactly why TA is not really taught in finance academia. Each person\’s experience is different while trading using TA. I never really measured percentage success – but I can tell you this, my losses were contained and TA never let me lose my capital. Over time, I moved away from active trading (owing to a full time job) …but I still continue to invest in markets.
Thank you sir.
Welcome!
Above in the section \”Small real body\”
\”Both these situations lead to the creation of a small real body because a 3 point move on a 200 Rupee stock is not much\”
I guess the price is 207 then why do you refer to 200 rupees?
I can understand its close but what about if the price was 295. I mean the open price of day should be considered as the price.
Earlier in a reply you said
\”TA is not really a science, its more of an art form. This is exactly why TA is not really taught in finance academia.\”
I am a student of physics ,I have no idea of this market or how financial stuff works so my questions may be very naïve or stupid so sorry in advance.
TA is not really a science why? Yes definitely its not an empirical one but I see its based on Probability and Statistics, a lot of science is based on it say weather science ,quantum mechanics and a lot. Or there is something I am missing about TA.
You said
\”Over time, I moved away from active trading (owing to a full time job) …but I still continue to invest in markets.\”
Does it implies trading cant be taken as a full time job, there is no future.
Thank you so much for all your efforts. Its only because of you I am able to understand about equity market looking forward to go through all the modules. And sorry for any stupid question and long post.
200 is a generalization here, Debejit. More for a conversational convenience. If it was 295, I would probably call it 300 Rupee stock. Yes, TA has probability and some amount of stats…but no science backed theories.
Trading requires you to invent/discover new trading techniques. I\’ve not had that kind of time off late, hence I\’ve been investing.
Good luck!
Thank you so much
Cheers!
Hello Karthik,
Your material is a gold mine for many budding investors like me. Appreciate your efforts in this!
1. Is there a good website that provides stock data on companies along with candlestick charts and other charts taught in your materials?
2. What other materials do you recommend studying through, before I make a foray into the trading world?
Thanks!
Thanks Jashnak.
1) Have you checked out Kite? – https://kite.trade/docs/kite/#charting
2) Frankly, you should be good to go with what you read on Varsity 🙂
Will The Spinning Top & Dojis patterns will work with 1 min, 3 mins , 5 mins or 10 mins charts?
It would, but I personally prefer looking at it from EOD basis.
Hi Karthik,
Nice articles, appreciate your time to reply to all the queries & keep Varsity an engaging experience.
1. You have compared Doji to a spinning top(equal shadows) with small real body.I assume that in the case of Doji O=C & hence the authenticity of it is more as the degree of indecision is greater than a regular spinning top. I mean if I have to choose between two trades one with regular spinning top & other with a Doji , I favour Doji more. Are my assumpitons right?
2.Spinning top in presence of any of the other trend reversal candles add more value to the pattern ( Eg: Spinning top & a hammer) means a major chance of trend reversal?
3.In Pi , if right click on chart & select Pivot lines it draws S1,S2,S3 & R1,R2 ,R3 & a Pivot line, are these automated support & resistance lines alternate to the process of S & R that we identify manually . Are there any advantages of using automated over manual in terms of accuracy?
—
Thanks
1) Yes, for the simple reason doji\’s convey indecision with conviction 🙂
2) Yup, so would doji
3) These levels are identified by a \’pivot formula\’. I personally prefer the manual version.
if we saw a bearish marbuzo in the middle of the day…..thn what strategy should be use for the next day for intra day trading…..time frame is 5min…..
It may not be a good idea to look at a 5 min candle today and take a position tomorrow.
thanks for rply…..vry useful content kartik…..but for intra day is it sufficient …..is it possible to make profit apply these techniqies in intraday…
what should be the timefrme for intra day….bcz in 1 min timefrme i found many marubozu but the are not working for stocks like sbi & vendanta
I personally prefer 10/15 mins timeframe.
Yes, you can use the same techniques for intraday as well!
thnku….
Sir, am i right in saying that the rule \”Buy when strong………\” applies only in the case of Marubozu and that it is not a general rule ?
It is a general rule —- buy on strength, sell on weakness!
Thankyou Sir.
Welcome!
Acknowledge the fact that a lot of efforts have been put into getting these modules ready. A very good platform to get ourselves educated before taking any blind leap 🙂
In fact that is the whole point of this initiative 🙂
In some of the comments above \”Hanging Man Pattern\” has been discussed….Could you explain what exactly is that????
And Thank you Sir for educating all of us…:)
Section 7.3 – http://zerodha.com/varsity/chapter/single-candlestick-patterns-part-3/ explains will this.
Thank You for the simple & lucid reply Sir. Truly appreciate your active reply gesture, it really helps me a lot. May God Bless You with lots of Bounties in life !
Regards.
Thanks for the kind words Shafeeq!
Hello Sir,
Could please explain in brief the meaning of \”consolidating their position\”.
Really need help or example on this \”Consolidation\”.
Thanks in advance.
Regards.
Consolidating loosely refers to the act of averaging. For example – if you have a previous position, then you add to the existing position.
the chart..
hi, in case of the hanging man chart2(BPCL), though the market behaved as wanted, we would make a loss as the high of next day more than the stop loss of the hanging man??
Well, it really depends on the trader. Some traders like to wait till the close (3:15 or 3:20 PM) to estimate of the SL is breached (or not). In such cases you would not make a loss, otherwise you would.
Hello,
In order to confirm that a prior trend is DOWNWARD(or UPWARD), for how many trading sessions does the stock need to trade BEARISH(or BULLISH)
thanks for the quick response Karthik.
So, if the pattern is formed on Day 1 and if the closing price of Day 2 is higher than the HIGH of Day 1(even if its a red candle day), hanging man analysis stands void.. please confirm.
Yup, this is because the high of the pattern (P1) is considered the stoploss for the trade.
Hi,
For GM Breweries, Hanging man formed on 1st and 2nd was a red candle day, as per the analysis done, one should have booked the profits by shorting. but as can be seen today, that price is on a higher side. Can we assume that this pattern doesnt work in this case or i should wait for some more time, to see if it turns out to be a red candle day?
the tooltip doesn\’t show the data for 1st, the encircled one.
Thats an image, hence does not work.
Since the current price is higher than the pattern\’s high, the hanging man stands invalid.
Hi Karthik, most of the time when DOJI present on the chart. It shows a trend reversal. what about your opinion.
I just wan to get an answer from an expert .
In most of the cases it does happen that way.
u are a great teacher u make every thing simple. lucky now i hv started with zerodha. thanks karthik
Glad to have you with us 🙂
Dear Sir, You have a talent of teaching people in a very lucid language .Kudos to you on that. You can think of educating others as your alternative career. I am not understanding , when i look for charts, trends whatever ,it will present the charts as of date or will it give me patterns predicting future?
Thanks for the suggestion Prattham 🙂
The idea is that the past patterns help up identify patterns to trade. Back testing is the key.
Suppose i am looking for candlestick chart of Axis bank or xyz.ltd on 1 nov. The chart will be as of that date and of course the past data or it will predict the future patterns for the next week as well. If it will give for the future as well what analysis I am going to do . I will simply believe the charts and place my trade. Apologies for being so naive
Prattham – Although all the charts display historical performance, I do believe (i have only heard of such things, not seen myself) there are few charts that give out future predictions…not sure how reliable they are.
can TA be used for shortterm(3-6months),medium term(6-12months) or long term (>1year)??.if yes what should be the frequency of chart(1day,1week)?. does it also mean trading frequency will decide the trading days . i mean if we take frequency of 1week ,i can only trade after that week?technically.
@thanks to zerodha team &kartik for great piece of knowledge. I suggest to add new successful methods & technique of TA as an examples for better understading.
Yes, TA can be used for any time frame you wish. Irrespective of the time frame always look at at least 1 year data.
Hi Karthik,
Any stoploss suggestion for Doji/Spinning Top for bullish/bearish trend?
Doji/Spinning tops are not really a trading candle, they only indicate that the market is in a state of confusion with equal push by both bulls and bears. Hence tough to call SL levels for these patters. For every other candle use candles high (for short trades) and low (for long trades) as stop loss.
Can you please elaborate a little on why the stop loss is selected as the low(or high) of that day\’s candle.
Low is the SL for all long trades – this is the default price point in candlestick patterns. Perhaps because at this price the sentiment changed. Likewise for the high point, which is the SL for all short trades.
Great work sir…i learnt a lot.
Glad to know it helped 🙂
thank you
sir
heloo sir
could you please provide these all with a \”virtual trading platform \” so that we can test these all before entering in real trading market
and after getting trained and understandimg all these concepts and minimize our losses
Prakash – will try and do that. Meanwhile you could start doing paper trades.
Sir could you please tell what do yuo mean by paper trades?
thanks and regards
dhanush
Paper trades is a term used to refer to a dummy trade. No real money is involved, you just assume you have a position and track the profit or loss that arises out of it. People do this to learn and practice trading.
Sir, can I start practicing paper trade with the knowledge I have until this chapter ?
thanks and regards,
Muskan
Of course, you can 🙂
All examples are on shares/ stocks but no example on commodities i.e on metals or crude etc.
We will include a separate module on commodities and interest rate futures sometime soon.
Sir, i would like to know more about dragonfly doji and how reliable it is?
Dragonfly Doji is somewhat similar to to a paper umbrella – you can apply the same trading logic to it.
sir, is it possible to set macd like the attached one in PI. if so could you plz advice me the steps to do so this one gets changed automatically as per the time frame and to the different stock selection (below snap taken from bazaar trend site)
Yes, this is possible I guess. I would suggest you email [email protected] for this, they will help you with it.
Doji tells the direction to be reverse in next session
Dojis and spinning tops basically convey indecision in the market. Both the bulls and bears have equal strength, hence markets stay flat.
@Karthik,
Hats off for your great work. 🙂
Welcome!
Are these material enough for a regular trader or do I need to study more to dig deeper into the topics?
As far as we believe the material here is more than sufficient for you to get started and get comfortable with trading. Of course there is no harm in learning more 🙂
And of course, there is no end to learn more. 🙂
Y0u said it!
Can you give some proper sources for the same where jargon\’s as well are explained clearly. :p
I\’m under the impression that this is the proper source 🙂
does upper & lower shadow in doji need to be equal
Not necessary.
Sir, do we have any software for chart,volume study
Yes indeed, have written about it in this chapter.
Thanks for the information.
Dear sir,
What do u mean by Red candle day or Blue candle day.
If there is a gap up opening, is it Blue candle day?
And if it Gap down opening iS It a Red Candle day?.
Pls explain
A red candle day represents a bearish day and a blue candle represents a bullish day. There could be a Gap opening, but the gap could be filled intra day hence Gaps as such does not decide the colour of the candle.
What is gap up opening or gap down opening?
The same is explained here in this chapter – http://zerodha.com/varsity/chapter/multiple-candlestick-patterns-part-3/
one suggestion..why not upload a test for entire module with various set of questions having 4-5 options(cleverly constructed questions)such as
1. theoritical question
2. questions on a particular graph etc etc
Great suggestion Kashish. We will try and implement this sometime soon.
Hi Karthik,
Is % of Deliverable Quantity to Traded Quantity will impact any of our trading Strategies?
Not really.
please add some test or give practical questions or a practical series of question so that we can implement this knowledge in that btw this is very helpfull
That has been on the agenda for a while now, Labhansh. We will do something about this soon. Thanks.
In fact,
This could be replicated for all modules. A set of tricky questions will help sharpen whatever we learn here, and who better than you guys to frame those questions?
We are working on those lines, Apurva 🙂
That is exactly what I was thinking. I infact tried to search over internet some example for each type of Candle so that I can practice more and my mind and eyes can be trained.