
5.1 – Overview
As the name suggests, a single candlestick pattern is formed by just one candle. So as you can imagine, the trading signal is generated based on 1 day’s trading action. The trades based on a single candlestick pattern can be extremely profitable provided the pattern has been identified and executed correctly.
One needs to pay some attention to the length of the candle while trading based on candlestick patterns. The length signifies the range for the day. In general, the longer the candle, the more intense is the buying or selling activity. If the candles are short, it can be concluded that the trading action was subdued.
The following picture gives a perspective on the long/short – bullish, and bearish candle.
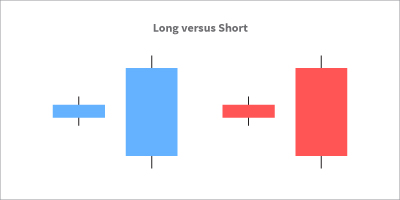
The trades have to be qualified based on the length of the candle as well. One should avoid trading based on subdued short candles. We will understand this perspective as and when we learn about specific patterns.
5.2 – The Marubozu
The Marubozu is the first single candlestick pattern that we will understand. The word Marubozu means “Bald” in Japanese. We will understand the context of the terminology soon. There are two types of marubozu – the bullish marubozu and the bearish marubozu.
Before we proceed, let us lay down the three important rules about candlesticks. We looked at it in the previous chapter; I’ve reproduced the same for quick reference:
- Buy strength and sell weakness.
- Be flexible with patterns (verify and quantify)
- Look for the prior trend.
Marubozu is probably the only candlestick pattern that violates rule number 3, i.e., looking for a prior trend. A Marubozu can appear anywhere in the chart irrespective of the prior trend; the trading implication remains the same.
The textbook defines Marubozu as a candlestick with no upper and lower shadow (therefore appearing bald). A Marubozu has just the real body, as shown below. However, there are exceptions to this. We will look into these exceptions shortly.

The red candle represents the bearish marubozu, and the blue represents the bullish marubozu.
 5.3 – Bullish Marubozu
The absence of the upper and lower shadow in a bullish marubozu implies that the low is equal to the open and the high is equal to the close. Hence whenever the Open = Low and High = close, a bullish marubozu is formed.
A bullish marubozu indicates that there is so much buying interest in the stock that the market participants were willing to buy the stock at every price point during the day, so much so that the stock closed near its high point for the day. It does not matter what the prior trend has been, the action on the marubozu day suggests that the sentiment has changed and the stock is now bullish.
The expectation is that with this sudden change in sentiment, there is a surge of bullishness, and this bullish sentiment will continue over the next few trading sessions. Hence a trader should look at buying opportunities with the occurrence of a bullish marubozu. The buying price should be around the closing price of the marubozu.
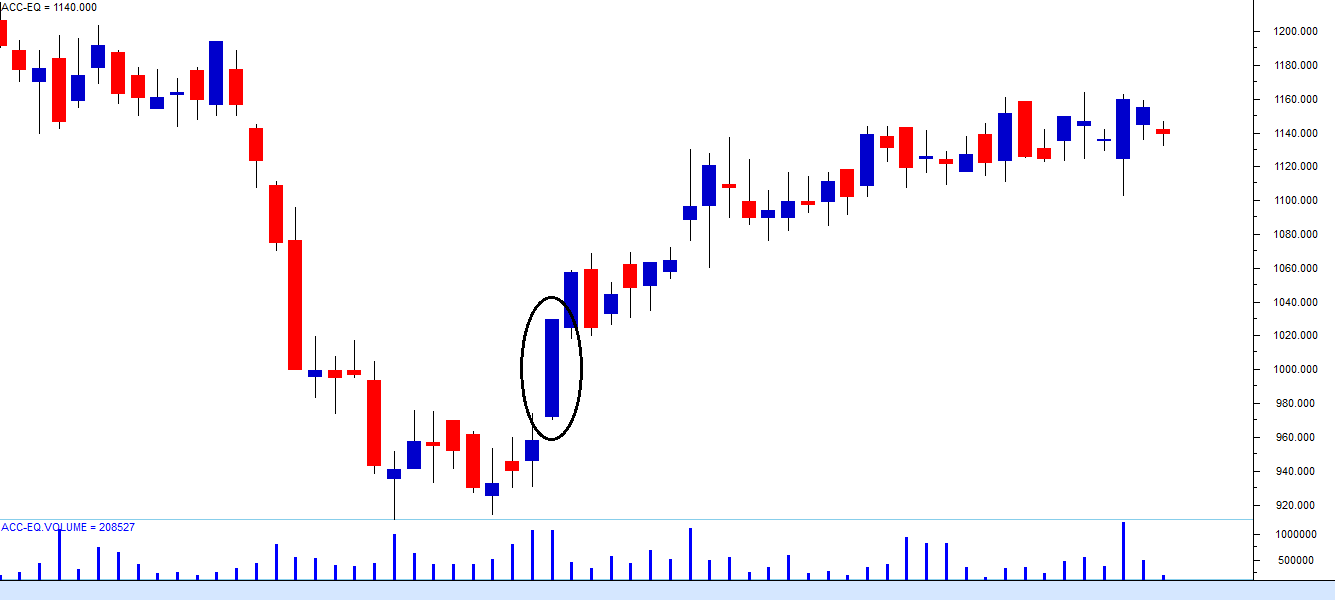
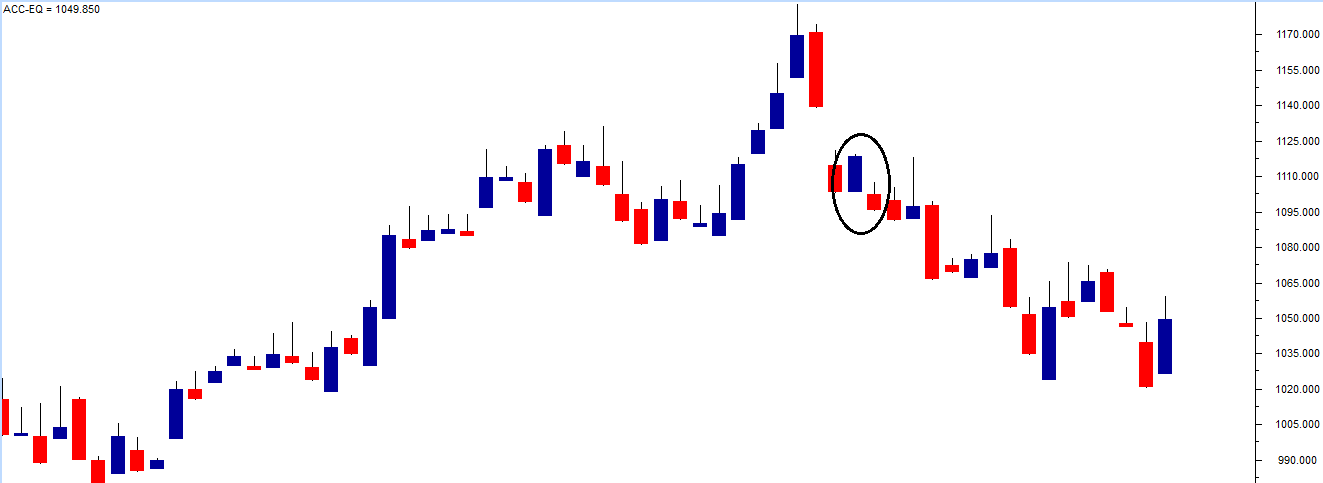
In the chart above (ACC Limited), the encircled candle is a bullish marubozu. Notice the bullish marubozu candle does not have a visible upper and a lower shadow. The OHLC data for the candle is: Open = 971.8, High = 1030.2, Low = 970.1, Close = 1028.4
Please notice the textbook definition of a marubozu Open = Low, and High = Close. However, in reality, there is a minor variation to this definition. The price variation is not much when measured in percentage terms, for example, the variation between high and close is 1.8, which as a percentage of high is just 0.17%. This is where the 2nd rule applies – Be flexible, Quantify and Verify.
With this occurrence of a marubozu the expectation has turned bullish, and hence one would be a buyer of the stock. The trade setup for this would be as follows:
Buy Price = Around 1028.4 and Stoploss = 970.0
As it is evident, candlestick patterns do not give us a target. However, we will address the issue of setting targets at a later stage in this module.
Having decided to buy the stock, when do we actually buy the stock? The answer to this depends on your risk appetite. Let us assume two types of a trader with different risk profiles – the risk-taker and the risk-averse.
The risk-taker would buy the stock on the same day as the marubozu is being formed. However, the trader needs to validate the occurrence of a marubozu. Validating is quite simple. Indian markets close at 3:30 PM. So, around 3:20 PM one needs to check if the current market price (CMP) is approximately equal to the high price for the day, and the opening price of the day is approximately equal to the low price the day. If this condition is satisfied, you know the day is forming a marubozu, you can buy the stock around the closing price. It is also essential to note that the risk-taker is buying on a bullish/blue candle day, thereby following rule 1, i.e., buying on strength and selling on weakness.
The risk-averse trader would buy the stock on the next day, i.e. the day after the pattern has been formed. However, before buying the trader, ensure that the day is a bullish day to comply with rule number 1. This means the risk-averse buyer can buy the stock only around the close of the day. The disadvantage of buying the next day is that the buy price is way above the suggested buy price, and therefore the stoploss is quite deep. However, as a trade-off, the risk-averse trader is buying only after doubly confirming that the bullishness is indeed established.
As per the ACC’s chart above, both the risk taker and the risk-averse would have been profitable in their trades.
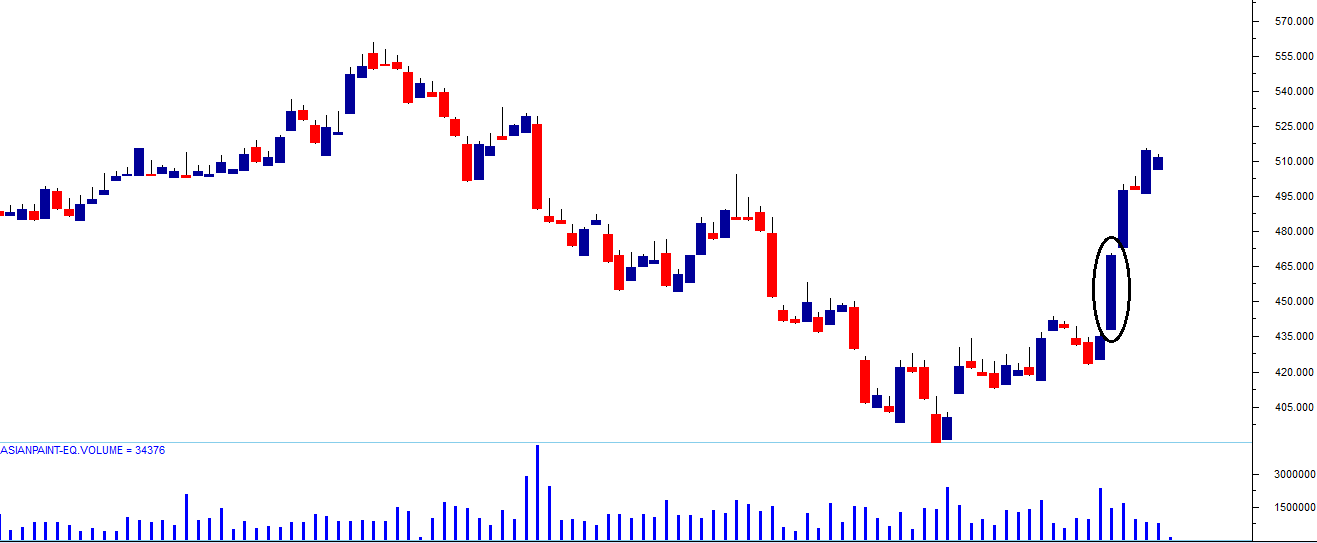
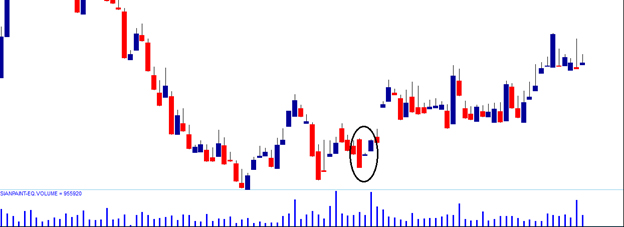
Here is another example (Asian Paints Ltd) where both the risk-taker, and the risk-averse trader would have been profitable.
Here is an example where the risk-averse trader would have benefited :
Notice in the chart above, a bullish marubozu has been encircled. The risk-taker would have initiated a trade to buy the stock on the same day around the close, only to book a loss on the next day. However, the risk-averse would have avoided buying the stock entirely because the next day happened to be a red candle day. Going by the rule, we should buy only on a blue candle day and sell on a red candle day.
5.4 – The Stoploss on Bullish Marubozu
What if after buying, the market reverses its direction and the trade goes wrong? Like I had mentioned earlier, candlestick patterns come with an inbuilt risk management mechanism. In case of a bullish marubozu, the low of the stock acts as a stoploss. So after you initiate a buy trade, if the markets move in the opposite direction, you should exit the stock if price breaches the low of the marubozu.
Here is an example where the bullish marubozu qualified as a buy for both the risk-averse and the risk-taker. The OHLC is : O = 960.2, H = 988.6, L = 959.85, C = 988.5.
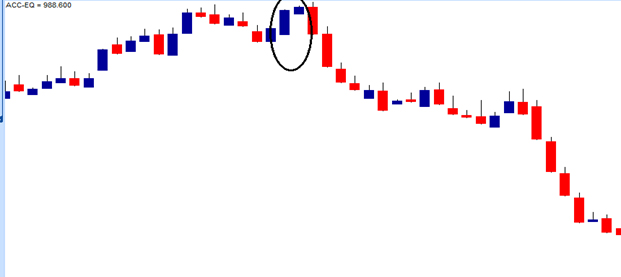
But the pattern eventually failed, and one would have booked a loss. The stoploss for this trade would be the low of marubozu, i.e. 959.85.
Booking a loss is a part of the game. Even a seasoned trader goes through this. However, the best part of following the candlestick is that the losses cannot run indefinitely. There is a clear agenda as to what price one has to get out of trade provided the trade starts to move in the opposite direction. In this particular case booking a loss would have been the most prudent thing to do as the stock continued to go down.
Of course, there could be instances where the stoploss gets triggered, and you pull out of the trade. But the stock could reverse direction and start going up after you pulled out of the trade. But unfortunately, this is also a part of the game, and one cannot really help it. No matter what happens, the trader should stick to the rules and not find excuses to deviate from it.
 5.5 – Bearish Marubozu
Bearish Marubozu indicates extreme bearishness. Here the open is equal to the high and close the is equal to low. Open = High, and Close = Low.
A bearish marubozu indicates that there is so much selling pressure in the stock that the market participants actually sold at every price point during the day, so much so that the stock closed near its low point of the day. It does not matter what the prior trend has been, the action on the marubozu day suggests that the sentiment has changed and the stock is now bearish.
The expectation is that this sudden change in sentiment will be carried forward over the next few trading sessions, and hence one should look at shorting opportunities. The selling price should be around the closing price of the marubozu.
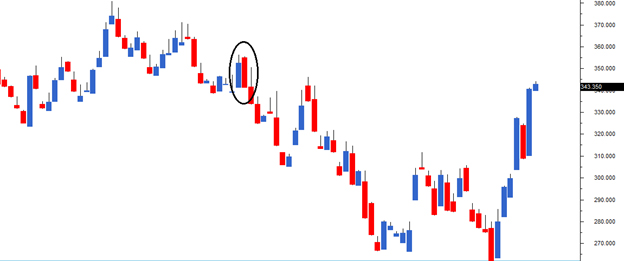
In the chart above (BPCL Limited), the encircled candle indicates the presence of a bearish marubozu. Notice the candle does not have an upper and a lower shadow. The OHLC data for the candle is as follows:
Open = 355.4, High = 356.0, Low = 341, Close = 341.7
As we had discussed earlier, a minor variation between the OHLC figures leading to small upper and lower shadows is ok as long as it is within a reasonable limit.
The trade on the bearish marubozu would be to short BPCL approximately at 341.7 with a stoploss at the high point of the candle. In this case, the stoploss price is 356.0. Of course, we still haven’t dealt with setting targets at this stage, and we will figure that out much later in this module.
Remember this: Once a trade is initiated, you should hold on to it until either the target is hit or the stoploss is breached. If you attempt to do something else before any one of these event triggers, your trade could most likely go bust. So staying on the course of the plan is extremely crucial.
Trade can be initiated based on the risk appetite of the person. The risk-taker can initiate a short trade on the same day around the closing. Of course, he has to make sure that the candle is forming a bearish marubozu. To do this at 3:20 PM, the trader must confirm if the open is approximately equal to the high and the current market price is equal to the low price. If the condition is validated, then it is a bearish marubozu, a short position can be initiated.
If the trader is risk-averse, he can wait till the next day’s closing. The short trade will go through only by 3:20 PM next day after ensuring that the day is a red candle day. This is also to ensure that we comply with 1st rule – Buy strength, and Sell weakness.
In the BPCL chart above, both risk taker and risk-averse would have been profitable.
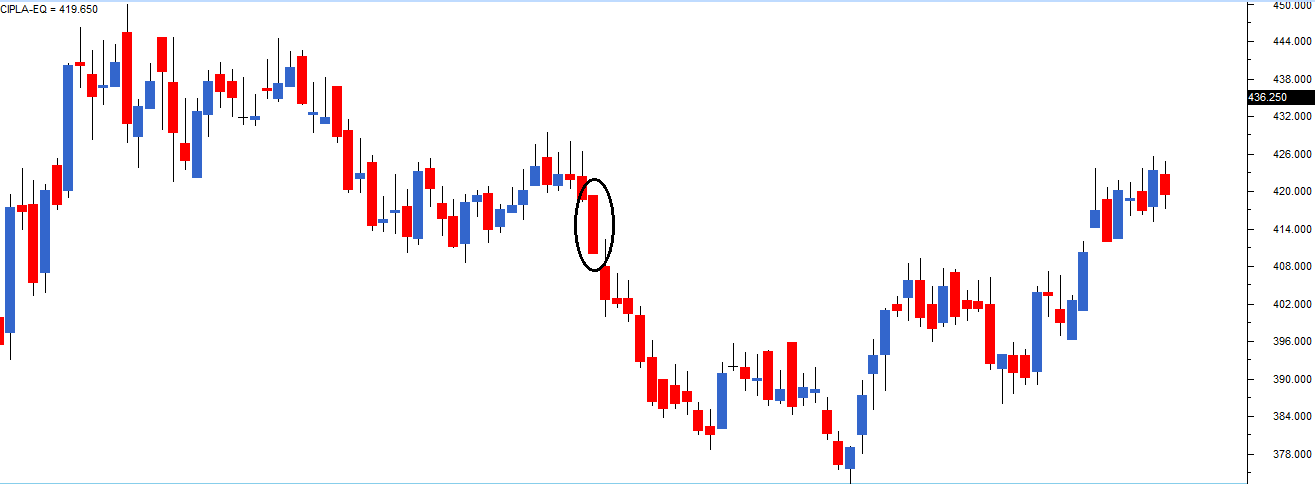
Here is another chart, Cipla Limited, where the bearish marubozu has been profitable for both risk-taker, and a risk-averse trader. Remember these are short term trades and one needs to be quick in booking profits.
Here is a chart showing a bearish marubozu pattern that would not have worked out for the risk-taker, but a risk-averse trader would have avoided initiating the trade, thanks to rule 1.
5.6 – The trade trap
Earlier in this chapter, we did discuss the length of the candle. One should avoid trading during a minimal (below 1% range) or long candle (above 10% range).
A small candle indicates subdued trading activity, and hence it would be difficult to identify the direction of the trade. On the other hand, a long candle indicates extreme activity. The problem with lengthy candles would be the placement of stoploss. The stoploss would be deep, and in case the trade goes wrong, the penalty for paying would be painful. For this reason, one should avoid trading on candles that are either too short or too long.
Key takeaways from this chapter
- Remember the rules based on which candlesticks work.
- Marubozu is the only pattern which violates rule number 3, i.e. Look for the prior trend.
- A bullish marubozu indicates bullishness.
- Buy around the closing price of a bullish marubozu
- Keep the low of the marubozu as the stoploss
- A bearish marubozu indicates bearishness.
- Sell around the closing price of a bearish marubozu
- Keep the high of the marubozu as the stoploss
- An aggressive trader can place the trade on the same day as the pattern forms.
- Risk-averse traders can place the trade on the next day after ensuring that it obeys rule number 1, i.e. Buy strength, and Sell weakness.
- Abnormal candle lengths should not be traded.
- Short candle indicates subdued activity.
- Long candle indicates extreme activity; however, placing stoploss becomes an issue.
Hi Kartik,
I am embarking on my trading journey and have a question. You can short stocks only as an intraday trade: sell first, then buy back the same quantity before the market closes. You cannot carry that short position into delivery/overnight in the spot market, so if you want to hold a bearish view beyond the day, how do we do that?
Then you will have to hold futures 🙂
I am learning option trading:
i) What time frame should I be looking at — 1 min, 5 mins, 15 mins, or 30 mins?
ii) What price interval will I be looking at in Nifty 50 — 25, 50, or 100?
iii) Is technical analysis — specifically single candlestick patterns and multiple candlestick patterns — applicable to option trading as well?
1) Longer the better, I\’d prefer 15
2) Price interval?
3) Yes, apply on spot to trade options.
Thank you very much, Sir!
1) My swing trading setup is first candle of the day 1 hour time frame bulishmarubozu breakout.
The problem is sometime it retraces and sometime it doesn\’t.
I am finding it difficult to take entry in trade.kindly guide about entry.
2) right now im using RRR1:2 about 45% win rate, what should b ideal rrr for the above setup.
Thanku for ur guidance since 2020.
1) Do you want to initiate only when it retraces? Why dont you back test strategies where in you test the success ratio for initiating trades x% away from breakout.
2) I personally prefer at least 1.5Rupees of reward for every Rupee of risk.
Kindly guide which website helps in back testing
Thanku
Check streak.tech for backtesting.
In Streak, after running backtest, whatever the result profit or loss we cannot see what will b the profit or loss after adding trading charges.
its showing individually. now if i am running back test on 50 scripts its difficult to know what will b my profit or loss after adding trading charges .
I saw a old video of streak it had a feature in which over all profit or loss used to change after adding trading charges, but now streak has removed this feature.
If strategy frequency is high then trading charges is an important feature.
Thank u
For this, its best if you check with streak directly 🙂
As for Someone Like me Who Just want to speculate on price of certain stock and not want to trade Until get Well verse in Candlestick pattern Summing up What is Better time frame To speculate is 15min or 1 day or anything else
Please !
Thank You
1 day is good to begin with 🙂
Meant a lot
Thank you very very much sir 🤩
Happy learning 🙂
i just saw a bullish and bearish marubuzo inside 5 min. so what does it means is it bullish or bearish?
Its very hard to establish trend with 5 mins videos. Why dont you expand it to 10 mins. By the way, the way to do this is to pick the first candle and trade based on that till your target or SL is hit.
Which timeframe is most reliable for identifying a bullish or bearish marubozu—15 minutes, 1 hour, or daily? For instance, if a bullish marubozu forms on a 15-minute chart, does its impact typically last only for the next 15 minutes, or can it influence price action beyond that? In simple terms, how do we determine the validity and duration of a marubozu signal?
Generally speaking, higher the timeframe, the better it is. Although this is my personal opinion. Keeping that aside, Marubuzo works across different time frames and you should really be ok to use it, but keep your risk appetite in perspective.
Hello sir,
This can be applied to any time frame chart. One just has to look for a marubozu candle that fulfills the rules. Correct? When you mentioned that it\’s a red candle day or a blue candle day. Can you please clarify as in the trader is able to find that perfect candle for the day? Didn\’t get this point.
Thank you.
no candle is perfect, you have to looking price pattern and trend on it
Of course 🙂
Thats right. It can go on any timeframe, and the color does not matter.
While studying Marubozu candles, I understood that the textbook definition (open = high and close = low, or vice versa) rarely happens exactly in real markets. Small differences between these values usually appear.
My question is: how much deviation is still acceptable for a candle to be considered a Marubozu? For example, if the open is 355.4 but the high is 356.0 instead of being exactly equal, is it still considered a Marubozu? Up to what difference between the open and high (or close and low) should we still classify the candle as a Marubozu?
The difference is best measured in terms of %. Basically the length of the shadow measured as a percentage of of the range of the real body. Say something like 0.2% or lesser is good.
sir do we have to mannualy calculate the percentage or it is already provided
Its there in the trading terminal anyway.
Hello Sir / Madam,
Could you please let us know how can we use Marubozzu in shorter Time frame. Lets say if we doing intraday trading.
Appreciate your reply.
The thought process remains the same, nothing changes 🙂
Hey, i have a question about worst case scenario like what worst can be happen when a marubozu candlestick happens it can hit SL at worst but what if that stock is gap up or gap down then it can skip our SL and can lead to more significant losses. What\’s your views on this.
Thanks.
Worst case, as it should be is your stoploss getting triggered. Gap ups and downs are not in our control 🙂
so that can be worst case i think because it will skip Stop loss if gap up or gap down occurs that can lead to more losses than over calculated risk
Sure that works. Good luck and best wishes for your trades 🙂
do we need to memorize/remember all this information? how do we go about studying it?
Not needed, you can check this – https://youtu.be/z0Rwoz6PduM?si=nnCB1gPmuPyYGvDK
In bearish marubozu, a risk taker will go short on the same day and buy around 3:20pm. But isnt it that in a short position, you have to buy before the EOD. so selling at 3:20pm and buying at 3:30 pm? will this make sense?
You can short using futures and carry over the position overnight, Jash.
The trade trap- One should avoid trading during a minimal (below 1% range) or long candle (above 10% range). Is this applicable to all candlestick patterns or just the Marubozu candle?
Yes, you can extend this to all candlestick patterns!
Do the candlesticks pattern apply to certain time limits like intraday or applicable to all time frames?
Applicable to all time frames. But personally, I prefer to use it on the end of day time frame.
Hi Karthik, I was wondering in a case of a long Bullish Marubozu, should we keep the stop loss at 10% of Buy, because the buy strength is positive, so the movement should anyways be bullish, right? I didn\’t quite understand why placement of SL in such a case would be a problem.
You cannot generalize this, it really depends from a case to case basis.
Hi,
If I am trading stocks, how can I short it at the end of the day even if I see a bearish Marubozu? Dont I need to complete a shorting transaction on the same day?
To short and carry forward the position, you will have to use F&O.
I didn\’t understand stoploss the stock is constantly moving up and down how will i know what should be the stoploss because weather the market is up or down it will come down and again go up. I didn\’t undrstnd how it works. Can u pls expln it agin.
Thats the reason why you need to place the stoploss at an appropriate place and not randomly 🙂
how to calculate short less than one % and long candle more than 10%
Sorry, dint understand the query. Can you share more context? Thanks.
On 14 october i found a few Marubozu candles, but most of them got failed to give the continue trend.For instance, if you look at NIFTY index on 14 Nov 2025(5 min timeframe) at 9.30 AM,10.50 AM,1.25 PM time candles,Marubozu formed but failed to give the contiune trend. What could be the reason. How to avoid such traps? Could also please make a module on how to avoid traps in trenad breaks, Support/Resistence false break etc…Please.
Soryy its 14 Nov 2025 not october
I want also a suggestion from you which type of trading is better risk-taker or risk-avere.What will you recommend.whats your style of trading risk taker or avere?
It depends on your risk taking capacity.
Just to be aware that there is no certainty in these patterns. You will have to backtest these to an extent you know the odds of a certain pattern working on a certain pattern before hand. You can do that quite easily with backtesting software and AI these days.
You mean to say if I wish to trade a stock, then I have to backtest all the discussed candles in the module- whether they are applicable for the stock or not? And then only pick the patterns that are giving a positive result?
Can you please let me know any good back testing software ?
Try streak.tech or maybe you can even try Perplexity AI 🙂
Sir can you suggest a nice paper trading app.
You can try Kite, not typical paper trading, but just 1 or 2 shares to get the hang of it.
If there are two marubzo formed between 10am to 12 pm one is bullise and other is berrise Which one is valid for take trade.
Take the latest formation.
If marobuzu is formed on 10am then i wanna take trade at 12pm for that trade ohlc of marobuzu is valid or 12pm candlestick is valid.
Yes, you can. Just ensure, as I\’ve explained in the chapter that neither the SL or the target price is breached.
Stop loss get triggered if trade goes in opposite direction but after marobuzo there are some blue candle the trader is in profit how he is in loss.
Ex : in chart the marubozu is open at 436 and go up till 520.
Niraj, the trader is in notional losses. The trade has to be held till the target is hit or till the SL is triggered.
Hi Sir ,
Can u please confirm the accuracy rate of this concept? Is there any such data exist?
If i wanna learn more about this pattern what should i do, is there any scammer which shows morubozu formation?
You can actually back test these and figure the right optimized way of using these even before you get started 🙂
Do check streak.tech to backtest.
If we are taking the 100 stocks from the Nifty 100 stocks, how could we rectify whether a bullish or bearish marubuzo is formed.
Assuming that every trader is a learned Technical Analyst and there are Alog traders as well, will it still work in our favour?
Is a Marubuzo candlestick effective when viewed in a Daily to Monthly timeframe rather than in a shorter timeframe?
Thats why we need to track the market closely to figure what price action is happening where. You will get a sense of whats happening once you track the price action. In my view, daily time frame is good 🙂
Sir,
1) as you mention in the asian paint chart risk taker would intiated the trade to book loose but in chart after marubozu there are some blue candle how he book loose he is in profit ?
2) In risk averse chart u said that the trader will avoide trade becauuse he known that next day is red candle day (how the trader get known about whats gone happen next day)?
1) But the stop loss would have triggered right? There is no question of holding the position if the SL has triggered.
2) The decision to initiate the trade happens on Day 2, near the close of the day. So you have enough clarity right?
its important to take entrry when marubozu is form or or we can take entry for past marobuzu? for ex : if morubozu is formed at 11am and we take entry at 2pm .
You can enter at 2, provided the trade is still valid, meaning it should not have breached the SL or should not have triggered your target.
Hi Kartik,
Thanks a lot for sharing your knowledge and information. In the section 5.5 – Bearish Marubozu is mentioned these are short term trades and one needs to be quick in booking profits. can you confirm what is the best time frame to use this candle.
I\’d suggest you use EOD charts for this Shiv.
hi karthick sir.
I often notice differences between daily OHLC candles and intraday candles. Later, I came to know that daily OHLC is accurate as it comes from the Bhavcopy. If daily data is the most accurate, then how should intraday traders, especially those relying on strategies like the first 5-minute candle breakout, handle these mismatches?
IN REAL ITS EASY UNDERSTAND AND FIND THE CANDLESTICK PROPERLY WANT TO INCREASE THE FINDING ACCURACY MEANS WHAT SHOULD I WNNA DO(UPSKILLING)
You need to practice more, look at more candles, charts, and try and find patterns on a daily basis.
The difference you are talking about is the EOD closing price, which is actually the average of the last 30 mins traded price. Intraday is accurate 🙂
No sir, I am not talking about the EOD price. I was referring to the open, high, and low values. I noticed mismatches on TradingView platform and came to know it happens due to the technical limitation of not capturing all ticks from the exchange. Later, the daily candle is updated accurately after receiving the Bhavcopy from the exchange. I read this in your Q&A section in Zerodha, and that’s why I asked this question, sir. So, there is no mismatch in prices between daily candles and intraday candles now a days, right sir?
Ah yes, if you find taking data from Bhavcopy convenient, then you should 🙂
Btw, the variance is not much, although I\’ve not checked this in recent times. Please do share your findings 🙂
Yes, on 2nd Sep I noticed a mismatch in the nifty price during live market hours, but later the intraday chart got updated correctly after market close. That’s where my confusion comes from—why the live data shows differently and then adjusts after EOD.
Is it the closing prices you are referring to?
Hi Karthik,
Thanks for such knowledgeable content. Had a question that as you mentioned that a risk averse trader will wait for the end of the 2nd day to recognize it as a red or blue candle day but if the trader buys or sells at the end of 2nd day then what about the outlook for 3rd day. I know there is no definite possibility on the basis of charts but just want to know if a trader waits till the end of 2nd day to take the decision after confirming about the type of day then for the 3rd it is the same position of the trader that is on the end of 1st day that he wants to confirm next day before trade.
The idea with buying on the 2nd day (after the confirmation), is with the expectation that the momentum will continue for the subsequent trading sessions, and you can ride the trend.
One should avoid trading during a minimal (below 1% range) or long candle (above 10% range).
Please explain How to calculate candle in terms of %
Check this Nadim – https://youtu.be/1kQjXFL4Mfc?si=VvpidpTJLZZtTFhc
Still sir couldn\’t understand the concept of range.
What exactly is confusing you? Let me know if there is a specific concern.
I had a doubt- for a risk averse trader there should be a marubozu candlestick on day 2 also or only any blue(for buy) and red(for sell) candle on day 2 would do the job. Also the stoploss would be decided by day 1 candlestick?
No, it has to be a blue candle the next day. Yes, SL is based on day 1.
hello sir,
when does risk taker buy the stock in bullish Marubozu – is it on closing price of the bullish Marubozu or else at the end of the day(3.20pm) to validate the occurence of the marubozu.
At 3:20 on the day of the pattern formation.
if he/she buys at the 3.20pm how they will book profits? at 3.30pm market closes
They will be looking forward to booking profits in the following days. This pattern can be used for both intraday and swing trades.
Thats right.
thanks bro
These are not intraday trades, you carry them forward.
hello kartik sir , i am someone who is new to trading and am reading all the modules of zerodha , i am 18 yrs old and still have time before my college starts apart from these modules are there some other books that i need to read for theory knowledge
Hi Aditya, glad you liked the modules! I have recommended a few books in the modules itself. I\’d also encourage you to watch the videos on our YT channel, we have a ton of information there.
Best wishes for your college 🙂
thank you so much kartik sir , i will definetly check out the videos on zerodha varsity youtube channel and as i read the module i will also make a note of the books that u have mentioned
Good luck and best wishes, Aditya.
Hii Karthik,
I wanted to ask if Marubozu only occurs for a whole day? Can it happen in a short period, such as a few minutes or hours?
It can occur on any timeframe, Ishika and not just on EOD charts.
Hello Karthik Sir, I\’m totally a beginner in stock market and I want to pursue it as my career please advice me which course should I look for to gain knowledge about the market.
Check this – https://youtube.com/playlist?list=PLX2SHiKfualEz2gJkDLFmc9WlufjfLBUx&si=26L_Vyo0jstmmu6H
Hey Karthik, What time frame chart should we analyse for all the candle stick patterns. Should it be daily, weekly or monthly? Consider i am a newbiee in market and want to earn profit even if it takes time.
I would suggest you look at the EOD charts to get started. Once you gain comfort, you can look at other timeframes.
You mean daily charts right? And a time frame of 6 months is good ?
Yes, daily charts for last 6 months 🙂
Hi Karthik Rangappa… You are doing a great job answering everyone\’s queries.. I have basic knowledge in trading and candlesticks.. how should i start seeing the chart… what to see in the chart.. should i predict future movement and check my prediction after the candles form? hope you get my query… Thanks for your time…
Hi Hari, do you think this will help – https://youtu.be/z0Rwoz6PduM?si=IZN2t0J3iDJcLyTB
I don\’t really understand how we can get a profit buy shorting the stocks. We are buying high and selling low it seems. Can you please give an easy example and explain.
Ok. Here is an example –
Sell at 100
Buy at 95.
In this example of short, profit is 5. To help you understand this better, imagine you –
Buy at 95
Sell at 100
You still make the same profit, its just that the sequence of trade is different.
Sir but how this second example justify that we are buying at high ?
Do check the charts, Jyoti.
imagine you are getting 1 share from your broker… you are selling it for Rs.100 hoping it the price will fall.. later you are buying it back at Rs.95.. now you are give that 1 share back to your broker… u have made a profit of Rs.5.. hope u get it…
Hi Karthik:
Newbiee here..I\’m confused as to the time frames. For the day we validate the formation of the Marubozu in the last 15 minutes of the market closing and this informs us of the next days possible trend/pattern …accordingly we buy/sell on the day or the next (if risk averse).
Q1) Can the same logic be applied to intraday trading? If yes, would it work for every Marubozu within the chosen time frame? eg. 20min time frame …we would first have to look at the previous days closing candlestick and then every subsequent 20th minute candlestick .. and verify on the 21st minute? or every marubozu that pops up?
Q2)How does this work for shorting? Would it be using an After Market Order if we go by EOD time frames?
1) Yes, you can extend the logic to intraday as well
2) You can short using derivative contracts
Hello Sir,
Could you please tell how to calculate the range for the day trade of any stock. The mentioned ranges in th e trade trap section is 1% and 10% so how did you arrive at this number.
There are two ways to do this –
1) Take difference between the high and low, divide by close
2) Take difference between the open and close, divide by close.
But what will happen if we divide it by open rather than close?
Nothing, its ok to do that.
When the risk-averse trader is buying the stock on the day after the bullish marubozu, is his/her bid = (a) the closing price of the bullish marubozu day, or (b) the closing price of the next day, assuming that this day is also a blue candle day?
Target would be to buy near the close of the next day, after confirming that the 2nd day is indeed a bullish day.
Just explain to me why we should buy at closing price in bullish marubozu candlestick?
Why is the high of the marubozu candlestick taken as the stop loss in case of a bearish trend?
In candlestick, all high point of the pattern candle is considered as SL for short trades, and low as SL for long trades. This is because of the price action logic.
Thanks for very nice explanation and clearing all doubts.
Happy learning!
Hi Sir,
can you please elaborate on Trade Trap. you mentioned that we should avoid trading during an extremely small (below 1% range) or long candle (above 10% range). How do we calculate this range? There are many formulae for calculating Range% like (high-low)/close or (high-low)/average of high and Low. Which should I consider for calculating the range you have mentioned. I understood the reason why we should avoid small or very large candles but confused on the range part. Thanks!
I had a video on this – https://youtu.be/1kQjXFL4Mfc?si=HsRnMrXwrMvefttz
Sorry, I didn\’t know the concept of short selling when I asked that query!! I thought short selling is merely just selling a stock. Everything\’s clear now!
Sure, good luck!
In general, the risk-averse trader would be the one who shorts a stock immediately(at the closing price) when he spots a bearish marubozu. And the risk-taker would be the one who waits for some time to see what pattern will form after forming bearish marubozu.
If I\’m right in the above statement, then why it is written exactly opposite than my statement in this chapter. Or if I\’m wrong, tell me how?
Risk taker takes the trade same day, risk averse takes the trade next day.
Actually my doubt is that to qualify a candle as marubozu. should I confirm the length of real body to shadow with 1% criteria or to measure the individual upper and lower shadow to close or open criteria as 0.2-0.3% applicable.
Visually, the length of the shadows should be min or non existent. This should suffice, if you as me 🙂
Hello Karthik.
Really good stuff you are doing here. So glad i found this.
Please Sir is there a video link you can share that will teach a newbie like me on how to learn stock trading from novice to intermediate. If no video, a book will be highly appreciated.
Do keep up the good work Sir.
There are many playlists here, please feel free to pick and choose what you want to learn – https://www.youtube.com/@varsitybyzerodha/playlists
We also have a playlist on TA. Check this -https://www.youtube.com/watch?v=yzRP-mA2eiE&list=PLX2SHiKfualH_xMbGM-3zWC47s9gUjGR_
Hi Karthik,
I\’m having little confusion regarding the length of the shadow in marubozu.
1. Measuring the variation of the shadow, nd 0.2% and 0.3% are acceptable
2. Length of the shadow should not be more than 1% of the real body of the candle.
both applies or either is acceptable
Thanks for departing the knowledge and clearing the doubts.
1) In a candle, the portion connecting open/close to high/low points are called upper and lower shadows.
2) Take the length in rupee terms, and express it as a % by dividing the length over of the real body.
What does \”Remember these are short term trades and one needs to be quick in booking profits.\” means?
That means to say that the profits in short term trade are volatile, profits now can change to losses quickly. So you need to be quick to book your profits.
If bearish marubozu has formed as a risk taker want to sell the stock at 3.20 but the intraday will get closed on that day itself right. How can a trader get it to next day?
You can always use F&O to place overnight orders and carry forward the positions.
And my apologies-You\’ve already answered this question multiple times in this thread 😊. I should have checked before even asking 😊
Thats ok. Good luck!
Got it, thank you very much for the reply Karthik.
Sure, happy learning!
<>
My understanding is that \”short positions\” are allowed only for MIS (Intraday) and not for CNC (Delivery) unless I
have these shares in my demat account. In that case, \”wait till the next day’s closing\” mentioned above is not possible according to my understanding. Could you please clarify?
You can always short via derivative instruments, Adarsh.
In a bullish marubozu, why should i buy at the closing price? Eventually it is the highest price for the day, so shouldn\’t i buy at a lower price i.e.Open price, and then sell at a higher one and make a profit?
But at open, how do you know that the day will transpire into a bullish Marubozu?
Hi Sir, its mentioned about about trading session. like 2 or 3 trading session, sir what you mean by a session, is it a period of specific time or what
One day of trading activity = 1 trading session. So market opens at 9:15AM and closes by 3:30PM. So this is considered as a trading session.
Hi Sir, in bullish marubosu its mentioned for the risk takers can buy on the same day as marubosu is formed, while for the risk avers its better to buy next day.
My doubt, if marubosu is formed at 10 am then what is the point of buyin the stock next day
Can you please clarify
Najam, so you can always buy or sell, dependent on the candle via futures and options. This way there is no need to square off the position. You can hold it for as long you wish, up until the expiry.
Hello sir
My question for risk averse trader when do he know that today ia a blue day or red day ??
How much time should a risk averse analyze to say that its a red or blue day.
You will have to track the candle\’s development i.e OHLC during the day and figure if its leading to a blue or red candle.
Hi Sir,
My query is about this point \”5.6 – The trade trap\” is it applicable to Marubozu only or for all kind of candlestick patterns.
Regards,
Pavit Kapoor
Its applicable to all sorts of candlesticks patterns.
Yes sir. I just wasn\’t aware of the term that is used. I just wanted to know how to identify at which price I should book my profits sir.
Sure, happy learning 🙂
Hi sir,
What is the take-profit order for bullish and bearish Marubozu pattern?
Take profit order meaning? The price at which you will book profit depends on how you want to identify targets 🙂
Hi Karthik,
Thanks for the explanation.
I have few doubts regarding execution.
1) Incase of bearish marubuzo, for risk taker, he has to take the trade on the same day. But one can\’t take intraday at the closing hours right? Do you mean shorting futures here?
2) Sometimes markets open gap down. In that case the stoploss may be skipped. What do to do in this case?
1) Yes, thats right. Futures or even options.
2) If the gap down is to the extent of taking out the SL, then you avoid the trade, else you take it.
It sure does. Thank you so much:)
Great. Good luck 🙂
Hi Karthik,
I have 2 questions
1. Can we use the Marubozu for trades in 5, 15, 30 Mins chart?
2. To identify a trend for let us say a 30 Min TF should I look at higher time frames in this case 1HR or even higher?
Thanks
1) Yes, you can. My personal preference is 15 or 30 mins.
2) 30 mins itself is good, right?
One should avoid trading during a minimal (below 1% range) or long candle (above 10% range).
the length of the candle here means the length of the body of the candle , right ?
I mean the absolute value of the difference between the open and close price is the length of the candle .
Yes, that\’s right.
You mentioned \”One should avoid trading during a minimal (below 1% range) or long candle (above 10% range).\”
When calculating the long candle percentage so that it is less than 10% should we include the body only or the shadows also.
Is the formula for deciding long candle
1. (High-Low)/Low OR
2. (Close – Open)/Open OR
3. Something else.
Both these work, Abhishek.
Dear Karthik
Dont know wether this thread is still working.
Still find myself compelled to express my gratitude for the excellent effort you have made in putting things so simply. I could understand every bit in a single read
My Best Wishes
It works, and thanks so much for letting me know. Happy learning 🙂
I have a doubt with respect to this statement.
\”The trade on the bearish marubozu would be to short BPCL approximately at 341.7 with a stoploss at the high point of the candle. In this case, the stoploss price is 356.0.\”
The meaning of this sentence is if we buy at 341.7, then the stoploss will be at 356.0 right?
my doubt is how can stoploss be higher than the buying cost? what happens if the market value drops below 341.7?
Thats right, Vijay. The stoploss will be higher because this is a short trade.
Hi Karthik,
I just wanted to say that \”yes\” that video did clarify a lot of stuff up. I feel I have been throwing myself too much into the booking definition and not being flexible enough, I will work on this on my own and if I run into some problem, I will get back to you.
Thanks, Archit. Please don\’t hesitate to ask if you have any queries 🙂
Hi Karthik,
In context to your reply.
1. I meant that I have gone through all the types of single pattern candlestick, but I was still confused that whether doji/spinning top and marubozu would classify as short(10%) candles that you mentioned in trade trap.
2. Thanks for the formula, but it did be great if you can clear up the following situation.
The thing is currently my strategy revolves around seeing patterns and then predicting whether to initiate a trade or not but since the trade trap section, I have been a little confused and I will try to explain what\’s going on in my mind.
According to me, Whenever I am thinking of initiating a trade around 3:20 Pm, apart from the patterns for today and previous as well. I should calculate the last 8 day\’s average (using the formula) and calculate today\’s average as well. If today\’s average falls outside i.e 10% then don\’t make the trade. Is this correct? But now if this is true, then whether I should follow this range rule(i know it\’s a recommedation) or the trade set up rules (like if there\’s a doji in an uptrend, go long)?
I know that I shouldn\’t focus on the pattern name but rather the market sentiment, I will try to pay more stress on this, and I realize not every pattern has to be a doji or marubozu, some patterns can be random, but it did be great if you can create a supplement note on this trade trap or if you have, can you refer me to that?
Thank you so much, Karthik.
1) Doji/spinning top on its on does not single a trade. But yes, to quantify, you need to measure the range. The techniques to measure the range is what I explained in my previous comment.
2) Do watch this video for more clarity – https://www.youtube.com/watch?v=1kQjXFL4Mfc&list=PLX2SHiKfualEyD05J9JsklEq1JFGbG6qJ&index=10
Hopefully that video should address some of your concerns, otherwise, do let me know 🙂
How bearish Marubozu works for a risk-taker? If one makes a trade at 3.20pm, then they\’ll have to settle before the trading day ends, since delivery is not allowed in delivery segment! I don\’t see much value/ profits generated in last 10 minutes of a trading session.
You can short the stock by using derivatives contract like futures and options and hold for mutiple trading sessions.
Hi Karthik,
I need some additional clarification within this trade trap.
1. I have read the single candlestick pattern and just wanted a clarification that doji and marubozu can fall into these short(!0%) respectively? I am kinda making an assumption that these short and long candles are a distinction, just like marubozu, umbrella.
2. It did be great if you can provide an example for this trade trap explanation with how to calculate the range for a week? Or you can point me towards some video?
1) Archit, sorry, I dint get the query. Can you kindly give more context?
2) There are two ways to calculate range – take the difference between high and low, divide over high. Or take the difference between open and close and divide over close.
Also, someone had a similar query, so I had posted this below –
If you happen to spot a candlestick pattern, but the range of such candles forming is either too small (1% ish) or large (10% ish), while the range of the previous candles is normal (take average range of previous 8-10 days), then avoid taking trades. The thought is that the stop loss for such trades will be taken out easily as it is falls outside the range of normal day candles.
Hi Kartik
Thanks a lot for this great content .
I had a doubt in \’Trade Trap\’ topic in this chapter.
One should avoid trading during a minimal (below 1% range) or long candle (above 10% range).
I could not understand what does it mean ..1% or 10%. Is it like how much stock has moved that day or previous day or something else ?
If you happen to spot a candlestick pattern, but the range of such candles forming is either too small (1% ish) or large (10% ish), while the range of the previous candles is normal (take average range of previous 8-10 days), then avoid taking trades. The thought is that the stop loss for such trades will be taken out easily as it is falls outside the range of normal day candles.
How will be deriving stop loss? Is there %
Not really, its based on the pattern.
Hi Karthik,
Here are a few more doubts that I am at having at the end of this module and after watching the videos.
1. What do you mean by \’range\’ of a short candle(10%), do we mean the length of the wicks in the upper and lower shadow w.r.t the real body? If yes, then what about hanging man/hammer and shooting star, I assume they too have a range of wick greater than 10%?
2. So, about shorting around bearish marubozu. I wasn\’t to place a regular sell order for shorting when I wanted to manually do it instead of placing stopLoss. I think shorting is allowed only in intraday orders, then is shorting supposed to be for futures and options?
Thanks a lot in advance for answering these questions and providing the much need financial ed.
1) No, I mean the length of the candle with respect or the over all movement. For example, if a stock makes a high of 107, and a low of 99, then the range is 8.
2) Yes, you can short EQ only on intraday basis, but with F&O, you can carry forward your position overnight.
Hi Karthik,
Just a quick yet silly question. When are we talking about the length of a candle, are we considering the upper/lower shadow or just the real body?
A few patterns are defined keeping in mind the length in perspective. Hammer, hanging man, shooting star for instance. Hence we need to consider the length.
close of previous day should be equal to open of next day ..why isnt its visible in candlestick graphs?
Not necessary right?
What is stoploss
Basically trying to stop further losses happening from a trading position.
Any Marubozu candle will be visible only the next trading day. So how does one take a call on this. Can we take a call based on 1-2 hour(of the trading day) trend. What if a bullish Marubozu candle is followed by a bearish regular candle. What action is recommended then?
No, you need to know that the day resulted in a pattern that you are following. So you have to give it time till EOD. You need not have to wait for close though, you can take a call around 3:20, which is what I\’ve explained in these chapters.
In the trade trap, it is mentioned,
Earlier in this chapter, we did discuss the length of the candle. One should avoid trading during a minimal (below 1% range) or long candle (above 10% range).
I understand that we are talking about short and long candle.
But how to calculate this range? With what reference, the range is mentioned?
You can visually interpret the range, thats ok too. Plus you can also calculate it by taking the difference between open and close and dividing it over close.
Hello,
I am trying very hard to remember all these candle stick pattern from so many days. Finally i am sitting today with a decision that i must learn it by hook or crook. Your lessons are helping me in greater ways. thank you so much for all your efforts.
When it comes to Marubuzo, how will we know when to book profit?
Good to know that Shruthi 🙂 Also, its nice to know all patterns at the start, but eventually you only need to focus on the price action. Check this – https://www.youtube.com/watch?v=z0Rwoz6PduM&list=PLX2SHiKfualEyD05J9JsklEq1JFGbG6qJ&index=3
In a bearish maruzobu, how do you short on the same day? IF shorting positions are squared off in intraday, and a risk-loving trader decides to short at 3:20 pm, how will he carry forward the trade on the next day?
You can always short using derivative positions.
Hi Karthik, does colour of the candle matter for hanging man or hammer?
Not really, Rishi.
If we want to do positional trading (holding for 3-4 months period), what params need to be considered in technical analysis?
Then you will have to see if there is enough momentum in the stock. Moving averages does a decent job at identifying momentum.
Hi Karthik,
In case of a bearish marubozu, if we have to short the stock at 3:20 pm, how will that work? Short position needs to be squared off by the end of day right? So how can we carry it through multiple trading days?
YOu can do so with an overnight derivative trade.
How to calculate the range % to avoid the trade trap?
I assume we can calculate range as high – low.
The range % to avoid trading should be (high-low)/low?
or is there any other reference point?
Yes, that is one of the way to measure the range. You can replace high low with open close as well.
In this the candle will be only checked if its the first candle of that day or it can be considered if that forms in the middle of the day
It can form at any point and you could act on it, Abhi.
In intraday, we have to square off the positions the same day. Let\’s say, I see a bullish Marubozu candle in the day\’s chart. How to trade it? I need to hold the positions for a few days, meaning I need to take swing trade, which will not allow me to have the margins that Zerodha provides?
Also, in swing trading, we cannot sell without having it, unlike intraday. How to make use of a bearish marubozu candle then?
If you want to buy, you can buy shares and hold it for few days till the Marubuzo plays out as you expected.
Kindly explain the % formula with an example
Which formula?
sir please help me to understand
Stop-Loss Placement:
Why is it common practice to place the stop-loss order equal to or below the low of a candlestick pattern when trading? What is the rationale behind this approach, and how does it contribute to risk management in trading?
Entry Point Determination:
How should a trader decide where to enter a trade based on a candlestick pattern? What factors should be considered when determining the entry price, and why is this entry point significant in a trading strategy?
please bhaiya explain 😢
Hey Pravan, the low point or the high point represents the price at which a reversal happened. Hence thats is the SL price. About entry point, I\’ve already explained in the chapter.
sir please help me to understand
why we are placing Stop-Loss in equal to or below the low of Candlestick? any reason behind it,how to decide where to to place stoploss?i want to understand this at very deep level………
please bhaiya explain
Should we enter a long term trade when a bullish marubozu has been formed and short intraday when bearish ??
Most trades based on TA are short term in nature.
Hi,
How can I shortlist stocks every day based on Marubozu? Is there any screener by Zerodha?
Thank you.
You can try streak.tech.
The rule says buy strength and sell weakness
if we meant to sell in bearish morbozu why putting it\’s high as a stoploss knowing that the trend is going down! isn\’t better to sell at the highest price possible
Where else would you keep your stoploss at for a short position, Zaid?
Sir Namaskar
Great explanation sir,i find it really helpful,i was little bit confuse about range,but ur replies made id clear.Thank u sir for the content.
9
Glad to note that, Chiku. Happy learning 🙂
In the chart above (BPCL Limited), the encircled candle indicates the presence of a bearish marubozu. Notice the candle does not have an upper and a lower shadow. The OHLC data for the candle is as follows:
Open = 355.4, High = 356.0, Low = 341, Close = 341.7
As we had discussed earlier, a minor variation between the OHLC figures leading to small upper and lower shadows is ok as long as it is within a reasonable limit.
The trade on the bearish marubozu would be to short BPCL approximately at 341.7 with a stoploss at the high point of the candle. In this case, the stoploss price is 356.0. Of course, we still haven’t dealt with setting targets at this stage, and we will figure that out much later in this module.
can someone explain in detail ?
That is a detailed explanation 🙂
I can help if you point out to what exactly is confusing you 🙂
Hii, pls correct me if I am wrong.
We can\’t short in case of bearish marubuzo in cash segment as it has to be intra day trading.
We can benefit from bearish marubuzo only in derivative market right?
Thats right, but you can still do an EQ intrday if you are willing to risk it.
They are just for indication
why are the candles shown in blue, what is the importance of color in candle stick.
The candle colours indicate bullishness and bearishness and the colour can be customized to any color of your choice.
Hi Karthik,
you said Risk Takers will buy on the same day and risk averse traders will buy on next day after confirming the strength. if the next day the chart shows weakness, risk averse buyers don\’t buy.
that means for risk takers who bought shares on the same day, if the chart shows weakness on the next day, can they exit? or they have to wait till stop loss triggers?
please clarify.
They will avoid based on how weakness is seen. For example, if the weakness is to the extent where the the stoploss is taken, then of course, there is no trade. But otherwise, the trade should still be considered valid.
Does a green to green bar break mean a long position or should a green bar break a red one and then another green breaks the previous green bar?
Sorry, I\’m unable to understand your query fully. Can you share an example for me to understand better?
When we say Marubuzo means
To check for Bullish Marubuzo when stock going from Down to Up
To check for Bearish Marubuzo when stovk going from Up to Down
Please comment if my understanding is correct.
Maruzuzo is the only pattern which can appear anywhere in the chart and need not have to follow the prior trend requirement, Devendra.
On which timeframe should we use,5 min or 15min and can we trade on options chart using the single and multiple candelsticks pattern
5 or 15 mins is the timeframe.
The trade on the bearish marubozu would be to short BPCL approximately at 341.7 with a stoploss at the high point of the candle. In this case, the stoploss price is 356.0. please explain this
Yes, thats correct.
CAN WE USE THIS SINGLE CANDLE STICK PATTERN (MORUBOZU) FOR OPTIONS OR INTRADAY TRADING EXCEPT EQUITY
You can, but I personally would not 🙂
Quick Realization, they say Marubozu violates rule 3 but a risk averse person does not violate rule 3 for Marubozu lmao.
YOu mean the rule of prior trend? If yes, then we are not considering that rule at all, right?
Why the \”current market price (CMP) should be approximately equal to the high price for the day, and the opening price of the day should be approximately equal to the low price the day\”. Can you elaborate on that please.
I\’ve done that in the chapter itself, Ashok. Also, I\’ve explained the way to use candlesticks in this video – https://www.youtube.com/watch?v=1kQjXFL4Mfc
Hello Karthik,
When you say, \”Usually if the shadows are within 0.2% to 0.3% of the range it should be ok\”.
What does it mean?
1. 0.2%/0.3% of \’HIGH Minus LOW\’ of single candle on selected time frame?
OR
2. 0.2%/0.3% of \’OPEN Minus CLOSE\’ (in case of red candle) or \’CLOSE Minus OPEN\’ (in case of green candle) of single candle on selected time frame?
OR
3. Something else?
Sorry if it is a dumb question, I\’ve just started learning.
Either works, Sridhar. It really depends on how you are measuring the range. I\’d prefer to look at the open and close difference and ignore the high and low price points and they could be a little erratic.
Varsity is the india\’s no one largest platform for Stock Market.
Thanks a lot for such valuable content.
Happy learning, Sharad!
If I short stock X with the expectation of a price decline, but the price instead rises, can I buy back the stock after a few days,to avoid incurring a loss? Is this possible?
Sure, you can, but you would have incurred a loss anyway as the price rises.
Sir thank you for the valuable content. I have one doubt for risk averse trader next day should be marubozu or it can any bullish candle?
It can be any bullish candle.
First of all thank you for explaination sir.
Coming to the point,how the buying strength (buying at higher price) and selling weakness(selling at lower price) helps for trader.i didn\’t understand this clearly,so could you please explain it with an example!
The idea is not to time the market to perfection, but rather try to ride along the momentum. So when you identify that a stock has momentum, you setup trades along the same lines and stay in the same direction. Thats the reason why you buy strength and sell weakness.
Hi Karthik sir, in a bearish Marubuzo, to go short the time frame can’t be EOD right? Clarify this please
It can be, but you will have to do that via futures and option and not spot market.
Hi Kartik,
Could you please guide on how to download OHLC data in excel on Kite?
I\’d suggest you please call the support desk for this, they will help you with it.
I am still confused. Let me try to explain my question a bit better.
Technical Analysis is predominantly helpful in intraday trades. Now, if someone is opening a position at 3.20 PM (either on the same day for risk taker or next day for risk averse), then when he will square off this position
Or
You mean he would carry this position overnight & square off some days later (but then it\’s not intraday, it\’s CNC).
Siddharth, its a misconception that TA helps only intrday traders. It helps both intrady and overnight position traders. For all overnight positions, you initiate the position in derivative contracts.
Hi Karthik,
One doubt – as you wrote above that both risk taker as well as risk averse person are checking OHLC at 3.20 PM and then placing an intraday order (as TA comes handy for intraday trades), then when they will be squaring off as markets would close at 3.30 PM?
No, the overnight positions are in F&O. Please do check the comments.
Never mind…. I just saw few comments and apparently you can short through next day in F&O.
Yeah, good luck 🙂
Hi Thank you for the wonderful lessons I\’m a bit confused about the shorting here in bearish marubozu it is said that the risk taker is selling the stock at 3:20pm… but wouldnt all the short trades will be automatically executed by 3:30pm. Meaning in a bearish Marubozu the risk averse trader always have a higher chance of booking profits?
As shorting of a stock takes place in intraday which is 9:15am -3:30pm?
Thanks Bhavesh, the assumption is that you will short using derivatives here and not spot market.
Hi sir,
I am not able to unable to understand \”trade trap\’.
Is the 1% and 10% in relation to volume or price or something else and also how to calculate the same
Check this, Dhiraj – https://www.youtube.com/watch?v=1kQjXFL4Mfc&list=PLX2SHiKfualEyD05J9JsklEq1JFGbG6qJ&index=10
good after noon sir, i am confused in 2 parts
1.One should avoid trading during a minimal (below 1% range) or long candle (above 10% range).
2.range of 0.2 to 0.3 %
Please check this – https://www.youtube.com/watch?v=1kQjXFL4Mfc
One should avoid trading during a minimal (below 1% range) or long candle (above 10% range).How do we find out the range or what you have called the minimal. doubts in this
You can measure the day\’s price movement i.e the difference between open and close and divide that by close or open to get a sense of how to calculate the range.
How to calculate trade trap percentage?
The same way as you\’d calculate the range of the day.
In 5.3 section how the risk averse know the next day is red??
You will have to guestimate this towards the end of the day by evaluating the OHLC.
hello kartik sir thank you for this knowledgeable module
my question is if i notice bullish marubozu during the any time of the day in a uptrend, can i opt for buying till the trend gets reverse
Yes, that would be an intrday trade.
sir your explanation is very best but sir can you transition in Hindi sir
It is there in Hindi as well, check this – https://zerodha.com/varsity/module/%e0%a4%9f%e0%a5%87%e0%a4%95%e0%a5%8d%e0%a4%a8%e0%a4%bf%e0%a4%95%e0%a4%b2-%e0%a4%8f%e0%a4%a8%e0%a4%be%e0%a4%b2%e0%a4%bf%e0%a4%b8%e0%a4%bf%e0%a4%b8/
Hlo sir is candelstick patterns apllicable for day to day tradig? and can we use candelstick trading patterns for week to week trading?
Yes, you certainly can use.
So the Bullish Marubuzo always gets created at bottom which means reversal of trend and vice versa for bullish.
Is it so and it is not concerned with color of the candle
And should we wait for another candle of closing above the previous high( In case of bullish) and then enter trade post confirmation if we are looking at a 15min or 30 min chart?
It depends on what kind of risk taker you are. If you want to be conservative, you can wait for the confirmation the next day, else you can initiate the position the same day as the pattern formation.
as it said to take the trade if the range is between 1% to 10 % is it mean for EOD or for all time frame ? thanks in advance
If EOD, you will have to do derivatives, like Futures or Options.
Hello Sir,
Completely new to this so wanted to understand
In the bearish Marubozu, as the example is given that short will be done, and both risk taker and risk adverse will do it at 3:20 pm at same day or next day by seeing the candlestick.
the market will close at 3:30 pm. And considering short trade is Intraday, so will the trader get only 10 mins, and is it just for intraday?
Not really, the shorts can be initiated in a futures instrument where the position can be carried overnight.
Hi Karthik,
Therefore how do we calculate range for either bullish or bearish Marubuzo
You have mentioned in Trade traps we are supposed to avoid 1% range for short marubuzo and 10% range for long marubozo
THANKS
Bargav, check this – https://www.youtube.com/watch?v=1kQjXFL4Mfc&list=PLX2SHiKfualEyD05J9JsklEq1JFGbG6qJ&index=10. The video talks about how to look at candles on an overall basis and not just from a mere \’pattern\’, basis.
As far as range is considered – take the difference between the high and close or the low and open and divided it over the length of the body. That will give you the range of the shadows for a bullish candle. The opposite for a bearish candle.
One should avoid trading during a minimal (below 1% range) or long candle (above 10% range).
how to know if it is below 1% or above 10% ?
You need to calculate the range of the stock for this.
What is the reasonable limit for a Shadow & Body of a candle to qualify as a Marubozu?
Ideally no shadows, but small ones, like 0.15% to 0.25% is ok.
Thanks for explaining so nicely in so simple words. I have a doubt, \” what should be the target, if we are trading a Marubozu?
Target for not just marubuzo, but for pretty much all other patterns can be based on concepts like support and resistance or even volatility.
SIR IN THE TRADE TRAP HOW CAN WE CALCULATE THE RANGE ?
Range calcualtion is basically the difference b/w open and close expressed as a percentage.
sir i wanted to know how to find if it is a blue/bullish candle day or a red/bearish candle day ?
The charting engine will colour code the candles for you 🙂
Hey Karthik, thanks for such a simple intro to candlesticks.
I think I am missing on something basic here. Lets say, I, being a risk taker, short sell a stock at 3:20PM after seeing a bearish maribozu. Now, there are 2 things I can do,
– Either buy that before the market closes today. I may gain, but the gain will be very less, as not much changes are expected in 10 mins.
– Or I dont buy. What happens in this case ?
Thanks, Vatsal. You can short, but for that you need to short in the derivative market and maybe hold that position for multiple days.
Is it necessary that marubozu is formed at end of the day
Or it can be formed be at any time during the whole session from 9*15 to 3*30
It can be formed at any point during the day itself.
Didn\’t get the last part –
Abnormal candle lengths should not be traded.
Short candle indicates subdued activity.
Long candle indicates extreme activity; however, placing stoploss becomes an issue.
How to decide if it is short or long candle?
Check this Nishant – https://www.youtube.com/watch?v=1kQjXFL4Mfc&list=PLX2SHiKfualEyD05J9JsklEq1JFGbG6qJ&index=10
Didn\’t clearly get last part –
\”5.6 – The trade trap
Earlier in this chapter, we did discuss the length of the candle. One should avoid trading during a minimal (below 1% range) or long candle (above 10% range).\”
Avoid trade during long candle (Above 10% range). But Marobuzo candle itself is almost 100% of range and we trade on that. So, how does that make sense? Or are we talking about some other \”range\” here?
Watch this video Nishant, you will understand this better – https://www.youtube.com/watch?v=1kQjXFL4Mfc&list=PLX2SHiKfualEyD05J9JsklEq1JFGbG6qJ&index=10
Sir what is the psychology behind the fail of hammer and shooting star.
Continued bearishness.
Hello Sir,
As you explained In the topic of Trade trap (We should avoid less than 1%, or more than 10%.
Sir I want to know which method is correct to calculate range? If yes Why, If no why.
Method:1 =(Close-Open)/Close
Method:2 = (Close-Open)/Open
Which should be base Logically?
You can use either, Ravi. Maybe wrt to close is ok.
In general software like tradingview we can adjust the length of the candle as our choice (big or short) ,so can you tell me the price range where we can understood that a long candle was formed , without calculating its volume
The better way to look at it is the day\’s range. Anything more than 4-5% can be considered as a long candle.
Also how much of a difference is there between the web version and the mobile app content? I am seeing some content that is not present in the mobile app. Thank you!
We are yet ti update the app with the Financial modelling module. We will do that.
\”A small candle indicates subdued trading activity, and hence it would be difficult to identify the direction of the trade. On the other hand, a long candle indicates extreme activity.\”
– If in a day there were lets say only two trades, and there was a huge price difference, then wouldn\’t this too give a long candle? Wouldn\’t we have to consider volume too? Candlesticks dont indicate anything about volume right?
Yes, thats the reason why you need to check volumes along with the price (candles). There is also \’Candlevolume\’, that you can check, which combines candles and volume.
Hi,Can you give the formula of calculating length of the candle (in %).
Length is a function of market activity and it cannot be changed by a formula, right?
Slight change in the formulas Vishal Saini has summarised. Here is the summary in my view. Karthik kindly have a look at it and confirm for everyone\’s benefit
Bullish Marubozu
Upper Shadow (high-close)/close
Lower shadow (open-low)/open
As close may be slightly lower than the high due to the last 30 minutes average price is taken as closing price. Similarly the low may be slightly lower than open price and still it qualifies as Marubozu due the second rule (be flexible)
Bearish Marubozu
Upper shadow (high-open)/open
Lower shadow (close-low)/close
Yes, always good to have some flexibility on this 🙂
Let me supplement to the answers already posted on Buy at high price and Sell at low price
When you expect the price to go up you buy the stock (Buying strength). If it goes up as expected, you will sell at higher price (your target price) and make profit. Like you decided your target price, you may also decide a price below which you don\’t want continue the trade, i.e STOPLOSS level. For whatever reason the price started falling. Till what level the price may fall is uncertain. In such a situation you would like to sell at your decided stoploss price and minimise your loss (Sell weakness). For example. Infosys opened at 1390 and closed at 1410 (Bullish Marubozu). You bought at 1410 expecting the uptrend will continue and set your target price at 1430. At the same time you set your stoploss price at 1390. Next day it started falling instead of going up. When it touches 1390 on the down side your stoploss triggered now you have to sell it at that price otherwise it may go down further and you will incur more loss
Tanks for chipping in with your perspective 🙂
very much informative.
On which time frame we have to see Marubozo?
And one more thing if I buy at the end of the day how is that intraday? Is it like we have to take delivery and sell later or is it BTST and does stoploss carry forward I thought stoploss had a validity of 1 day?
Shorting I understood is for derivatives.
You can look at it from a EOD perspective. The trades taken towards the end of the day is not for intraday, but more as an overnight position. You do shorting via derivatives not equity.
Hi Karthik,
In Bearish Marubozu e.g. above, it is mentioned a short position can be initiated at 3:20 pm. Does that mean short positions for stocks can be carry forwarded to next day? In how many days max do we need to square off?
Ah no, short positions here are assumed to be initiated in the derivatives contract.
There is a mistake in Bearish Marubozu.
It means open=low & close=high
Sure, but what is the mistake?
Hey Karthik,
First of all, hats off to you and your team for providing such informative content for people like us who are beginners in the stock market. It\’s truly helpful.
Coming to my question, Let\’s say I encountered a Bullish Maroubozou for a day in an X stock. At EOD, I will purchase it at the closing price (and stop loss at opening price), since I expect it to be bullish. The question is when should I sell it to book max profit? I know there is no exact math to calculate it but still do you have any suggestions?
TIA
It depends on your strategy. Some traders prefer to keep it open till a fixed percentage profit is hit…like 5%. Some even prefer to keep it till it hits the resistance level.
Thank you for sharing knowledge.
I am beginner.
1)You should not tarde when body percentage is greater than 10% am I right?
2)how to calculate body percentage?
Please give formula
1) Yes
2) You can consider the range. Range = difference between open and close, divided by open.
Hi All, Please clear my doubt.
I have learnt somewhere that a Marubuzo candle can only be considered as Bearish Marubuzo, when it forms in uptrend only. And in the image in Para 5.5 Image No. 2 Cipla chart, the encircled image is formed in the way of downtrend.
Shall It be considered as Bearish Marubuzo ?
No, marubuzo can either be bearish or bullish. This is the only pattern which does not require a prior trend.
Buying at the lower low and selling at the higher high. Buy low low and sell when it\’s high.
Hi sir, you have mentioned about buying the stocks when Marubozu pattern occurs. Does buying here means a delivery order?
If you intend to hold on to the trade for a few days, then yes, delivery based.
Guys, I still can\’t understand how to identify if it\’s a long candle or a short candle which is described at the end of the chapter.
Here is the basic idea –
1) Long candle = if the range of the candle is 5% more
2) Short candle otherwise.
Hello kartik please help me how to calculate range like when marubozu is formed if its range is less than 1% and above 10% then we don\’t take trade but how to calculate the range
Two methods –
1) Difference between open and close divided by close
2) Difference between high and low divided by either high or low.
Can anyone tell me how to calculate range percentage like is it the same h-c/c or it is different
We have discussed this across multiple queries 🙂
sir, i didn\’t understand the rule (Buy strength, and Sell weakness.). please explain this to me
Keshav, basically you are supposed to buy when the stock is trending up (and not when the stock is weak), this is called buying strength. You sell when the stock prices are trending low, this is sell when there is weakness.
Hello!
Suppose I am risk averse trader , on daily charts I got a BULLISH MARUBOZU and on next day I got a blue candle with gapdown opening but close is below than that of the bullish marubozu candle\’s close.
So can I now intiate a LONG trade with buying price at close of the second day blue candle?????
(My doubt is , to intiate a long trade do the second day candle just have to be blue or it should have to be both blue and close is above than Marubozu\’s close.)
(Same concern for bearish MARUBOZU also)
If you are initiating the trade the 2nd day, then ensure its a bullish day, this is good enough 🙂
Hello!
I had a confusion about determining where to put the stop loss and the relation between the length of the Marubuzo and the stop loss. Doesn\’t stop loss have to just do with your risk appetite, how much ud be willing to lose in a trade, could be very little or a bit?
Thats right, but each candlestick pattern also suggests the best place to place a stoploss. I\’d suggest you consider that for your trading strategy.
Hello sir, If any one side wick is forming and it is 2% of the body, will it be considered as marubuzo? What length of wick, in terms of percentage of real body is permissible in order to deem candle as marubuzo?
2% of lower is still ok to consider for Marubuzo.
Very easy to understand, thank you so much sir. But I have a doubt as you stated above that \”One should avoid trading during a minimal (below 1% range) or long candle (above 10% range).
So, could you plz tell me how to calculate the range?
Check this Ravi – https://www.youtube.com/watch?v=1kQjXFL4Mfc&list=PLX2SHiKfualEyD05J9JsklEq1JFGbG6qJ&index=10
Sir I have doubt if hammer appear at 5min time frame of same trading day but the trend is about to go down and volume of sellers is also heavy there .Then sir how could we able to predict new trend
For trend, I\’d suggest you pay more attention to the longer time frame, so in this case, look at whats happening on a EOD basis.
Can we apply this to 15 min interval charts for an intra-day trade?
Yes, you can.
Best starter blog for the the trader who are new to the stocker,forex .It cover the all accept of the candle sticks that need to know as a begineer .
Happy learning!
Hello, firstly I would like to thank Zerodha and Mr. Karthik for this wonderful step towards educating people about the stock market in the simplest way possible. Secondly, I have a doubt. In the first ACC illustration, you said that both the risk-taker and risk-averse would benefit from the trade. How is that possible since the risk-taker buys the stock the same day and the bullishness has continued the next day. But on the same hand, the risk-averse purchased the stock the next day EOD where the following trading day the candle is bearish. Kindly explain.
Thanks for the kind words, Sanju. Both risk-taker and risk-averse benefit as the SL has not triggered and the momentum has continued taking the stock higher.
Which candle stick pattern is powerful for reversal trading from above mention pattern.
There is no such thing as a powerful pattern. It all depends on the price action in that stock on the given day. Do check this video – https://www.youtube.com/watch?v=z0Rwoz6PduM&list=PLX2SHiKfualEyD05J9JsklEq1JFGbG6qJ&index=3
What should be the target. And how much is the accuracy.and if used it for a month on month what will be return I can make.
For target, you can use something like S&R. These patterns just enhance the probability…no guarantee as such 🙂
This information stills holds good till date?
Yes, these patterns are manifestation of human behavior towards price action. So the pattern remains valid 🙂
Sir ,so what should be the range of % to classify a marubouzo ?
Lesser than 0.25% I\’d guess 🙂
can we conclude around 2% change in price a day as marubuzo?
Hmm, slightly higher I think 🙂
Hii in case of Currency chart if their is some upper or lower shadow left after the close or open price in that case, how much difference in points is acceptable to consider that candle as Marubozu becoz in currency their is not much movement and considering a wrong candle as Marubozu will lead to taking wrong decision.
How much % or point of variation should be ok ?
The lower the better, Prashant. I\’d say somewhere in the region of 0.25% or lower.
Hello Karthik, Can this candlestick pattern be found on NIFTY 50 chart? Can it be applied on NIFTY 50 also?
Thanks
Sunil
Yes, you can.
Hello Sir!
Great Content. But I had a doubt regarding buying stock by the risk-averse trader in bullish Marubozu. Could you please explain me more clearly with an example?
Which part is confusing you, Prajwal? Risk-averse traders initiate the trade only after ensuring it moves in their direction, which is the next day.
Hi,
For the bearish Marubozu, is it possible to short stock on the same day as the risk taking investor does and deliver the stock after 1 or more days? My confusion stems from the introduction to shorting provided in the first module as it was stated that short positions in the non derivative markets had to squared off within the same trading day.
Thanks in advance.
That won\’t be possible in the EQ segment, but you can with the futures or via the options.
Great initiative👏🏻
Sir could please explain what is the meaning of the term \’Market Making\’.
Market making is providing liquidity where there is a counter party to who guarantees to fill your position every time you place a trade.
Hi Kartik,
I often struggle with the size of the candle and usually I am unable to quantify it. It all seems visually challenging to me. What is an ideal price/bar ratio I can set on Kite (Scale Properties Function) for the candlesticks to look visually accurate?
Thankyou.
One way is to calculate the price range. Do check this video – https://www.youtube.com/watch?v=1kQjXFL4Mfc&t=1s
Wats the winning probability of this . Is it a backtested logic . How much % of return we can make from this.
YOu need to backtest this and figure 🙂
Sir what is the formula to calculate the range for the day.
Range = (Difference b/w high &low)/avg of high low
Range = (Difference b/w open & close)/avg of open and close
Both are ok. I use the 2nd one.
There are 4000+ companies listed on exchange . How someone can find which company formed Marubozu candle at end of the day. , without opening every company chart. There any way /shortcut to find which company formed Marubozu Candle….?
No need to track the entire universe, Abhishek. Look at only stocks you actively track (maybe 50-60) and identify opportunities there.
thanks for clarifying. Does Zerodha has any online classes as well for new traders and investors?
Not really, Swati. All the content is put up here.
Dear Sir,
Could you please help on Stop loss, is it necessary to book the loss at low of marubozu candle day, even if trader does not have appetite to go that low?
Not necessary. The low of marubuzo is the worst-case scenario. You can square off the position even before that. But I\’d suggest you wait till the low, if your risk appetite permits.
A bearish marubozu indicates bearishness.
Sell around the closing price of a bearish marubozu
Keep the high of the marubozu as the stoploss
My Qs: For red candle, why to keep high as stop loss… doesn\’t high indicate that it\’s price is recovering.. let say op price is 100 and closing going towards 90 then what is the point of keeping 100 as SL ..pls help to understand
So in bearish candles, you short the stock with the hope to profit from the falling prices. But if the price increases, then you will lose money. Hence the SL is at the high of the candle.
In trade trap you mentioned about range… What is the range …is it length of candle or difference between high and low of candle?
Yes, the length of the candle as measured by the daily price movement in the stock.
Can we trade based on Marubozu in intraday ?
What should be good CS time frame for that ?
Index Options or Stock options where Morubozu works accurately ??
Yes, you can. You can consider either the EOD of even 15 mins candles for intraday. Regardless of stocks or index, CS patters only enhance the odds of being successful. No guarantees as such 🙂
Marubozu poor performance on both Nifty and BankNifty – Back tested from 2016 till date. Pls find details below:
Configurations:
Risk Averse – Buy next day on bullish candle (Previous day Marubozu candle)
flexibility factor = 15 bps i.e. open = low and high = close (considering this flexiblity margin)
candle range % >=1 and <=10
stop loss at 3%
stop gain at 2%
Trades from backtesting below:
Symbol Trade Type Enter Date Exit Date Enter Price Exit Price Profit/Loss Profit/Loss (%)
[NIFTY::FUT::2016-04-28::S_SS_MARUBOZU_LONG_FUT_V1] BUY 2016-03-22 2016-04-20 7768.1 7929.85 8087.5 17.69
[NIFTY::FUT::2016-05-26::S_SS_MARUBOZU_LONG_FUT_V1] BUY 2016-04-27 2016-05-03 8029.95 7783.8 -12307.5 -26.04
[NIFTY::FUT::2016-06-30::S_SS_MARUBOZU_LONG_FUT_V1] BUY 2016-05-10 2016-05-27 7930.45 8172.45 12100 25.93
[NIFTY::FUT::2016-10-27::S_SS_MARUBOZU_LONG_FUT_V1] BUY 2016-08-31 2016-10-13 8876.7 8580.45 -14812.5 -28.36
[NIFTY::FUT::2017-03-30::S_SS_MARUBOZU_LONG_FUT_V1] BUY 2017-01-27 2017-02-20 8700.1 8904.1 10200 19.92
[NIFTY::FUT::2017-06-29::S_SS_MARUBOZU_LONG_FUT_V1] BUY 2017-05-26 2017-06-29 9575.8 9508.8 -3350 -5.94
[NIFTY::FUT::2018-04-26::S_SS_MARUBOZU_LONG_FUT_V1] BUY 2018-03-13 2018-03-23 10455.65 10047.6 -20402.5 -33.16
[NIFTY::FUT::2019-03-28::S_SS_MARUBOZU_LONG_FUT_V1] BUY 2019-02-01 2019-03-11 10941.9 11202.15 13012.5 20.21
[NIFTY::FUT::2020-03-26::S_SS_MARUBOZU_LONG_FUT_V1] BUY 2020-02-05 2020-02-26 12109.2 11699.35 -20492.5 -28.76
[NIFTY::FUT::2021-05-27::S_SS_MARUBOZU_LONG_FUT_V1] BUY 2021-04-28 2021-05-21 14907.85 15206.2 14917.5 17
[NIFTY::FUT::2022-02-24::S_SS_MARUBOZU_LONG_FUT_V1] BUY 2022-01-04 2022-01-12 17889.95 18288.55 19930 18.93
[NIFTY::FUT::2022-08-25::S_SS_MARUBOZU_LONG_FUT_V1] BUY 2022-07-07 2022-07-20 16168.4 16530.3 18095 19.02
[NIFTY::FUT::2022-09-29::S_SS_MARUBOZU_LONG_FUT_V1] BUY 2022-09-01 2022-09-12 17592.4 17964.35 18597.5 17.96
Symbol Trade Type Enter Date Exit Date Enter Price Exit Price Profit/Loss Profit/Loss (%)
[BANKNIFTY::FUT::2016-04-28::S_SS_MARUBOZU_LONG_FUT_V1] BUY 2016-03-22 2016-04-20 16048.35 16385.65 8432.5 14.4
[BANKNIFTY::FUT::2016-07-28::S_SS_MARUBOZU_LONG_FUT_V1] BUY 2016-06-24 2016-06-30 17471.9 18002.6 13267.5 20.8
[BANKNIFTY::FUT::2016-10-27::S_SS_MARUBOZU_LONG_FUT_V1] BUY 2016-08-31 2016-09-06 19958.15 20601.1 16073.75 22.07
[BANKNIFTY::FUT::2017-05-25::S_SS_MARUBOZU_LONG_FUT_V1] BUY 2017-04-25 2017-05-04 22009.6 22730.15 18013.75 22.42
[BANKNIFTY::FUT::2018-03-28::S_SS_MARUBOZU_LONG_FUT_V1] BUY 2018-01-24 2018-02-02 27509.15 26545.3 -24096.25 -24
[BANKNIFTY::FUT::2019-07-25::S_SS_MARUBOZU_LONG_FUT_V1] BUY 2019-06-27 2019-07-19 31372.55 29781.35 -39780 -34.74
[BANKNIFTY::FUT::2019-12-26::S_SS_MARUBOZU_LONG_FUT_V1] BUY 2019-11-26 2019-12-26 31764.35 32004.1 5993.75 5.17
[BANKNIFTY::FUT::2021-09-30::S_SS_MARUBOZU_LONG_FUT_V1] BUY 2021-08-04 2021-09-02 36217 36969.25 18806.25 14.23
[BANKNIFTY::FUT::2022-02-24::S_SS_MARUBOZU_LONG_FUT_V1] BUY 2022-01-11 2022-01-24 38691.4 37116.7 -39367.5 -27.88
[BANKNIFTY::FUT::2022-08-25::S_SS_MARUBOZU_LONG_FUT_V1] BUY 2022-07-19 2022-07-22 35784.25 36768.8 24613.75 18.84
Ah ok. Maybe you should extend this across all stocks and use it only on stocks which give you a good results.
Hello,
I have understood the OHLC components of a candle stick, but my confusion is the shadows , do the shadows imply the share price was bid or asked for at a certain high or low, but the trade did not take place, the trades only took place within the range of the real body?
No, a candle is representative of the traded price only. No part of the candle reflects bid and ask. So the shadows shows the hi and lo of the day.
Hello,
Incase the Marubozu is formed in the first of the day, the trade should be placed within an hour of watching the stock react to it, right ?
Its upto how you look at risk. If you are willing to take the risk, then maybe you can.
Very informative content Sir,
As a beginner, I just have a small query…
1. In the case of bullish marubuzo, the risk takers buy the stocks on the same day around 3:20 pm (D1) while the risk averters buy the stock on the next day after confirming a bullish trend on the next day (D2) again at around 3:20 pm?
And sell the stock after reaching a target price on subsequent days (D3 and onwards…)?
2. While in case of Bearish Marubuzo, we have to short the stocks….on D1 or D2 and repurchase it in subsequent days or the shorting process is valid for intraday only?
Thanks
1) Selling the stock depends on when the price target is hit, it could be the same day or few sessions later
2) If you short stocks (cash), then you will have to buy it back the same day as you cannot carry forward the shorts.
Can a short position be carried to the next trading session only in futures? If yes, does it mean that a bearish Marubozu can be used by trading in futures only?
Thats rigt, although you express your short trade via options as well. Or maybe equity intraday.
Hello Karthik Sir,
With reference to chapter 5.6, what is the below/above 1%/10% range for a small/long candle. By what yardstick do we identify such candles as they should be avoided for trades.
Ketan S
Sorry, I\’m not sure if I get your question right. Can you elaborate, please? We avoid very small or very large candles for reasons explained in the chapter.
i tried a lot , i read comments but still i cant understand that how you guys are calculating range of shadows ( that 0.2 and 0.3 ) in both bullish and bearish marubozu. can you pls explain me , i am confused a lot only in this topic of calculating range of shadows of marubozu. pls explain in detail
Calculate the lenght of the upper shadow (high minus close) and divide this by the range of the candle. This will give you the range of the upper shadow. You can do the same for lower shadow as well by taking open minus low.
Which time frame should be used for nifty and banknifty option tradig if we follow the marubozu pattern
I personally prefer using end of day charts, Swapnil.
Trade avoiding day
Below 1% candle length
Above 10% candle length
How this % is found out?
I am still a learner. Not started trading yet.
Please help.
Thats the range of the candle. There are two different ways to calculate the range –
1) Difference between open and close divided by open
2) Difference between open and close divided by close
You can choose either one.
i don\’t understand why would somebody wanna buy a stock at 1028 rather than 970. isn\’t it buy low , sell high?
Sometimes, you want to buy when there is confirmation of momentum picking up.
Hi Karthik,
First of all, thank you so much for this content.
I have a question let\’s say at the end of a Bullish Marubozu day I am buying a stock and setting that day\’s low as a stop-loss. The next day if it becomes bearish and triggers the stop-loss, I will be selling a stock which i don\’t even own(in my demat account). Will this create any problem? In Module 1 Chapter 10 (https://zerodha.com/varsity/chapter/clearing-and-settlement-process/) you have mentioned there is a risk involved.
It wont be a problem if the stock is under BTST. But if it is a trade 2 trade stock, that is an issue.
I was waiting for these Content. Glad I finally got from my Service Provider…:)
Happy learning!
Sir,
how candle decide it\’s open, close, high and low price.
I mean what real time factor decide the prices of candle. If it is volume then how does it affect it.
You can check this – https://www.youtube.com/watch?v=yzRP-mA2eiE&list=PLX2SHiKfualH_xMbGM-3zWC47s9gUjGR_
Sir in above section in bullish marubozu there is no requirement of prior trend i.e downtrend, but in some other topics i guess i have read one of your comment that prior trend is require always for every candlestick pattern ,please clarify which cs pattern require prior trend is opposite
Yes, CS patterns need prior trends, except Marubuzo.
Sir, since this pattern violets rule 3 of , this means sir we can use Marubuzo pattern in sideways pattern too, right?
Yes, you can Tejas.
Sir , two doubts
1) We can\’t actually short are positions at closing right, as in stocks we have to square off our positions within the same day right?
2)Sir, longer real body also represents high volatility and thus a risk averse trade should avoid right…?
1) If you are short in equity, then yes, you have to sq off by EOD. But can carry forward positions overnight in futures
2) Not necessary. Longer candle indicates a longing range, not necessary high volatility.
such a simple and knowledgeable content.. thanks zerodha
Happy learning!
Cadle stick charti
Hello Karthik,
Thanks for the lessons . I have a doubt in Bearish Marubuzo
You have mentioned – \”The risk-taker can initiate a short trade on the same day around the closing. Of course, he has to make sure that the candle is forming a bearish marubozu. To do this at 3:20 PM, the trader must confirm if the open is approximately equal to the high and the current market price is equal to the low price. If the condition is validated, then it is a bearish marubozu, a short position can be initiated.\”
My understandig is that short selling needs to be squared off same day. How can I carry forward shorts? Kindly help
Regards,
Sourabh
Sourabh, thats right. If you are to short, you will have to do it via futures or options, basically.
Hi ,
Suppose, I am risk averse trader. Risk taker enter a trade @ 03:20 PM ( on bearish marubuzo candle ) and On next day his stoploss hit on first tick ( in opening session @ 9:20 AM ). On same day around 03:20 PM risk averse found a Bearish Marubuzo candle. Should he enter into the trade after he observed in morning that stoploss has already hit of risk taker trader.
You can take it considering the trade opportunity still exists. But because it has already hit the SL, I\’d go easy on such trades and cut back on my position size.
I am looking at Nifty 1 day chart. On 16 June,I found Bearish Marubuzo candle and prices were Open 15832, High – 15863, Low – 15335, close – 15360. Entry on this trade at closing price and stoploss would be High of a candle. If we check difference between High and close. It is near about 500 points. Don\’t you think the stoploss is too deep for intraday trade. The range of candle is 3% ( open -close / close ).
Yes, hence you can avoid such candles to trade. 3% is quite a bit for an index, but not much for a stock.
Hi Karthick,
I wanted check regarding the Buy Strength, Sell Weakness rule for Intraday Trading. We obviously can\’t wait till 3.20PM to take an Intraday trade. So, what would be suggestions to ensure the rule for Intraday.
It is still the same, but with intraday, you pay more attention to patterns and price.
Can intraday traders make huge money using technical analysis? Don\’t you think that just dealing in time frames of 10 mins or 15 mins or even half hours, the range of stock price are very short and so making good money is not possible?
It is short and often more noise than information. Its hard to make money intraday, and not everybody\’s cup of tea.
Most informative lessons
Happy learning!
i do not understand how stop loss is higher than shorting price in bearish marubozu
Because when you are short, you want the price to decrease, hence SL is at a higher price.
One should avoid trading during a minimal (below 1% range) or long candle (above 10% range)
1% or 10% range of what?
Can you please explain..
A % of the daily range, that\’s what we are referring to here.
So,this is what I have understood :-
1)As marubozu is itself a trend establishing pattern it is ohk to that we do not see the prior/previous patterns.
2)To verify the establishment of the marubozu pattern we confirm it weather a given day is also forming a marubozu or not.If it does then we are quantifying it as per rule number 2.
3)If a day is forming a marubozu,we take trades and expect the trend will continue in next trading sessions,that is where we earn profits.
Do confirm this.
Also a question :-
Technical Analysis is mostly used to take trades in?
1) Cash markets+intraday?
2)Futures?
3) Options?
Thanks in advance!!
1) Yes, thats correct.
2) Yes, thats correct
3) Yes, or you can take the trade next day as well.
You can use TA to trade in any of the instruments. However, for shorting, its best if you use futures.
I don\’t understand.
Please suggest any option.
And i some loss in market.
After apply marabozu candlestick
Did you follow through all the checklist items?
\” To do this at 3:20 PM, the trader must confirm if the open is approximately equal to the high and the current market price is equal to the low price. If the condition is validated, then it is a bearish marubozu, a short position can be initiated.\”
This is a statement from this module. My query is that, short selling is done using an MIS order and as I understood from the previous module it must be squared off within one day. So if the trader shorts the stock at 3:20pm, I believe he wouldn\’t be able to square off his position. Please do clarify
Johaan, the idea is to take a short position in the derivatives market where you can hold the position overnight.
When we trade following candlestick patters, we understand what should be the stoploss but very difficult to set target? what should be the ideal Target?
For target and SL, you can use the concept of support and resistance.
Hey sir….
Reading all these modules now….
1) As u taught us about one candlestick pattern i.e, marubozu , how one aspirant should put it into practice ? Do you have any suggestion how to observe in daily charts of indices or stocks ? For me , seeing it on my own on a chart is enough as a homework.
2) And one more question, this one candlestick….
What time frame does it represent ? One minute one hour one day…. I didn\’t understand this point…
3) u mentioned sir that risky trader would initiate the trade the same day the pattern is being formed …during eod…buying price should correspond to the closing price and stop loss should be the opening or lowest of that candlestick…it is fine upto this….but why is that the risk averse trader would execute a trade on the next trading day…even during its eod…maybe the bullish or bearish trend of the candlestick ends at that moment….so only risky trader makes the profit… isn\’t it too late for risk averse trader?
1) I\’d suggest you pick a pattern and observe it across both stocks and indices. See how it occurs, how it pan out, the follow-through, trigger points etc. If you keep doing this, at some point, you will know the nuances of the pattern.
2) You start with the End of day candle, meaning 1 candle per day
3) It\’s because a risk-averse trader would want confirmation of the trend panning out hence the execution is on the next day.
Sir
you said avoid trading below 1% range and above 10% range candles. Can you please tell how do we calculate the range percentage.
There are two ways –
1) Take the difference between open and close, divide by either the open or close
2) Take the difference between high and low, divide by either the high and low
I prefer the first technique.
You are saying that buy-in strength and sell in weakness
If I bought a share at guess 1000 that was it\’s on that particular day So I must sell that stock higher than that right and not in weakness (i.e 995) if I am selling at 995 then I am booking a loss
It might look silly to you but I will be grateful if you can clear my doubt
Nikhil, the idea when you buy strength is that the strength will continue and you get to sell the stock much higher. In other words, you are catching on the momentum. Same with sell on weakness.
Kindly make my concept clear about the bearish marubazu. How one will make profit in bearish marubazu, What is the entry point & how the stopploss above the current marketprice will help to stop s for losses. Kindly help with an example
You get to short the stock or index using the bearish marubuzo. Have explained this in detail in this chapter 🙂
Hey Karthik, Thanks for providing the informational training material on varsity. Just one clarification in continuation of previous query on Trade Trap, Does the range refer to % change in the stock price for a particular day\’s session?
Yes, thats right.
Thankyou sir
Hello,
First of all thankyou,for your guidance is so much helpful.
Can you please clear my doubt about the trade trap,that we should not trade on abnormally lengthy candle,ie above 10% range,pls explain what does 10%range means.
Thankyou
Pallavi, the smaller range or very high range candles represent unusual activity in the market. It is best to avoid trades basis such activity.
Some more in form of video
Can we carry forward short position for next day ?
Because it looks like that from text.
But I am not sure if it’s allowed?
YOu can in Futures segment.
Remember this: Once a trade is initiated, you should hold on to it until either the target is hit or the stoploss is breached.
can someone please explain me what does the above statement means w.r.t to Bullish and Bearish Marubozu??
Its means the same across all patterns. When you take up a trade, there are two end points to it….either it hits your target or it hits you stoploss, don\’t do anything otherwise (wait for these end points).
Hi Karthik Sir ,
Suppose risk taker validate the trade at 03:20 PM and between 03:15 PM – 03:22 PM . Two bullish Marubuzo and two bearish Marubuzo candle has formed . what we will do ? We initiate a buy trade or sell trade . You can take a other way around or in 1 min charts between 03:15 PM -03:22 PM . Suppose 3 bullish candle and 2 bearish candles has formed .
This is exactly why I mentioned in my previous reply that 1-minute candles are pure noise. Please ignore that.
Hi,
I observed a 1 min pattern of banknifty at 03:13 PM it created a bullish Marubuzo and In next 1 min it created a bullish Marubuzo again and at 03:16 PM it created a bearish Marubuzo and at 03:19 PM it created a bullish Marubuzo again . I didn\’t understand this pattern . Suppose I buy at 03:13 PM by observing a bullish Marubuzo candle and after 2 mins it created a Bearish Marubuzo candle . If observe this candle it pointing me to exit the trade as bearish candle has formed . what should i do ? Do I stay on my previous trade that i took at 03:13 PM or exit the trade after a Bearish candle has formed because there is chance of a bearish pattern to be continued .
I\’d suggest you ignore 1 minute candles, its very noisy.
Hi Karthik Sir
1. Usually, if the shadow are within 0.2% to 0.3% of the range is described as a Marubuzo candle . I was observing BankNifty pattern @ 01:36 PM and most of the time it created a bullish Marubuzo candle low=open but there is difference between close and high and that upper shadow difference range between 0.2% to 0.3% . Does it will count a Marubuzo candle .
2. Open = 37900 , Low = 37900 , High = 37990, Close = 37950 , if we check there is a major absolute difference between High and close ( difference of 40 points ) and if we calculate this upper shadow range in % , it comes near about 0.2% . So does this include a Marubuzo candle .
3. I observed after 01:36 PM , Bank Nifty was continuously creating bullish Marubuzo candle . Can I understand that Banknifty was pointing to initiate a buy trade again and again . I think after 01:30 PM , it almost created 20-25 bullish Marubuzo candle .
1) Yup, you can.
2) Yes, please do check my previous reply
3) I\’d rather consider the EOD candle behavior rather than the intraday ones.
One should avoid trading during a minimal (below 1% range) or long candle (above 10% range). what is formula to calculate this range ? How do we calculate that range is below 1% and above 10% .
Two ways, take the difference between high and low and divide by high or take the difference between open and close, divide by close. Both will give you a range. I prefer to take the difference between open and close.
The trader needs to validate the occurrence of a marubozu. As per above examples in modules Risk taker validating the occurrence of trade at EOD near 3:20 PM but if i found a marubozu candle at 10:00 AM . Can I initiate the trade or it always better to take a trade at 03:20 before market close.
One more thing , it said that if marubozu candle formed the trend will continue to some next trading session and Supposed I wait for 3 trading session after initiate the position and my trade didn\’t hit the stoploss neither hit the target and stayed flat for some trading sessions . What do I need to do ? Do I wait for more trading sessions or better to exit the trade.
Its safer to initiate the trade close to the market close. I\’d suggest you wait for one of the events to occur (TGT or SL), but you can consider an exit only if you find a compelling opportunity.
Hi Karthik,
I am new to trading and have a doubt regarding shorting a stock. Suppose I observe a bearish Marubuzo and I decide to short the stock just before the closing time for the day. But, as far as I know, intraday trades must be squared off before the end of a trading day. In that case, how can I book the profit by shorting a stock at 3:20pm and squaring off the next day? Same is the case with longing a stock.
Thanks in advance.
Parth, for all the overnight short trades, you can use the futures and options segment. Short positions in these can be held overnight.
As mentioned, we should avoid trading in small (10% range) candles. Can you please tell how to calculate the range of a stock on a particular day.
There are two ways, take the difference between open and close and divide by close, or take the difference between high and low and divide by low.
Jaise Aapne bataya ki Bearish Marubozu mein risk taker trading period ke end mein short karta toh usko phir same day hi short position ko square off karna padega ?
Yes or no
Hi, great content, and am learning a lot. Have a doubt though.
In your final example showcasing a bearish marubozu, you state that \”Here is a chart showing a bearish marubozu pattern that would not have worked out for the risk-taker, but a risk-averse trader would have avoided initiating the trade, thanks to rule 1\”.
According to the chart, it forms a marubozu, and then the trend reverses the next day. So in my opinion the risk-taker would have made a profit on the day the pattern was forming, but the risk-averse trader would have missed the opportunity since the trend did not hold the next day. So could you please let me know if I missed something crucial? If not, please update the lesson.
Concerning automatic intraday square-off done by Kite, the documentation states that intraday square-off starts at 3.20, so what would happen on any short trades we do? Do we retain any control? And what happens if the stock hit upper/lower circuit? Not sure if stocks usually go into upper/lower circuits with 10 mins to go. Perhaps you could also include a brief note about all this?
Thanks.
Hi Karthik,
In the trade trap section you have mentioned that one should avoid trading during a minimal (below 1% range) or long candle (above 10% range).how to calculate this range?
Shalini, you can take the difference between the open and close and divide by close or you can take the difference between high and low and divide by low, both will give you a sense of range.
On TCS daily is yesterday\’s candle marubozu candle?
O 3978 H 3978 L 3861 C 3879.85
Looks like, except for the lower shadow bit.
I want to know about this but i want learn but i do not know anything about this.i want to learn about this subject .please let me know .
Everything that you need to know is already here, Hashini. Do check the content.
Hi Karthik
can you please help understand this \”One should avoid trading during a minimal (below 1% range) or long candle (above 10% range).\”
I mean how does one calculate 1% or 10% ? is it the stock price increase on the day maurbozu came ?
Its just that these are either too small or large a range to base your trades. May not work out that well because the stop loss is either too close or far from the entry price, hence it\’s best to avoid.
The content above mentions – \”Remember these are short term trades and one needs to be quick in booking profits.\” .. So is it like marubozu cannot be used on daily charts etc for mid term trades .. and it is only meant for intraday trades.
Short term trades are any trades held for say 4-5 days, including intraday trades.
Hi Rangappa Sir,
Can you pls explain how to calculate range of a candle.
I want to check the range between
High-low
Open-close
How range is calculated
What formula shoukd I use to get in percentage.
What\’s the percentage that has to be considered.
Thank you
The range between high and low = Difference between high and low divided by high
The range between open and close = Difference between open and close divided by close.
Thank You Sir for your response. Cheers
Happy learning, Murali!
Hi Sir,
Huge bullish movement takes place at each and every stock at one point of time. Let\’s say if a stock is bought at 50 rs, after few days it went up to 100 or 120 rs, obviously profit percentage more than 100% right.
How to identify this upside movement? Is there any separate candlestick pattern to identify this movement? Could you please assist me on this query
There is no way one can identify this beforehand. The only way you can do this is by taking trades basis TA (or any other point of view) and hoping it will move up in the direction you desire.
Hello Sir, I have seen many times in intraday 15 and 30 minutes chart that Marabozu Candlestick pattern not working often time. What is the reason for this?
Candlestick only gives you the odds, no guarantee as such.
In point 5.6 you mentioned the length of the candle within 1% to 10%. What does it mean, the open and close of the body should be within those limits ( open-close)/close<10%???
Thats right, Gaurav. It is basically the real body of the candel.
Hey, can we use this technique in different timeframes like 5 and 15 min ?
Yes, you can.
Hey sir, can you tell how can I find these candle on streak.tech
I\’d suggest you get in touch with Streak, they will help you with this.
CANDLE STICK Patterns shown here represent many trading sessions right? and also while doing trading following candle sticks if trade reverses on a bullsh Maribazo day can one opt for shorting to make a profit???.
Yes, you can. Ensure you are looking at the EOD charts for this.
As mentioned in bullish marubozu section \”As per the ACC’s chart above, both the risk taker and the risk-averse would have been profitable in their trades.\” This doesn\’t seem to be right as per the shown chart.Let\’s suppose marubozu day is 25th. As risk averse trader buying at the closing of next day 26th and in the chart after that there\’s bearish candlestick on 27th. So how he would have been profitable ?
Yes, but the stoploss is not triggered, right?
Hey Karthik, when you say trade just 10 min before the market close i.e. 3:20, so do you mean the risk-taker might/could achieve the target in those 10 mins? Is that only for intraday? Thanks!
No, it does not mean you can achieve the target within 10 minutes. You set up the trade and carry it overnight hoping to hit the target in subsequent sessions.
Timeline for the graphs would have been helpful karthik..! Its challenging to indentify when the day opens/closes
Got it. It is just that I wanted to emphasise only on the chart pattern.
CAN U PLEASE SHOW US BULLISH OR BEARISH MARUBUZO THAT HAVE FORMED IN RECENT DAYS
Mukesh, I think its a good exercise for you to spot this 🙂
Hi Karthik, i m a beginner having demat a/c in Zerodha & constantly going through Zerodha Versity to gain knowledge in share trading. The way you ve done this study material will definitely help anybody have a sound & strong foundation in trading aspects of Share Market. Anyway thanks a lot for this effort.
I ve two doubts :
1) i understood marubozu candlestick Pattern ( both Bullish & Bearish Marubozu ) but my doubt is how a candlestick satisfies marubozu, i mean upper & lower shadow absence i understood & variation in this upper & lower shadow (<0.2% to 0.3%) also i got but there may be small Marubozu or Big Marubozu how to identify this? Is there any range in between Open & Close? Is there any method, plz let us know. Also which Marubozu is better to trade?
2) As u ve mentioned single candlestick pattern form by just one candle means the trading signal is generated based on 1 days trading action. As of my understanding at 3.20 pm i should follow 1 day time candlestick pattern or 15 min candlestick pattern, etc. Plz correctify my understanding, if its wrong.
1) Small or big depends on the previous few candles (prior trend) that you are looking at. For example, if the previous few candles are all large ranged candles, and the marubuzo that you are looking at has a smaller range, then that can be considered a small range candle. Likewise with the prior trend being small and a large marubuzo. Its best to trade a marubuzo which is consistent with the prior trend.
2) You can follow 1-day candle, Tapas. Stick to this at least for the first few months till you get comfortable.
If Im not wrong, when one short sells a share, their position must be squared off by the end of the day. Now, as the article explains, assuming the trader is a risk-taker, one has to wait till 3.20pm to verify that the candle is a Bearish Marubozu. So if one short sells after 3.20pm and must square off by 3.30pm the same day, there wouldnt be much room for profit, correct?
Also, I didnt understand the strategy of the risk-averse trader. Could you please explain with an example?
Arijit, you can short sell via the futures market, where you can hold the positions overnight.
In last example why did the price soared high even after a bearish maribozu?
There are no guarantees in the market, patterns are just indicators of what is likely to happen, not necessary that the same will happen.
Hi Karthik,
A small doubt – \’\’One should avoid trading during a minimal (below 1% range) or long candle (above 10% range).\’\’\’
How do I verify this mathematically for the ACC OHLC data given as Open = 971.8, High = 1030.2, Low = 970.1, Close = 1028.4?
There are two ways – (1) take the difference between open and close, divide by either open or close (2) Take the difference between high and low, divide by either high or low, both will give you a range for the day.
Sir, I couldn\’t understand why you set stop loss at a high price in a bearish marubuzo?
Becuase in a beading marubuzo, you short the stock.
Hi,
I don\’t know why I\’m confused. The first assumption – Buy strength and sell weakness, doesn\’t it mean buy high and sell low? wouldn\’t it mean it is a loss?
Asian Paint example of Bullish Marubozu the last line is – Going by the rule, we should buy only on a blue candle day and sell on a red candle day. Need to do this only when it is an uptrend red candle?
Yes, but you expect the price to go higher, hence you buy strength.
Sir, in the topic Trade trap it is said that we should not trade if the candle is less than 1% range or more than 10% range. So how do you calculate this range.
You can do that by taking the difference between open and close and dividing it over close.
If I buy at 3:20 PM based on bullish Marubuzo, are we targeting to sell tommorw anytime, or sell it today at 3:30 PM? If i sell tommorow means I have to take delivery of stock?
Thats right and it will result in a BTST trade. Alternatively, you can trade futures also.
Suppose i target my trade to a target price of say Rs 100.. And the trade gets executed. then i think that the price might even reach 110 or 120 …what should be done ..should we wait and see if the price goes up ..or be quick to book profit and square of the deal
Chetan, that depends on your trade design right? You need to have a plan before you execute trades.
Hi Sir,
You are using 1 day as a unit of time for each candle, like watch for 1 candle(day), act on next day(candle) for risk averse traders, but my question is whether this unit of time is fixed or it can be scaled from 1 min to like a month for each candle?
And this question is not specific for this chapter, its for general CandleStick analysis.
By the way, you have done a great work sir.
Thank You.
This is not fixed, you can scale this to any time frame. Not necessary to have it to just eod charts.
if we follow rule no 1 buy on strength and sell on weakness what profit we will get?
Can\’t really comment on that, Venu.
Hi Karthik,
1. In Scalping, what is the time gap recommended while looking at candlestick chart? e.g. 5 mins, 3 or 2 mins?
2. Does Marubozu chart helps in scalping when we need to buy/sell shares in few minutes?
Thanks,
1) High freq traders scalp with 1 or 5 min charts, but technically you can scalp at 10 mins also. I\’d prefer 5 or higher.
2) Yeah it does, but to scalp, you need to basically develop price based instincts.
Thanks Zerodha for putting this very useful materials.
I have a question – the recommended approach to initiate trade on a Marubuzo pattern is initiate the trade around 3.20 pm. But how likely are my chances of the trade executed if I initiate the trade just before closing ? As per my experience, it could be difficult for your trade to be executed if we initiate around this time
That\’s right, but you can always initiate the trade-in futures or options segment.
Please advise whether we have to see 15 minutes or Day candle in order to place orders based on Marubozu?
Yes, you can. Not an issue.
Hii, firstly I would like to say a big thanks for introducing the stock market in such a simple way for beginners. I have a doubt that how do we calculate the range of a given candle in percentage as mentioned in point 5.6.
Harshit, you can divide the day\’s price movement (difference between O and C) and divide that over close.
Hey when should I buy back in bearish marubozu if I short by 3:20 pm?
YOu can buy before 3:20 in EQ, if its in Futures, you can hold the position to expiry.
Hi Karthik
Just want to appreciate your efforts .
Your chapters expalantion are better than any teacher lesson plans.
The way you have explained everything is stupendous.
Thank you.
Thanks so much for your kind words, Neal. I hope you continue to enjoy reading the content online 🙂
Hi,
As per the content, If I am a risk averse trader and I find a marubuzo trend that I will buy the next trading session only if the trend is still bullish i.e around EOD?
I don\’t get this. If I have found a marubuzo trend then shouldn\’t I invest first thing in the morning as the chances of a bullish run will be more rather than buying at the EOD where even if the trend is bullish we are not sure of the next trading session as the marubuzo happened a day back.
The idea is to hold the position for few trading sessions to ensure that you ride on the momentum. Since this will be a multiple-day session, you want to make sure the trend continues, hence you wait for the confirmation.
the pattern you are mentioned is for 1day time frame
can i apply this patterns in any time frame i.e 1min 10min 15min please explain it
Yes, you can Pavan.
sir then which risk appetite is best fit in this trading environment with TA in respect to market instead of a particular trader
Depends on your risk appetite, right? No one can suggest this for you, you have to analyse your own risk appetite and act based on that 🙂
sir you suggest not to trade in trade trap(candle greater than 10%) because of deep stoploss and as a risk averse appetite the stoploss also goes deep but instead suggests long or short.
Or we can say that the risk averse type trade with (10% or greater ) deep stoploss is also a trade trap??
Yes, you can extend this to risk-averse as well.
How can I short trade by the EOD? Isn\’t shorting applicable only for intraday trades?
You can short and carry forward positions in the derivatives segment.
Hi Karthik,
Please explain : the variation between high and close with an example(with formula) for my reference
Hi Karthik,
Could you please give me the formula for calculating the below.
the variation between high and close
———————————————-
Reference is as below:
for example, the variation between high and close is 1.8, which as a percentage of high is just 0.17%. This is where the 2nd rule applies – Be flexible, Quantify and Verify
———————————————-
Good
Hi Kartik,
If a Bearish Marubozu is established and if a person of a risk appetite shorts such a share on the same day when marubozu is formed, wouldn\’t he have to exit the position on the same day ?
Not really, you can short futures as well.
One should avoid trading during a minimal (below 1% range) or long candle (above 10% range).
See 5.3 Bullish Maruboza above,
you can see high-close/close=0.17%, this is what example given in bullish maruboza.
0.17 is less than 1%, which means we should avoid it, then how the trade happened ??
The range is the day\’s range, not the upper shadow range.
One should avoid trading during a minimal (below 1% range) or long candle (above 10% range)
could you please what it mean by range here , it would be really helpful
I\’ve done this in the comments, Shivani. Please do check the same. Thanks.
Please let me know whether Single candlestick patterns are used for swing trading or BTST? For how long we can hold the stock for maximum profits after the bullish or bearish marubozu is formed?
Yes, you can. You hold till your target or SL is achieved.
Hi Kartik,
on 14th June, Marubozu was formed for IPCALAB(O:2050.95, H:2100, L:2050.95, C:2095.05). Next dat on 15th June, the stock started as bullish but closed with around -1.4% decrease(bearish). As a risk-averse trader, can I buy this stock on 15th June morning when it was blue
Yes, but ensure the SL was not hit when it went 1.4% down.
What are the sources of these charts? I cannot find the latest charts anywhere.
Its from Kite.
Hi Karthick,
Really very useful content.
Thank you for sharing this valuable content.
I need to ask you one question.
Can we identify marbazou candle before it formed with the help of previous candles? Or is there any way to identify it before formation?
Nope, that won\’t be possible Murali.
Hi Karthik
Thousands of charts are formed in a day, don\’t we have a software which indicates this kind of candle (marubozu) being formed?
You can check steak.tech for this, Vikash.
Hi Karthik
Is there relation between length of the candle and volume? I mean higher the volume longer the candle?
I guess I am wrong.
Hmm no. The length of the candle is range. So it could be a long-range candle, for example, the stock could have traded between 100 and 108 (8% range), but the volume could be tepid.
Hello , This reading was really insightful though I did not get this statement . could you explain ?
\”One should avoid trading during a minimal (below 1% range) or long candle (above 10% range)\”
Lack of volatility or excess volatility means there will be no movement or excess movement. No movement means your capital is stuck and excess movement means that the chances of SL getting triggered due to volatility high volatility. Hence you try and avoid both situations.
Hi Karthik, These candlestick patterns will also work the same for Nifty and Bank nifty trades ?
Since they are not at stock specific level, the sentiment can vary among the different stocks in these indexes!
Yes, these can be used across any asset.
There are inconsistencies in the text. Kindly check for spelling errors.
Will do, thanks.
Can anyone explain how both risk-taker and risk-averse are getting profit in Cipla Limited last chart
thanks
Thats because the stop loss was not triggered and the price moved in the direction of the trade, hence both the types of traders benefitted.
One point is not clear to me, \”Buy Price = Around 1028.4 and Stoploss = 970.0 . and buying on strength and selling on weakness.\”
It appears that buying at high price and selling at low price, creating loss. May I get an explanation.
No, you buy around the high price, hoping the trend will continue and you sell it at a higher price.
Hi Karthik,
Nicely explained with excellent examples. But it is often said in the market that “Be fearful when others are greedy. Be greedy when others are fearful.” This does not go with the statement \”Buy strength and sell weakness\”
Please explain.
There are many theories, Arnab. They all hold true to some degree. Just like this one 🙂
can you give explanation in marathi …. because marathi traders live in india not only hindi or other language ….strictly warn you
sir how do we calculate the length of the candle to arrive at the 1% or 10% figure?
Take the difference between high and low, divide that by low or open.
What is \’stop loss\’ in Bearish Marubozo?
I got the point that we need to sell at closing point in Bearish Marubozo but I\’ve not understood the concept of \’stop loss\’ as the point is going to be higher.
Akash, in all the bearish patterns, the high of the candle marks the SL.
I am bit confused. If I buy share at 3:20 Wednesday, when do I sell it ?
If it is CNC order, I will only be able to sell after 2 days, Next Monday. It leaves probably that by the time I am eligible to sell share, i am already booking loss.
If it is a MIS order, it has to be squared off today only.
Plus, shorting can only be done when placed an MIS order.
When exactly do we square off if it a CNC order or MIS order.
Gaurav, you can sell the next day as well (as long as the stock is not in T2T segment), check this https://support.zerodha.com/category/trading-and-markets/kite-web-and-mobile/articles/what-are-trade-to-trade-stocks
Great Self explanatory Content.
Happy learning!
Hello Karthik
Thank you for such a lucid explanation.
I have a query, Is the pattern identification done manually by the individual or is there any software that outrightly informs about the marubozu formations in all the stocks. Manual identification even for 10 stocks will be humanly impossible within such a short span of time, so how to go about this? or am I missing something?
Thanks
The chartIQ engine integrated with Kite has a candlestick pattern indicator, please do check that, we have discussed in this chapter – https://zerodha.com/varsity/chapter/the-central-pivot-range/
Hey Karthik!
Can you please explain how should we book profits during bearish marubozu?
As if I am a Risk-taker then if I will short at 3:20 and since shorting works for only one day, it will automatically will get suspended at 3:30Pm.
so, how I did make a profit?
You need to short using futures, which can be held overnight.
How do you decide the stop loss price? There\’s no hard and fast rule so cant we just set the stoploss to a not so deep price on a long candlestick day?
The candlestick patterns come with inbuild SL levels.
i really don\’t understand one thing, you say time frame can be anytime ranging from 5 min to one day, but the above examples only talk about one day time frame candles(from the fact that risk taker would buy on same day, risk averse buy the other day)..what is the conclusion
Harsha, I\’ve used EOD chart since a majority use EOD timeframe. I think I\’ve used intraday charts as well in few examples. But like I\’ve mentioned, it does not really matter, you can use any timeframe that matches your trading style. The pattern\’s interpretation and the following action that you take remains the same.
Are these concepts applicable for intraday traders as well, who makes decision on seeing 5 min or 15 min candlestick?
Yes, TA is applicable to all time frames and assets. You can use this.
How do we know that the volume traded is an acceptable one? Does avoiding trades where the difference between High and Low is below 1% and above 10% indicate that a proper volume has been traded? If it\’s less than 1% trade can be avoided. If I am wrong. Please tell me what should be the volume for trade.
These are two different things no? i.e. traded volume versus day\’s high and low. If its the traded volume you are looking at then a simple 10 day moving average should let you know if it\’s good to go or not.
I want to know that in above example what is the duration for a risk averse to confirm the trend? Should it 15 min or 30 min or the whole next day.
I\’d say by EOD if you are looking at EOD charts.
You havent explained anywhere whats stop loss and whats shorting? It suddenly appears in the content. Good to explain with examples. Can you??
Ankur, I\’ve explained this in the previous chapter.
Hi,
Thank you for the content. I am finding it very useful. My question is in a day if I can identify two or three Bullish Marubozu then which one to consider for buying.
The stock that you seem to more confident about.
I do trading and I invested in a candle company and so know a lot about this subject!
Hello sir,
1.Can we calculate the range of the candle by using the following formula:(open-close)/average of open and low
the avg of open and low would be (open+low)/2
2.I read somewhere that the top or the lower wick should be less than 5% of the total candle stick range, is it true?
for ex consider open=2000,low=2000,close=2195,high=2200 in this case the total candle range would be high-low i.e 2200-2000.so the range would be 200,5 % of 220 would be 10.and the range of upper wick is high-close 2200-2195=5
1) Yes, you can.
2) Yeah, just to avoid high volatility
Sir, can you tell me how can I calculate the percentage here ?
One should avoid trading during a minimal (below 1% range) or long candle (above 10% range).
Take the range for the day i.e. the difference between close and open and divide that by close, you will get the % range for the day. Once you get the % range, its easy for you to make decisions.
Thank you sir for explaining..😊
Good luck.
Sir,
Can you please give a practical example for this phrase ?
The problem with lengthy candles would be the placement of stoploss. The stoploss would be deep, and in case the trade goes wrong, the penalty for paying would be painful. For this reason, one should avoid trading on candles that are either too short or too long.
Imagine a bullish candle, the SL for a bullish candle is the low of the candle. So the longer the candle, the deeper is the SL. Hence in case the SL gets triggered, then the loss will be deep.
Hi team, need help regarding below two queries.
1) Why at times a limit buy/sell order gets executed at higher/lower price. I noticed the average buying price on a higher side than the limit buy order for today\’s trade.
2) Consider below scenario (Intraday trade)
Buy price Rs 100
Current market price Rs 103.
Now I want to play safe and at least wish to ensure that my exit should not be less than Rs 101. However I still want to hold my profit position as its uptrend. How to place such orders in kite.
1) Cant be, limit price ensures you buy and sell at the specified price.
2) In this case you place a limit sell at 101.
The color of the marubozu does matter right ?
It does, that\’s how you establish the bullish or bearish insights.
Tata Steel share price on 26th march was :
Open = 734.30, High = 753.30, Low = 734.30, Close = 750.65
1) So we can consider this as a marubozu candle right?
2) Now assuming Low = 730.00 so now this would not be a marubozu candle right?
1) Yup
2) Yes
You mentioned about heights of candle short candle i.e less than 1%, Long Candle more than 10 % .
My doubt is what is base or principle to calculate this percentage like how do calculate it is less than 1 % or more than 10 % ?
You can calculate the % by taking the day\’s range and divide it over the closing price (or the avg of OHLC).
I am having a bit of confusion here and had a couple of question :
1) In the above chart the variation b/w high and close is 0.17% but you said a variation of 0.2% – 0.3% means that a pattern exist so why do we see a pattern here even though it is less than 0.2%?
2) What do you mean by range. Is it just High – Low ?
1) Smaller the variation, the closer it is to the actual pattern. But the max threshold is 0.2-0.3%.
2) Difference between high and low, some consider just the difference between open and close.
Looks like in earlier times, an investor didn\’t have the option to limit the stoploss.
Why not, stoploss option has always been there.
I am aware of what a bullish or bearish candle is. Can you be a bit more precise when you say \”The risk taker is buying on a bullish/blue candle say\”. How to ascertain if is a blue/red candle day? Is it based on the number of blue or red candles in the chart? Should it be ascertained before the Marubozu is formed?
Not really, like I\’ve explained in the chapter, you can ascertain this by looking at the OHLC of the candle around the closing time and figure if this is a bullish or a bearish candle.
Hello! I am working on a machine learning project wherein I am trying predict the direction of a given stock (HDFC Bank. Previous 10 years data on daily basis. 2217 data points). I am planning on using candle patterns along with indicators. So I have written a code to generate candle types from OHLC data. The problem/question I have is this. The number of significant candles types that are mentioned here are very less.
Long 1036
Short 545
None 398
Marubozu 172
Doji 30
Spinning Top 17
Paper Umbrella 13
Shooting Star 6
What are your comments/advice on this? Thanks in advance 🙂
Sorry, dint get that. What do you mean by significant candles type?
Hi,
I am still confused why should one buy at strength and sell at weakness? I mean if I buy when the price is soaring how much profit will I be able to make? Same with selling. Would really appreciate if you could clear it.
Thanks in advance.
The idea is to continue trading along with the trend, while it is really tough to capture the entire trend, as a trader, you can aim to capture at least 40-50% of the trend. That is the idea here.
What is the time duration for each candle ?
These are EOD candles, but you can use these across any timeframe.
In the 2nd ACC Chart : Ref Chart = ACC 1049.85: where you have discussed Bullish Marubozu – there was a Bearish Marubozu ,just preceding the Bullish one , followed by gap down.
In Bullish marubozu opening price of the day is approximately equal to the lowprice the day . Here if the days opens with a bearish candle then reverse in uptrend and giving Bullish marubozu then which price should we consider day\’s low (opening of bearing ir closing of bearish candle
You need to check for how low the price is and the difference between low and open.
\”5.6 – The trade trap
Earlier in this chapter, we did discuss the length of the candle. One should avoid trading during a minimal (below 1% range) or long candle (above 10% range).\”
Question : What could be the range for Intraday (5min, 15min)?
For the intraday range, you can consider the prior candles and get a perspective. This really depends on how volatile the session is.
What is actuallt meant by the prior trend(3rd assumption in the candlesticks)?
Please read the subsequent chapters, you will get this 🙂
Hi Karthik,
Quite confused with the Marubuzo, Can you please help me out here
1. The ACC Chat the bullish marubozu, represented the opening of the day or closing, there are other multiple candle does they represent any thing or just we need to observed bullish marubozu.
2. If Bullish Marubuzo is observed during closing then does it mean that it will follow the same pattern next.
1) Yes
2) No, it means the bullish trend is expected to continue over the next few trading session.
I am clear about shadow length formula.
Karthik, i am bit confused in length of body.
In one of above comment you mentioned \”The length of the shadows should not be more than 1% of the length of the real body\”
How to calculate length of body is it like ((open-close) /(close)) and ((open – close) /(open))?
Length of the body = the difference between open and close prices.
Thank you Karthik for the amazing guidance and response.
The studies dropdown in the chart view has a candlestick pattern option which spots and labels the candles. Do you suggest this for beginners? does it spot all patterns? do you recommend learning about any other study topic in that dropdown? Thanks a lot!
I\’m not a big fan of this, I prefer manually spotting these patterns. It makes you look at charts and observe market behaviour, in the long run, this observation will pay rich dividends 🙂
But kartik if I hold equities in cnc, the scgt tax will be charged. Do you think that i can make that enough profit by doing it.
Thank you
Vibhor, your trading should be designed in such a way that you turn profitable post taxes as well. Which means to say, that the target and SLs should be well thought through.
Hi kartik,
You\’ve mentioned that the risk taker notices the candlestick pattern at 03:20 PM most of the times in every candlestick pattern. i wanted to understand this properly – suppose if i bought 50 equities @03:25 pm when i noticed that the bullish marubozu has formed. What will happen my equities will be squared off automatically @03:30 or i can hold those 50 equities for the next day.
Thanks in advance
The idea here is to hold the position, so you buy under CNC and ride it till you get an opportunity to sell, which could be anytime after you buy, like in few days or the very next day depending on the momentum.
I am unable to view chart on my mobile of kite app
Request you to please contact the support desk for this. Thanks.
I am a beginner and I have one query regarding short selling.
Isn\’t it that short selling is intraday trade?
In bearing Marubozu, for a risk-taker trader if he/she short the stock at around 3:20 PM then how that trade will carry forward to the next day? As short selling is intraday trading.
Kindly correct me I am wrong in any understanding.
You can initiate a short trade in the futures or even in the options market, Bhushan. These can be carried forwarded overnight.
Sir, sometimes when candles r above a green candle they are red in colour despite being above the previous green candle? Why?
Some candles are green despite being below the previous red candle, why?
Sorry, but can you share an example of this?
Sir observing many bearish reversal pattern but not working I\’m just seeing how market reacts
Spotted bearish engulfing in hdfc third day dozi but gap up 13 points support is at 669
One thing I leart was to never short in a uptrend
What is your opinion sir
Absolutely, especially true for a raging bull market 🙂
Hi Karthik,
If there is both upper shadow and lower shadow(under permitted range) in a same candleStick,will it be considered the valid Marubuzo?
Yup, 0.25% of the range…have discussed this in the chapter and comments section.
I understood the formula Kartik. Just also let me know what should we divide these formulae with?
No division right?
Grateful
Happy reading!
Hi Kartik,
Please answer one query, that is really baffling me despite hours of trying to calculate:
– Are there separate formulas to calculate the upper and lower wicks of candles.
– Are the formulas for green and red candles same or different?
For a bullish candle UW = high – close, LW = Open – low
For a bearish candle UW = High – open , LW = Close – low.
Can we apply this in crypto trading??
And tell me what us the time frame of the charts shown above??
I guess so, although I\’ve never done this myself.
This is interesting to read and learn. After reading many inputs i am able to compare and see that this site shows more clarity with example.
Good luck!
So how will the risk averse trader avoid loss if value goes down after Bullish Marubozu. He will look to buy as soon as the market opens on next day on the closing price of the previous day.
The person will have to wait till the SL gets triggered. The decision to close when SL gets breached (during the trading session) or wait till the close depends on your experience with the markets.
When on the next day, does a risk averse trader buy/sell? As soon as the market opens on the closing price of previous day, or when?
Depends on your experience in the market. I\’d suggest you look at closing if you are new to market.
I got it, sir. The doubt arose bcz of your second chart showing an investment in a rather small candle.
Thank you😊
Good luck and happy reading!
Just to confirm, investing in not so big or medium sized candle is better than small ones, right sir?
Nikhil, you need to understand the reasons why these candles are formed. They are a function of day\’s range/volatility. The point is we are trying to avoid high volatile candles.
Which is more preferable, investing in a big candle marabozza or not so big or small marabozza? The second marabozza in above figure was a bit small hence the trend reversed you could say?
Not so big 🙂
Sir
In case of lengthy candles can we get high profits or we get only loss
Depends on how you trade right?
Thank u
Can we take delivery of sold stocks after t+2 days and buy it back later or is it mandatory to buy intra day? what happens if we dont buy it back intraday? does the broker automatically buy it back for us?
Btw Varasity is amazing , I have read every single line of every single chapter until now , you\’re amazing man
Yes, if you don\’t buyback intraday, the broker will. But if the stock hit an upper circuit, there is nothing much one can do. For overnight positions, I\’d suggest you look at futures.
Impressed with all your answers
Happy learning, Arun!
Today is the first article on zerodha after I decided to learn and start trading.Shall i learn all the topics and then start or is it okay if I implement one and then learn a new topic
Yes, thats ok Vishnu!
Hi Karthik,
My Question:
I deal mostly intra-day, is Marubozu a good indicator for Intra-day ? if yes then:
Suppose Bajaj Finance shows a bullish Marubozu at 11.30am, is it a good time to take buying position considering buying will be strong now and vice versa in bearish Marubozu case ?
YEs, you can take cues from candlestick patterns on an intraday basis.
Hey, i\’m still a lot confused about buying in blue and selling in red . I mean we should buy in red and definitely sell in blue na. Please explain .
Raj, if you are chasing momentum or trying to catch a trend, then you need to buy strength. Strength is represented by a blue candle. Hence you buy strength, likewise for the red candle.
In bearish marubozu candle of BPCL, are you talking about intraday trading because we can\’t short in long term.? One more thing if it is intraday trade then if some buys it during the closing hours then when will he sell it? The market is already about to close.
Abhi, you can short in the futures market and carry the position overnight.
Sir,
Is the \”Trade trap\” a general suggestion or is it specific to Marubozu?
And what does the percentage of range mean, I didn\’t quite get what the 10% range would mean, kindly elaborate!
It is applicable to all patterns.
Hi Karthik,
As you mentioned in 5.5
\’If the trader is risk averse, he can wait till the next day’s closing. The short trade will go through only by 3:20PM next day after ensuring that the day is a red candle day. This is also to ensure that we comply with 1st rule – Buy strength, and Sell weakness.\’
Short trade only possible with Intraday. If somebody buy stock at 3.20PM then how much profit/loss it will give in 10 min window. (means it will be difficult to buy back shares and get profit in 10min.)
Please explain
Thanks
Amit, you can always short in the derivatives market and carry forward the position overnight.
What is a red candle day for a risk averse trader? You told the trade has to start the next day after ensuring its a red candle day for bearish pattern. What would be the timeframe to know if its a red candle day ? If I want to trade at the adviced price the next day how long should I wait for a red candle? This is not clear from any of the posts.
Ideally, you should initiate the trade after ensuring the day is indeed a red candle day, which means u can take the position only around the close of the market.
How is the target calculated 1.5:1?
The target can be calculated by a simple S&R method.
Thank you Karthik!
Good luck, Gaurav.
Thank you Kartik!
some more clarification please – towards the end of the trading day means day after Bullish Marubozu was formed (i.e. today), is that correct!
And, in this case wouldn\’t buying price be far away from targeted buying price and deep stop loss! Kindly advise!
End of the trading day refers to the day you intend to take the trade. Not really, it depends on where you\’ve placed your target at right?
Hi,
Let\’s say Bullish Marubozu was formed yesterday, today\’s trade should be initiated if it satisfies rule #1 (buy strength and sell weakness).
My question is, at what point we decide it\’s a Green candle day and initiate the trade.. I mean in the morning or in initial trading hour/s it could be Green candle day however as the day progresses, it can lead to red candle day and won\’t satisfy rule #1 and lead to a trap trade. And if we wait for entire day till ~3:20 to test rule#1 to initiate buying, price could be far away from buying range and stop loss will be deep.
Kindly educate! Regards, Gaurav
Gaurav, you will have to evaluate this towards the end of the trading day, just before you decide to buy.
Dear Karthik Brother,
Earlier in this chapter, we did discuss the length of the candle. One should avoid trading during an extremely small (below 1% range) or long candle (above 10% range).
Here, What is Range?
My understanding here is that the real body of the candlestick should not be below the 1% of Length of the Candle Stick and should not be above 10% of the length of the candlestick. ( I think, Length of candlestick= (High-Low) ).
Am I correct?
Dear Karthik Brother,
Earlier in this chapter, we did discuss the length of the candle. One should avoid trading during an extremely small (below 1% range) or long candle (above 10% range).
Here, What is Range?
That\’s the range, less than 1% or higher than 10%.
Hi, I am new here.
What is meant by 1% and 10% range. 1% and 10% of what ?
Sumit, there are two ways to calculate the range. Either by taking the difference between high and low and dividing it by its average or by considering the difference between the open and close and its average.
Hi Karthik, I\’m on a spree with the courses thanks to you and lockdown. Wanted to know what range you referred to when talking about Trader trap.
You said below 1% range or above 10% range. This range is to be calculated with respect to what?
Hope you are liking the content, Kunal 🙂
There are two ways to calculate the range. Either by taking the difference between high and low and dividing it by its average or by considering the difference between the open and close and its average.
Hello, Karthik sir there\’s a stock \”Refex industries\”. in Zerodha kite app it shows an upper shadow in MORUBOZU candle while at tradingview.com it shows the lower shadow for today i.e on 16.10.2020.
Possible, no to charts are same, minor variations are acceptable. Do check this – https://tradingqna.com/t/why-does-two-charts-of-the-same-timeframe-look-different-on-the-same-platform/4715
How to calculate length % of a candle stick(to avoid trading on 10%)?
Thanks in advance
Take the difference between open and close and divide it by open.
Hi!
Consider bullish Marubuzo. I didn\’t get why do we set stop loss as L? Obviously, it should be lower than H, but is there any reason to specifically select L as the stop loss? If not, then can\’t we even trade during a long Marubuzo, just with a stop loss reasonably higher than L?
Thanks!
AA
The low point indicates the point at which the stock price bounced back. So that\’s a level expect the price to bounce back if it were to drop again. Hence the L acts as a SL.
Hi,
If I find candle partly Marubuzo, like Open & High Same(Bearish) only or Open Low Same(Bullish) and the candl\’s another side has mediam lenght shadows, what will be the significance in reletion to Fully Marubozo candle.
It depends on how long the wick is. If it is large enough, then you should not consider this as a marubuzo.
In Marubozu graphs shown above the X axis represent the dates or it\’s different time of one trading day.
Depends on the chart you are looking at. If its the intraday, then X axis represents different time of the day. If its EOD, then its dates.
That\’s a good strategy. Thanks Karthik.
Good luck, Ajith!
Hi Karthik
You have given a clear explanation as to when to BUY the stock.
You have also explained if the price start to go down beyond your expectation, you have STOP-LOSS to arrest the loss on your investment.
But can you tell: assuming the stock is going up reasonably higher: when is the right moment to sell? You cannot expect the stock to be going high perpetually, right? There will be a point where you say, this is reasonable profit I will be making – let me book the profits and move on. What is that point? How to find it out? And do we have tools in the terminal to automatically sell it at that point?
Thats right Ajit.
When the stock is going higher and there is momentum picking up, you can start to trail your stoploss. Basically, when you trail your SL, you move your SL higher and higher so that you start locking in your profit. For example, you initiate a buy at 225, with 215 as SL. Your target is 250. Say the stock hits 250 and it is moving higher, then you increase the SL from 225 to say 245. Stock moves to 260, trail your SL to 252, stock moves to 265, SL moves to 255…so you keep trailing to lock in a higher and higher profit value.
Ok Sir.
Thanks 🙂
Good luck!
Thank you Sir.
Sir, is there any way I can connect with you personally other than this forum ?
Please let me know if that would be possible.
Thank You.
This is probably the best way to stay connected, I\’m available on this platform quite regularly 🙂
Got it !!!
Thank you so much Sir for your response.
Good luck, Sunny!
Hi Devaki,
What is the formulae you have used to calculate ?
is it [(open-low)/open ]*100 i.e. [(249-243)/249]*100 = 2.4 % ?
Thanks in advance.
This seems like very small candle so we should not consider it ( too long or too small)
Thats right, Ishwar.
Thank you Sir.
Building on that, I need one more clarification, say, I am looking at an intra-day chart (15 Min Candle) which suggests bullish movement, however the daily and weekly chart suggests bearish movement and I am looking for an intra-day trade. In that case does Daily/Weekly/Monthly chart hold relevance ? and vice versa for positional trade, in that case intra-day chart should not matter. Right ?
Please provide some insight on this.
Thank You.
It depends on the kind of trader you are your ability to take on risk. I\’d generally like to align my trades in the same direction as the EOD chart suggests. So if on EOD its bullish, I\’d like to set up bullish trades for the day. Having said that, I\’ve also done contra trades which have gone right occasionally.
Also please clarify the range of a candle.
Is it calculated as high – low or open – close ?
Or either ways ?
And what should be the denominator ?
Both are valid methods for range. The denominator is the higher of the two.
Hello Karthik Sir,
can you please share the optimal time frames one should look for in different types of candlestick patterns ?
Like for Marubozu what time frame to look in say 15 Min, 1 Hour, Daily and so on.
what timeframe is most effective.
It does not really matter, Sunny. CS pattern is applicable across all timeframes.
One more question Sir,
In a Bearish Marubozu you mentioned that \”if the trader is risk averse, he can wait till the next day’s closing. The short trade will go through only by 3:20PM next day after ensuring that the day is a red candle day\”…
I could not understand this..does it mean that I will be sure its a red candle day only after i wait till 3.20pm the day after the bearish maruzozu is formed and then I do the short selling? But this gives me just 10 minutes to execute the target/ride the fall..pls clarify
You will have to validate this by 3:20PM by look at OHLC parameters. I\’ve explained the process in chapter itself.
Dear Sir,
Very helpful material. I have a doubt..kindly answer. You have mentioned that the trader needs to validate the occurrence of a marubozu at 3.20pm before the market closes. My question is what duration i have to choose for the candle to access this?
You can look at EOD or 15mins intraday candle for this.
An abnormal candle lengths should not be traded.
can you quantify the length. what should be the range?
As much as more than the difference between the high and close of the candle.
How to measure the length of the candle? Like you mentioned not too short or too long?
There are two ways – take the difference between open and close or high and low.
Sr, I have some doubts regarding bullish marubazu and bearish marubazu….
1. You told when to buy and to set a stoploss in the bullish marubazu but my question is \”when to sell\” in the bullish marubazu?
2. In bearish marubazu, you told when to sell and to set stoploss but \”when to buy\” in the bearish marubazu?
1) Depends on your price target, you can use concepts of S&R to get set targets for trades
2) Same as above.
How to know the target? In the sense when we should book profit and exit?
Have discussed this in the Support and Resistance chapter – https://zerodha.com/varsity/chapter/support-resistance/
SBIN around 3.20pm O-210.5L- 210.5 c- 216.2 H- 216.5. Upper shadow was 0.1% well within permissible range of 0.3%. Volumes were above 10 day average hence initiated a trade. Buy price 215.85. After close 3.30pm the ltp went to 215.65. I understand that these are last minute orders. But my question is now the upper shadow range is around 0.4% questioning the bullish marubuzo pattern. What to do under such circumstances. In future should we also keep the ltp after market close as a buffer while calculating the shadow range to be flexible and quantify. Thanks for your valuable time.
Yes, you need to have some buffer for that. For now, you just have to go ahead with the trade.
As I read the thread … I realise I asked you something already answered by you so many times….
In this regards, we should come up with dialog box that consolidate and bifurcate queries based on key points like Range, length, stop loss, others, feedback (%, ⭐️, comments)
This will reduce time and efforts tremendously
I know, its on its on the cards 🙂
\”Rule 1 i.e buy on strength and sell on weakness.\”
Sir, as you mentioned earlier that it doesnt make any sense to follow this rule if you are a long term investor. This rule is only for short term traders.
What about long term investors who want to use Technical Analysis, Candle Stick charting to look for an entry or exit point ?
Personally I\’ve found the application of MA as the best for long term trends.
Hello Sir,
Can we short a stock which we are not having beyond intraday? If a bearish Marubozu is forming then how can we short a trade by purchasing it around 3:20PM?
Yes, you can short for intraday.
Hello,
Few questions-
1. Is it mandatory to wait till 3.20 and then do the trading (buy/sell) as per this concept?
2. If we consider MIS equity trade then trading on marabozu day doesn\’t make sense right since he/she will have time till 3.25 so should depend on futures and options ?
1) Its just that post 3, you get a perspective of where the market will close and you can act accordingly
2) Thats right, you will have to set up the trade for the next day.
Also what is range
Difference of close & open
Or
Difference of high & low
The avg trading price is a provided in market depth… that is not avg of close & open then wat is it
Range = Diff between high and low.
In volume and price action… price is red but volume above or below average… it should atleast be red but I come across where volume is green color eg Pidilite chart today
I\’d suggest you ignore the colour of the volume.
Thank you!
This helps but request if you explain with one example to add to my better understanding
For the benefit of all .. would like to bring to your attention that in varsity app there is typo error to be corrected … Mod 2-Chap 3-page 13/29 it says divide by avg of open and low…
Ah, ok, let me look into this, Manpreet. Thanks.
Can you tell the Formula for computing the range of candle so as to compare it whether it is below 1% or above 10%
Take the length of the shadows and measure it as a percentage of the entire real body.
Hi Kartik,
How to identify candle range. What is formula so as to compare if is below 1% or above 10% and be avoided…
You can consider the difference between open and close and take it as a percentage over the average price of open and close…or simply the close price to get a sense of the day\’s range.
If one buys the stock on the T-day marubozu is formed with a stoploss of that day\’s low, and on the (T+1)day the stock\’s price breaches the stop loss, how will he/she be able to exit that position ?
as per the current norms, one can only sell the shares bought after t+2 day. So will he/she keep on accumulating the loss until the t+3 day ?
Thanks.
You can do a BTST trade. Also, if you\’ve done a futures trade, then you can exit easily.
Hello Karthik,
Thanks for responding back to my previous question on Future retail.
I do have further questions:
-Future Retail on 19th August 2020 rose by close to 20%. In one of your previous answers, you had stated that personally you dont take a position on the Marabuzo if the length of the candle is > 8%.
Keeping the above in mind, should i avoid taking a position now?
-The range of the lower shadow i.e (Open-low)/open is about 1.4%. For the upper shadow, i.e (High-Close)/Close it is 0.5%.
Are these ranges acceptable? What ranges are acceptable for a Marabuzo
Regards,
Kiran Hegde
1) I\’d avoid since the SL is deeper and my capital does not permit me to take such risks unless the reward is at least 2 or 3x
2) 1.4% is a little too much for a marubuzo 🙂
My understanding is that on 19th August 2020, Future Retail formed a bullish Marabuzo. Is my understanding correct?
Also is it necessary to have significant volumes with a Marabuzo?
Thanks,
Kiran Hegde
That\’s right. Higher the volumes, better. Which seems to be the case with Future Retail.
For candlestick analysis how much time is ideal. I mean whether to check chart in 15 min or 30 min candle chart ?
If you are looking at intraday, 15 min is good enough.
How do we calculate the range % of a Marubuzo candle. How do we know a Marubuzo candle range is below 1% and above 10%.
Take the difference between the open and close and divide this over the avg of open and low, you will get the range.
yours articles are extremely usefull for understanding basics of charts. Thanks sir
Happy reading, Nilesh!
can we consider the range of daily candles for intraday trade (15 min) because last 1-2 candles in 15 min are mostly flat?
Yes, you can. See how this fits into the overall scheme of things wrt to your trading.
thankyou so much sir
sir,while analysing 15 min candles for intraday trade,then volume should be average of 10 days or average of 10 candles?
Last 10 candles.
Is there a platform that can give me a list of all stocks that appear to be making a Maribozu today say at 3:20 pm?
No, but in chartIQ there is an indicator called Candlestick pattern, you may want to check that. Check this – https://zerodha.com/varsity/chapter/the-central-pivot-range/
Can a Marubozu (bullish or bearish) appear in any trend (uptrend or downtrend) and at any position (top or bottom)?
In the Candlesticks we have studied in further lessons trend was important but it appears that is not the case with Marubozu. In the Asian Pain chart linked above a bullish Marubozu appear in a downtrend.
https://zerodha.com/varsity/wp-content/uploads/2014/09/M2-Ch5-Chart3.jpg
Thats right, in fact, this is the only pattern which does not require a prior trend.
HELLO SIR
how much risk of approximation (in %)should be taken while drawing S&R?
and how to decide which S&R line should be taken while taking trade,In case there are more S&R lines?
thankyou
In and around 1% should be ok.
hello sir
thankyou for the reply
sir, i am unable to draw S&R properly?
Which part are you getting stuck with, Himanshu?
hello sir
how to calculate the range of the candle? is it (close-open/previous days\’ close)?
Range = difference between open and close divided by avg traded price of the stock.
There are thousands of stocks listed so how should i scan or look which stock has formed Marubozu pattern? Do i need to stick to only few stocks for my trading which are good for liquidating ? how should we select stocks for trading purpose?
Yes, please shrink the tracking universe and stick to just a few stocks. Like Nifty 50.
Since I\’m not able to sign in using my WordPress account (the system says the username does not exist, for some reason), I\’m typing my reply here for the question:
Q.) How long does a risk averse trader need to wait (at the start of the day) before he/she can decide that it’s going to be a bullish/bearish day?
A.) Usually by the close of market this can be figured
I\’ll clarify the background of my question. (Please do correct me wherever I\’m off.) A risk taker searches for a Marubozu 15 minutes before the market closes, whereas, a risk averse trader buys the stock the next day, and if the next days starts out at a loss, then the risk averse trader will obviously not buy it., and likewise for the opposite. So, my question is, how long should this risk averse trader wait before deciding that the stock is going to be bullish/bearish?
The risk-averse guy acts the next day at closing. This is the case where the pattern has occurred, but the risk averse guy is just waiting to ensure the pattern is behaving the way its expected to.
Since Marubozu candlesticks are very rare to find on any given day, can any one bullish candle be considered a Marubozu if:
(i) If open = low and there is a tiny upper shadow implying high > close?
(ii) If there is a very tiny lower and upper shadow?
The same doubt for bearish (with opposite conditions), as well.
Yes, as long as it is tiny and does not look significantly large wrt to the real body.
Hey Karthik,
In the trade trap, you said that one should avoid trading on long candles (above 10% range). But Marubozu candles are almost 100% of the range. Aren\’t these two contradictory?
Can you add more context to what you mean by 100% of the range for marubuzo? What I mean is that if the day turns out that the stock moved 10% or more, then be careful as the SL can be deep if you are acting based on these candles.
Thanks a lot for listing out all of the different candlestick patterns, Karthik. It\’s amazing all of this is for free.
My questions:
1. How long does a risk averse trader need to wait (at the start of the day) before he/she can decide that it\’s going to be a bullish/bearish day?
2. \”The problem with lengthy candles would be the placement of stoploss. The stoploss would be deep and in case the trade goes wrong the penalty to pay would be painful.\” – When you say, \’…in case the trade goes wrong…\’, are you referring to a situation wherein the opening price is lower than the low price/stop-loss price?
I\’ll have to test this pattern out (on Monday) before I move ahead with the next one. Thanks again.
1) Usually by the close of market this can be figured
2) No, this is a generalisation. Trading going wrong refers to the price going in the opposite direction to your trade.
Good luck!
Dear Karthik,
I can see your replies are here from 2014. Thank you, for your 6 years of active teaching. I am happy to be here although it is better late then never.
Two confusion arrived while reading this chapter, I am sure it might have been asked somewhere in this ocean of questions and answers. Say, you arrived with decision that this is Marubozu day at 3.20 PM.
1. While bullish Marubozu day you suggested buy stocks(of course CNC order in general what I understood) so do you also suggest for BTST because we are not certain about day after tomorrow?
2. While bearish Marubozu I cannot place sell order with CNC(as i do not belong them) so sell has to be MIS, but with in 10 minutes it will be squared off. So what is the point of this selling?
1) The idea is to stay invested in the stock as long as the target or SL is not breached.
2) You will have to short this via futures.
Hi Kartik,
Excellent work by you.
But there is a query.
I have a query regarding bearish marubozu.
Suppose I see a bearish marubozu forming of XYZ company and i want to go short on that stock.
As you said, if I want to be a risk taker, I would short the stock around closing price of the day. But how can I short the stock which I don\’t hold and earn by buying it at a lower price because shorted stock has to be squared off on the same day?
You can do this by shorting the futures contract in the derivative segment and carry forward the position overnight.
Appreciate your prompt reply Karthik.
Another query- Whether i can short equity in future with single qty. I am new learner in trading and i don\’t want to take bigger risk with lot qty.
Thanks in advance.
No, all future and option contracts have to be traded in pre decided quantity called the lot size. So you can trade only in the multiple of lot sizes. For example, Nifty has a lot size of 75 units, so you trade in multiples of 75.
Hi Kartihk,
To calculate difference of lower shadow i use farmula : low-open/open
but sometimes lower value is less than opening value so net value comes in negative. Should i use farmula as open-low/low in that case.
Thank you so much for giving us amazing learning platform.
You can take the absolute difference Rajnish. Ignore the -ve sign.
Apologies for spamming. my point #3 getting added in comment.
No issues 🙂
Some issue in comment, I\’m not getting the numbers correctly.
1 ) Top wick < 0.2%
(high – close)/close < 0.2
2). Bottom wick < 0.2
(open – low)/open 1%
(close – open)/open > 1%
4) Candle body < 10%
(close – open)/open < 10%
Copy paste error, adding again
1). top wick < 0.2%
(high – close) / close < 0.2
2). Bottom wick < 0.2%
(open – low) / open 1%
4).Candle body < 10%
(close – open)/open < 10%
No issues, but want to know which pattern you have on mind for this. Works if this is wrt a Marubuzo.
Hi Karthik,
Please correct if my understanding is wrong. I\’m trying to put overall summary
1). Top wick < 0.2%
(high – close) / close < 0.2
2). Bottom wick < 0.2%
(open – low) / open 1%
(close – open)/open > 1%
4).Candle body < 10%
(close – open)/open < 10%
Jana, which pattern are you looking at?
Hi Karthik,
Is Candle of Metropolis on 23.07.20 is bullish marubuzo ? Can i initiate trade today (24.07.20) at 3.20 pm as today candle of this stock is blue with around 0.85 % growth ?
It is not very convincing given the upper shadow.
Hi Karthik,
What exactly do you mean by a Trading terminal? Do you mean the prices in Kite?
Yes, trading terminal or a platform. Like Kite.
Thanks Karthik for the quick reply.
Good luck!
It is mentioned here that in Bearish Marubuzo, one can initiate shorting. But it will be for short periods like 30 mins or anything within a day, i.e. Intraday right? How is shorting possible by initiating a trade at 3:20 pm?
You can switch to Futures for an overnight short position.
You guys are telling to buy at a higher price and sell at a lower price. I dont get it.
Not sure where you saw that. Can you please share some context? Thanks.
Hi Karthik,
Thanks for reverting quickly. The difference in close prices was for 3063(displayed) and 3045(actual). Anyways, If a trader wants to take a trade at around 3:15-20PM what would you suggest to do, so that the chart is accurate on the same day before market closes
I\’d suggest you look at the charts and prices displayed on the trading terminal.
Hi Karthik,
On 15th July 2020, I saw that at around 3:20PM, Naukri(Info Edge-BSE) had formed a Bullish Marubozu. However after the end of day the LTP was showing some different number and not close to high. Also when I saw the chart on next day(16th July) the candle of 15th July 2020 automatically had a long upper shadow thereby not following the condition of Bullish Marubozu and the same chart on in.tradingview was still showing as bullish Marubozu. Why did you think this is the case in Kite?
Thanks
This is possible with a minor difference (not grossly different). Do check this – https://tradingqna.com/t/why-does-two-charts-of-the-same-timeframe-look-different-on-the-same-platform/4715
Hello Karthik,
O- 571.95 L-570.50 C- 600.50 H – 601.8
Will this qualify as a bullish marubuzo?
Shadows are well within permissible range
I think so, it does.
Thank you for the very informative and easy to understand article.
Happy learning!
hello sir,
Can we use this candlestick pattern for intraday…
if yes!….. then what time frame should one follow
It is exactly the same way as you\’d use for EOD. No difference.
Hi,
You have told risk taker will check stock at 3.20pm and place order if everything satisfies.
1. Is this regarding intraday trading ? If so is intraday trading possible at 3.20 pm ?
2. if not intraday trading, is it similar to AMO ?
3. If my objective is to hold the stock for a longer time, is risk taker option needed ? one can place order in the morning as well right ?
Please answer these 3.
Thanks
1) No, these are for overnight positions. You can initiate a position in a derivative segment
2) You can place an AMO or buy/sell futures for overnight positions as well
3) Yes, you can
Can we have a mix of both approached of Risk taker and risk averse. Like buying on the same day when the pattern is formed and sell if the next day is not a blue/bullish candle day? Is it better approach than being either only a risk taker or risk averse?
Yup, why not. I\’m not sure if this is a better approach. You just need to ensure you know what you are dealing with 🙂
Hi Karthik, if the stock\’s candlestick pattern shown a bearish marubuzo & spinning top and prior trend is bullish can we expect the stock is going bearish for some time or trend is changing.
2) if the stock\’s candlestick pattern shown a spinning top & a doji and prior trend is bullish can we expect the stock is going bearish for some time or trend is changing.
Yes, although the prior trend is not a requirement for a marubuzo.
Doji/Spinning top – not really as these candles showcase an equal probability of a reversal and continuity.
Is it fair to say that a Marubozu isn\’t for an intraday transact?
You can trade a marubuzo on 10 or 15-minute candle. No hard with that.
When I went through the candle stick chapters, you often referred to the risk taker shorting at 3:20PM. But we can’t have an intraday open position after shorting at the EOD right. Please help me here. Thanks
You can short in the futures segment and carry forward the position.
As a beginner it is quite confusing the term \”profitable\” on bearish marubozu. I thought you will have some actual gains if you sell it near the closing price lol. Does the term \”profitable\” there means you will avoid further loses if you sell near the closing price? Correct me if I am wrong please.
Milo, if you short then you will make money if the price decreases, hence you will be profitable 🙂
Thanks for the reply. So, my plan is not a long term one. Buy stocks that can give some moderate profits in short term (few weeks). In such case, Can i make buy/sell decisions based on patterns like marubozu?
Yes, you can Shanker.
Hi Karthik
Thanks for the great explanation.
I have a doubt regarding Bearish Marubozu. Let us say i am holding some stocks and i see a bearish maribozu happening. Should i then sell my stocks at the close price?
You can trade on it, but don\’t take any long term decisions based on the technical patterns.
June 17th for Maruti Sir
As per Ragu – a bullish Marbozou is formed for the pre-open of 17th, but end of day chart doesnt qualify for a Marbozou – because of an upper shadow which is more than 1% of closing price. How do we apply rule 2 (Be flexible with patterns) here sir?
Well, if the shadow is 1% then clearly it is not a marubuzo. So there is no question of trade right?
Even if the candle is too high, can we not place an order and keep the stop loss to 10% of the share value?
Yes, as long as you are ok with a 10% SL.
Hi Karthik,
I noticed a bullish Marubozu on Maruti Suzuki limited on June 17th at the pre opening session. The day was bullish but on the next day the stock never reached the closing price of the Marubozu ( because the stock kept going higher) so I didn\’t buy it. But the next day the stock was bullish and I could have profited from it but I didn\’t. What should have I done in this case ?
In a bullish marubuzo the closing price is near the high of the day. You could have bought at the opening of the next day (assuming you are a risk-taker).
Hi Karthik,
I am confused as I read one should avoid trade when the candle is less than 1% or above 10%, is there any method to determine the range of the candle in percentage that can be used?
That true, all I\’m saying is that it also helps if you look at the general trend of the previous candles. It gives you a perspective of the volatility in the market.
Hi Kartik,
Is there any criteria/fixed parameter/formula to determine whether a visible short/long candle should be avoided ?
Or we simple go by visibly extreme short/long candles ?
You can determine this visually itself. Also, always reference this with the previous candles. For example, if the last 10 candles are normal-sized, today\’s is really long, avoid. On the other hand, if the last 10 days were really long, today\’s is also long and forms a pattern, then consider this for a trade.
Hi Kartik,
In the 1st chart of ACC, you state that the risk averse trader would also be profitable ? Given that he is buying around the closing of the 2nd day..
Is it because, although the 3rd day has a bear run, it has a high point higher than the buy (high/close) point of the second day ?
So, according to you the risk averse person has an opportunity to sell at a small profit ?
Yes, but the decision to sell depends on your SL or target price, which should be pre-planned.
You are right Amit, Fresh Short position in stock can\’t be carried over to next day. It can only be done in F&O segment. I think sir was emphasizing on shorting your open buy position (in intraday) so that no penalty is applied after the market closes.
Also don\’t forget to cancel the pending Stop Loss orders in intraday. Because if you don\’t do it before market closes the system will impose penalty on you.
Thanks for pitching in, Vaishakh 🙂
Hello sir!
I have a doubt.
In bearish marubozu, if we short at around 3:20, when would we be able to square off our position?
I think that if we sell stocks which we don\’t own and don\’t square off our position in the same trading day, a penalty is applied at us by the exchange. Isn\’t this true?
And if the above is true, doesn\’t that mean that bearish marubozu can only be applied to futures and options trading and not in stocks..
Kindly help me in understanding that.
Thank you.
You can short in the futures market and carry forward the position overnight, Amit.
Thank you Karthik!
Hello Karthik
Really thankful for Zerodha Varsity.
I\’m interested to start as a intraday trader and in process of learning.
The above examples are for the day…i.e single day candles. How can Marubozu principles be applied when tracking the stock for specific session or day? Please correct if I\’m missing something.
Regards
In this case, you need to look at say a 15-minute chart and treat it the same way as you would an EOD chart. Look for patterns and set up the trades.
hey a big thankyou for all this information !!
its written that risk taking trader would initiate short the position at 3.20pm, but then if i am not wrong shorting is allowed in intraday so how will this work out ?
also will you also update the app with all the modules ?
Tanuj, thats right. However, you can short and carry forward the position overnight with a futures position. Yes, will update the app as and when the content is ready 🙂
Open = 10026, High = 10069, Low = 10019, Close = 10069.
1. High equals close
2. The lower shadow is just 0.069% i.e., ((10026-10019/10026) * 100)
So it is a bullish marubozu, right?
Yeah, you can consider this as a bullish marubuzo.
hi sir
1.i\’m confusing about range calculated of stock is EOD or single 1 hr, 15min ,5min candle
2.i think marubozu doesn\’t have shadow so how to calculate lower and upper shadow percentage.
1) I\’m not sure if I get your query completely. But yes, the range calculation technique is the same across all time frames.
2) You don\’t need to calculate this for Marubuzo.
Hi Karthik, thank you so much for the content, lot of fun in learning.
My doubt is that, being a risk averse trader, if i am buying stocks the day after a bullish marubozu, should my stoploss be set on the low of that day or the low of the day of bullish marubozu?
The SL should be based on the low of the pattern day, this is because you are taking a trade based on the candle\’s patter (not on the next day\’s pattern), hence the price action on the pattern day matters more.
Hi
The module is written in a very simpler way for easy understanding, Thank you.
In today\’s nifty 30 min chart..i had observed a candle with following data;
Open = 10026, High = 10069, Low = 10019, Close = 10069.
Can this be taken as bearish marubozu ?
The percentage of (open-low)/(low)*100 = only 0.06%. Can i take this under exception? Or had i gone wrong in understanding this.
No, look at the OHLC, there is a massive difference, it is not a bearish Marubuzo.
Hi Kartik Sir,
Please clarify.
While trading Marubozu\’s,support and resistance should be taken into consideration for placing the stoploss?
Yes, it should be taken into consideration for better results.
Sir, in the last section you said that \”One should avoid trading during an extremely small (below 1% range) or long candle (above 10% range)\”. Can you please explain 1% or 10% of what?
This is the daily range if its too small, your SL will get triggered easily. Large candles, the SL is quite deep, in case it gets triggered, your loss will be quite deep. Hence, best to avoid.
What i meant to say is, candle following the morubozu opens gape down but closes as blue candle. Opening and closing price of this candle is within the body of morubozu.
Hmm, in that way it would have breached the low of the bullish marubuzo and hence the SL, therefore the trade is not valid.
Sir as u have said that risk aversed person will wait for the next day candle and if the same if blue he will buy. Suppose in case of bullish Marubozu, next day price opens at gape down to the previous closing and closes below the closing price of marubozu. Should it also be considered as strength and we should go for buy.
Gap down opening and the stock trends down, then there is no question of buying for risk-averse trader no?
Dear Karthik
Please correct me if am wrng.
Can we use the formula –> (Open-Close)/(Average of Open & Close) ..
And if this value lies between 1 -10% then only we can trade.
And in my previous comment i was also trying to know if am a CNC investor (Delivery) and i dont trade in future and options, what will be my stand for bearish marubozu.Should i wait for further bearish market and wait for the moment the U turn happens.
Yup, you can use that formula.
If not for F&O, then you can use this to trade. However, you can use this to time long positions. At least you know that you should be avoiding a long position.
Dear Karthik
I have two doubts after going through this chapter.
1) The difference (range) between Open and Close prices should be between 1% to 10% then only we should prepare to trade on the stock.Is it applicable only for the cases where we observe a marubozu nature or its applicabe for all patterns?
2)In case of bearish marubozu what should be the stand for Delivery investor since u have shared the options for intraday only.
Kindly share your suggestions.
1) Yes, although 10% is a very large range and best avoided because the SL will be deep
2) You can initiate a short position in futures and carry it forward.
hi sir,
Thank you for efforts to enhance our knowledge in stock market,
I have gone through all Q&A above , but still i have a doubt while considering any pattern as marubozu and many has same .
so i have taken some examples , please tell me where and what i am understanding wrong ….
For bullish bozu
case 1 – suppose we have only upper shadow i.e open=low and high >close ..now to consider this pattern as bullish bozu ,the flexibility should be ((high-close ) should be less than 1% of the range (high-low) or .2% of the range (high-low)).
case 2 – suppose we have both upper as well as lower shadow i.e open>low and high>close than to consider this as bullish bozu pattern ….the sum of upper shadow+lower shadow should be less than 1% of the range (high-low) or .2% of the range …
if above isn\’t correct than please clear it by considering all factors .
Q2. Now with concern to trade trap ,your wanna say that ,suppose today we get a bullish marubozu pattern with range(which should we consider here (high-low) or (close-open)) assume 4 ,now assume previous day range was 500…..now therefore today\’s range (4) is less than 1% of 500 i.e 5,so we\’ll consider this small candle and similarly 10% for long candle.
1) It should be within 0.2% of the range i.e close – open
2) Same as 1
The range cannot be 500 right? 500 is the stock price.
Couple of doubts I have
1. If I am a risk-taker and I am trading in a bullish market, how would I know when to sell the stock before it hit a red candle day?
2. If I am a risk-averse and I decide to wait until the closing of second day to be doubly sure that market is bullish after o observed bullish marubozu on the first day, why can\’t I place the stop loss equal to opening of the second day rather then opening of the first day bullish marubozu?
3. In the ACC Limited example in bullish marubozu how does risk-taker and risk-averse both are profited? Because the risk-averse would wait until the closing of next day to be sure to buy stock and the very next day after that in the chart shows a red candle day, so I didn\’t understand how risk averse would profit.
1) You will have to set up your SL based on the candle. Usually, for me at least, any decision to exit the position based on other criteria turns out bad.
2) Because your trade is based on the price action, which is manifested as a Marubuzo. Hence SL too should be based on this
3) But the SL has not triggered, right?
Hi Sir,
1. What should be the volume, if trading on risk averse day? Is below 10D MA volume ok?
2. Also, what percentage of shadows are acceptabe for a Marubozu pattern?
1) Higher the better
2) Upto 0.2%
Thanks for the quick reply.. 🙂
Is there an explanation on how to fix targets in day trading. I cannot find it. Pls help
Thanks
Request you to read through the chapter on S&R, check this – https://zerodha.com/varsity/chapter/support-resistance/
sir scenario is suppose T1 day is bearish day with volume 1.7 m so volume bar showed in volume chart is in red color , on T2 day its again bearish with 1.73 m volume , so volume bar showed in green color in volume chart as you said above , but what i am observing in one of the chart that on T3 day its again bearish with 1.54 m volume and still its showing green color bar in the volume chart . It should show red color bar as the volume is less as compare to T2 day and moreover its a bearish day again.
Hey Amandeep, now I get your query. The bar colour depends on the closing price. If Today\’s close is greater than the previous day, vol candle is green. Red otherwise.
Hello sir,
thank you for the wonderful modules.
sir, what is the logic behind not trading with long candles(marubozu)?
Long candles = higher volatility = deeper stoploss. If the trade goes wrong then the capital will take a big hit.
Hi sir,
1. what does it show if in a volume chart suppose the day is bullish but its volume is being showed by red candle at the end of the day or vice versa …it should be green for bullish day.
That means to say that the day\’s volume is lower compared to the previous day\’s volume.
Under the Bullish and Bearish Marubozu, what should be the ideal deviation (in percentage terms) for the candle to be qualified as a Marubozu?
Like under the bullish one, you have accepted a deviation of 0.17%. What is the limit of deviation for this purpose?
When you say deviation, are you looking at the upper and lower shadow? If yes, then stick to the 0.15-0.2% range.
Short position cannot be carried away overnight in the spot market.Then if a risk taker sell a stock at 3:20 p.m,when would he buy in Bearish Marubozu?
In the futures and options market, Arijit 🙂
Thank you for such a wonderful content. I have a query
Can I use the candlestick pattern for trading options as well? If I see a marubozu and initiate an option trade and market moves for next 4-5 days, how will theta affect my profitability? Thanks.
Yes, you can look at CS pattern and initiate trades based on that. This is how it is done. Theta will affect the premium, just like any other option position.
Hey Karthik, I\’m about to start making videos on Financial Education. I find Zerodha varsity\’s content very insightful and easy to understand. Would it be fine if I use content from Zerodha for these educational videos.
Yes, you can. But please do give credits and links to Zerodha Varsity as well 🙂
Sorry, got a bit confused there, if I short a stock, so I need to buy it by the end of the day. Now since I have bought the stocks, the next day I will have those stocks in my holdings, but given the bearish sentiment, those stock could fall further. So, should I sell those stocks the next day?
Ah no, if you bought back the sold stocks than you\’ve netted off your position and have no open position in the market. Hence nothing to worry 🙂
Hey Karthik, let\’s say I sell a stock after a bearish marubozu, now I have to buy back the stock at the end of the day. Now the stock could still have the bearish sentiment, so do I short those stocks first thing in the morning? Because if I still keep those stocks that will then further book a loss.
Yes, you can initiate another short or continue to hold your short position overnight. However, if you want to carry a short position overnight, then you will have to do so in the futures market.
Nice explanation karthik….one request if possible add day/night option on varsity for betterment of reading.
That option is available in Varsity app, Hemant.
As i understand, concept of Bullish and bearish Maribouzou, is to predict the pattern with certain probability. However, to leverage this concept in an intraday, it is difficult to keep track to identify when the pattern has formed, as you might have to follow many stocks and on a 15 minute basis. Given this concept has been there for many such decades, does Zerodha provide any alert mechanism as and when such opportunistic patterns are formed in any liquid stock or stock from an individual\’s market watch?
Not as of now, but hopefully soon 🙂
Currently, we do not have such features, we will surely look into your feedback. Thank you 🙂
Lets say a stock formed a candle without any shadow with 2% increases in any day.
Someday, it formed a candle without any shadow with 3% increases in any day.
Someday, it formed a candle without any shadow with 4% increases in any day.
Someday, it formed a candle without any shadow with 5% increases in any day.
Is it making maruboju in all these days?
Yes, as long as the open and high conditions are satisfied and the absence of shadow, it is a marubuzo.
Hi
Can I predict next candle looking at available candle? Ex. If Today\’s candle is bearish , can I predict nature of tomorrow\’s candle (Bearish / Bullish)?
The whole affair with candles is just that 🙂
Thanks Karthik for giving such invaluable information in such a great manner.
I had a question, what should i do if my target/stop loss hits on T1 or T2, should i exit or should i wait to first get delivery in my Demat. I am trading nifty 50 stocks only.
If the stock is allowed for BTST, then you can exit on T1. Else, you have to take delivery and then exit 🙂
Thanks Karthik for the reply. Need to understand Shorting concepts then…
Is Shorting something similar to Intraday trading? Also, in all the examples that is covered in Single Candlestick concepts talks about Shorting trades?
Yes, Rohit, you need to understand how shorting works. Not sure if I shared this link earlier, if not do check this – https://zerodha.com/varsity/chapter/shorting/
Hello,
I have two questions around Bearish Marubozu:
1) I am not able to understand how one makes a profit during the Bearish Marubozu.
2) Why do we set the Stop Loss as the Open Price of the Marubozu? Because in this case, we will be having a stop-loss price more than the price we will be buying the shares.
1) You can profit by shorting the stock, check this – https://zerodha.com/varsity/chapter/shorting/
2) Yes, when you short you want the price to go down to be profitable, an increase in price will cause a loss.
Hello sir,
As per your answer to my comment above.
By looking at bearish candle pattern of L&T in equity segment we can initiate short position in derivative segment. In this case how to decide stop loss and target in derivative segment as we will be referring graph in equity segment?
Thank you
Yes, you can use futures only to trade the price, the analysis can be on the underlying.
Hi Karthik,
I have a doubt regarding the length of the shadow in a marubozu candlestick. With regard to the flexibility point what amount of flexibility should be considered as fine to consider a candle as a marubozu. Secondly, while determining the prior trend what is the time period one should look at in case of a swing trader.
Thank You.
1) This is explained in the chapter itself
2) At least 7-10 trading session.
Wow, can we carry forward the short position. That\’s amazing to hear, I was not aware.
Karthik please can you tell, how to do that. From what I read, shorting is only for intra day and intraday positions auto square off at 3:20 everyday.
I do not understand how risk taker can do the below mentioned on bearish marubozu.
\”The risk taker can initiate a short trade on the same day around the closing. Of course, he has to make sure that the candle is forming a bearish marubozu. To do this at 3:20PM the trader has to confirm if the open is approximately equal to the high and the current market price is equal to the low price. If the condition is validated, then it is a bearish marubozu and hence a short position can be initiated.\”
Please help answer.
Thanks!
Yes, you can as long as its in the derivative segment. If you short in spot market, then you will have to sq off within the day.
This was little confusing in the beginning without understanding completely about shorting. After reading shorting it became more clear. Perhaps reading shorting before this might help. Again is this whole thing only applicable for intraday and not equities that we wish to keep for few days / weeks ?
You can carry forward the short position, Mahesh and let the position ride for few days/weeks.
Hi,
Is this more applicable for derivatives and not for equity ? Also do you provide Online training ?
It is applicable to both. All training is via Varsity.
Sir can you tell me the meaning of range and it\’s formula. Pls explain it with example.
Range is the price action for the day, Aditya. For example, if a stock trades between 100 and 110, then the range for the day is 10.
Thank you for this module. I really do appreciate this and had been a great help to me.
However, I\’m quite confused with rule no.1?
Buy strength and sell on low.
What I\’m thinking in this rule is that I will be earning a loss if I sell on low.
for example, if I\’m an averse type of trader, The opening is 2.00 and the high is 2.02 while the low is 1.95 and the closing is 1.95. If i bought this stock at 2.00, why should I sell this at 1.95? This will cause me a loss of .05.
I will appreciate upon enlightening me in this matter. Thank you so much.
By selling, I mean shorting the stock, Rajiv.
In the section 5.3 you have mentioned :
around 3:20 PM one needs to check if the current market price (CMP) is approximately equal to the high price for the day,
and the opening price of the day is approximately equal to the low price the day.
If this condition is satisfied, then you know the day is forming a marubozu and therefore you can buy the stock around the closing price.
My question is :
here high price of the day means Highest price of the whole day and the opening price of the day should be the lowest price day of the
whole day.
I am getting confused here.
Can you please explain in detail.
The graph for ASIANPAINTS showed in section 5.3 is confusing me.
As per the graph, the opening price is not at the lowest price of the day.
Thanks
Deepak
Open and low are clearly the same in that chart, Deepak. What is confusing for you? Do let me and I\’ll explain.
Does the further chapters cover \” target\” in depth?
Yes, later in the module!
Hi Karthik Sir,
Thanks for your reply for my above question. I had one doubt but couldn\’t reply to your answer so posting new comment.
for example if bearish marubozu is formed for L&T in equity segment at 03.20pm on P1 then as a risk taking trader has to take short position on L&T future in derivative segment right?
Yes, you can do that.
1. When we buy at stocks at bullish marubozu when are we expected to sell and make profits?
2. If the market is in bearish marubozu we can make profits by shortening position?
3. Do averse trader in bullish marubozu buy stocks on 2 nd day opening or closing?
1) When your target hits
2) Yes
3) Near closing
Hi Sir,
I would like to thank you for this initiative of creating free source for learning.
After the formation of bearish marubozu, the risk taking trader will take short trade position on that day itself at 03.20pm.
but can the short position be carried over to next day? or for that matter for how many days it can be carried over?
Yes, as long are you are initiating the short position in the derivatives segment.
Why would we set the stop loss exactly at the low of the candle? Is there any logic to this? You should consider putting \”Why\’s\” in the content as well
The low point indicates a price at which there was a buying interest emerged. Hence, it is expected that if the price decline, it may till that point and bounce back again.Guess I\’ve explained this in the earlier chapter?
sir, can u clarify the following doubts
BPCL example:
On first day, Open = 355.4, High = 356.0, Low = 341, Close = 341.7
As u mentioned, on bearing marabozu day one should look to sell it on the closing price of marabozu. So the trade on the bearish marubozu would be to short BPCL approximately at 341.7 with a stoploss at the high point of the candle. In this case the stoploss price is 356.0.
can u explain when the price is falling, how we can keep stoploss of higher value…..??
and because of this bearish marabozu, next session is also bearish for this BPCL example and it was mentioned risk averse trader wait for next day closing to get double confirmation. but how come this will be profitable for him, as his selling price is even lower than first day.
same for CIPLA example where both risk averse and taking traders got profited.
Risk averse means does he wait for 2nd day on both bullish and bearish marabozu or for bearish day he will sell with the fear of price fall …..??
(Doesn\’t it mean risk averse trader will wait for next day for everything to get double confirmation. If so, he might have to sell it for still lower price than first bearish day right and it would have incurred more loss)
whats trade going bust, if we do something before reaching target or stoploss………..??
You are expected to short the stock here, Krishna. YOu sell first and buy it back later – https://zerodha.com/varsity/chapter/shorting/
Hi Karthik. Amazing material. just one confusion. When you say to trade on a bullish marubozu, do you mean to say it is a short trade?
Like first sell then buy? For example, if the open was at 120 and close was at 100. Then first we sell at 120 and then buy at 100 making a profit of 20? Just like you sold that mobile to your friend before even actually buying.
Ajay, bullish strategies require you to go long i.e. buy first and sell later. Otherwise for bearish strategies.
Also, which chapter covers \”engulfing Marubozu\”?
No pattern like engulfing marubozu as such.
Hi Karthik, thank you so much for these modules, they are really helpful for a beginner like me! 🙂
Could you please elaborate on \”A bullish marubozu indicates that there is so much buying interest in the stock that the market participants were willing to buy the stock at every price point during the day, so much so that the stock closed near its high point for the day\”? I\’m having trouble trying to understand what it means.
Thanks!
It just means that there is so much buying interest in that stock that the price surge non-stop, to an extent where the closing prices is at the high point of the day.
How can I take short position for longer period? Is it necessary to short in F&O if I have to go for longer duration or is it possible in equity also?
Yes. Alternatively, you can set it up via SLB, which is quite complicated at this point. Do check this – https://www1.nseindia.com/products/content/equities/slbs/slbs.htm
Hello
Kindly explain the term \”shorting opportunities\” and how the profit is calculated in this with example.
Thank you
Do check this – https://zerodha.com/varsity/chapter/shorting/
As per above article , you(Varisity) are saying to sell stock in case of Bearish marubozu , is it possible in CNC to sell the stock first and buy stock later. If not, is there another way to do so?
You can short sell this via Futures.
Why do we buy stocks on a bullish Marubozu and sell on a Bearish Marubozu?
Bullish indicates that you will be profitable when buy, hence.
Karthik, Can we put Stop loss and target sale order simultaneously ?
Yes, you can use a GTT for this. Check this – https://zerodha.com/z-connect/tradezerodha/kite/introducing-gtt-good-till-triggered-orders
While doing DCF analysis, after finding average FCF of last 5-6 years. Can we take the CAGR of last 5 year FCF and multiply it with average value to determine Future value(upto 5 year), instead of assuming growth percent ??
Its better you stick to the growth rate, its simple and easy to use and understand.
Hi Karthik,
I am beginner and I find your stuff really interesting.
On thing is not clear to me.
For bearish marubozu, you said risk taker can initiate a short trade at around 3.20pm. We short a trade in intraday trading. Then, when risk taker is going to buy a trade, because at 3.30pm market is going to close.
Yogesh, you can do this via Futures also.
Hii Karthik,
I have a doubt,
If i place Buy AMO order, then will my order be executed for LTP(i.e closing price) or will it be executed at the open price of the next day?
At the open price.
In Marubozu candlestick you mention that small upper and lower is acceptable, but if only small upper shadow is there and no lower shadow (Open=Low) or vice-versa (close=High), then also can I consider that morubozu?
Yup that too works. Always use your discretion.
Hi,
Thanks for clearing the doubts in module 1.
Loving to read. Great job.
Here, in this module introduction, it said that the technical analysis will be used mostly for intraday. In the above-given examples of this chapter insist to buy the share at the price near to the close at 3:20 PM. That means the stock is bought or sold at the end of the market at the closing price at CNC. But in the previous module, I read for an amateur BTST or ATST is not advisable. What should be my approach now?
One more doubt regarding the trade trap, avoid trading at a small or long candle. ((O-C)/C)*100 [in case of the bullish market] if this gives a percentage greater than 1% and less than 10%. then we can carry on with the trade. Am I right? Correct me if I\’m wrong.
Thanks,
Karthik
You can use TA for either intraday or for swing trade. I\’m not a big fan of BTST, hence that message 🙂
Thats right, avoid long candles because of the volatility and the deeper stops.
On the first chart of 5.5(BPCL), doesn\’t the first Blue candlestick indicate a bullish Marubozu with slight variation ??
Got it! Thanks!
Happy reading!
Suppose, for a particular stock when you look at candle graph with a 1 month timeframe, it shows that bearish Marubuzo is formed at eod yesterday. But when you take shorter time frames (1day,15 min etc…) the different pattern is observed… so it should be considered as a marubuzo or not?
If yes, can we long on that particular share?
You can consider either…but adjust your holding period accordingly…for example, it is not a great idea to look at the 1-month chart and set up an intraday trade.
Hi Karthik,
At several places you have mentioned in your articles that in case of a bearish trend for ex. bearish engulfing if one is a risk taker, he should validate the conditions at 3:20 PM and short the stock on the same day. Which means that after confirming the conditions at 3:20 PM one should short the stock. But as far as my knowledge is concerned, if I short a trade at 3:20 PM, it will square off by 3:30 as shorting can’t be done in CNC in Zerodha.
I would also like to know the time period of these candles.
Please explain.
Hi Karthik,
At several places you have mentioned in your articles that in case of a bearish trend for ex. bearish engulfing if one is a risk taker, he should validate the conditions at 3:20 PM and short the stock on the same day. Which means that after confirming the conditions at 3:30 PM one should short the stock. But as far as my knowledge is concerned, if I short a trade at 3:20 PM, it will square off by 3:30 as shorting can\’t be done in CNC in Zerodha.
I would also like to know the time period of these candles.
Please explain.
Shivam, you can do this with derivatives. You can short futures at 3:20 PM and carry it overnight.
Hello Karthik,
Could you please give me the conditions that I need to setup in Streak for a Marubuzo? If you do, please include the range, acceptable variation between the close and high prices etc in the formula.
Regards,
Ranjana
Ah, its best you talk to Streak\’support for this. They will be in a better position to help you with this.
I want to know that how is it possible to do intraday post 3.20pm and square off same day or next day?? (according to varsity module 3 chapter 5 its written that risk taker can initiate trade at 3.20pm and for risk averse the next day)
Please help me out.
You can do that with Futures, Shrawan.
Can I do short trade in delivery order?
Nope, this is not possible.
Sir can you please explain which time frame is best suitable for marubuzo candles?
please also suggest what actions need to be taken if a stock forms 2 marubuzo candles ,first bullish and after a while bearish, in 1 min time frame?
EOD is what I\’d suggest. These marubuzo\’s negate each other.
Hi Karthik,
Thanks for all the knowledge sharing!
One quick question. At few plances you mentioned that all patterns are not applicable to all stocks. Just want to know your observation on whether Marubozu pattern gives expected results for Nifty Index?
Thanks and Regards,
-Sachin
One has to keep evaluating this on a continuous basis Sachin. Very tough to say which pattern works on which security 🙂
which is the ideal chart time frame for this candlestick pattern ?
I prefer EOD data.
Let\’s say we are applying the Marubozu strategy, what should be the ideal time frame to apply this strategy and also in 5.3 Para, What is the time frame of the ACC chart?
I personally prefer applying this on EOD candle basis, Hemant. Its EOD.
What are the time frames of the charts above, are they 15 mins or 1-day charts?
Depends on the chart, most of them are EOD, unless specified.
Hi Sir,
While discussing morabozu, ACC Limited chart is discussed. It is said that risk averse trader would enter into trade after confirming the second candle is green candle. And it is also said that \”As per the ACC’s chart above, both the risk taker and the risk averse would have been profitable in their trades.\”. However if risk averse enters the trade after confirming 2nd candle how he could get profit because 3rd candle is red candle.
Please clarify this.
Thanks
Praveen
It could be red, but SL is not triggered, right? Also, eventually, as you can see, the stock has gone up without breaching the SL. Hence a profitable trade.
Hi,
I want to suggest that in the web interface, we should have the capability to hide the watchlist space if we want to see the chart on full screen. You can check this feature in emails nowadays, where we can hide it ( make it at the side and get it back when required.)
watchlist occupies nearly 30% of the screen space. The interface should be flexible to be moved by user
Thanks for the feedback, Prasad. Will pass the feedback to the tech team.
Does a trading session term represent one day ? And two how to calculate range %.
Yes, usually when we say a trading session, it implies 1 full day of trading. The range can be calculated in two ways –
1) Difference between high low
2) Difference between open and close.
Hi,
You mentioned that a risk taker on a Bearish Marubozu will go short on the same day that he sees the trend at around 3:20pm. If he does so, he will have to buy the stock back on the same day in a matter of minutes to close out if I\’m not wrong.
Isn\’t it better to go short at the opening price during the next day and sell at EOD, assuming the stock is going to continue to fall the day after the bearish Marubozu?
Arjun, you can short using Fut & options.
I\’m currently binge reading Module 2!
much love from the Philippines!! ❤
Glad to note that, Sophie! Happy reading 🙂
\”Here is a chart which show bearish marubozu pattern which would have not worked out for the risk taker but a risk averse trader would have entirely avoided initiating the trade, thanks to rule 1.\” – Referring to chart 2 for Cipla Ltd.
How it wouldn\’t work for risk takers? Can\’t they short it the same day? Assuming that they sell it around 3:10 PM and buy it around 3:20 PM .
And risk averse traders would avoid it because the price goes up the next day? Is it?
Mohit, you can short it via futures and carry it forward overnight.
I am using streak for screening the stocks with marubozu indicator. It is only helping for live screening .
If i want screen older charts ( across multiple stocks ), i couldn\’t.
Can you suggest any tools/sites for screening old charts.
Ah, for historical data, I\’m not sure if there is a good screener. Let me check.
How can one profit on a bearish marubuzo? I mean, how can I sell that stock if I didn\’t even have that? Thanks! 🙂
Justin, you can do this by shorting the stock wherein you sell first and buy back later. More about it here – https://zerodha.com/varsity/chapter/shorting/
Hello,
I am really confused about the trade trap ranges(1% and 10%).
How exactly is this range calculated? Is it (Close – Open)/Open?
KIndly clarify.
The range can be calculated in 2 ways –
1) (High – low)/low
2) (Close – open)/open
Both techniques can be used.
Hello Karthik,
Firstly, thanks for the wonderful writeup.
I do have a fundamental question though. In this article, it\’s explained that Marubuzo pattern emerges when the Open is equal to the low and the high is equal to the close of a stock. If that\’s the case, how can we use intraday charts to trade using Marubuzo? Do you mean to say that, once a Marubuzo is identified, the next day, we make use of the 10 min, 15 min intraday charts to make trades? If yes, then what patterns do we use to make trades using the 10 mins and 15 mins charts.
Regards,
Ranjana
Yes, once the marubuzo is formed, look for the intraday opportunities to enter the market and set up a position. You can even take the position the previous day at the close.
In case of bearish marubozu, it mentions \”Keep the high of the marubozu as the stoploss\”. Can you explain this with a scenario. Since its bearish, the close will be lower than the open. How can I keep the stoploss at high.
Manoj, this is because you expect the stock price to go lower and you profit from it because you are short. Hence the high of the stock acts as the stoploss.
how is it possible that one can buy a stock on one day sell it the other day in intraday?
there are few examples listed above that says risk taker would buy the stock on the same day whereas the risk averse would wait until the pattern is fully identified and he\’ll buy after that. so my question is will the risk taker buy the stock on day 1 and will he sell it on day 2?
Yes, this is possible…risk-averse would want to wait for a confirmation of the trend.
Hi Karthik,
Shorting means selling the stock without buying or owning. My question is how do i this in kite application.
Thanks in advance.
YOu select a stock and click on sell, as easy as that 🙂
Why is it necessary to follow rule 1, i.e. Buy strength and Sell Weakness?
Also, when you talk about making profits in a bearish candle, is it a short position that you are talking about?
Why is it necessary – well, the results are best when followed, of course, you are free to experiment 🙂
Yes, I\’m talking about short positions with bearish candles.
Hi Karthik
In Bearish Marubozu >>> you mentioned \”The risk taker can initiate a short trade on the same day around the closing\”.
If I short sell around the closing price around 3:20pm, when do I buy then? Don\’t I have to buy it the same day? Can I carry forward my short sold position?
Yugal, you will have to do this with F&O.
Hi,
I\’m unable to relate to averse buyer/trader examples. Can someone please assist me?
Regards,
Pratiksha.
A risk averse trader is someone who looks for safety first, hence wants more confirmation on the trend. This guy waits till the next day to see the trend picks up and then places the order.
Hi Karthik,
Great work!!! your teachings are pretty easy to understand for a novice like me.
I have clarification why not buy both the bullish and bearish marubozhu at the opening price, why on the closing price?
At open you\’ll not know if its a bullish/bearish marubuzo right? Only around the close you will know the pattern.
Superb Explanation ! Thanks for your efforts.
I have a query : You said that if bullish Marubozu is formed yesterday, as a safe trader, I should initiate buy today instead of yesterday- provided, today is blue/green candle day i.e. bullish day. But how can i identify that today will be bullish? Also, what if today stock opens slightly below the closing price of yesterday? Will it be still a buy? Or should I initiate buy only above yesterdays closing price?
Thanks in advance !
You can identify by looking at the price action at around 3:20 PM….I mean you will have to look at the entire day\’s OHLC. In and around the previous day\’s close is what you need to target.
Mr Karthik
i,m a beginner and it is great learning through varsity.
can u clarify on finding the range of candle< 10%
(is it( open – close)/open for bullish Marubozu) which should be<10%
Yes, the (O-C)/C, should be less that 10%.
Bullish marubozu is confirmed on a daily chart, an I take a position to go long, what should be the target here, do i trail stop loss or is there a way to decide the target before trend reversal.
Also, when you say 5 mins or 15 mins you mean should look for a marubozu in this time interval for intraday?
The target is based on other parameters like support or resistance or could be just a % target. Really depends on your trading technique. Yes, you can trail, in fact, I\’d recommend you do that. The 5 or 15 mins are the lookback period.
In a Bearish Maribozu how do a Risk taker short sell at 3.20 PM in Kite application will the market not square of f the position at the close
Tarun, you can do this with futures.
Sir which are some books which we should read as a trader for TA?
Is this course is enough?
I think it is more than enough.
But sir please recommend me some books.
Savan, in my opinion the contents plus article here is more than enough to get started on TA. I\’d suggest you go through this and start taking small trades based on your understanding.
In this chapter sir you are advising to avoid trading on Long Candle and subduded candle. My question is \”Are u referring to Candle of the day in which we are executing trade or Previous trading day Candle??? Please make it clear.Please please
It is usually the candle based on which you intend to trade.
Hi Karthik,
You mentioned that the prior trend doesn\’t play a role in marubozu. But, if a bullish marubozu occurs after a bullish trend doesn\’t it tells us that it a strong buy?
Possible, it probably indicates a higher strength in momentum. But the prior trend is not really a necessity.
is there any specific rule that candle formation time should be 15 min or 30 min or 1 day for marubuzu?
Nope, nothing specific.
sir will you please tell me about trading catastrophe when we trade on the basis of technical analysis also please tell me that the formula for calculating the range is correct or not: (c-o)/c*100 when the stock is bull and (o-c)/c*100 when the stock is bear respectively.
You will have to stick to one convention, makes life easy that way. I\’d prefer (c-o)/c*100.
can anyone please give some more info about the stoploss price of bearish and bullish marubozu
For bearish, its at the high point and the low point for bullish pattern.
why should we set the stop loss price equal to the low of the day for a bullish marubozu can‘t we set it either below the low or above the low
Low signifies a price point at which the price has retracted. It is a reaction point, most likely to hold up if the price were to reverse. Hence that reasoning. Personally, I\’d prefer the low or slightly below the low as SL.
Sir
I am still not able to understand this line
\”One should avoid trading during an extremely small candle (below 1% range) or long candle (above 10% range)\”.
Jitu, the idea is that these candles give you a skewed risk and reward perspective with respect to other candles in the vicinity. For example there could be a series of candles with 5% range but this one candle which forms a marubuzo maybe a 20% one…so as per the candlestick pattern, it is justified to go long, but the range is high compared to the previous candles, hence, it may be a good idea to avoid.
Sir
You mentioned in trade trap that,avoid trading when length of candle is above 10% of range.
But marubozu itself almost cover complete range.
Am I misunderstanding it?
Jitu, the same holds true for Marubozu as well. Avoid trading on candles wich exhit a large intraday range. The range here is the difference between the open and close.
Hi karthik sir
In spinning top lower and upper shadows have to be equal and real body have to be small as you said.
Is there any ratio analysis in the spinning top, like in paper umbrella where shadow to body ratio is double.
or Is there any percentage range, like in marubuzo shadows where the range is 0.2-0.3%.
Thanks and regards
Ah, not really. As long as visually the shadows are tiny with respect to the real body, it should be ok.
Dear Karthik Ji
It is observed that my most of Intraday trades went against my direction which were placed based on Bullish /Bearish
marubozu / any other viz Hammer/Engulfings etc. ! (I placed AMO orders after checking stocks which formed certain pattern) why it is going wrong ? pls guide on the same as I had incurred much losses even though i placed orders purely based on Candle sticks,
for Example the stocks Indusind & ICICIBank formed bullish Marubozu on 09.10.19 hence I placed AMO BUY orders which went wrong till 10.15am, LICHHSGFIN formed Hammer on 09.10.19 for which also placed AMO buy order which too went wrong by 10.15am & Tatasteel formed Bullish Engulfing on 09.10.19 so placed AMO buy which went wrong, what will be fate of trader if all
stocks are go against his direction which were placed on candlestick patterns?
What went wrong in my trades ? is day frame patterns are not useful for Intraday? or any other mistake I did ?pls guide to avoid further losses.
Have you checked that the trade complied with the checklist that we have discussed towards the end of this module? Also, remember, TA based trades are basically trades with a higher probability of success. No guarantees as such.
In what type of trading is it possible to sell share first and buy later on?
Equity intraday and futures.
Hi Kartik Sir,
In a Bearish Stock, Why Stop loss is on the Higher side? Does it mean, If That Stoploss price is acheived, stop selling
Since you short, you expect the price needs to go down to be profitable, hence the SL price has to be higher.
I could not understand how the Risk Averse & Risk taker will be profitable in the Bearish Marubozu example given about BPCL.
The Graph is bearish for the next 2 days given that it is a short trade I could not correlate how this will be profitable even if we buy @ 341.
You\’d be a seller @ 341 with an expectation of buying ot back at a lower price.
Hi Kartik,
You said that a risk taker trader shorts the stock same day at around 3:20 pm, when a bearish marubozu is formed. He doesn\’t wait for next day for the bearish sentiments confirmation.
My question is
1. Is it possible to do so for an intra-day short seller to sell today and buy tomorrow?
Or
2. Is it possible in only futures and options short selling.
1) You will have to carry the position forward, which means you\’ll have to have an NRML position
2) That\’s right
hi sir,
I want to ask you if bullish marubozu candle forms at resistance area .
then what could we analyse from that pattern.
Then you can buy with an expectation that the stock/index will breakout.
thanks for the reply. May also know data pulling to our analysis. e.g. if I want 15 mins O, H, L, C data.
I have check most of website including NSE INDIA which gives current whole day data not a particular session. If want to know 15 Mins O H L C of all the stock of NIFTY where can I get.
You will have to subscribe to the data from a data vendor, Sagar. There are many vendors out there, suggest you ask around and sign up with one.
Hi Karthik Rangappa sir,
I loved your wonderful explanation made in these whole module. They are just mind blowing when I implemented in my trading activity I got more (+)ve answer than (-)ve. Also requested to explain the candle images in more best way which will help freshers like.
I felt reading the trader mind is more important, is there any module which can suit my requirement.
Sagar, I\’m glad you liked this module. The whole of TA is in a sense reading into the trader\’s mindset, which as you realise manifests into price action.
Hi karthik,
I would like to understand the logic behind this Candlestick. On what basis it is stated that shaven candlestick would lead to the gradual uptrend ? It it just an assumption or is their any historical success records of this statement?
The whole of TA is based on empirical evidence. It has happened in the past, so therefore if the same thing, under the same circumstances were to pan out again, we can expect similar outcome.
Sorry to interrupt you again but you mean to say after 4 pm analyze the complete data of that whole day and make strategies for next day ?
And we do some trade on a trading hours based on candlesticks pattern it means that I\’m a risk taker investor ?
This is one way of setting up the trade, Rajesh. Once you get comfortable, you can move to set up intraday trades.
if a one day chart have filed with lots of bullish and bearish marubozu so what we can do, and i am sorry to asking this that can we applied this marubozu rules in commoditys like gold, silver and crude
Look at it from an EOD perspective, Rajesh.
Hello, in this study, you have considered the example of ACC trade and mentioned the percentage formula with respect to the high 1032.20. so can you pls confirm the formula for bullish marobozu ? Is it
(high – close )/ close or (high- close)/ high ? Kindly clarify .
Dipika, if the agenda is to find out the upper shadow range, then it is (high-close)/close.
Hi Karthik,
Brilliant content. I had a question regarding when do traders actually sell their stock during Bullish Marubozu in order to book profits? Assuming a trader buys a stock at 3:20 PM, a risk taking trader has entire day the next day of Marubozu and 10 mins of Marubozu day to sell the stock and book profits, is that correct? What about risk averse trader, does he only have 10 mins of the next day of Marubozu day to sell the stock?
Thank you,
The profit booking depends on several factors, for instance it could depend on the immediate resistance or it could the occurrence of another CS pattern.
sir in a full screen chart in laptop ideally how many candles should for 15 min chart , i am asking this because if we zoom in and zoom out some paterns are hard to find like hammer and maruzubo some confusion is always arising .so ideally can you say the zooming range or no of candles to fit in screen
I\’ve never actually checked that, Rohit. Ideally this should not be a problem.
sir the candlestick is like this open=254.65 HIGH = 255.95 LOW = 254.20 CLOSE =255.85 CAN THIS BE CALLED A BULLISH MARUBUZO . THE SHADOWS ARE WITH IN 0.2% RANGE ONLY BUT IN THE 15 MIN CHART I CAN CLEARLY SEE THE LOWER SHADOW WHICH LOOKS LIKE IT CAN NOT BE NEGLECTED.SO CAN WE CALL IT AS BULLISH MARUBUZO
The range itself is quite small, Rohit. So I\’m afraid this cannot be called a bullish Marubuzo.
Also how to trade gaps up/down effectively?
How can we measure length of the candle say in % terms,is there any tool?
You can look at the previous day\’s close and today\’s open to check the %. I personally don\’t find any great advantage with gaps, except for the fact that it indicates an exaggerated bullish or bearishness.
Hello Sir,
If you see today\’s chart of Future Retail at 9:30am candle in 1min or 30min time frame,it was really long? Is that Marabazu and how to trade these candles?
Also how to trade gaps up/down effectively?
Yup, that is. I\’d go long with the low of the candle as the stoploss.
Hi Karthik,
I\’m totally new to this field and would like to thank you so much for your efforts in making it easier and understandable. I\’ve doubt which might be silly but I\’m stuck with it. If trader prefers intraday 15 min chart, how can he look at the chart at 3:20 PM to see if the Marubozu is formed; should it be changed to a daily chart he is looking at? Please clarify. Thank you.
Rajesh, if you are looking at 15mins chart, then you should look at only these and take a call. Remember, these are intraday, which means you close the position at the EOD and won\’t be rolling over for the next day.
If I opt to short or sell some stock in MIS at 3.20pm after seeing the candlestick form, won\’t I be needing to square off or buy it back before 3.30 pm manually ? I didn\’t understand this concept …How can complete Buy and sell or sell and buy after 3.20 pm?
MIS is an intraday product, Manoj. POsitions have to be squared off by 3:20 PM. If you wish to carry the position overnight, then you will have to initiate the position under NRML product type.
The analysis taken here,can you tell me the time frame taken for intraday and which patterns are applicable
Most of the charts are EOD charts. If they are intraday, I\’ve mentioned the same.
Sir, Is good to always buy or sell at the close of a candlestick?
I\’d prefer that way, Edmond. But this really depends on your risk appetite. If your risk appetite is on the higher side, then you may as well take the trade earlier and not wait till the close.
please ignore
i think the textbook formula for bearish Marubozu written in this article (Open = Low, and High = Close.) is wrong.
the correct one should be (Open = High, and Low = Close) please correct me if i am wrong.
In the previous chapters you\’re explaining about t+1 and t+2.
Now how can I buy and sale within 1 or days?
To buy today and sell tomorrow, its called BTST trades. Check this – https://zerodha.com/z-connect/queries/stock-and-fo-queries/btstatst-buyacquire-today-sell-tomorrow
I am new to trading.. Could you please tell me what is the time period for shorting trade for non-intraday trader.
Ravi, you cannot short overnight in the spot market, but you can with futures. When you short futures, you can hold the position till the day of the expiry of the contract.
First of All I would appreciate the great work you have done in explaining.
I would like to understand if this is a bearish Marubozu or not.
O=1758.95 H=1758.95 L=1685.25 C=1706.30
(1706.30-1685.25/1685.25)= if the percentage is greater than 1 is it a bearish Marubozu or it is other wise.
PLease correct me if I am wrong in calculating the percentage
Hmm…not really, Kunal.
How risk averse trader buy and sell the trade when marubuzo bullish is being formed ?
Have discussed the same in the chapter itself.
Buy strength and sell weakness.
Buying strength – We buy share when the bullish marubuzo is formed. We keep the stop loss near to low of previous trade because most probably the trade will not go down below it . But if the previous trade is too long don\’t take the risk because the penalty will be high. And that\’s how we gain much profit. In this we wait for the trade to go high.
Selling strength – We sell share when the bearish marubuzo is formed. We keep the stop loss near to high of the previous trade because most probably the trade will not go high. But if the previous trade is too long don\’t take the risk because we end up buying large stock which most probably will go down. So our main aim is to sell trade with minimum loss which is going to happen. And that\’s how we loose some money which is worth . In this we sell as soon as possible.
Correct me guys if I\’m wrong.
We keep the stop loss near to low of previous trade —-> No, we keep the SL at the low of the bullish marubuzo itself and not refer to the previous day\’s candle. The same is applicable for the bearish marubuzo itself.
The idea is to go long when you see strength (bullish candle) and short when you see weakness (bearish marubuzo).
Sir can you look into the chart and is it correctly drawn flag pole pattern in bank nifty?
Sir also guide me on volume behavior in flag pole pattern?
https://drive.google.com/file/d/1bxJZjSPeZTxx5aXXOfrV4aGcRmowcWi2/view?usp=drivesdk
Unable to see the chart, Satish. But I did look at the chart of Bank Nifty and I don\’t think there is a flag pattern on it.
How to calculate the 1% or 10 % range of a candlestick to know if its long or short?
There are two ways –
1) Take the difference between open and close and divide by either one of them
2) Take the difference between high and low and divide by either one of them
Both options gives you a sense of range. I prefer the first method.
hi sir,
all the observation in the cadlestick chart are mostly based on one days candle that will be helpful for those who are doing swing or positional trading can these all concepts be applied to 5 min or 15 min charts as it for intraday trading
Yes, Anmol. Candlestick pattern can be applied to any asset, any time frame.
Hey Karthik Rangappa,
My name is Aryan, I have a query in Marubozu trend that the trend of the Marubozu follows both reversal and continuation?
meaning if the market is going up in the upper trend and we saw bullish Marubozu in the trend then does that mean the trend is in continuation and similarly, I saw the trend is going up and saw that it is bearish Marubozu then does that mean trend reversal?
or we don\’t have a concept like reversal or continuation in Marubozu chart patterns?
Marubuzo does not really convey a continuation or reversal. The candle itself is considered the origination of a new trend. This is the reason why don\’t really consider prior trend for marubuzo.
So Karthik how to backtest the marubozu trend can you please explain this also and thank you earlier answer.
Aryan, backtesting can be a bit tricky. You can do this on excel, but it is a cumbersome affair. Will try and share a note on this.
Hey Karthik what time frame you prefer for bullish/bearish marubozu for intraday traders?
Sir if it is a bearish marubuza before day, how can I short sell because it is an intraday trading I should buy at end at low price and it continues to bearish trend
You can short these using futures contract.
Say for example, I buy a stock for 180 rs and the stop loss I have given as 176. If the next day, stock goes down to 175 or less. What will happen?
The SL order that you place is valid just for the day, you will have to place the SL order again t\’row.
Hi Karthik,
I have a question,
If i am buying a stock for 100 rs and want to have a stop loss at 95, Do I need to place 2 orders? ( one order for buying and the other order for Stop loss?) or can it be done in 1 order?
Also, i am not sure what option to choose- SL or SL-M. Can you please educate me on that?
Thank you.
Anuraag
You can do this based on the product type. If you are using bracket order, then you can do this – https://zerodha.com/z-connect/tradezerodha/zerodha-trader-software-version/bracket-orders-trailing-stoploss-sl
Hi,
This content is really very useful .Thanks.
I trade mostly in day trading i.e. Intraday & making good profits. Could you pl your comments on following queries :
1. How can I understand difference between Correction & Downtrend. I have many times observed that as per my Indicator\’s analysis , trend is going upward direction but due to sudden Bearish candle after few bullish candles, my stop loss hits. But stock trends upward direction. Could you pl guide on this.
2. Which time slot is better for day trading (5 min , 10 min etc)
Expecting your comments .
1) Well, this is the most tricky bit when it comes to the analysis of the market. No set rules as such, but I think the only thing that helps is the market experience. You gain more of it with more time spent in the market.
2) 10 or 15 mins if you were to ask me.
Sir content is good
I have a question that the risk averse trader is having more risk than the risk taker because risk averse trader take the trade next day so the stoploss is deep is that true please clarify
Agreed, but you need to look at it from the perspective of the confirmation of the trend, it is higher than the risk taker, who initiates the trade dame day.
All the charts which are used for demonstration in the module, on which Timeframe are they based?
1min/5min…… or EOD.
Some of them are end of day, few are intraday. If its intraday, I think I have mentioned the same.
Hi, I have a query on the following:
a] One should avoid trading during an extremely small (below 1% range) or long candle (above 10% range).
Is this relevant only for Intraday/MIS or to Positional trading also?
If it\’s Yes for Positional trade, it would invalidate the Evening/Morning Star pattern?
b] Stoploss on Marubozu (Bullish/Bearish) : If the SL is 4% away from immediate S&R level, should it be abandoned?
1) All timeframes if you ask me
2) No, this is about the range not really the pattern as such
3) Well, this is dependent on the stock/situation really.
5.4 – The trade trap.
\”One should avoid trading during an extremely small (below 1% range) or long candle (above 10% range)\”
How do i find the length/Range of the candle stick ?
any specific settings to be enabled / any formula has to be applied.
You can measure the range in two ways – 1) Difference b/w open and close or 2) Difference b/w high and low. Divide this difference by either of the two. For example if Open is 100 and close is 110, the range is 10/100 = 10%.
Are the charts used, EOD charts or Intraday charts?
Most of them are EOD, unless specified.
Thank you very much for wonderful content free of cost..
Please let me know that if a Bullish or bearish Marubozu is formed in 1 day time frame does it impact next day intraday trades.
Or only 15 min time frame makes sense for intraday ignoring the Marubozu formed previous day.
Regards
Vikram
It does impact. For example, if it is a bearish Marubuzo, the expectation is that the stock price will go down…and this fact remains whichever timeframe you choose to look at.
Hi Karthik,
Many thanks for the article. Can\’t explain how useful this initiative is.
Couple of questions
1. Could you please explain how the \”shorting\” process works using Kite. If it has been explained separately, please provide the link here.
2. How do we identify these patterns using Kite? Do we have to go through each stock or is there a way to filter them?
Your effort is much appreciated!!
Girish,
1) This is quite straight forward, on the market watch, hover on the stock/futures contract you want and click on sell. Clicking on that will short the stock
2) Kite, has a charting engine on which you can check the charts, which will help you identify the patterns.
Happy reading 🙂
As explained above (in the bullish Marubozu section), we should buy strength and sell weakness.
The thing that I don\’t get is that, if we buy at a high price (strength) and sell at a relatively lower one (weakness), wouldn\’t we lose money on the trade?
Maybe I didn\’t understand it correctly.
Thanks for your consideration.
-Ranjit
The point is that you buy strength with a hope that the strength will continue and sell when there is the weakness emerges in the market. In a sense, we are betting on the continuity and not really for reversals.
Got it.
Thanks Karthik.
Good Information ! Thanks a Lot !
Sure, keep going Sharat!
Today for Bharti-Airtel, below are the Day-Candle numbers:-
High = 334.80
Open = 334.10
Low = 328.15
Close = 329.60
Can I consider this as a Bearish Marubozu and short trade tomorrow ?
The upper and lower shadows appear insignificant, maybe you can I guess.
\”The trade on the bearish marubozu would be to short BPCL approximately at 341.7 with a stoploss at the high point of the candle. In this case the stoploss price is 356.0\”
For bearish marubzu, if we supposed to enter at 341 with stop loss of 356, then when we are supposed to exit if stock is continued to drop down below 341not breaching stop loss.
You\’d have to close the position the day it hits the target. Like I have mentioned, once you initiate a trade, you stay in it, either the target is hit or SL is breached.
Sir I have a doubt regarding stop loss
As it mentioned in above bearish marubozu, stop loss is high of the bearish marubozu, my doubt is how can it be high of marubozu if the stock would go down after formation of bearish marubozu.
Did it mean, if i had stock already, now its time to initiate selling trade (or)
it means to stop initiating the trade
please give me reply sir- regards
Pranay, what in case the stock goes in the opposite direction after you initiate the short position? Where would you cut your loss? For this reason, we need to identify the SL position, not just for bearish Marubuzo, but for all trading position, based on candlestick or otherwise.
Does it applicable to intraday
Yup, applicable across all time frames.
another doubt,
How can a risk taker trader make a profit by selling at 3:20 PM if he identifies a Bearish Morubozu that day? (as you gave an example of risk-taking trader sells a day before the confirmation of the bearish trend the next day) Doesn\’t he have to square off his position at the end of the day?
He will have to initiate the short in the futures market, not in the spot market.
Oh! Thank you.
Welcome!
Hello Karthik,
extremely helpful lesson.
However, I have two doubts.
1. Why do you suggest stop loss at the opening price in case of a Marubozu Bullish candle? Why not below or above that?
2. What is the complicacy of trading in an extremely long Marubozu, if we place our stop loss at the middle of the candle, not at the opening price in case of a bullish Marubozu?
Ritesh, if its above then it can be any price right? By the way, the trade is initiated because of the pattern (price action), so it makes sense to keep the position open as long as the pattern is valid.
Placing an SL at the midpoint does not sound too intuitive. Frankly, you will have to sort of backtest this to figure out the profitability.
Hi Karthik,
Could you please explain one more time what should be exit point in bullish Marubozu pattern ?
Thanks.
Ojas, the candlestick patterns does not really give you an exit strategy. It gives you entry and SL only. However, you can use exit based on the support and resistance levels.
Dear Karthik Ji
I felt there is a little bit confusion in regular candle sticks pattern,it means ,one candle is forming red and next one is forming
green or red though there is down /uptrend respectively but If I select Heikanshi it is showing clear trend in one direction i.e.
which is avoiding many flaws to initiate trades, so can I initiate trades on \”Heikanshi Candlestick\” on any time frame? If I select Heikanshi then I no need to think of candlestick formation viz,bullish/bearish marubozu, hammer/hanging man/shooting start/engulfing etc., my view correct or not ?
I will be Awaiting for your valuable reply
I\’m not too familiar with Haikanshi, so cannot really comment. But if you are following candlesticks, then I think the color of the candle really matters.
Hi,
I have a doubt on bearish marubozu, is it possibe to book short trade on the end of the day (3:20 pm), because in precious chapter it indicates like short can done only on intraday trade, which means if i book short at end of the day i can able to buy back only on next day also i wont have that stock in my holdings, isn\’t create any issues.
You can carry forward the short position overnight if you short in the spot market.
Hi Karthik
I didn\’t follow what you have explained in \’The Trade Trap\’ section. 1% and 10% of what thing are we talking about?
I found an answer in the comment section. please correct me if i am wrong.
so if the stock price is 1000 rs, the fluctuation should be anywhere between 10-100 rs in the whole day. right?
and in another answer you have said that compare it with last 10 days range.
can you please explain this thing with an example
Yes, you can compare the range with the 10-day average range. For example, if the last 10-day range indicates that the stock on average moves 2-3% per day, then there is no point placing the SL at 1%, cause 1% will be taken out quickly.
If the range of the candle is short or too long, then the stop loss gets too tight (1%) or deep (10%). In both these cases placing SL wont be logical.
Yea got your point buddy. Thanks 🙂
Good luck, Amandeep!
Hi Karthik.
Can you please explain that what role volume plays in breaking out the support or resistance in stocks market?
I read two different aspects
1. Break outs are confirmed by high volume i.e. in case of high volume it is highly probable that prices will break out the level of resistance/support
2. The greater the volume of trading in a support and resistance zone, the stronger it is hence in case of higher volumes the probability of breaking out should be less
Amandeep, higher volumes indicate institutional role, so the breakout is considered more stable.
I have check Nifty18NOV 10600CE option 3min candle when the Bullish Marubozu is form after that market goes down because there is red candle after that and it form anywhere in whole time schedule.
Shreyas, you should not apply candlestick on option charts. Apply it on the underlying instead.
Can we use this in Index option trading? and I am little bit confuse about percentage on which we need to buy or sell (0.2 or 0.3).
Yes, you certainly can use this for trading options as well. You can take any values between 0.2 and 0.3.
What does Bullish Marubozu followed by Bearish Marubozu indicates? For example in Yes Bank, Bullish Marabozu was formed on 11-Nov-2018 (Open = 214 ; High = 229.4; Close= 227.9 and Low- 213.2).. This has been followed by Bearish Marubozu on 13th Nov 2018 (Open= 230; Close= 223.05,High = 230.85;Low= 221.1). [Unable to upload the chart]
Well, clearly the markets are undecided with volatility kicking in. Suggest you avoid taking directional bets on this stock.
How can we determine the future price of the stock using candlestick patterns?
Candlestick pattern only helps in estimating the probability of an outcome. No guarantees.
Sir, is Marubozu only for intraday trading or can it also be used for medium/long term?
The article only talks about buying on a bullish day. When exactly does one exit after buying a marubozu? Suppose I buy at 3.20 on a bullish day, do I have to sell it on the same day or can I sell it the next day also?
It can be used across any time frame and any asset.
Dear karthik,
Can we do positional trades based on these candle stick patterns or are they only for intra day trading?Do the stop loss rules apply for positional trading too?
Yes, of course you can. Remember, CS patterns are applicable for all assets, all timeframes.
Hello Karthik,
I am a bit confused about using SL while buying and SL while selling.
What happens when
1) I buy a share with StopLoss ??
2) I sell a share with StopLoss??
As I understood, while selling a stock, if I use SL with trigger price, then i am making sure to book minimum loss. Is it correct??
But about using SL while buying a stock/share is not clear yet…
Comments pls
1) The SL when you buy should be placed below your buying price. For example, you buy/long at 107, SL should be 107 or lower.
2) The SL when you sell should be placed above your selling price. For example, you sell/short at 107, SL should be 107 or above.
Is this what you are looking for?
Please explain this~
The risk averse trader would buy the stock on the next day i.e the day after the pattern has been formed. However before buying the trader needs to ensure that the day is a bullish day to comply with the rule number 1. This means the risk averse buyer can buy the stock only around the close of the day. The disadvantage of buying the next day is that the buy price is way above the suggested buy price, and therefore the stoploss is quite deep. However as a trade off the risk averse trader is buying only after doubly confirming that the bullishness is indeed established.
Jatin, that is the explanation 🙂
Can you please tell me which part is confusing? I\’ll be happy to explain.
You said in the end that to avoid extreme long and short candles as per the range,
But what if:
If we are risk averse traders and after Bullish Marubozu candle formation on previous day, the next day it is a blue candle day , but the range of the candle/ body of the candle is really small or long, then should we initiate the trade or avoid it?
Thank you
I would initiate the trade only if the candle is small. I\’d avoid the long range candle due to deep SL.
Good article about Marubozu Candle
Happy learning!
I didn\’t understand why the buying prize should be around closing prize and not opening price since the opening price is lower.
And also why the selling price should be around closing price and not the opening price in the bearing market.
Remember the rule – buy strength and sell weakness, this can be confirmed only by closing.
Manish, there is no guarantee that the opening price will be lower 😉
Hi,Kartik i am greatfan of yours. Want know what is EOD chart.I am a positional trader.
EOD means End of Day, this is used with reference to data points and charts. EOD chart means, the end of day charts, which is different from intraday (5 mins, 10 mins, 15 mins etc) charts.
(The sell price should be around closing price of marubozu. ) you have mention this in bearish marubozu . Lets take a example , o-355.4 ,h-356 , L- 341 , c- 341.7
Now we hear in shorting sell high buy low , is that right? If it is right then according to your mention we should sell on closing price and in price example closing price is 341.7 instead 356. I am newbie and learning lot from zerodha and i don\’t know i am wrong or right, just enlight me
Jay, you sell low in a marubuzo, with an expectation that it will go lower over the subsequent trading sessions 🙂
Hey team, i have couple of questions,
1. how can i select a stock and how can i understand the future of that stock seeing the graph.
2. from where i can get the terminal for trading (software)
1) This is in fact, the essence of Candlestick patterns, suggest you read through the entire module 😉
2) If you have a Zerodha account, you can get access to the terminal. If you don\’t have an account, I\’d suggest you look at this – https://zerodha.com/?ref=varsity
One more small doubt sir…
According to bearish morubazu we need to short the stock rite?
And we can not carry short position to next day rite?
Yes, you can. You need to use the futures contract for this.
Ohh OK. So we can\’t do this in normal equity market.
Yup.
Hello Karthik Sir,
I don\’t have much knowledge about trading(intraday) as I am used to just investing in market for long term purpose. I have some dou0
I have some doubts after reading this chapter.
1.Trading/Intraday means we have to square off over position same day before market closes right?
2. If yes, then as you mention in chapter the formation of marubazu will be concerned only near closing time. And you said risk taker will buy on same day means just before closing time of market. Then how will he make profit as in trading we can not keep stock till next day?
1) Trading = usually referred to short-term trades like hold the position for few days. Intraday = close the position same day
2) You can carry the position forward.
Thank you Karthik sir for clarifying my doubt. Till now I thought trading means only buying and selling on same day.
Good luck, Omkar!
Sure, please let me know. Thanks.
Hello Karthik
I. Have. Read. Almost. All. The. Comment regarding. Range. . but. I. Still. Don\’t. Understand. It. Could. You. Give. An example. With. Calculation?
Hope my previous reply will help you with this.
Hello Karthik,
I still. Don\’t. Get. It. Let. Us. Say. OHLC data. Is. As. Follows O=300 H=350 L=280 C=320 will. This. Result. In short. Or. Long. Candle. Please. Explain. With. Respect to. The. Range.
Where are you getting stuck?
Hello Karthik,
Appreciate you on sharing this article.
1.If bullish Marubozu formed and if I want to buy next day, then what time should I enter into that stock? in case of stock opened bullish on next day.
2.Could you please let me know how frequently do we see \”The Marubozu\” candle sticks in a month in Indian Stock market?
Thx in advance.
1) If you are highly risk-averse, then you need to buy at the end of the day. Else if you are the risk taker, then you can buy at the open. Really depends on your risk appetite.
2) There is no way one can arrive at this. You can look back in the historical charts of a stock/index you are interested in and make some conclusion. But certainly, no predictive models that I know of.
Sir,
In todays nifty chart can we say it is bearish marbuzo? Nifty looks weak in daily chart .. Its closed below 4 day MA.
Can we initiate bear call spread?
Well, this really depends on what you think will happen to the markets 🙂
Dear Sir,
In all charts time period (X-Direction) of Candle not shown but only price is shown (Y-Direction) why ?
If we get chart with time period it will be helpful to understand. What time Marubozu candle formed and more ?
if possible, Could you please update the charts ?
Please comment on this….
Thanks is small word for educating us through this VARSITY portal .
The x-axis on the chart represents time, and it is present in all the charts. I\’ll anyway, relook at the charts. Thanks.
Hello !!
Thanks for simple explanation in the tutorials.
I have a question, how to identify Marubozu bars with small bars (red or blue) before Marubozu bar ?
How to identify Marubozu bars with shadows in streak for both top and bottom of the bar ?
Thanks in advance,
Venkat
I\’m guessing you are doing this during the market, so always compare the current market price with respect to the high and low, you will get a sense of how the wicks are shaping.
Dear Sir,
I hope you might have answered this question earlier… sorry I have not gone through all comments.
my Question.
Example: open = 20, Low=19 and if around 1 o\’clock MARUBOZU stick formed in the range of 22 to 24.
we have still 2.5 hours to close the day. We can buy here or need to weight for the day to end ?
It is always advisable to wait until the closing to confirm the pattern.
Hi Karthik,
Do the lengths of both the upper and lower shadows matter or only the directional ones? Eg, the upper shadow for a bullish marubozu and the lower shadow for a bearish marubozu.
Thanks!
Yes, do pay attention to the upper/lower shadows.
During intraday trading, if I notice Marubozu candle on 5 minutes chart, can I initiate a trade?
Yes, you can.
can you provide the zerodha varstiy videos
No video content, yet.
Dear sir,
I have gone through most of the chapters in technical analysis however i have a question in mind.suppose today i use technical analysis and find that the price is right to buy and i place a cnc order.tomorrow suppose it is a good day to sell however i dont have my stocks in demat hence i cant sell them(btst is too risky).the next day i receive the stocks however the price is not right anymore.what do i do in such case?will all technical analysis go waste due to the t+2 delivery system?i have assumed i dont want to place an intraday order.
Hmm, you can always look a taking a position in Futures, Aditya.
thank you sir for the prompt response.
1)Does this mean i can buy and sell whenever i want in futures?(before the expiry date of course)
2)If I place NRML order on some future today,can i sell it tomorrow?(without facing btst risk and penalty)
3)can i convert MIS order to NRML?
4)can i convert NRML order to MIS?
5)are the above applicable for options as well?
1) Yes, you can do that
2) Yes, there is no concept of BTST in futures
3) Yes, you can convert
4) Yes, you can convert
5) Yes.
Buy strength and sell weakness
Can you please explain this point. Shouldnt we buy a stock when its market value is less, and then sell it when its value is high?.I dont understand this point.
P.s:Very good job! I have been reading and learning from quite a while now.
This is because you can ride on the momentum, Vidushi.
What is the ideal time frame for the candel stick chart to analyse marubozu strategy?
You can use this across any time frame, Gurmmet. I personally prefer to look at it on an EOD basis.
For studying Bank Nifty & Nifty pattern should I look at Nifty Future data or Nifty data
I\’d prefer spot data.
Karthik Sir,
Can to today\’s Nifty Bank\’s candle can be said
It looks like a bearish engulfing pattern, Saurabh.
Hi Sir,
I am beginner and was going through the chapter.I have some doubts .I am not able to attach screenshots here.But if i see 15min chart for Spice Jet Today(29th May) I see a bearish marubuzo and a bullish marubuzo back to back.
a)How can i go through in such situations.
This is quite possible, Kumar..especially on a 15 minutes candle. I\’d suggest you pay more importance to the latest candle.
Hi Sir,
Just want to clear few things as given below
1. I want to do intraday trading so in this single candlestick pattern , what timeframe i have to choose to do the good trading ( 1M ,5 M , 15M or 30M timeframe in chart)
2. Do we need to see any trend before Bullish marubuzo, or Bearish Marubuzo? Also if any Bullish or Bearish Marubuzo candle happen in chart at any point of time then we have to see the next candle also to exceute the trade ?
1) Candlestick patterns work well across all time frames. However, I\’d suggest you stick to at least 10M or 15M to reduce the noise component
2) No, marubuzo is the only pattern which does not require any prior trend.
Firstly, a nice article indeed. Secondly, I have a doubt that, if one comes to know of a bull/bear marubozu candle. And a risk taker, as suggested, takes a position at the EOD (3:20pm). Are you talking of long position holders or intraday square offs? Coz, at 3:20pm, the position taker has hardly got any time to square off the position. Please clarify this. Also, does that mean, marubozu candles are only for long position takers?
Thanks
Om.
You can initiate the trade in the futures segment, Om. Bullish Marubozu is for going long and the bearish one is for the shorting.
Hi Karthik
For a bearish Marubozu, the stop loss is at a higher point. Does that indicate that we should buy the stock at that point?
Yes, you have to in case the trade is going against you.
Hi, is this pattern valid only on daily or smaller time frame for intraday trading also?
Valid across all assets across all time frames.
Another question, range is calculated as a percentage of the closing price, or the opening price on the Marubozu day?
Yes.
In the given examples, a risk taker buys or sells on the same day as that of the formation of the Marubozu, at approx 3.20pm. What I cannot understand is how is he able to carry over his position to the next day since MIS orders are squared off on the same day. Can you please shed some light on this?
You can always do a futures position.
Hey I have few queries
1-If we see a Blue candlestick with no shadows or with very less variation does that mean it is a bullish marubozu or do we have to check the closing price at the end of the day (3:20 PM) which must be aprrox. equal to high of the marubozu?
2-In a bearish marubozu why is stop-loss placed above the sell price? (is it due to sentiments to make some profit before exiting )
3-what is shorting and when can it be used?
1) Yes, it is a bullish marubuzo, I\’d suggest you validate this at 3:20 or near market close
2) See my previous comment
3) Shorting is selling first and buying later, you do that when you expect prices to go lower.
Hi Karthik,
When you say one should \”exit\” at stop loss if a bullish maribozu turns bearish next day, one sells at stoploss price and exits. For a bearish maribozu, does one \”exit\” by buying at stoploss price which is going to be higher? Is exit here always meant to be sell or includes buy also as in the case of bearish maribozu turning bullish next day?
Thanks,
Sreedhar
Exit here means square off. Basically, you cut a loss-making position and get out of the markets completely.
if a bullish marubozu is formed,one has to buy as per rule but you say look for previous trend.when should one buy in downtrend or uptrend?
Marubozu is the only pattern for which the prior trend does not really matter.
5.4 – The trade trap
Earlier in this chapter we did discuss about the length of the candle. One should avoid trading during an extremely small (below 1% range) or long candle (above 10% range).
How to calculate this range?
Great content btw. Much appreciated!
You have two ways to measure the range –
1) Range = Difference between the open and close
2) Range = Difference between the high and low
I personally prefer the 1st way.
Hi karthik,
I am enjoying reading these modules. In light of recent events, when some or other event affects the price of stock drastically, is it required to follow daily news in addition to the technical analysis aspects in order to make fruitful trades?
Regards
Yes, this always helps. Following the news is important as it gives a sense of the street sentiment.
Hi,
I have a doubt in Bearish Marubozu. When the closing price was 341, i should be selling at that price rite. Why i should keep the stop loss as previous day high(356). If we set this price as trigger price the order won\’t get executed right? Am i missing some basic understanding? Please help
Since you are shorting, the trigger price (and the SL) price is higher than the price at which you short.
I have one more query. You said that once trade is initiated, the stoploss is triggered and one exits from the trade but could lose since the price can again go up. But i want to know, if one does not want a stoploss, and he has started the trade, the price goes down and again up. At what point will the shares be alloted?
I\’m a little confused with your query. SL is basically a risk management technique. You place a stop loss to protect yourself from an adverse movement in the position you\’ve taken.
Hi there,
I have two queries.
1. Can you please explain stoploss from both buyer’s and seller’s point of view?
2. You said that one should refrain trading during long candle. Does this hold true for risk averse trader as well (since he will execute the trade during the closing hour of next day? If the trade still takes place, what will be the stoploss at, the low point of long candle day or that of the next day?
1) Buyer: Buys at 75, places trigger at 72.35 and SL at 72. Seller: Sells at 75, place trigger at 77.85 and SL at 78
2) I would think so as the long candles depict higher range and not really representative of its true volatility
why would a seller place a stop loss at a price above the selling price? Wouldn\’t a seller want maximum from the sale of a stock?
A seller (I\’m assuming he is short) would make money if the stock goes down from the point he has sold which also means he will make a loss if the stock goes higher than the point at which he has sold. Hence SL needs to be higher than that.
how to choose the moving average for 15 min and 30 min from the kite , there is no time scale provided. pls help me
If you want the effective moving averages of 2 timeframes in a single chart, you can add moving averages with 2 different periods.
For example, open a 30 min chart, add MA with period 50(30 min), then add MA with period 25(15 min).
You can set different colours for the moving average lines for easy identification
Hi, great content…
I have a doubt. If you wait till 3:20 pm to ascertain that there really is a bullish marubozu, and then initiate a trade, when will you sell it for profit? The next day?
The day your target is achieved. In fact, once you get into a trade, you wait till either your target is hit or till your SL is triggered.
Hi sir, your lessons are great. please answer my query
Open – 93.95
Low – 93.55
high – 104.50
close- 103.90 is this marubozu?
Yes, it certainly is. Although, I think the presence of the small upper shadow can be ignored.
Great article on the candlestick patterns. But, I have few doubts regarding the single candlestick – Marubozu pattern.
1) Can i use this candlestick pattern for intraday on 5 min and 15 min charts?
2) Suppose i am going with the bearish marubozu pattern by selling the futures of a particular stock (where i would like to short my position by holding my stocks over 3-5 days). Can i buyback the same number of shares from the cash market instead of buying a futures of the stock to offset the position?
1) Yes, preferably 15 mins
2) You can, but why do you want to do this? This will offset your position and your P&L will be restricted.
Ok thanks, that helps. I just wanted to understand the possible ways to offset a position in futures.
Calendar spreads help to a large extent. Will be discussing the same in Module 10.
I am new to stock market and trading, but the way you explain things is super easy. I am literally amazed with the easiness of the content. The content makes me want to read more and more. Thank you so much for this awesome explanation. 🙂
Hello Karthik
I have a doubt.
One should avoid trading during an extremely small (below 1% range) or long candle (above 10% range). Can you be a bit more elaborate? What do you mean by 1% and 10% ranges?
Small and large range does not really represent regular volatility. It is more of an aberration, which I think should be avoided.
Cool..I could not understand on what is percentage range based on?.
Correct me if I am wrong
Let\’s say the stock\’s value on 02-03-2018 is Rs.1000. So on 03-03-2018 , one should avoid trading if the (high-low) on that day is either less than Rs.10 or greater than Rs.100. In other words , for that stock, one can trade on 03-03-2018 , if 10 < (high-low) <100 ?
10 represents a 1% move, which is quite normal. 100, on the other hand, is quite steep (10%). I\’d avoid trading solely on such moves.
Thanks Karthik 🙂
Cheers!
Dear Karthik,
Thanks for the wonderful article. I have a doubt. I do intraday and use BO on Zerodha. If I apply your explanation on say IDEA or SAIL with 5minute candles, a bald candle is not followed by the bullish or bearish trend as mentioned by you. Could you please throw more light to help me understand better?
Thanks in advance.
Well, candlesticks patterns only enhance your probability of success. There is no guarantee here 🙂
What to do when you initiated a short trade based on bullish marubuzo and next day there was a bounce back and a bullish harami appeared? (Just hypothetical trades)
You are not supposed to short based on bullish Marubuzo. Assuming, you meant bearish marubuzo, you get out of the trade once your SL hits. Remember, candlesticks only enhances the probability of a profitable trade.
Sorry! I meant bearish marubuzo. Thank you
Cheers!
Mr.Gentleman,
You are explaining very nice about candle stick. I read you today here. My estimate mostly gone opposite to me in Intraday trading. Though i read candlestick pattern at youtube too. why such happen ?
Manish
Becuase markets do not guarantee profits, Manish. Remember, candlesticks only enhances the probability of a profitable trade.
Hi,
I have a query here around Marubozu pattern. Assuming a good news (share specific) broke out during the first half of the day (say 12 PM) and it is indeed a very big news for the share. The share jumps 4-5% and stays there till the very end. Shouldn\’t we then just ignore the lower shadow (as a result of trading before news) in that case and consider it bullish marubozu? The close is almost equal to high. I know this variation does not match the text book definition but curious because the bullishness after the news is intact.
Regards,
Naveen Sharma
Hmm, interesting. But going with the assumption \”price discounts every known information\’, maybe this info was already out and if yes, why did the price behave the way it did before the news?
Hi Karthik,
Thanks for the reply.
Yes indeed, you have a valid point if there was some sort of insider news out already. If not then, we have to observe one or two such examples to validate it.
Thanks again.
Naveen
Yup. Good luck Naveen 🙂
Hi Karthik,
Can you help me understand how much back we should look when we say previous trend. Like just 4-5 candles or the whole 2-3 months data (assuming we are looking at daily candle). I get confused with this because sometimes the last 4-5 days are bullish or flat when the overall trend from last couple of months is bearish.
Thanks,
Naveen Sharma
This depends on your trading style. If you are looking at short-term trading, then something like 2-3 weeks or maybe 1 month is good. By short term I mean like an overnight position. If you wish to carry forward the position for few weeks, then look at at least 12 months of data.
Happy learner 🙂 . Not only article but replies are too helpful for newbie. only want to clarify that blue candle stick day means indexes are strongly blue.
It means that the day has been bullish and traders have bought the stock at every dip during the day.
Hi,
I have a question about cover order. Lets say the current price is Rs.100, i want to take short position exactly when price reaches 98.15, not above. How to do that in cover order?
Thank you
Ashok
Cover order using market order for quick order execution. You can, however, use Bracket Order and place an entry SL order, where the order will get executed only if the scrip falls to 98.15
But when i do that i am not getting 20x margin in bracket order. I need margin.
Thank you
Hi Karthik,
Thanks for the clean explanation. I got the content here. But to implement, what are the options that i should choose in kite for holding a stock for few days. And which option says its an intraday trade.
Is there any document like which you are explaining with examples, that covers different options in Buy or Sell tab and advanced options in it Eg: MIS, CNC, Day , IOC, BO, CO, AMO… etc.. It would be more helpful. Thanks in advance.
I\’d suggest you attend an online demo – we conduct two demo\’s on a daily basis, keep track of it here – https://www.youtube.com/user/zerodhaonline
In Lots of stocks, when the trend reverse , there\’s no pattern formed at all. So in that case, i feel like i miss those opportunities. For example most of the nifty 50 stocks do not form any recognized patterns at all in most of the trend revarsal cases.
Hmm, I may not agree on this. There are patterns that occur on Nifty 50, on a daily basis. You need to scan for this every day.
Most of the time, when i set the stop loss, the shadow triggers it. But the price closes above the stop loss and then the price goes up.. So is it really required to close the trade as soon as the stop loss is reached or it\’s better to wait for the closing price?
I understand, the only way to deal with this is –
1) Increase the look back period – look for higher time frames
2) Trail you SL
3) Try and take the trades on a closing basis
// Strength is represented by a bullish (blue)
candle and weakness by a bearish (red) candle. Hence whenever you are buying
ensure it is a blue candle day and whenever you are selling, ensure it’s a red candle
day.//
What do you mean by Blue Candle Day & Red Candle Day? How to ensure that as we will have many Blue and Red candled in a day chart?
I\’ve replied to the same question earlier, request you to read the thread.
Dear Karthik, Your varsity lessons are user friendly. All these days using Pi I placed buy order and sell order manually and incurred losses. After reading your TA , of late, I started using charts and gaining. Thanks for your clarifications. I have some
doubts regarding placing stop loss. Suppose I place a buy order @17 in the chart, can I put stop loss @14 after confimation? Same for sell order
Please clarify.
I know that clicking above or below LTP, a screen appears SL-. trigger
price. Is it enough to submit there?
Yes, you can place a Stoploss by right-clicking on the chart below the LTP and place a sell order. Also, if you click above the LTP, it\’ll trigger a limit sell order(Target Price)
Hi Karthik,
I have a doubt on the length of the candles.
In the trade trap, you suggested not to trade when a candle is too short (below 1% range) or too long (above 10% range)
I want to understand how do we calculate these percentages?
For example let\’s consider on any particular day for a particular stock, open price was 350 and close price was 360, and for simplicity let\’s us consider it was a bullish marubuzo.
So is it a long candle (Above 10%) or a short candle (Below 1%)?
Thanks in advance
If the stock has a range of say 0.15 – 0.25%, then I\’d consider this as a short-range candle, hence I\’d avoid trade based on these candles. Also, anything above 8% is treated likewise. No hard and fast rule here, these are numbers from my experience.
\”One should avoid trading during an extremely small (below 1% range) or long candle (above 10% range).\”
Is it means:
Range percentage = (Diff of open to close) / (Diff of high to low) *100
During the formation of Marubozu we should avoid trading. We should only do after a confirmed Marubozu.
Am I right?
There are multiple ways to calculate the range, here are few techniques
Range = (High – Low)/Close or (High – Low)/Open or (High – Low)/Avg (Open, Close).
Confirm the trade if you want to be on the conservative side.
Thanks.
One more query: Open=152.22, High=152.22, Low=151.85,Close=151.85. What is the type of this candle.
The range would be too low to classify this as a Marubuzo, hence I guess this would be a spinning top.
Karthik,
Can it not be a Doji, as open and close are very close?
Yes, you can consider it as a doji.
For a spinning top it must have shadows. So, how can you guess it as a spinning top?
You can look at the high and low of the candles, with respect to the current market price, to check if there are shadows.
This is perfect answer. Thanks.
In case of Bullish, (High-Low)/Low and in case of Bearish, (Low-High)/High are better.
In other words, our laptop or mobile show % change of the day which should not be more than 10%.
Am I right ?
Yes, that is correct. Good luck!
if on a particular day,stock has an open=320, low=320, Close=330 and High=332. Will it be a marubozu ?
Yes, I\’d consider that as a Marubuzo.
How?
You said to stick to 0.2 to 0.3 % range , but this is around 0.6%?
In one of the above comments, a person was getting same 0.6 % and you said you might not consider it a marubozu?
0.6% is on the higher side, I would not be too comfortable.
Hi Karthik,
As I have understood from the chapter and comment section:
For Marubozu the shadow size must be 0.2% to 0.3% or utmost less than 1%. For OHLC figure-162.6, 164.75,161.5,163.95 , after calculation it is found
Upper shadow=0.49% and lower shadow=0.68%. But, visually in the chart comparing to other candlesticks it is not look like a Marubozu.Pls clarify.
I\’d avoid this and not really consider this as a Marubuzo.
Thanks for your reply. So, during further study shall I stick to 0.2% to 0.3% to consider marubozu?
Yes, please.
How to continue stop loss trigger to next day in Kite and how to short a position.I dont find any options in Kite.
Hello Karthik
My doubt is with the concept of selling on a red candle day and buying on a blue candle day. I saw few queries about this concept in the above comments. But i\’m not clarified with the answers. So let me elaborate a bit and please make me clear.
1) I must buy strength and sell weakness.
2) For eg: I\’m going long today with SBIN at 308rp. Since today(19-1-18) is blue candle day. I\’m buying strength.
3) Suppose 22-1-18 also seems to be blue candle day and SBIN stock is being sold at 315rp.
4) Let us consider 24-1-18 to be red candle day. And the SBIN stock is sold at 305rp.
5) Should i sell my stock on 22-1-18 for 315rp to make a profit of 7rp or sell my stock on 24-1-18 for 305rp and make a loss of 3rp as it is said that i must sell on red candle day ?
6) Shorting on red candle day would definitely make profit given if the stock prices go down on next few days. But how would selling the shares that i bought on 19-1-18 on a red candle day make profit?
Vignesh, I understand your concern. Have you ever tried trailing your SL? If no, I think its best if you trail your SL so that you can lock in profits.
Hi Karthik,
I\’m learning a lot from your useful website. Thank you!
Please \’bear\’ with me — I don\’t understand this statement: \”A bearish marubozu indicates that there is so much selling pressure in the stock that the market participants actually sold at every price point during the day…\”
This statement might be taken to imply that two different times t1 and t2 between open and close necessarily satisfy p1>p2 for t1<t2. Is this the intended meaning?
I'm asking because I was under the impression that the bearish marubozu only meant that O=H and C=L with any number of excursions in price back and forth between these values between opening and closing times. And an 'up' excursion is therefore not excluded.
Thank you. -Mark
Mark, the selling pressure that I\’m referring to is for intraday. So through the day, the stock got sold at every price point.
what will be the time difference between each candle to analyze all these parameters?
Depends on your trading style – if you are a swing trader, something like End of day charts should be good.
Do you mean, that the risk averse trader is conforming bearish marubozu on the next day of 3.20pm?
Yes, this is if you want to play it safe.
In some charts both blue and red marubozu\’s are present, i.e multiple marubozu\’s. Which should i follow if there are multiple marubozu\’s?
Always look at the latest candle.
Are only whole day marubozu are useful? or we can consider marubozu\’s formed in 1hr, 4hr chart also? Are marubozu\’s helful in intraday trading?
You can trade based on candlestick patterns formed based on 1,4, or 5 hours candles. However, I\’m not a big fan of this. I personally prefer to look at EOD charts to build the strategies for the day.
it means u choose btst rather than intraday trades?
Sir,
If a stock made a good bullish candle on the daily candlestick charts and a Hanging Man kind of patterns on the weekly charts, what would be trade set up for that stock? Buy/Sell/Do nothing?
Many thanks
Best wishes,
Ishwari
This can be tricky and really depends on the timeframe of the trade. If it is for a day or two, pay more attention to daily patterns. If it is more than that, I;d suggest you pay attention to the weekly pattern also.
Ok, when we trade we should look for daily/weekly/monthly candle stick to better judge the direction of the script? No conflict or in line (all period candlestick pattern), the better would be success factor for that trade?
Absolutely, that is a perfect scenario.
Hi Karthik,
This type of content helps a lot for beginners like me.
Is there any place/Website where we can look for \”All the Stocks which fall under Bullish/Bearish Marubuzo\” ?
Thanks
Hmm, I\’m not sure Sateeh.
One more question….is it advisable to trade on long Marubuzo or better to avoid considering long candlestick? It yes can we place a stoploss halfway though the high price for a bearish Marubuzo instead of the high price and similarly for Bullish Marubuzo?
You can trade on Marubuzo, not an issue.
Karthik, the training modules are excellent. I feel this information to be empowering thus boosting my confidence. I have not found a more complete guide to understanding the various aspects of the stock markets and their interrelations anywhere online apart from Varsity. I have bought and sold stocks for a few years, but I realize only now that I knew nothing before!
As for the question, am I correct in assuming that the mazrubuzo candlestick is only studied for the entire days OHLC? i.e the chart has to be set in intervals of days and not any other? What if I am looking at a 15 min candlestick chart to day trade, and find a marubuzo…is it applicable?
Happy to note that you are liking the content on Varsity, Tushar!
You can set the time frame to any desired value. The candlestick patterns are still applicable. However, my personal favorite is a marubuzo formation on an EOD basis.
Can u plz tell what duration shall we keep while observing candle sticks 1 min 5 min 10 min for day trading and what other indicators shall we use to generate a buy signal
hi,
in this chapter you said One should avoid trading during an extremely small (below 1% range) or long candle (above 10% range).
can you explain how this percentage is calculated? also why should we avoid too long candles?
Long candles (say something like 6-8%) could be outside the daily volatility range. This can lure you into setting up deeper stop losses, and if the trade goes wrong, you will take a deeper hit than usual.
Hi,
Can you please open 1D chart for NHPC for 21st Dec & 22 Dec 2017.
as said in this chapter that the longer the candle, the more intense is the buying or selling activity.
but if you see chart, 21st Dec candle is very long as compared to 22nd Dec, still on 21st dec there was less volume than 22nd?
how is it possible? can you please explain?
Candlesticks only enhance the probability of the event, there are no guarantees in the market.
Thank you for amazing articles you have written here.
If I saw a bullish Marubuzo say for a 5 min chart (10:00 – 10:05) for a particular day on some stock, then :
1)Can a intraday buy call be taken on that stock?
2)What other indicator can I check to confirm the buy signal ?
3)Currently I use RSI and 5,10,20 EMA. Is it a good combination of indicators for intraday trading ?
1) Yes, you can set up an intrday trade
2) Volumes, Support, and Resistance
3) Yes, these are good combinations of RSI
Hi Karthik,
I just want to thank you for the excellent articles. And for your time, effort and patience in answering all the questions. I learn from the article and then some more from the Q-A following the article. 🙂
You are amazing!!
Regards
Roshni
Thanks for the kind words, Roshni!
Happy learning 🙂
Also Coal India 15/12/2017 H1 chart first candle 9.15 am
Yes, this is a bullish Marubuzo.
apollo tyres chart of H1 of 15/12/2017 is a perfect eg of Marubozu on up trend
Should be, I\’m yet to check the chart.
Hi, appreciate your effort for making this modules this much simple. can you explain how we use marubuzo patterns for intraday trading, i mean how the patterns forms ?
Load the 10 or 15 min charts and look for the pattern. You trade it just like the way you\’d trade EOD charts. Remember, TA pattern can be applied to all time frame.
Thank you
Cheers!
Hi Sir,
1. You have mentioned to avoid trading based on smal candes(less than 1%) ,how to calculate this?the real body length alone should be more than 1% or the length of the entire candle along with shadow?Does this applies to intraday trading also? Usually i see intraday(in 15 mins chart) candle real body to be less than 1% length only.Then in that case how to do a intraday trading?
2.If a bullish marubuzo is formed in a downtrend/bearish marubuzo in a up trend, with a low volume at support level/resistance levels respectively ,then can we enter a short trade/long trade respectivey in the same direction of the trend at that point,on confrmation of P2 beign red candle/blue candle respectively?
1) More from an EOD perspective. I measure the length of the real body excluding the shadows.
2) Yes, you can consider Marubuzo requires no prior trend.
I wanted to know what is the difference between quantitative analysis and technical analysis. Are they the same?
Quantitative Analysis requires you to look at the numbers/data from a statistical (or mathematical) perspective. For example, measuring the spread in terms of standard deviations, studying the distribution of data, or looking at stationarity of the time series. However, TA requires you to look at the stock price chart to identify price patterns.
Hi sir,
If we have missed to enter the trade on both P1 and P2 day with all the checklist confirming, can we go on the trade on the start of the every next day (say P3)? If so still for that day also do we need to check the rule \”buy strong and sell weak\”?
Yes, you certainly can after you;ve ensured that you are buying/selling on strength/weakness.
Hi Sir,
Thanks for your prompt replies.
I have doubt that after we enter a trade and if the price drops considerably without hitting stop loss (but near to stoploss) can we increase our quantity again?
You certainly can, depends on your risk-taking ability. I personally like to average on my winning trades.
I have a doubt. According to the article i should sell my security as soon as i see a bearish marubozu that too depending on my risk appetite. But my point is even it is a bearish maribozu or any of kind bearish candle. I\’m always making loss right?. Cause the price of my security has fallen. Is it possible to predict exactly when the bearish marubozu or any bearish candle will form so that i can sell it on the verge to make a maximum profit out of it?
Thank you!
No, you short with an expectation that it will go down further.
\”The disadvantage of buying the next day is that the buy price is way above the suggested buy price, and therefore the stoploss is quite deep.\”
I did not understand why the stoploss would be deep? Can\’t he put the stoploss at the next day\’s opening price to reduce it?
Btw, thanks for the awesome series on stock markets.
It means if the suggested buy price is 50, SL is 47. But you buy at 52, the SL is still at 47. So a difference of 5 from the original SL level.
Hi Karthik,
Why do I see candles with lower volume bigger than candles with high volume ?
It could be a low volume day, but the range could be large.
But, I think shadows are there to denote range for a particular time frame / candle. I am still not clear from your answer sir. Kindly explain.
Lower volumes indicate lower liquidity. Lower liquidity means higher volatility. Higher volatility means larger range within which the stock trades. Larger range indicates larger candle.
YOU CAN SAY LARGE CANDLE ONLY WHEN THERE IS LARGE REAL BODY and not by large range? am i correct?
Large real body = large range.
Hi Karthik, You are such a help for us. Just wanted to know when you say a days candle, How can i relate it to 5 minutes chart. Does it mean last candle of the day on a 5 minute chart.
Thanks Buddy
When I say, days candle, the Open if for the start of the day, low is the lowest point of the day, high is the highest point, and close is the closing price. Now shrink that day to 5 mins (or 10, 15, or 30 mins) and you have that 5 mins candle. For example a 5 mins candle between 10:05 to 10:10 AM represents the OHLC during that 5 mins.
Thanks for prompt reply Karthik.
Could you please give me a simpler example (I know you have kept it very simple though) .
This is one point holding me back and I am going into loses.
Please help.
Can you share more insights into what is causing the confusion? Maybe I can try and address that specifically.
Hello Karthik,
first of all, thanks a lot for all your contribution and replies against most of the naive questions.
I have been following all the previous modules/replies responsibly and must say your efforts are worth enough to call you a mastermind with outstanding intellect.
I have a number of questions, so please accept my apology for the long comment, in advance. I am sure most of them already been answered, however, I still have little confusion!
Regarding identifying Marubozu, I have sequence of questions
1. A candlestick without or within the identified range of (0.3%) shadow can occur anytime in a trading single day. if it occurs, then around closing time (i.e 3:20 pm) one needs to cross check the below-specified conditions for Bullish or Bearish Marubozu?
2. To ascertain one out of two Marubozu, the conditions to be cross-checked are:
2.1 If Open = High and Close = Low it\’s Bearish Marubozu?
2.2 if Open = Low and Close = High it\’s Bullish Marubozu?
3. Let\’s say one of the above two conditions (from 2.1 or 2.2) has been satisfied, next step is to check the Shadow lengths. And to calculate the shadow lengths, if i just copy what Vishal Saini had said on June 5, 2016, at 8:53 am. (which you agreed as correct) and adding your example values (O=971.8, H=1030.2, L=970.1 and C=1028.4)
In Bullish Marubuzo:
i) (high-close)/close For Upper Shadow which is [(1030.2-1028.4)/1028.4] x 100 = 0.17%, which is below <0.3% Value, hence condition satisfied.
ii) (low-open)/open For Lower Shadow which is [(970.1-971.8)/971.8] x 100 = 0.17%, which is below <0.3% Value, hence condition satisfied.
as above two criterion have been satisfied, we can call it Bullish Marubuzo and take actions according to to the type of trader we are?
And similarly, if Bearish Marubuzo seems to be forming!
iii) (low-close)/close For Lower Shadow
iv) (high-open)/open For Upper shadow
i think if above conditions are satisfied one can execute the trade and set the target and stop loss, correct me if i am wrong?
i have no understanding about Futures, F&O, swing or any other term you might have used in the replies above, i am expecting to see them in next sessions!
Once again thanks in advance.
Kushal, thanks for the kind words and encouragement. I\’m happy to note that you\’ve liked the contend so far.
1) Yes, a marubuzo can form anytime during the day – what the point is that it should sustain through the day, until closing. Hence, you need to revalidate the patter around close
2) Yes for both
3) Yes, considering the flexibility aspect – I would go ahead and consider this a Marubuzo
3.1 and 3.2) Yes, the calculation is correct
The same logic applies for bearish Marubuzo as well. Guess, you\’ve got the pattern;s identification perfectly well.
Good luck.
Thanks Karthik
Appreciate your reply??
Cheers!
The question is slightly off topic and I apologize for that in advance. After seeing a number of charts, one thing I noticed is that when there is a huge increase in volume, it suddenly increases/ decreases the price of the stock (especially in one minute chart). There is almost no change or very little change in price and suddenly the next minute, there is a huge upsurge in volume, as well as change in price. Sir can you please explain what exactly goes on there? Thank you.
Please don\’t apologize for this 🙂
This can get a bit tricky since you are watching 1-minute chart. 1-minute charts are full of noise. I\’d suggest you take a look at slightly higher time frame…at least 10-15 mins one.
Hi
My Zerodha Client Id is YG8404
On 28th Oct 2017 & 29th Oct 2017 candle stick chart stock of \’IOC\’ formed a clear Bearish Engulfing after an uptrend and today i.e. on 30/10/2017 \’IOC\’ formed a DOJI / Spinning Top (Not clear to me).
Can you please suggest a likely hood to take place tomorrow on 31/10/2017. i.e. IOC will go down or up or it will remain sideways ?
Also what pattern on 30/10/2017 IOC has formed a DOJI ? or a Spinning Top ?
Appreciate if you can answer quickly.
Many thanks in Advance
Pramod – please do not give out your client id in a public forum.
The uptrend before the bearish engulfing is not very convincing to me. The pattern on 30th is a spinning top.
To confirm that stock is in uptrend or downtrend what period of chart we need to analyze bearish / bullish engulfing pattern for one or two days trade.
Also should volume needs to be more than previous day volume on the day when bearish / bullish engulfing pattern is formed or only more than 10 days average volume is sufficient.
Please confirm which candle stick pattern in combination has higher probability say 70% to assume the trend.
For short term – I\’d suggest you look at 15 days chart. Volumes too needs to be high, especially around the pattern formation time. No candlestick pattern or indicator works on the same 2 stocks. For example, bullish engulfing along with RSI may work on SBI but may not on HDFC. The trick is to backtest and be aware of which pattern/indicator (has a better probability) works on which stock.
Many Thanks.
I have read quite a few comments appreciating you and you can also add me as your appreciator.
The article was old but you still reply to queries and doubts of people, that is a great work.
To show interest consistently is sign of a master and you truly are a master.
Hahah…thanks for the kind words, Pramod 🙂
Happy learning.
Very great tutorial!!! Very simple to understand for the beginners. Great work. Keep it up.
Sorry to point out this typo error: in some place the word \”marubozu\” is typed as \”marubUZO\”. Please check and correct it.
But I really appreciate your work and overall Zerodha is great.
Ah, I\’m aware of the name mismatch Nalla. But I\’ve taken cover under the \’pronoun\’ pretext 🙂
Happy learning!
What is the time frame(1 mins, 5 mins, 10 mins charts e.t.c) I need to consider while looking at charts for recoganisable candle stick pattern
I\’d suggest 15 mins for intraday and EOD charts for positional trades.
Thanks a lot
Thanks for versity. Is there any practical training provide for stock market from zerodha or you or anywhere? Please let me know, if yes then please email me kindly,
Everything we know is shared on Varsity and Tradingqna – https://tradingqna.com/
Thanks a lot Karthik and Zerodha for this initiative in the form of Zerodhavarsity! Though I haven\’t yet applied any of these methods and rules to an actual trade but reading these modules one by one is actually giving me a sense of direction which I was searching for so long in Technical Analysis.
I really hope I can actually start materialising this knowledge into successful trading.
Glad to hear that, Kanika!
Happy learning and all the very best 🙂
Hi Karthik,
Your tutorials are the best for beginners like me.Thanks a ton!
Please help me sort this out.
I understand that we need to buy back the shares on the same day we short.We cannot carry forward to next day.In that case,
If I short at 3:20 PM on a given day, I actually have no scope of buying back as market is almost closing.So how do I go about it.
Yes, that would be very difficult. Your only option is to look at Futures.
Dear team Zerodha,
I am learning through varsity since 1 month and want to be successful in the market. What I feel is that one cannot learn only from theory and needs a real time trading platform to learn, examine and experiment all the charts and indicators. Am I right ? I request answers for the following:-
1. Can I study all the charts and also draw different indicators by opening account with a broker like zerodha without putting money in trading account till the time i feel confident ?
2. I am a salaried person. I think the best bet for me is to trade in F&O and to become a swinger or positional. This thinking is due to time constraints during day time. Am I right ?
1) Yes, you can. When you open an account you will get access to our trading platform which also has a charting engine
2) Positional trades.
we should buy only on a blue candle day and sell on a red candle day
what does it mean will u plz explain
This is related to the \’Buy strength and sell weakness\’ rule. Suggest you take a look at that, thanks.
Hello sir,
I was going through last 3 years chart of ACC and i was looking for marubuzo pattern. now my qn is if i consider shadow relaxation upto 0.6% there are hundreds of marubuzo formed. U have said in the chapter that upto 0.2-0.3% should be considered. But in the above comments u have said to someone that upto 0.6% is good…I am really confused what to consider and what not?
Arun, 0.6% could be a mistake. Its best to stick to 0.2-0.3%.
You said
\”However the risk averse would have avoided buying the stock entirely because the next day happened to be a red candle day.\”
But question is being risk averse trader , why i should wait for the whole day before placinh order? My understanding is if yesterday it was bullish marubuzo , i will buy that stock in the morning session very next day. please explain if i am wrong.
Remember the first rule of CS? Buy strength and sell weakness? So to ensure you comply with this rule, you will have to make sure you are buying on a blue candle day, which you can figure out by EOD.
Hi karthik,
By % range for marubuzo u mean only High-Low.
Suppose High =100 & low=90, then % range=10
Am i right??
oh sorry i think range% =[(HIGH-LOW)/LOW] * 100 %
IS dis ok karthik?
Yes.
Marubuzo bearish or bullish is applied for 1 min chart , or 30 mins or 1 days
Preferably day chart.
Which charting tool is used in the screenshot coz I don\’t see this in Kite?
All of them were from Pi as Kite was not developed then.
Last line of ACC chart (Sec 5.3) says, \”both risk takers and risk averse would have been profitable in their trades.\” How ? I couldn\’t figure out.
Risk Taker will buy at 1028. Ok he can sell next day and book profit.
Risk averse will buy at the end of the next day of Marubujo. And when he try to sell the next day, i.e. second day to Marubujo, the candle stick is all red.
Kindly explain.
Thats because the trade has worked for both of them, Naveen.
naveen – you are just looking at one or two candle sticks after the pattern is formed, whereas karthik is discussing about the longer trend, if you look at the 6-7 candle stick from when the pattern is formed, it is trading higher, hence both the parties would have made money.
Thanks buddy.
Sec 5.3. Buy price 1028.4 and stoploss 970.
Question is,\”Why I would keep stoploss at such low value of 970 and not around and <1028.4, i.e. the buy price? Wouldn't that minimize the loss?
The best part about candlestick pattern is that it also suggests the SL price point, in fact, this is an integral part of CS.
Thanks.
Hi karthik sir…………….thanks for the excellent work………i am trying to practice this lesson….yesterday(6/9/17) sunpharma formed bearish Marubuzo., am i right?…….but today it is not acting like bearish continuation….so it is false indication……..will it happens sometimes?…or i am predictiong anything wrong?..pls clarify
Yes, it sort of did (except for the small lower shadow). If you are a risk averse trader, you will have to watch the close and initiate a short position, provided it forms a red candle.
Thanks for the reply sir……..i am an risk averse so i am in wait and watch mode…..
Great! Good look, Jagan.
Thanks sir…..what is meaning of consecutive Marubuzo…yesterday BPCL formed bearish Marubuzo…as an risk averse i decided to see today…but today price are fallen heavily…..as per the rule i should sell today..but will it fall further…or monday will be a gap up…how to decide?
You should have initiated a short y\’day. If not for anything, watch how the trade pans out over the next few days.
Which segment Jagan is talking about ? Futures ??
Yup.
Dear kartik sir. Can you tell suppose i have opened the site of nse india during market hours. And suppose a stock is too bearish or bullish how will i get to know upper circit has come. If upper circuit has come it means all buyers no sellers so than only bid price will be shown and no ask price. I know in equity cash trading will be stopped after circuit but how will i know that now only buyers are there and no sellers same for when there are only sellers and no buyers .And thanks in advance please clear my doubt.
Stocks in F&O has no circuits. Its hard to predict when the stock will hit the circuit.
When there is a bearish marubozu, if the stoploss is at the high point(opening price), and we sell the stock if the price goes above the stoploss, then won\’t we be selling stock whose prices are increasing?
Yes, hence you need to evaluate the risk reward ratio every time you find an opportunity to trade.
The trade on the bearish marubuzo would be to short BPCL approximately at 341.7 with a stoploss at the high point of the candle. In this case the stoploss price is 356.0. Of course at this stage we still haven’t dealt with setting targets, and we will figure that out much later in this module.
can you please explain the concept of shorting in stock market and also in context with bpcl.
Shorting simply requires you to sell first and buy back at a later point. Think of it as a regular trader where you buy and sell … but when you short, you do it the reverse way. I\’d suggest you read this – https://zerodha.com/varsity/chapter/the-stock-markets/
Is it Marubuzo or Marbozu?
Give it the benefit of a proper noun 🙂
Hi Karthik –
You mentioned \”The variation in price is not much when measured in percentage terms, for example the variation between high and close is 1.8 which as a percentage of high is just 0.17%. \” . So is this % should be between 0.2-0.3% as mentioned earlier in the Q&A by you?
Thanks,
Ash
Yes, it\’s desirable if it\’s within 0.3% range.
If we are holding a stock, then we should sell whenever recognizable pattern of \’bearish\’ is observed. I hope it is not just for \’short\’ trade.
It could be for a short trade, or if you have a long position, you could take cues and square it off.
I do not quite understand this part of the chatper.
\”Please notice, as per the text book definition of a marubozu Open = Low, and High = Close. However in reality there is a minor variation to this definition. The variation in price is not much when measured in percentage terms, for example the variation between high and close is 1.8 which as a percentage of high is just 0.17%. \”
This means that the Marubuzo formed, can have a slight upper and lower shadow. This should be ok as long the shadows are small.
1.The charts used as examples are daily charts? and this indicator has been working well what timeline chart ?
2. When you say we should overlook very small candles and very large candles for this pattern could you tell us what is very large and small in terms of percentage between open and close.
1) Yes, most of the charts are EOD
2) Something like less than 0.5% and more than 10%. Give this a try, if this does not suit your temperament, feel free to tweak this.
Hi Kartika,
Has ICICI bank formed MARUBOZU on 14th August?
Not too convincing I guess.
Earlier in this chapter we did discuss about the length of the candle. One should avoid trading during an extremely small (below 1% range) or long candle (above 10% range).
1% range or 10% range ka pata kaise chalega…?
You can calculate the range by dividing the difference between open and low and dividing that over open price.
sir,
thank you for this awesome article I have a doubt.
I understand the bullish market to make a profit Buy price= close and sl= low so next day it may be profitable.
but in the Bearish market how can some one make a profit because next day price will go down (history tends to repeat it self).
didn\’t get it.
SL is higher than buying price. how?
For this, you need to short the stock/index. Check this chapter on shorting – https://zerodha.com/varsity/chapter/shorting/
Thank you sir
Karthik,
I am getting stuck in one place ,whether to classify a candle as marubuzo or not.
1.Should we approach the visual method or calculate with OHLC.
2. Also if O=1376, L=1376, C==1441, H=1450. is it a bullish marubuzo???
3. If yes how u calculated upper shadow & real body percentage???
The difference between high and close is 9, or
9/1441 = 0.6%…which may not be Marubuzo.
Thanks karthik…
Hi Team,
Do we have any PDF download of the Module as we had it previously.
Regards,
Nikhilesh
Yup, we will put this up soon.
Hi Karthik,
Is coding possible for Marbozu in PI
Check this – https://zerodha.com/expert-advisors/
As per the bullish Marubuzo the next trading session is expected to be optimistic i.e. the candle will be blue. But in one of the examples, you showed that the risk averse would have gained (example of ACC) as the next session was red and he wouldn\’t have initiated the trade. So my question is: if the marubuzo is bullish and expectation for the next session is also blue, how come it became red and what do we do is such cases. as, our prediction goes wrong here
He dint initiate the trade, so the SL was not triggered. Hence money saved is money gained 🙂
In the case of a bearish Marubozu, we should short the stock. But if the price of the stock goes up, then we will lose money, even with a stoploss equal to the high price of the day. And in case the price goes on falling, when do we sell the stock?
Yes, if the SL hits then you need to take a loss and exit the position. As far as profit booking in concerned, you need to have a target price in mind. The chapter on support and resistance throws some insights into this.
What moving average should be used for intraday ? and time frame ( 5 minute candle or 15 minute candle ?
Try the 9 x 21 minute MA.
Sir, i want to ask that entry to stop loss is made everyday or once made it continues to be unless we cancel the stoploss??Secondly ,in bullish marubozu why stoploss is said to take same for both risk averse and risk taking person,for risk averse stop loss will be relatively much deeper therefore he must make stoploss at higher price , isn\’t it??
You will have to place the SL order every day as unfortunately, you cannot carry forward your SL orders overnight. Every CS pattern comes with a preset SL level…this is the same for both risk averse and risk taker.
karthik sir how to approach support/resistance shokker canndles
The same way as you\’d approach the non shokker candles.
Hello,
i had zero knowledge about market, \”introduction\” helped me a lot..
but brother i don\’t understand, as i read earlier, if there is a buyer there needs to be a seller. My question is..
1. how it happens, when the market opens, the first share bought, where is it bought from ? ans as you said, in marubozu bulish market, if i buy around 3:20 p.m. and if i don\’t sell it, will it be automatically sold at the end of the market ? who is going to buy ?
2. i don\’t understand the rule number 1. buy in the bulish market and sell in the bearish market ? isn\’t i am going to make a loss ?
1) For every buy there is a seller. You can always, buy/sell in futures and position will be carried forward overnight.
2) The idea is to stick to the trend, hence the rule.
Brother, buy in bullish market and sell in bearish market, it\’s not how you are understanding.
It means buy first and sell later (long position) when it\’s bullish trend & sell first and buy later (short posiotion) when it\’s bearish trend.
Thanks for Varsity contents. I am just starting on studying this resource on TA.
Seeking a clarification on this post on Maribozu candlestick pattern.
The chart example you have given is for the End-of-day trading chart, am I correct?
The Bullish and Bearish Maribozu you have explained based on OHLC for each trading day. So, this applies for positional/swing trading where one takes delivery of stocks, am I right? Because making a buy of stocks at 3:20 pm does not really allow one for intraday trade, isn\’t it?
If we have to apply Maribozu candlestick pattern for intraday trading, we should be looking for maribozu on 15-minutes, hourly charts, isn\’t it?
Please let me know if I have inferred this correctly.
Yes, you can apply this for carry forward trades as well 🙂
As I\’ve mentioned earlier in this module, TA is applicable across all time frames.
Thanks for reply Karthik. I understand now.
Good luck, Nishant 🙂
Dear sir,
I have a doubt \”Can I do intraday trading tomorrow, based on the pattern formed today\”
e.g. toaday is bullish marubozu formation, so expecting that it will so bullish sentiment for next few session I go long on in morning and then sqare off by evening or whenever I make a significant profit\”
Regards
Yes, you certainly can.
Hi All,
I have recently opened an account with zerodha. I\’m super newbie to stocks and trading. The selection of articles here is really useful. After reading about the marubozu pattern I have a of questions regarding \”shorting\”
1. Day 1 is Bearish Marubozu, Can I do a pre-market short trade for the next day? (Short Delivery)
Yes, you can. Check this – https://zerodha.com/z-connect/queries/stock-and-fo-queries/pre-marketpost-marketafter-market-orders
Hello Karthik
I\’m very new to all this and right now I\’m not actually trading anywhere. I\’m doing the modules to gain knowledge and somehow i just cannot wrap my head around the whole concept of Stoploss. Can you please explain it again with an example.
Thank You
Ok, assume you bought a stock at 100 with an expectation that it will go to 105 and you hope to make a profit of 5. As you understand, there is also a risk involved here. Instead of going to 100, it can drop to 95 or 90 or any other price point. So you dont want to live with this uncertainty and want to ensure that below a certain point of loss you dont want to hang on to the loss making stock. This point is called the stoploss point, which literally means you are stopping yourself from making further loss. So you can probably keep 95 as a stoploss for this trade.
as you said stick to the plan, so if I were to initiate a trade in bearish marubuzo and next day it becomes bullish and continues like this for next 3-4 sessions then I must hold till i reach a stop loss
thanks ! i was studying the charts of Friday in my kite account and i sorted on 15 min and observed that on majority there was a reversal happening ie a bearish followed by bullish and vice versa. I am an equity trader and realised that this may not be an effective way for intraday trade on equities. Would you agree or it is just an aberration
Well, if there is a consistent reversal, then maybe you should set up trades based on these patters 🙂
Remember, you need to be quick to cease the opportunity while trading intraday!
I have been reading daily charts of multiple stocks to spot a marubuzo but could not spot it, you being far more experienced in spotting, can you safely say that the pattern is not a regular ocurrence but if it ocurres the way you defined. I am asking this question just for you to share the experience
These patterns do occur regularly, but its kind of hard to put a number against the frequency of occurrence. However, I can tell you that they are more likely to occur on stock charts as opposed to index charts.
Absolutely. You hold till SL is breached or target is achieved.
dear karthick,
i have a question pertaining to the price action analysis with candle stivk patterns. on which segment can it be applied. since there are both buying and selling oppurtunities its difficult to apply in cash market because you cant short in cash market unless its intraday as far as i know. THEN COMING TO FUTURES IT HAS AN EXPIRY AND HENCE CANT BE TRATED WITH CANDLE STICKS OR MVS BECAUSE THEY WORK ONLY ON AN HIGH TIME FRAME.SO WHICH SEGMENT CAN THESE BE APPLIED
1) All segments/All assets/all time frames
2) If you are looking at shorting, then maybe its best done on futures as you can carry forward the positions
Dear karthik Ji. Today I completed this part 1 of Chapter 5. Really I was a great learning to me and you deserve many many thanks for that. God bless!!
Thank you so much, Sunil. Good luck and happy learning.
even in day trading , minimum 1% size required?
Yup, makes a difference.
Hi Karthik,
You have helped me a lot to learn about what is the stock market with the Varsity. I wanted to ask, according to Candlesticks, if it is Red then that means it is too much selling? And also means one can buy at such less price and can sell when the Candlestick turns blue for better price?
If you are going by the rule book, then you should buy on blue candle, which signifies strength.
In section 5.6 (Trade trap) , it is mentioned that trading should be avoided during extremely short (below 1% of range) or long candle (above 10% of range). Can you please elaborate how to quantify this range?
These candles (short or long) indicates extreme sentiment or the lack of it (for small candles), hence the essence of price action wont be reflected in the price. So better to ignore these candles on a standalone basis.
Is there any technical parameter to calculate the range % ?
Usually, the difference between open and close or high and low gives you a send of the range.
It is very useful to me thanks Zerodha team…and also for the replies,,, while reading the comments gives a vast knowledge about the topic….
Good luck, and happy learning!
Hi Kartick,
Regarding Buy strength and Sell weakness
I understood the concept of Shorting, u sell when stock when price is high and buy back when price is low,
Buying when strength makes sense since stock will appreciate further
But selling at weakness wouldn\’t it result in loss, r u talking about selling the stock to reduce further losses.
Can you Please explain selling weakness part.
Yes, sell the stock at weakness so that it drifts down and buy it back later….this is essentially basic guidelines to shorting.
Hi sir,
I have lot of confusion after this chapter. Iam a beginner so can\’t able to understand this easy…Assumption 1: buy strength and sell weak….here in bullish marubozu if O=L=100,C=H=110, as per assumption we will buy at the closing price…why can\’t you sell at this price so that per share we will get Rs 10 profit (if we bought for Rs 100)..and likewise for bearish market O=H=100, C=L=90 as per assumption need to sell at closing point which means loss of Rs 10 (if we bought for Rs100 per share), why can\’t they sell before reaching Rs90?….how we will get profit if we are moving as per assumption…can you please explain this to me?…Thanks
Arun, most of these queries have been answered in the comments section. Can you please read through them? Thanks.
how many number of tickets are there in a single Marubozu? How can I assure that the pattern is not going to change at the last minute as the market trend can vary every minute.
No assurance in market, Pallavi 🙂
Not sure what you mean by number of tickets.
What is a long candle? How to measure that 10% you have mentioned?
Take the range for the day (high – low) in case of bullish candles, and (low – high) in case of red candles and cross reference it with the avg range for previous few days…maybe last 10 day.
Please make the website mobile friendly.
This is responsive site – adapts to mobile.
Sir a share O-960,H-986,L-959.5,C-985.5 how to calculate the body length of candle in %.
You mean the range? It does not make sense to calculate it in terms of %.
The body range is 2.7℅,(H-L)/Close[986-959.5]/985.5..but this not a marubuzo pattern becoz it hv both side shadow…is it correct or not???
Yup.
I will say it is a Marubozu pattern. The difference between High & Close and between Low & Open is very small.
sir,
i want to ask that suppose i have shorten nifty at 9340 with a stoploss of 9360 and waited to decline. But on the other day, a gap up opening occured on 9400, does my stoploss triggered, if not, then i have to squareoff my position in a huge loss, or the stoploss i mentioned would automatically squaredoff in this situation?
please clear my concept sir.
No, in case of gaps, the price directly moves to a certain level and the SLs can remain pending. In such a situation, its best if you can cancel the SL and exit the trade.
What moving average should be used for intraday swing and positional trade on volume chart for analysing .. like 10 day or 20 day or 50 day moving average like that
Try the 9 x 21, used to work well for me.
You are talking about Closing price or volume?
We use 9×21 EMA on closing price and not volume for intraday trading, right?
Thats right. We use a simple average on volumes.
During bearish trade pattern, we generally sell the shares that we bought so Why there is a need of Stoploss in case of Bearish candlestick patterns
What if the stock goes higher after you short? You will lose money right? Thats why you need a SL.
Suppose the stock goes high and reached the stoploss point in bearish marubuzo then what would happen.? will the stock be sold at stop loss point if we have kept the stop loss at high of the marubuzo?
Yes, it would. However, you need to double check and ensure the SL has been triggered. Its always a good thing to do.
Hello Karthik,
Excellent job with regards to varsity and the simplicity of modules. I have to appreciate your patience for clarifying so many queries. I have come across many brokers who take advantage in making money for just to make us understand the basics of trading. You guys rock. I would say this is one of the best social responsibility taken from Zerodha towards young and unemployed for sustainability. Appreciated. Now I have couple of questions to be clarified.
1. If I am a risk trader and there is bullish or bearish Morubozu and I execute my trade before market closes with stop-loss. Say next trading day there is huge gap up or gap down what happens to my stop loss. Will it get triggered or will I to take huge loss.
2. I hope the derivatives are extract of equity. Which means the changes that happens in equity will reflect in future and options. So to trade in future or options, I have consider TA from equity charts. If I find a bearish Morubozu in equity chart (let\’s say ICICI Bank) can I short in futures.
Please clarify. Thank you in advance.
Thanks for all the good words, Ananth.
1) Gap openings can be notorious dangerous for SL orders as it tends widen the P&L. Under such circumstances, you need to ensure the orders are executed.
2) Futures yes, but not necessarily in options. Yes, you can trade in ICIC Fut based on TA derived from ICICI Eq spot.
Like always thank you for the reply. Now based on the reply No. 1 \”you need to ensure the orders are executed\”, is that the stop loss that we are talking about or close the order at the opening of gap up or gap down. Because I am sure when market opens gap up or gap down the stop loss will not get executed as the price wouldn\’t have touched the stop loss. Please correct me if I am wrong. I would appreciate if you would give me a link where I can have complete tutorial on Zerodha.com PI.
Yes, its the SL we are talking about and gaps are not good for SL orders. However, you need to note that orders placed today (which includes SL orders) cannot be carried forwarded for the next day. So you are required to place them fresh next day. We conduct daily demo of our daily trading platform. Check this – https://zerodha.com/educate/
Hi Karhitk,
Thank you for such a wonderful lesson… Can you elaborate a bit more on BUY Strength Sell weakness. with an example.
Buy strength means you buy on a day when the stock has gone up (green candle) and sell strength means you sell a stock when the stock has gone down (red candle day).
Which is the best place to look up for stocks and other data\’s other than Zerodha Kite
Zeordha Pi.
Does the colour of candle only varies in blue and red?
Its customisable, you can choose pink and green if it appeals you 🙂
Excellent article on how to interpret the candles. I would like to add a few points to the discussion hoping someone would benefit if it makes sense else I would learn something if somebody corrects me. Each day is a learning opportunity. While anticipating trades on a bearish marubuzo the ideal case would be to short on the closing price expecting the trend to continue and the price to go down. An important point to consider is that if you dont have a stop loss then your risk is unlimited. Price of the stock can go to any number overnight and you might end up in a very bad position . Risk taking definitely pays off but you should definitely have a plan and have a stop loss. While on a Bullish Marubuzo the worst situation you can be is when the stock value reaches 0. It\’s OK to make a loss but the best trader knows to minimize his loss.
Absolutely. Knowing the risk side of the trade is way too important.
Instead of saying \”In the chart above\” or \”Here is another chart\”, can we number the charts? Let\’s say \”In the chart 5.3.1\” or \”Here is another chart 5.3.2\”. This way the reader can be sure of which chart you are referring to.
Its pretty confusing while reading on to which chart to refer.
Thanks. I\’ll try and fix this sometime soon 🙂
Hi Karthik,
Thank you for excellent lesson.
Is it possible to place bracket orders programmatically if there is Bullish Marubuzo or Bearish Marubuzo with respective stoploss and trigger using KITE CONNECT? There should be one bracket order at a time, once already placed BO completes program should look for another Bullish Marubuzo or Bearish Marubuzo.
Regards,
Yadhukar
Yes, please do check the documentation here – https://kite.trade/docs/connect/v1/
Thanks for detailed explanation with real examples. What will be the average time period to long or short position with this approach?
I think you misspelled Marubozu term as Marubuzo.
Again, the duration of the trade should evolve by itself and should be a natural fit to the trade.
I would like to know what should be the % difference between open and close price for meruboza ? I mean to ask how much range of candle stick body to be considered ?
Anything above 1% is desirable.
Hi,
Thank you for the detailed explanation & it\’s easy to understand for the beginners like me. I have a question regarding Marubuzo. After reading the article i went to Money Control(Currently Zerodha a/c opening is in process) and opened a Candle Stick chart and my understanding is in a day it will form only one Candle Stick (Either Bullish or Bearish). Is it correct?
Please clarify.
Regards,
Hima Pallela.
The number of candles formed depends on the timeframe you are looking at. Check 3.5 – http://zerodha.com/varsity/chapter/chart-types/
Is it good to consider candlestick pattern formed on EOD charts for intraday trading? OR should i stick to candlestick forming on intraday charts? bcz finding pattern on EOD charts is quiet easy as compared to intraday charts?
SECONDLY, how should i select scrips for intradat trading?
Stick to Nifty 50 stocks, they offer the best liquidity for intraday trading.
I personally prefer looking at EOD charts to develop a plan for intraday. I\’ve had reasonable success with it. But having said that, I do know many many traders who use intraday carts to base their trades. So, I\’m afraid I cannot give you a straightforward answer, it really depends upon your trading temperament 🙂
Hi Karthik,
suppose you have selected a stock by doing EOD analysis, now for tomorrow you want to do an intraday trade with that stock.
My question is how will you plan this intraday trade?
your entry time, entry price, your intraday target, your intraday SL, chart time frame for this intraday trade, your risk reward ratio.
please guide.
Regards,
Swapnil.
EOD analysis includes all the parameters such as entry time, target, SL, etc. So upon open, I\’d watch for my entry price and execute the trade accordingly. If I don\’t get an entry during the day, I\’d let go of the trade.
Hi Karthik,
How you are doing this analysis for intraday?
The same way as it would work for on EOD basis.
Karthick,
In bullish: Stoploss is the price at which we should stop BUYING.
In bearish: Stoploss is the price at which we should stop SELLNG.
Please correct me if am wrong 🙂
Bullish SL – or a place at which you should exit your long position. Likewise bearish SL – a place where you should exit short positions.
got it..thank you
Cheers.
Hi,
You told the person who takes risk averse method should be buying on the next day and should buy near the end of the day.
If he buys on the next day at the end what profit does he make finally. I don\’t think he makes any profit.
Please explain this line in the risk averse \”This means the risk averse buyer can buy the stock only around the close of the day. \”
A risk averse guy takes calculated risk, after ensuring the trade qualifies in every aspect including the reward to risk assessment. If it does not quality, then there is no point initiating the trade.
please explain what is cover order and bracket order and how come it is use for fno trading (specially option).
Check this – http://zerodha.com/z-connect/tradezerodha/zerodha-trader-software-version/bracket-orders-trailing-stoploss-sl
and here is a video tutorial – https://www.youtube.com/watch?v=2TrYyOHA7P4
Based on the logic that there was intense buying or selling activity when there is a Marubuzo signalling upmove or downmove. Isn\’t it is the same case when there is a candle similar to bullish Marubuzo but with a tail or a candle similar to bearish Marubuzo but with a wick? We can argue that bears and bulls respectively initially had upper hand but were later taken out completely.
Let me provide examples to be clear
Candle similar to bullish Marubuzo with a tail O:100 H:105 L:98 C:105
Candle similar to bearishMarubuzo with a wick O:100 H:102 L:95 C:95
Yes, small upper and lower shadows is perfectly fine.
No small shadow part is clear to me. What I am interested in knowing is what if the shadows are slightly long but in favour of the move(see my examples carefully the shadows are not 0.2% of the length)?
I understand, it works as long as you have the conviction.
Please tell me whether the following fall into marubuzo category?
O= 623
H= 623
L= 621.6
C= 622.05
And
O= 625.55
H= 625.8
L= 624
C= 624.15
Here, both of these candles doesnt look like marubuzo much visually but on calculating their upper and lower shadows they are within 0.2%-0.3% range(actually even lower than 0.1). So, will they be counted as marubuzo?
Both are intraday 15 min candles of sun pharma.
Actually most of the candles that I was looking in sun pharma as 15 min intraday are falling into marubuzo suggested ranges of shadow. Are all MARUBUZOO? Please elaborate.(20/12 or 21/12 to b precise)
Yes, this, certainly is a bearish marubuzo.
But how can all the candelsticks of 15min fall into marubuzo category? Please be detailed as I didn\’t get the answer. My question was related to something else.
This can occur when liquidity is low. Also, if your query is something else, please ask the same clearly.
So, is sun pharma a low liquidity stock ? And all appearing candles to be marubuzo sticks occurs only when the liquidity is low or it depends on something else as well ?
Sun Pharma is not really a low liquidity stock. But maybe the futures on that particular day may not have been very liquid. Yes, usually low liquidity translates to Marubuzo.
I checked a few more days 15 minute candles in sun pharma and still when I\’m calculating its HLOP most of them are coming out to be under marubuzo range of .2-.3. What am I doing wrong ?
Nothing. Its the nature of that stock. Try doing this on Nifty futures to see how it can vary.
These shouldn\’t even be considered Marubozu because they are smaller than 1% range.
O=623, C=622.05
(O-C)/C = (623-622.05)/622.05 = 0.15% <1%
Yup, that too short wrt to the range. Can be ignored.
Dear Karthik and Zerodha team, Excellent work with these educational material. I have long stayed away from the markets for lack of such knowledge, but this gives me confidence to take the plunge.. 🙂 Thanks.
One small correction in this Chapter: Marubuzo –> Marubozu in most places?
Glad to hear that Anand! Happy to know you liked the content here 🙂
Will make the corrections!
how many types of candle sticks patterns in the world of technical analysis?
should i know all patterns?
No. I think its more than enough to know the patterns discussed here.
sorry.. typo error.. is it indicates very bullish where no one interested to sell?
Yes, thats exactly what it means.
Hi Karthik,
Thank you very much for your wonderful lesions. There are very clear and simple to understand to beginners like me.
yesterday I observed bullish Marubozu for \”Bhageria Indu \” with O-615.15, L-613.45, H-645.9,C-644.55 and upper shadow-.20%, lower shadow-.27%. when I observed today it is opened with 676.75 with 5% increase and only buyers are there and no sellers. Could you please explain me what it indicates. Is it indicates very bullish where no one is interested to buy? or any other technical reasons are there?
Thank you again for your lesions.
Hemanth
It just means that the traders are very bullish and are willing to buy the stock at any given price, hence the upper circuit.
Hi Karthik,
Thank you for the notes…
1. If I want to go ahead with intraday- The charts I have to look for is 15 minute candle stick, MACD- Will these 2 be enough or ….?
2. If the day end with bullish signal- The next day the market starts at 9.15 AM, by what time should I enter and what other analysis I should
look at.
Yes, that should be good. You can wait for the market to open, and take a call based on the movement. No hurry as such 🙂
Hi Karthik,
Amazing stuff, love reading your tutorial. I am a bit old trader but would like to jump in to this exciting game of trading.
I did see that there are trend reversal after a bullish Marubuzo and vice versa, what causes the same. At times the pattern reverses though it confirms a Bullish or Bearish trend. What is the reason for the same, do we need to use other technical analysis techniques along with marubuzo to take a call on buy/sell.
Thanks
Happy to know you liked the content here 🙂
Marubuzo pattern is a manifestation of a powerful price action that tends to cause a trend reversal. So in a sense you can take the liberty to say – the trend has reversed because of a marubuzo. To further confirm this and feel more confident to put in a trade you may want to check things like volume, S&R, indicators , Risk reward etc.
Hi Karthik,
Do we need to consider volume in this marubuzo candle formation ?
Yup, you need to.
Hi,
Less volume traded but Long Bearish Marubuzo possible?
Meaning?
sir in which site i can see daily candle stick chart……… wich site is best to know about stocks
Kite has beautiful charts, I\’d suggest you check the user manual to know how to use the charts on Kite – https://kite.trade/docs/kite/#charting39
Hi Sir, on the topic of \”Be flexible, Quantify and Verify\”. should we always compare the Shadow length against the high value? or should we compare the shadow length with the length of the candle (High-low)? Please clarify. Thank you. also can we say anything below 0.25 is acceptable.
Compare it with the total range i.e High-Low. Yes, 0.25 is acceptable.
So tell me other studies which I can add to go to intraday
I\’d suggest you begin with these simple studies – MACD, RSI, MAs, Supertrend etc.
Can I do intraday on the basis of single candle only????
Yes you can, but why do you want restrict it to just single candles ?
Hello Karthik, I have a question in section 5.3 – Bullish Marubuzo .
As I understand, the risk averse trader will buy the stock on end of the second day, of bullish marubuzo.
We have a statement in section 5.3 as \”As per the ACC’s chart above, both the risk taker and the risk averse would have been profitable in their trades.\”
From the graph of ACC, I could see that on the third day after bullish marubuzo formed, it is a red candle. If risk averse trader buys the stock on end of second day of bullish marubuzo, I think he would make a loss if he expects the stock to be bullish on the third day too (as the third day is a red candle.) Given this, how are we saying the risk averse trader would have been profitable? Please clarify. Thanks!
In both the cases, the SL has not been breached…so there is no question of loss. Remember you hold the until one of the events occur – SL breaches, or tgt is achieved.
Hi Karthik, it is being absolutely enjoyable & interesting learning about trading on Varsity!
I have a doubt regarding Bearish Marubuzo. In case of a risk averse investor, who waits till the market closes to verify if indeed it was a Marubuzo- why should he wait till the end of the next day for the short trade. Why not take the short position, the very next morning?
What do we mean by- The short trade will only go through by 3:20 pm the next day after ensuring that the day is a red candle day.
Please guide. Thanks!
Thanks Neeti 🙂
The day bearish marubuzo occurs a short signal is generated…but you will act upon it only the next day after…provided the next day happens to be a red candle. Remember the 3 rules we set out initially? We short only on days which show weakness…(manifested by a red candle).
Thankyou for teaching beginners like me, amazing lessons. however i have few questions and before asking any questions sorry for silly questions like
If it is Bearish Marubuzo then this means the stock is going down which means that if a stock is trading at 350 then it will come down and the value will reduce then if you trade in this then how can it be profitable to anyone, if you own it at 350 and if the value is reducing and if you are selling it at a lesser price how one will be in profit.
and my 2nd question in bearish marubuzo stoploss is always high why? because as the term says and as far as i have understood stop loss means that if the stock is 350 and you put a stoploss say at 320 then this means that if it comes down to 320 then you will sell it, because you cannot bear further loss. and in bearish marubuzo the stoploss is always high like if it is 350 stoploss is at 375, but if the price rises to 375 it is good for anyone because before the price was 350 now it is 375 then why?
Hey John, all questions are welcome – this forum is meant to exchange question and answers!
You will profit from the down move by shorting the stock, if you are not familiar with shorting, I\’d suggest you read these 2 chapter – http://zerodha.com/varsity/chapter/commonly-used-jargons/ and http://zerodha.com/varsity/chapter/shorting/ in the same order.
You will gain clarity on your 2nd question only after you are clear about what sorting is. So I\’d suggest you read that first.
I have started reading the TA thoroughly and find it very informative. Indeed I checked this on ICICIBANK for the last two months. I think 4th july and 12th july qualified as bullish candles. If that is correct, please let me know three answers:
1) Would there be a loss on 8th july if i took position on 4th (risk taker profile)? Or I could have come out on 5th July with a small profit?
2) 13th July is bearish candle but still it has not hit the SL. So if I took position on 12th July, when should I have exited because the price is more than the entry price till 29th July.
3) If the candle is bullish but the intraday trend is bearish through out, will there be a change in the rule? If the Opening price is 100 rupees and it reaches 110 in the next fifteen minutes and consistently falls and closes at 103 or 104 rupees, then the intraday trend is clearly bearish. Can we still take position?
Hope I am not asking questions which are answered in the subsequent chapters that I have not read.
4th July may not qualify but 5th and 12 does. Considering you took the trade on 5th July, you would have stopped out of 6th itself. 12th July could have been a profitable trade had you booked profits at the higher levels. Of course this would also depend on your target levels.
No change in the rule….you just need to keep track on the SL and target levels. As long as the levels are not breached, you are still in the trade.
Is there any easy which scan through all scrips at endd of the day to identify if there is any scrip which satisfies this condition ?
You ca use the sanner and expert advisor feature in Pi, check this – https://www.youtube.com/watch?v=uqKtFl46P2Y
Hai Karthik Ji,
wand to learn /develop opening brake out strategy. Let us give Good idea .
Check out the chapters on Dow theory.
Hello, do we have any calculation to check if a candle is small or long. i.e how its plotted in candle stick graph
Nope, you just have to take the range of the day to get an estimate.
Thanks for the response karthik. Sorry if i posted the question at wrong place. My question is not in terms of Marubozu. In general what range constitutes a small candle stick and a large one. Is there any pre defined way to arrive at the same.
Well, a price movement of less than 0.5% constitutes a small candles, anything higher that 0.5% contributes to a large candle.
Thanks Karthik
Welcome!
I did write some programs to evaluate the same, Ex: for 1000 rupee stock, if open-close variation of 2 second chart is 5 rupee. Range comes as 5%. But for 500 Rupee stock it comes as 1%. So the candle looks different for 2 charts. I think for every price band of a stock, different metrics is used to calculate Short and Long Canlde.
Yes, in fact thinking about it in terms of % will bring in a great deal of uniformity.
Please consider my suggestion :
In Kite and also in PI, one option can be given for the sizeof the candle ( Body of the candle ), Now 2 types ( color ) of candles is displaying, you can ask technical team to provide 3 types of candle ( color ) first one for bullish candle, second one for bearish candle and third one for the candle whose body size is less than 50% size can be dynamic ( color can be Red, Green and blue i.e. RGB color ). It may help to decide different TA concepts.
Thanks for the feedback, will pass this to the team.
Hai KARTHIK RANGAPPA,
Thank u
Welcome!
Hai KARTHIK Ji,
I am a intraday trader using 5minits chart. If opening candle is Mouribouzu in 5Minits how to read that pattern
TA works across all time frames, so you analyse the 5 min candle the same way as you would analyse a EOD candle.
what basis should a target be set?
Support and Resistance can help you set both targets and stop losses.
Hi
This is terrific session and awesome for the beginner. I have a query in this When a Bearish Murabozu is form then its confirmed at 3:20 PM the shorting option can be initiated , I believe this is not valid for the intraday trading. Whats your take on this /
True, at 3:20 PM there is no point initiating an intraday trade as the markets is open for another 10 mins only.
thanks karthik for prompt response. you are an asset to zerodha and to beginers like us.
Thanks for the kind words 🙂
hi kartik.kindly update the correct spelling of marubozu.i find different spelling in heading and different in other places.kindly verify the same and update.cheers
Sure, will do.
Its MARUBUZO or MARUBOZU as both the spellings are used enormous times. I am confused.
Guess its a proper noun, so both should be alright 🙂
Is it necessary to understand candlestick pattern? I find it difficult, instead I find line chart very easy
Line charts are great to get an overview of whats happening in the market. But if you want to identify specific trading opportunities then you got to use Candlesticks or bar charts. I\’d suggest candlesticks.
is this technique is reliable in both high volume stocks like Vedanta , suzlon and low volume stocks like kwality, manappuram
Yes, in fact TA works best in scrips that have high liquidity.
is there any books availible on zerodha varsity ?
reading long time in computer finding it difficult
any pdf format availible ?
Link to download the PDFs are provided at the end of the chapter list – http://zerodha.com/varsity/module/technical-analysis/
Thank You Sir !!
What should be the allowable limit for the shadows in Marubuzu ?
Regards.
About 15% of the day\’s range should be good.
i guess u wanted to say 1% and not 15%
Hi karthik.
Excellent content. Hats off..
Just one query. I want to start investing long term. Is a comprehensive knowledge of TA necessary for long term investing?
Glad you liked the content here Vysakh 🙂
For long term investment you need to understand the business Fundamentals. I\’d suggest you read through the Fundamental Analysis module.
HI Sir – Your explanation of the concepts are very easy to understand in the first glance. Thanks for such a wonderful article.
I have a following 2 doubts –
1) I find that a company \”A\” qualifies for the trade as per my analysis, is it possible to buy the share of company \”A\” today and sell tomorrow (T + 1). I am asking about trading in equities.
If so, How does the settlement happen.
Should I buy the share only in cash? or does Zerodha offers margin to trade?
Also is it possible to sell the share after 2 days? I am asking this as the settlement of a trade takes after T + 3 days..
2) Suppose I Buy 500 shares of company \”A\” for Rs.100. And I am setting the stop loss as \”90\”.
My target is not reached today and even stop loss is not triggered. So I want to continue holding this position.
On second day, do I need to specify the stop loss again and target again?
If thats the case, assume the company \”A\” opens the next day at Rs\”85\” which is below my stop loss. can I control this?
1) You can buy today and sell tomorrow (BTST) , suggest you read this post on Z-Connect — http://zerodha.com/z-connect/queries/stock-and-fo-queries/btstatst-buyacquire-today-sell-tomorrow . Since you are selling the shares the very next day, the settlement happens in cash. No, Zerodha does not provide margins for such trades. If you do not sell it off the next day, then you can sell it on T+3 day.
2) SL orders if not filled will be cancelled by end of day. You will have to resend the order again the next day. If the stock opens at 85, then obviously SL wont be triggered.
Thanks sir, for clarifying my doubts..
Welcome!
Karthik during this time of market sell-off should we use TA as analysis tool? But as evident I see almost all the stocks falling so I think I\’m better trading on Options with CNX Nifty. Please suggest.
TA should help even in this markets. I guess many TA traders have made a killing in this market. Options is a good way to trade these markets.
hi karthik,you are suggesting the trade at 3.20 , which means delivery based or btst,stbt ? by that strategy you may lose intraday trade right? how a range is calculated high-low or open- close?
Or it can be in futures. Range = high – low.
want to know this is a good shorting opportunity according to checklist or not-
1. Bearish maubuzo pattern is formed
2. Its formed near support and is about to break it ,if price falls further.
3. Volume is higher than previous days.
4. MACD is confirming. RSI is 34, according to RSI stock is reaching over sold region, so chances of reversal are there?
5. DOW theory- not sure ( my only observation is stock is moving in bracket)
6. RRR – reward=2188-2339= 151, risk(sl)= 2390-2339=51, RRR= 3
sir,
plz tell my calculations are correct or not and should i go for shorting opportunity tomorrow or not?
This sounds good. However please be aware that the support could hold and the stock could bounce. Best way to play this would be via an option set up rather than a naked futures position.
Hi Karthik,
Could you please explain why it would be a good idea to use options here?
Regards,
Rahul Khandelwal
With options, you need not have to worry about the daily M2M. You pay the premium and wait for the trade to evolve.
this candle has small tail, so will it qualify for bearish maribuzo?
Yup, it does.
Hi karthik,
Can i expect last candle is Hammer or Is it Doji in Techm 6 months Chart?
Please confirm me whether it is in Support Zone or not as i can able to see support on 25-08-2015 and touching the same point of low to da also?
Looks like a Doji. 500 seems like a support area.
Karthik bro,
Excel link : https://drive.google.com/file/d/0B4YbuL88T8AMY0p6azMxZGlxMzg/view?usp=sharing
Just so you know this is my first time writing formula\’s in excel
If something is weird I can explain my question in more detail 🙂
Thank You
Not bad at all! Seem all good to me!
My only suggestion – separate out the Green and Red patterns.
thank you very much Karthik bro 🙂
Karthik bro,
Please help me…
I cant figure out a proper calculation for Marubuzo shadow. You taught us that shadow can be < 1% for the pattern to be a buzo.
Lets consider Bullish buzo,
For Upper Shadow calculation, which one of the following is correct?
[(high-close)/(close-open)] must be < 1? i.e shadow with respect to body range
[(high-close)/high] must be < 1? i.e shadow with respect to close price.
For lower Shadow calculation, which one of the following is correct?
[(open-low)/(close-open)] must be < 1? i.e shadow with respect to body range
[(open-low)/high] must be < 1? i.e shadow with respect to close price.
Much thanks from a budding trader 🙂
Sorry for Lower:
For lower Shadow calculation, which one of the following is correct?
[(open-low)/(open-close)] must be < 1? i.e shadow with respect to body range
[(open-low)/high] must be < 1? i.e shadow with respect to high price.
Can send you an excel with the calculations.
Hi Sir,
I am a bit confused on the point \”Buy strength and sell weakness\”
How can we make profit when we buy the stocks in bullish time and sell in bearish time.
Would you please elaborate on this point please?
Well, you need to read the entire module for that 🙂
Hi Karthik,
I have been going through the Technical analysis module and the point \”Buy Strength and sell weakness\” is referred in many of the places. I still have no clue on how this point valid on achieving profits.
But it makes sense when we consider the risk factor of a stock.
Would you please help me here in understanding the point well, so that i can go through TA module once again.
Buy strength means to buy on a day when there is bullishness in the market. Sell strength means to say that you sell on a day when there is bearishness in the market..meaning on a red candle day.
Yep.. I got the point now. buy the share on bullish time, expecting the share price would increase in coming days.. and sell weakness means, shorting the share, expecting its value to deprecate in coming days. Right?
Sir
Can you elaborate time frame under consideration.like if I am a swing trader then what should be the look back period,prior trend for candlestick study should be of what duration and wat should be the time frame for candle stick(EOD or weekly)
I would suggest you use 6 month / 3 months data for swing trading. Use these to develop a general sense of direction and you could use the daily candles for further calibrating your trades. Of course, EOD data should be good.
Mahindra holiday was in uptrend for last 3 months.on 15 it formed bullish marabuzo but on 16 it was bearish.it fell about 5.5%.how to enter in a trend.after how many days of trend START we should enter the trend.
Rajeev TA patterns only enhances the probability, no guarantee they will always work. In fact nothing is a guarantee in markets. Coming to your query, one good way to enter the trend after the trend getting established is to buy/sell when it reaches a moving average – say a 100 or 200 EMA.
Hi, My question is that bulish marbouzo /hammer/bulish engulfing pattern will only be considered for buy if it comes after down trend or we can consider it on going upwards too.
Prior trend doesn\’t matter.
Prior trend doesn\’t matter in Marubuzo.
yup!
Prior trend for Marubuzo is not required. If the pattern appears after an up trend, then the idea would be to short the asset.
SIR,
your reply is a bit confusing \”that prior trend does not matter but the idea is to short the asset if it appears after a uptrend\”
Why??
You only explained it that marubozu does not look for any prior trend
Sorry, I think that reply was indeed a bit confusing. Yes, prior trend is not required for Marubuzo.
Bullish Marubozu in GM Brewries on 23rd September 2015. Let\’s see where it takes the stock.
Yeah, and I hope all the other variables in the check list are in place.
Great going so far. I followed the chart and now GM hits 500. Can anybody give a target here
Happy to know that Kirti. By the way, no targets, no tips, no recommendations here. Zerodha Varsity is only about sharing market related knowledge.
SUDESHNABORA
September 8, 2015 at 7:56 am
First of all , I want to thank you for this wonderful lessons. It is so clear and easy to understand for a complete beginner like me.
Now, coming to my problem . I am not confident about the shorting technique. Will you please clarify my doubts.
Say, I want to short a stock X which is currently trading in a bear market at about $100 .
I however, don’t possess this stock . So, how do I sell something that I don’t possess?
Then, when I am confident that this is the appropriate time to buy back (when the trading price is less than $100) , I buy it back. How do I buy back a stock which I never had?
Moreover, the stoploss concept for shorting – does it mean that in case of reverse trade, the stoploss value is the upper limit at which I should buy back with some loss?
A bullish morobuzo does not always mean that the trade shall be bullish tomorrow.
However it enhances your odds of making a profit, provided all other factors in the checklist is validated.
Sir, what does the chart pattern of Techmahindra, tell us. There was a sharp fall today, is this bearish engulfing?
It does look like a bearish engulfing pattern.
Hi Karthik
Can you give some probability numbers for these candlestick patterns based on personal experience. Like Marubozu has 60% of predicting right in your trades. That can give a intuitive feel to the bets one can place using Kelly\’s criterion .
Ady…interesting question, but honestly I dont have a direct answer for you. The thing with TA is that not all patterns works on all stocks. So for example if marubozu works well on Stock A, then the same pattern may not work on Stock B. So you as a trader need to evaluate which pattern works well on which stock. For example you could try this –
1) Pick a stock – say RIL
2) Load the last 3 years OHLC data
3) Visually establish all the marubuzo dates
4) Identify how many have hit SL and how many have hit the target. You can have a simple 5% target rule..where you consider a success if you can book a 5% profit
5) Tabulate of all the trades how many were successful and how many were SL trigerred
So for example if out of 10 trades 6 were successful, then roughly marubuzo works 60% of the times on RIL.
You can do this for all the stocks, across all patterns.
Karthik _/_
This is a gem of an advice. Thanks for your Varsity initiative.
By this way can we evaluate all company\’s stocks? If so what success percentage must we look for to qualify that stock to be performing well on Marubozu,i.e, to initiate trades based on Marubozu?(I think it may depend on the trader..but still I\’m just curious to know any rule of thumb?) You have chosen last 3 year data for analysis. Is there any specific reason for that? What\’s the most appropriate timeframe?
Yes, this is applicable to all assets that trade. The success rate, depends on the stock, remember every stock has a different risk-reward profile. Last 3 years is to ensure you have sufficient data points. For long term, look for at least 1.5 years of data, for short term, look for 6 or 3 months data.
Thanks Karthik.
Could you please suggest me some websites 1) where I can get historical data of stocks in excel? 2)which acts as a supplement to your varsity ? (Any books, websites, eCourses etc)
You can download the data from Pi. Load the chart and right click to see the download to excel option. Have you read the market wizard series? If not, I\’d suggest you give that a read.
Great Initiative Karthik !! The practical example from Indian market was awesome.
I really appreciate your dedication towards the each queries of your users. Please keep doing this , this clears a lot of doubts of a beginner.
Thank you so much Neeraj, really glad you liked it 🙂
karthik ji
how do we know the target if we initiate any trade as if we are swing trader is the target is next resistance or trend resistance.
in the both the case , some time stock touch trend resistance and some time resistance how we set the target.
thanks
S&R makes a good case for setting targets and stop loss. We can even use the volatility of the stock to set targets and stop loss, we will talk about in the next few chapters (15, 16) in Options Theory.
Article is very good and descriptive. Like it.
There is a spelling mistake, its \”Marubozu\”
Thx 🙂 Will make the changes.
[…] it is the extreme of the classical candlestick patterns. For more details, please go through this link. Karthik sir has explained them beautifully in these articles. Most of the time, this LWP is our […]
Dear Sir, In your first query the variations of shadows in Marabozu for high/low are to be within o.2% to 0.3%. where as in an another query by Mr. VenkatReddy you have stated 1% relaxation is allowed. pl. clarify. thanks /regards
Well, I suppose upto 1% should be ok 🙂
Hi,
How can one identify if trade should be lon or short if there are too many marubuzo candle(bullish & bearish both)
Well, you stay away from that scrip 🙂
Sir! is this a bearish marubuzo? Can we initiate a short position here?
If so what should be the target keeping. however it has its result on 22nd .
It does look like one, target should be based on the immediate support. However I would be a bit hesitant to initiate a trade based on TA when results are around the corner. Good luck.
how to find difference between high low and open close for each candle.pleas provide easy method.
The easiest way is to take the data onto excel and plot the difference.
friday\’s closing the nifty seems to have formed a bearish marobuzo…can you confirm
Yes, and right on top there is a bearish engulfing pattern 🙂
In which type of chart Marubozu occur like day chart,weekly charts,monthly charts?
If anyone want to see example chart of Marubozu later then what we do,mean to say like today 15-04-15 and Marubozu formed in any stock on 10-02-15,so how can we see?
You just need to see the end of day charts! I would suggest you use http://www.chartink.com, they are quite good.
Best Chapter. But plz.make a chapter for, if someone has two trading a/c, then how he can earn more money using some tips & tricks like this. I thing they must exist & there are people who use more than one a/c. Broker people i think get advantage using this.
No in fact I have nearly 5 or 6 trading accounts with different brokers and I see not advantage having so many 🙂
Suppose I invested in share XYZ if its up or at resistant level & I dont know if it will go more up or down. Then I buoght in on a/c & Sell in other a/c. Will it profit ? I know one will happen out of these two, either it will go up or down. In one a/c i will lost money & in other a/c I will earn. In this case, how should I minimize my loss ? that\’s my question. Since even for me there no extra advantage I had taken so far using 2 a/c.s. thnks for responce !!!
Well, instead of buying in 1 account and selling in the other why dont you try buying both the Call and Put option simultaneously?
Suppose day 1 is a bullish/bearish marubujo day. So, will the risk averse trader buy /sell stocks at the day 2\’s closing price ? And will risk taker trader buy/sell stocks at closing price of day1?
Yes, that is correct.
Hi Karthik, First of all thank you very much for this excellent contents.
My question is do risk averse trader has to wait till day-2 closing price till 3:20 pm or he can take position in the beginning of the day.
Thank you in advance.
Very honestly, this is situation based. There are times when I have initiated position right at the open.
Hi Kathik Sir,
TVS Motor has formed Bullish Engulfing Pattern? As you said, Risk averse trade can initiate a trade now onwards?
Regards,
SaikiranGarapati.
Yes, it looks like TVS has formed a bullish engulfing pattern. However the risk averse should have initiated the trade on the last day day…I\’m afraid it could be bit late to initiate the trade now (especially if there is a gap up on Monday morning).Also please do check for other credentials on the check list.
Hi Karthik,
Is PNB formed a Hammer on 27-03-2015?
Regards,
SaikiranGarapati
It certainly looks like!
Sir the content is very simple to understand..Good mix of examples as well for making the whole stuff pretty clear for beginners like me..I have one query..After reading article on Maribozu i tried to spot few in real time EOD charts..I found that if i take a position as a risk averse trader mostly i am in loss as either my initial SL is hit or even if i try to trail SL it is hit which leads to small losses or for that matter hardly some profit…How to make the trade really profitable ? When to exit after initiation of trade i.e how to calculate the targets??
Glad to know you liked the content Kirti 🙂
Have you completed reading through the TA module, towards the end of the module we have introduced a checklist based on which you should identify trade. Suggest you read through it and follow the checklist, I\’m certain you will have better trading success. Good luck.
Hi Karthik,
To day Suven Life Sciences Open = 249, Low= 243, High = 298 and Close = 294.85, So with this data, Can i expect it as formed a Bullish Marubozu and Can i buy tomorrow?
Hi Saikiran, In my view its not a Marubozu as lower shadow is close to 3%. its a bullish engulfing candle. though on good volumes, resistance levels cant be seen due to all time high. in my view trade should not be taken on this as very deep stop loss i.e, 44 Rs. on a scrip of 290.
Wow! You just echoed my thoughts Devaki 🙂
Hi Devaki Nandan
Thanks for your Views and thanks to Karthik also.
Hi,
Yesterday and to day also Diamond power has hit 20% hit Circuit Breaker with good Volumes and formed a Bullish Marubozu, So can we expect this trend will continue for few days as for Technicals?
Please be aware if the stock has rallied 40% in two days then there has to be some fundamental reason or maybe some insider news. Applying TA on such stocks can be bit tricky.
Most Welcome !
sir good morning
how u calculate this 3 %
That is the range, Shishir.
Couple of things –
1) The closing and high data seems ok
2) The Opening and low data are not really equal (even after accommodating for the be flexible, quantify, and verify rule)
3) But from the general description of the candle, it seems that the stock is bullish, hence conducive for a long trade
4) However my worry would be on the SL placement. Since the range is large, keeping a meaningful SL would be very difficult.
Good luck.
Hi karthik, I want to ask you àbout shorting please explain it. Can we hold the stock for days in sell call ?
In fact the 8th chapter in the Futures module will discuss shorting in detail. It will be uploaded sometime during this (or maybe next) week. Thanks.
Dear Karthik, A great set of notes for beginners like me. Thanks for the work, I have very basic doubt. Here is the scenario. I see a bullish candle pattern and indicators/volumes also confirm a bullish trend. So I get into a long position by buying the shares and holding for a time upto which I feel the trend is bullish and sell them for a profit. On the other hand if I happen to see a bearish trend , how can I hold the short position for the long time, meaning how can I sell the shares , hold the short position till the trend is bearish and cover them once there is a change in trend and realize profit ? Because we can go for a short sell only in intraday. Please explain.
Thanks, and I\’m glad you are finding Varsity useful. In order to do this, as in short positions and carry it forward you will have to employ futures. We have started the module on Futures, its half way tru, please do have a look at it as well. Thanks.
Hi, I am more comfortable shorting stocks. But we can do that intraday only. Is there any way by which I can short stocks for more than one day (except options…..I dont do options).
Shorting over multiple days is quite easy with futures. If you are leverage averse, then do check out the SLBS option on NSE – http://www.nseindia.com/products/content/equities/slbs/slbs.htm
Hi Karthik,
Thanks for the nice piece!
Extract from section 5.4 \”Earlier in this chapter we did discuss about the length of the candle. One should avoid trading during an extremely small (below 1% range) or long candle (above 10% range).\”
What is the range you are referring to here. How do i calculate that range ? Can you elaborate on this pls.
Thanks in advance!
Rgds,
This is mainly from the SL perspective. If the candle is too small (below 1%) then a there is a good chance of getting stopped out in case the volatility increases through the day. Likewise in case of a long candle (above 10%) the stop loss will be too deep, and in case you are proved wrong then you will pay a huge price for the trade. Also with long candles the risk and reward gets highly skewed. Best to avoid trades on such candles.
Thanks I got the SL point you said.
But you are expressing percentage points 1% and 10% here. From which number are you deriving this %?
For a stock of value Rs 1000, on one day if it\’s trades in a range ( range= day high – day low) of Rs 10 ( ie 1% of Rs 1000) it forms a short candle?
Thanks for your patience!
Precisely, the % is with reference to the range of the day.
Hi Karthik,
you mean % change for the day. i\’m right? if i wrong means, pls correct me.
Thanks in advance.
Yes, % change on a EOD basis.
Hi Karthik,
I am referring to the nifty 1 hr candle of 7/14. There it has gone up to 8554 from 8515. So the rise is not 1% even. So it is not satisfying the buy case then?
Yes, it would. You need to set the SL accordingly based on hourly charts. Also, I personally feel EOD charts contain quality information when compared to an hourly chart in particular.
Karthik sir,
1.On 16-2-18 , Bharti Airtel
Open = High = 434.95 , Low = 418.4 , Close = 419.7 , (Low-Close)/Close is 0.31%
I think this can be taken as a bearish marubozu by being flexible. What\’s your take?
2. And how to calculate the 1% and 10% range(I\’m confused) – from The Trade Trap
What is the percentage range for this stock? How is it calculated?
For an aggressive trader , if he wishes to trade around the end of 16-2-18 , what is the range he would rely on?
((High of 16.2.18) – (Low of 16.2.18)) / (Close of 15.2.18) Is this what you refer to should be within 1% to 10%?
For a risk averse trader , if he wishes to trade on next trading session i.e 19-2-18,(It is a red candle day), What is the range he will be relying on? Marubozu day\’s range or trading day\’s? ie.,
Will it be a) ((High of 16.2.18) – (Low of 16.2.18)) / (Close of 15.2.18) ?
or b) ((High of 19.2.18) – (Low of 19.2.18)) / (Close of 16.2.18) ?
3. Can Marubozu be used to trade only during the end of the day?
1) Yes
2) You can take the real body which is the difference between high and low divided by avg of high and low.
3) Yes, its best if you wait till EOD (near market close) to be absolutely sure about the pattern formation.
Thanks sir
2) Could you please explain with an example?
a) Isn\’t real body the difference between Open and Close?
It would be quite helpful, if alongwith the sample charts the date range is also mentioned so that we can also try to find such patterns on moneycontrol or rediff etc.
Makes sense, will keep this in mind while posting charts.
for intra day trading which time frame is ideal to be used 5 min or 15 min or 60 min?
I\’d prefer a 15 min or a 5 min candle, nothing beyond that.
Sir
Is there indicator which gives percentage change for small and bid candles
The change with respect to the previous close will give you this.
Thank you for your immediate response. If i place AMO for any script in the evening when it will be placed?Before 9:15?
Nope, it will go after the markets open, post 9:15 AM.
which is the best platform to identify the candlestick patterns clearly? can i go for Z5 candlestick chart or something like amibroker?
Even better would be Zerodha Pi 🙂 Check this – http://zerodha.com/pi/
For clarification: Marubuzo is getting confirmed after the day closure or before 3:20PM & the trading decision will be for the next day.
Will Marubuzo can be applied for the same day?
The confirmation of a Marubuzo is only towards the close of the day – ard 3:20 PM. If you are a risk taker you can initiate the trade same day, else you can take it the next day after getting a confirmation.
In case its a bearish Marubozu, We can not initiate the trade on Cash segment after 3:20 as zerodha does not allow us to carry MIS/Shortsell trades overnight, any alternatives beside F&O being offered by zerodha?
Nope, your only option here is F&O.
First of all, I sincerely thank you for your Varsity initiative.
I just have a small doubt. Most of the candle stick patterns (both single and multiple) you explained here talk about their utility for trades spread over multiple days.
Do they work well even in intra day trading?
For example, will the Marubozu, Bullish Engulfing Pattern, paper umbrella, and Spinning tops work well for intra day trading?
If they do work for intra day trading then what interval should we be studying (five minutes, fifteen minutes, etc).?
Thank you, and I\’m glad you liked Varsity. We are putting in our best efforts to ensure you get the best content, so please stay tuned 🙂
Yes, concepts of TA can be applied across all time frames and asset classes. So the same patterns holds true for intraday as well. However if you are starting out fresh, I would advice you to swing trade for sometime before you can attempt intraday.
U refered to swimg trading. Is it the same as positional trading? If yes then what time frames to look in that sort of trading i.e the lookback period and if no then what is positional trading?
Swing trading and positional trading are pretty much the same where one enters a trade today with an expectation of holding on to such trades for few days or months. Look back period should be at least 6 months of end of day data.
Thank you sir for your timely reply.
Most welcome!
Dear Karthik , how much of relaxation can be allowed for difference in high &Close, open&low in a bullish Marubozu.?
Ex:1 rupee for a 1000/- stock
I usually have a 1% of the days range as relaxation on the shadows.So if its a 1000 stock if the length of the shadow is about 10 or less its ok.
Karthik,
Could. You elaborate. This. Answer .
So a marubuzo by definition does not have upper or lower shadow. But keeping the flexibility rule in perspective, one can consider candles with short shadows as marubuzo. So the question is, how short the shadows should be in order to qualify as a marubuzo. To give you a perspective, it should be around 10 or less for a 1000 Rupee stock.
U r great
🙂
Hi
Bearish Marubozu indicates a sell call. So Why is there a stoploss for a bearish marubozu?
When a sell call is indicated you can initiate a short trade. However, what is the Sell Call is a wrong signal? Hence a SL is required. In fact for all signals we need a SL.
in case of Bullish Marubuzo, how the risk averse trader will benefit. As written above that he will buy only after confirming the rule 1 ie buy on bullish day, at the end of second day then how he is going to be in profit— shown in ACC chart.
He will buy the stock with a stop loss of the previous day low. He will hold on to it till the target is hit of the SL is triggered.
Hey,
Great initiative. Thanks a lot.
I have a doubt.
In the example given in \”5.4 – The Stoploss on Bullish Marubuzo\” you have given that \”But the pattern eventually failed and one would have booked a loss. The stoploss for this trade would be the low of marubuzo, i.e 959.85\”….
I can\’t understand this point. The candle is bullish and even the next day is bullish. But how do you say the pattern failed.?
Guru, notice after the pattern occurred what followed were a series of red candles triggering the stop loss.
Sir, |Can we use marubuzo candlesticks in commodity intra day trading. which commodity is most suited? which candle should i use. 5/15/30 .
Yes, you can use Marubuzo on commodities. In fact you can use candlestick patterns on any asset class as long as the asset has time series data. As a thumb rule, longer the time frame, the better it is.
Great material karthik
If i am an averse trader and if i am trading some stock based on 2nd day bullish marubuzo candlestick than which value i should select as a stoploss value , 1st day marubuzo candlestick low value or 2nd day low value?
It is always good to keep the pattern day low as the stoploss. However be flexible with this, if the price has run up quite a bit on 2nd day then no point keeping pattern day low as the SL as it would be too deep. This also explains why we have the risk to reward ratio as one the checklist items while qualifying a trade.
what is the thought behind keeping stoploss at the pattern day low and no where above?
The low and high points is when there was a change in sentiment. Traders use this point hoping the sentiment prevails over the next few trading session. I personally prefer when the SL coincides with the support / resistance along with the day\’s high low.
Great start Karthik!
I haven\’t been using candlesticks so far, but reading this article, I feel I have missed so much in this past 2 months of trading.
Hats off!
Thanks Aastroguru…market is an ocean of opportunities, old ones cease and new ones are created everyday, we just need the insights to spot them..so don\’t worry about it 🙂
What is a blue candle day or red candle day. In intraday trading can I enter position (buying or selling)as soon as I see a bullish or bearish Marbuzo.
A blue candle day represents bullishness and a red candle day represents bearishness. Yes, you can enter a position based on Marubuzo on a intra day basis.
Hi KARTHIK,
It was a great learning for me as i am beginner.
Can you please give an idea about approximate %accuracy in prediction by Marubuzo candlestick pattern in your own trading career?
Thank you so much,
Glad to know you liked it 🙂
I\’ve personally found marubuzo\’s quite interesting. Remember not all candlestock patterns work on all stocks. For example marubuzo may work extremely well on HDFC bank but may fail when it comes to ICICI. You as a trader need to identify this and develop a list mapping candlestick vs stocks. This is obviously time consuming and will come to you by experience.
How can a candlestick pattern/technique be a stock dependent?
If a technique works, it should work for all stocks and be applied uniformly.
Or is it just a hit and trial / coincident that this works for some stocks and doesn\’t for others?
This is purely a personal observation – not all candlestick patterns work on all stocks (in the same efficiency). For example, bullish engulfing may work extremely well on Infy but may fail often on SBIN. Hence the need to backtest. Good luck!
Why do these candlestick patterns work though ? Is it because these patterns are very well known to the public and everyone acts the same way when that pattern is formed which is why most of the time we get the expected result ?but if there is some other fundamental news about that stock , then the patterns give results differently …..am I correct ?
Sahil, the underlying theme is price-action, and candles are just a manifestation of the same. When a certain price behavior occurs, the traders tend to react the same way, all the time. Perhaps this is the reason.
HELLO DEEPESH SIR I AM A BEGINER AS WELL BUT IN 2018 , WELL I WANT TO KNOW WHAT WAS YOUR TRADING EXPERIENCE IN LAST 4 YEARS ??
Hi,
Is it good to use the Single candle pattern for Intraday trading? I see Bull and bear candles in 1 minutes, if I chose 5-15 minutes, the picture varies. So is that ok if I use 1 minute candle for Intraday and catch the bull and bear candle to execute my trade?
Yes, you can use single candlestick patter for intra day, however I would advice you to stick to 5 or 15 minute candles. Remember the higher the candle frequency, the better is the reliability.
Please explain more about the meaning of your sentence\”Reliability vs Timeframe vs Frequency\” in a bit more details.
I\’ve tried to summarize the time frame and the reliability. The idea is that the shorter the time frame, the higher is the noise level. Given this, I tend to rely more on a 10 mins chart as opposed to a 5 mins chart.
Umm The pic for the Bearish Marubuzo has blue ears.. that got me off guard ..
Otherwise Great content
that pic should have red ears… hehe 🙂
🙂
Please let me know if there any system to know in an candle formation, what is total buy quantity and what is total sell quantity.
It would be hard to distinguish this Raj. One good way make some sense of this is by looking into the volumes.
karthik Ji, If a volume bar represents both buy and sell qty together, its difficult to know from volume also, what is tot buy and tot sell, because every buy is result of some sell obviously and vis versa. kya kia jay…
Suggest you read through this about volumes – http://zerodha.com/varsity/chapter/volumes/
Today (7th nov) around 105.6 Bullish Marubuzo was formed in RCOM intraday chart and from that it crossed a high of 109.7.
Its due to your article it was easy for me to predict it. Thanks.
Good to know that hawwa !
Just feel sitting in the auditorium of Harward university listening a great but simple lecture of renowned professor
Glad to know you are liking the content 🙂
Hi Karthik please let me know what min chart need to follow to find a morbozu and how to check the OHLC PRICE of any morbozu candle.
Candlestick patterns are applicable on any asset any time frame. I would suggest you start with EOD chart and once you are comfortable, you can start looking for these in intraday charts as well.
How much of variation in high and low is acceptable in a marubuzo candle pattern. As per rule 2 be flexible with patterns.
Usually if the shadows are within 0.2% to 0.3% of the range it should be ok.
How do we calculate the % can you give an example?
Here is the formula –
(High – Close)/Close.
Is the above formula for bull trend or both?
If not, will the formula for bear trend be :- (high-open)/open
That would be (Close – low)/Close
First of all , I want to thank you for this wonderful lessons. It is so clear and easy to understand for a complete beginner like me.
Now, coming to my problem . I am not confident about the shorting technique. Will you please clarify my doubts.
Say, I want to short a stock X which is currently trading in a bear market at about $100 .
I however, don\’t possess this stock . So, how do I sell something that I don\’t possess?
Then, when I am confident that this is the appropriate time to buy back (when the trading price is less than $100) , I buy it back. How do I buy back a stock which I never had?
Moreover, the stoploss concept for shorting – does it mean that in case of reverse trade, the stoploss value is the upper limit at which I should buy back with some loss?
It is a concept that you just have to get used to. In stock markets you can sell something that you dont own, provided you buy it back within appropriate time (intraday in case of stocks). This is as good as buying first and selling later, only that the order is reversed in case of shorting.
Yes, when you short the stop loss price is always should be higher than the price at which you short.
Thank you for answering all of my queries in Module 1 ….:)
In Bullish Marubuzo:
1 (high-close)/close For Upper Shadow
2 (low-open)/open For Lower Shadow
In Bearish Marubuzo:
3 (low-close)/close For Lower Shadow
4 (high-open)/open For Upper shadow
If above percentages are in between 0.2% to 0.3% it means pattern exists.
This is what I understood Correct me if any of above formulae is incorrect..:)
You got that right!
Hi Karthik,
While explaining the bullish marubozu, to calculate the percentage of difference(high – close), it was taken as a percentage of the high, hence divided by High.
So, will the formula be (high – close)/high or (high – close)/close ?
Thanks.
It really depends on what you want to measure it against. I do like to measure the range with respect to close, (h-C)/C.
Sir, you explained in subtopic \”The trade trap\”
One should avoid trading during an extremely small (below 1% range) or long candle (above 10% range).
Please, provide an example regarding this
Apurva, I\’d suggest you look at any short or long candle, its is very hard to place SL on these trades, either they are too shallow or gets too risky (long candles).
Can you confirm To day Jindal Steel has formed a Bullish Marubozu? As you said, The variation of Upper and l,ower shadows are 0.2 to 0.3 5 ok..But Here Shadows are more than that?Please let me know whether i should consider this one as a Bullish Marubozu..?
For reasons that you have stated (upper and lower shadow) this would not qualify as a Marubuzo.
How much of variation in Open and Close is acceptable in marubuzo candle pattern. As per rule 2 be flexible with patterns.
Below the data of Rajoo Engineers from 23th October\’18 – Can we consider it as bearish marubuzo candle ?
O= 30.80, H= 30.80 , L= 29.30 , C= 29.45
The length of the shadows should not be more than 1% of the length of the real body.
Is it that:
Length of Upper shadow + Length of Lower Shadow should be less than 1% of the length of the real body or
Length of either upper or lower shadow should be less than 1% of the length of the real body.
It is either actually. A marubuzo is not supposed to have any shadow in the first place. YOu can be flexible (but measured) with one side shadow, but if its either ways then the price action is saying something else.
Sir what is the time frame of all the above patterns in the the above examples… In the daily chart if a bullish marubozu is formed then next day which time frame should I look upon… Is it 15 mint or 5 mint
I personally prefer 15 mins, Vivek. For swing trades, I prefer EOD charts.
Can you please explain this a bit more?
If we are waiting for the EOD to make the trade where does the 5 minute and 15 minute candle come into picture?
Thank you.
The 5 and 15 mins come into picture when dealing with intraday trades.
Hey… in point 5.3 you pointed at the red candle day and blue candle day. What does it actually mean there is the candle encircled the first one for the day???????
Please explain …. May be I am late till you have written this page but \”der aaye durust aaye\”.
please clarify
Sapna, red candle = represents bearishness and blue candle = bullishness. Have explained this and the previous chapter.
Hello Karthik,
Am new to trade and i gone thru this Marubozu candlesticks chapter one we calculate entire day Bullish/Bearish will give result for next day trade?
Example today DHFL is Bullish so it should be bullish day on next day(trade)?
Thanks.
AK
The expectation is that that it the bullishness will continue, but of course thats just a probability 🙂
Buy in strength and sell in weakness means buying in high price and selling low price. Have I misunderstood it. Kindly explain.
Yes, that is correct.
Why one should book loss by buying high and selling low . Plz explain.
Booking a loss really depends on the stoploss! So if the situation demands, then it does make sense to book a loss!
I have a very absurd doubt. Why should i buy when the price is high and less when the price is low. How am i making a profit then. Shouldnt it be the other way sround?
You buy if you feel that the price is going to go higher. You sell if you feel the prices are going lower than where they are today.
Let me clear the fog:
1.When will you buy?
Ans is not at down trend, rather when you see a up trend and you hope for more bulls (strength) upcoming. So, buy strength.
2. Again when will you sell?
You are watching market going down (weak) and calculating that at some point you will lose all you profit earned. So, before that happens, you must sell at whatever maximum profit you can retain from the trade. So sell weakness.
Now, coming to your confusion, as you told it will be a loss buying at higher and selling at lower, it\’s 100% correct only when you will exit from the trade forever and never come back to market. But, here, I can suppose you will continue trading after having already faced the above loss, thinking that \’let me give another try and this time I surely make an attempt to gain something\’. And that is the point. Now, read above point 1. So, you will wait for bull. And after some reasonable time, when market revives again you will gain. This is nothing but Shorting, as good named. Hope it\’s cleared now. And if not, please tell me.
Hi Karthik,
I am a beginner and these docs are worth of bullish Marubuzo.
As many have asked same question, how does buying at high price and selling at low price makes sense, What I have understood is, you buy a stock as it is forming the Marubuzo and have a stop loss if the stock going down. Is that correct or it means something else?
Thanks.
Well, selling at low price in this context refers to the stop loss price. You only sell at stop loss if you are making a loss. Else you always aim to sell at a price higher than what you\’ve bought.
Isn\’t buying at high price and selling at low price counter intuitive?
Not really – you are buying strength and selling weakness.