
9.1 – The Harami Pattern
Before you get thinking, the word ‘Harami’ does not stand for the word harami used in Hindi :). Apparently, it is the old Japanese word for ‘pregnant’. You’d appreciate the intuitiveness of this word when you see the candlestick formation.
Harami is a two candle pattern. The first candle is usually long, and the second candle has a small body. The second candle is generally opposite in colour to the first candle. On the appearance of the harami pattern, a trend reversal is possible. There are two types of harami patterns – the bullish harami and the bearish harami.
9.2 – The Bullish Harami
As the name suggests, the bullish harami is a bullish pattern appearing at the bottom end of the chart. The bullish harami pattern evolves over a two day period, similar to the engulfing pattern.
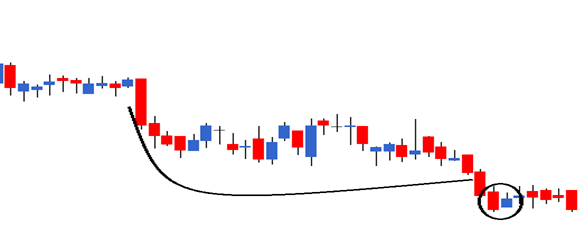
In the chart below, the bullish harami pattern is encircled.
The thought process behind a bullish harami pattern is as follows:
- The market is in a downtrend pushing the prices lower, giving the bears absolute control over the markets.
- On day 1 of the pattern (P1), a red candle with a new low is formed, reinforcing the bear’s position in the market.
- On day 2 of the pattern (P2), the market opens at a price higher than the previous day’s close. On seeing a high opening price, the bears panic, as they would have otherwise expected a lower opening price.
- The market gains strength on P2 and manages to close on a positive note, thus forming a blue candle. However, P2’s closing price is just below the previous days (P1) open price.
- The price action on P2 creates a small blue candle which appears contained (pregnant) within P1’s long red candle.
- The small blue candle on a standalone basis looks harmless, but what really causes the panic is that the bullish candle appears suddenly when it is least expected.
- The blue candle not only encourages the bulls to build long positions but also unnerves the bears.
- The expectation is that panic amongst the bears will spread faster, giving a greater push to bulls. This tends to push the prices higher. Hence one should look at going long on the stock.
The trade setup for the bullish harami is as follows:
- The idea is to go long on the bullish harami formation.
- Risk takers can initiate a long trade around the close of the P2 candle.
- Risk takers can validate the following conditions to confirm if P1 and P2 together form a bullish harami pattern:
- The opening on P2 should be higher than the close of P1.
- The current market price at 3:20 PM on P2 should be less than P1’s opening price.
- If both these conditions are satisfied, one can conclude that both P1 and P2 form a bullish harami pattern.
- The risk-averse can initiate a long trade at the close of the day after P2, only after confirming that the day is forming a blue candle.
- The lowest low of the pattern will be the stoploss for the trade.
Here is a chart of Axis Bank; the bullish harami is encircled below:
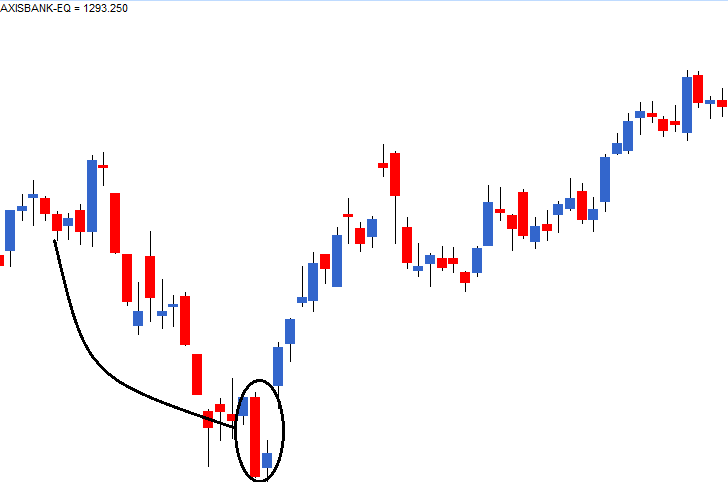
The OHLC details for the pattern are as follows:
P1 – Open = 868, High = 874, Low = 810, Close = 815
P2 – Open = 824, High = 847, Low = 818, Close = 835
The risk-taker would initiate the long position at the close of P2, which is around 835. The stop loss for the trade would be the lowest low price between P1 and P2; which in this case, it is 810.
The risk-averse will initiate the trade the day near the close of the day after P2, provided it is a blue candle day, which in this case is.
Once the trade has been initiated, the trader will have to wait for either the target to be hit or the stop loss to be triggered.
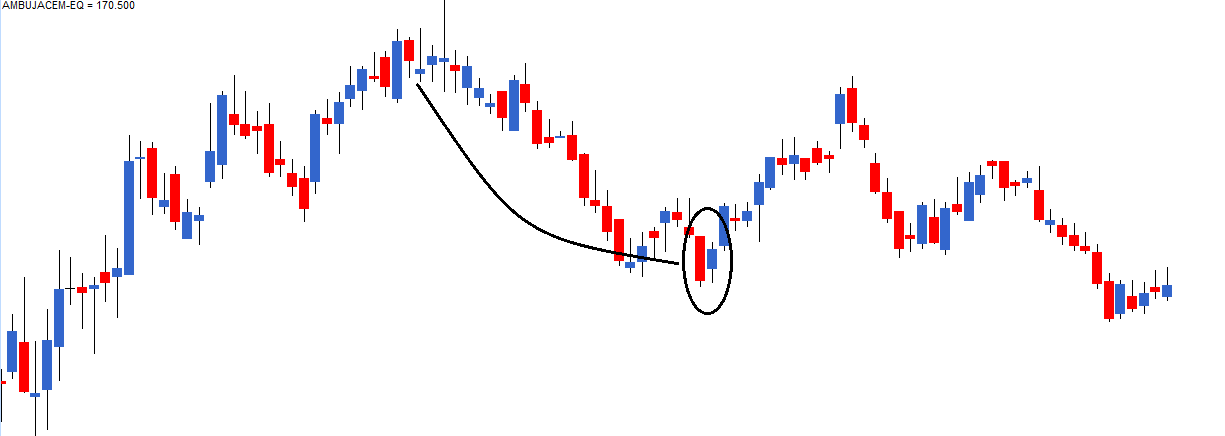
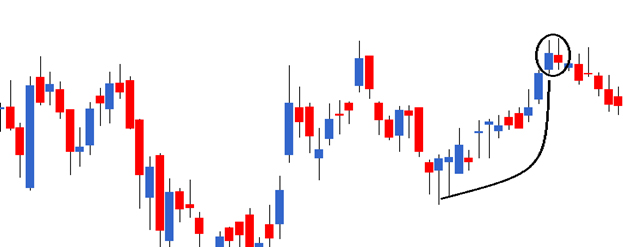
Here is a chart below where the encircled candles depict a bullish harami pattern, but it is not. The prior trend should be bearish, but in this case, the prior trend is almost flat, which prevents us from classifying this candlestick pattern as a bullish harami.
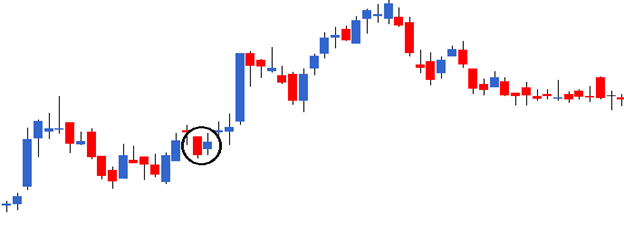
And here is another example where a bullish harami occurred, but the stoploss on the trade triggered a loss.
9.3 – The bearish harami
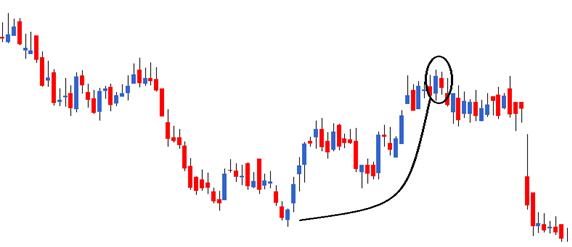
The bearish harami pattern appears at the top end of an uptrend, allowing the trader to initiate a short trade.
The thought process behind shorting a bearish harami is as follows:
- The market is in an uptrend, placing the bulls in absolute control.
- On P1, the market trades higher and makes a new high and closes positively forming a blue candle day. The trading action reconfirms bulls dominance in the market.
- On P2 the market unexpectedly opens lower, displaces the bulls, and sets in a bit of panic to bulls.
- The market continues to trade lower to an extent where it manages to close negatively forming a red candle day.
- The unexpected negative drift in the market causes panic making the bulls to unwind their positions.
- The expectation is that this negative drift is likely to continue, and therefore one should look at setting up a short trade.
The trade setup for the short trade based on bearish harami is as follows:
- The risk-taker will short the market near the close of P2 after ensuring P1 and P2 together forms a bearish harami. To validate this, two conditions must be satisfied:
- The open price of P2 should be lower than the close price of P1.
- The close price of P2 should be greater than the open price of P1.
- The risk-averse will short the market the day after P2 after ensuring it forms a red candle day.
- The highest high between P1 and P2 acts as the stoploss for the trade.
Here is a chart of IDFC Limited where the bearish harami is identified. The OHLC details are as follows:
P1 – Open = 124, High = 129, Low = 122, Close = 127
P2 – Open = 126.9, High = 129.70, Low, = 125, Close = 124.80
The risk-taker will initiate the trade on day 2, near the closing price of 125. The risk-averse will initiate the trade on the day after P2, only after ensuring it forms a red candle day. In the above example, the risk-averse would have avoided the trade completely.
The stop loss for the trade would be the highest high between P1 and P2. In this case, it would be 129.70.
Key takeaways from this chapter
- The harami pattern evolves over 2 trading sessions – P1 and P2.
- Day 1 (P1) of the pattern forms a long candle and day 2(P2) of the pattern forms a small candle which appears as if it has been tucked inside the P1’s long candle.
- A bullish harami candle pattern is formed at the lower end of a downtrend. P1 is a long red candle, and P2 is a small blue candle. The idea is to initiate a long trade near the close of P2 (risk taker). A risk-averse trader will initiate the long trade near the close of the day after P2 only after ensuring it forms a blue candle day.
- The stop loss on a bullish harami pattern is the lowest low price between P1 and P2.
- The bearish harami pattern is formed at the top end of an uptrend. P1 is a long blue candle, and P2 is a small red candle. The idea is to initiate a short trade near the close of P2 (risk taker). The risk-averse will initiate the short near the day’s close only after ensuring it is a red candle day.
- The stop loss on a bearish harami pattern is the highest high price between P1 and P2.
In the first chart in bearish harami five candle before the harami you\’ve encircled ther is a bearish engulfing candle, which failed as would\’ve resulted as sl hit. Now we can clearly see the price went down after harami but it went side for few candle before going down.
My question is which pattern to trust should we combine volume data with the pattern or how do we increase our winning probability?
And also would you\’ve traded the bearish engulfing candle, if not then why?
I am really confused in the harami candle and engulfing candles
What is the confusion about?
Hi Karthik, Can we apply the same principles for weekly candles (for swing trading or positional trading, let say the holding period of 1month to 3months?)
Yes, you can. Candlestick patterns is the same across different time frames.
Hi Karthik,
Two questions:
1. For Bullish Harami- If the open of P2 is equal to the close of P1 & Close of P2 is fine(Less than open of P1\’s open). Should we consider this trade?
2. For Bearish Harami- If the open of P2 is equal to the close of P1 & Close of P2 is great than P1\’s open. Should we consider this trade?
3. When you say there\’s an Uptrend or a downtrend, and If I consider EOD charts, then how many minimum Days(Candles) are we talking about here before we consider it as an Uptrend and a downtrend for a trade?
1) Nope, dont consider it as a trade basis the bullish harami pattern.
2) Same as above
3) For short term trading, at least 2-3 weeks of data.
Got it, but for question 1 & 2, can we not apply rule no 2?(Be flexible)
Yup, we can.
are we supposed to read all this work book , after watching the vedio of the same ?
You can choose either, Piyush.
Hi Karthik,
I have one question regarding condition apply in TA, pattern like Harami, engulfing. there two or more conditions has given to confirm the pattern. For example there is two condtions given to harami pattern but only one meet the condition and other fail to meet the criteria or near to meet it. Should be include that pattern or confirm the pattern or ignore it
These criteria are good to have, it forces in some trading discipline. Don\’t know if you should compromise on it 🙂
Thanks for the explanation, i can not go through with all questions and so apologies if its a repeat. Will the pattern be Bullish or Bearish harami if the P2 has a long wick but still closed under the body of P1 and meet all required criteria?
You can ignore the wick Ramendra. The main idea is to look at the price action and what it conveys. YOu can check this video – https://youtu.be/z0Rwoz6PduM?si=sGyQOUYihq-RNTP4
I have a question which I have always wondered. When the market is falling why will someone buy that share? If market is falling and I\’m selling the stock then someone must be buying that share. Why is the other person buying a falling share and what is his mindset when buying a falling stock?
In a hope that in future it will bounce back and will give more returns.
or may he think that the stocks price is less than its actual value so getting good stock in chipper will benefit you more.
or he might be following the contradictory investing that when most of the people sell he will buy at bottom and when most people will be greedy he will set at the top.
basically in short he think that this might be the lowest price and so he buys that stock.
understood.. thanks for the reply.
there are some companies which many ppl know are not good or fraud. Take example of Bharat Global Developers. I saw that it is hitting lower circuit daily but there are people who are still buying this. Also BGD was banned by SEBI last year for some violations and promoter shareholding is 0%.
There are many such companies. Why do u think people buy these shares knowing that company is fraud.
Please check this module, Ajay – https://zerodha.com/varsity/module/introduction-to-stock-markets/
Nice chapter and explanation. Just a thought.
The engulfling, piercing/dark cloud & Harami patterns are really much similar. Just the concept of changing the trends and its extent. The stop/loss also have same pattern in these concepts.
Yes, in fact at one point you will realize that most of these patters are manifestation of price actions.
how a harami pattern is different from spinning top
Spinning top is a single candle, indicates indecision. Basically it does not convey direction. Harami on the other hand indicates either bullishness or bearishness.
Thank you for this information. Very helpful!
I wanted to understand a little more about the patterns when they occur within the same day. Since there is no gap between the candlesticks within 1 training session, CP or previous stick is OP of next one, Patterns like the Harami can\’t be formed right?
I might have misunderstood. Just wanted to confirm this. Any pattern that requires a gap would mean the trading session closed. So do these patterns also have implications on trades within the day if we are using 1 hour candlesticks for example.
All these patterns can form across any timeframe and not necessary they do on EOD basis (gaps can occur intrday too). The way you trade these would be exactly the same.
Do check this – https://youtu.be/m8uOKO6cCkE?si=CtSx2q3cATypCBD-
why SL was put on lowest of p1 and p2. can we put SL on the Opening price?
Lowest point denotes the lowest point from where the price bounced back. So in that sense, its a price action point of relevance to the trade. Opening price denotes just the demand at open. However, if you want to try placing the SL at open, please backtest it once.
sir, i can\’t understand this point – if we have to buy any bullish pattern at close price of it, then why should we wait till 3.20pm to validate it and then buy. even if we give buy order at 3.20pm at closing price of the bullish pattern how the buy order will be accepted – i mean we should buy at market price right??
The only reason to wait is to affirm the fact that this is a indeed a bullish/bearish pattern that you are evaluating. Transaction should not be a problem.
hello kartik sir aditya here, i had a doubt ,why is it that in multiple candlestick pattern ,like in harami,engulfing , the stop loss is usually either the high or low of the pattern, why is it that we take high or low as the stop loss and not the close or open
Its just that at these high/low points, we see price reversals hence they kind of act at the trigger point.
I am confused regarding the doji/spinning top in this case. Does it means that on the P2 if there is doji/spinning top but has body shorter then P1\’s then do harami patterns seems forming right ? I mean i know doji & spiining top are single candle stick patterns but still a little bit confused.
For all practical purposes, doji and spinning tops are similar. Treat them as the same candle and expected outcome. Reason for this is that the real body in both patterns is similar with open and close being same.
For the Hamrami Pattern:
Bearish H
Why should the close of P2 > open of P1.
Shouldn\’t it imply stronger Bear sentiment is Close is further lower?
Same question for the bullish as well?
In bearish harami, the close on P2 is lower P1 open right?
My bad; What I meant to ask was
Why is there a limiting factor that close of P2 should be greater than close of P1. Or incase of a Bullish. Why is close of P2 supposed to be smaller than close of P1??
Just want to understand why is there a limiting factor?
It\’s not a limiting factor, but rather a price action that in elementary form indicates the sentiment of bulls or bears. I have a video on this, please check if this address your concern – https://youtu.be/z0Rwoz6PduM?si=cdHi_QtfJQRiD53l
Hi Karthik,
Not very clear.
In case of Bullish Harami, why close of P2 should be lower than open of P1? It would be stronger signal no, if it moves beyond open of P1?
Vice versa for Bearish Harami
Saumya, it casts a spell of doubt in bears, and the hope is that day 3 onwards the bulls can take on comfortably. Btw, if it does close above P1, that would be an engulfing pattern.
Hi Karthik,
For the Bearish Harami.
The market is on an uptrend –> P1 formed a big blue candle.
P2 movement –> Unexpectedly opens at a lower price thus causing panic amongst the bulls. This causes the bears to take control pushing the price down and then closing higher than the low of the day; leaving a shadow underneath.
Will your reservation explained during the Hanging Man not hold good here?
i.e – If the price went down to the Low why did it come up?
Hanging man is a single candlestick pattern, this one is across 2 trading sessions.
Fair enough. The sentiment regarding the lower shadow does imply that bulls were in control at some point; right?
More specifically, the recovery from the lower shadow indicates the presence of bulls.
Good learning
Sure, happy learning!
Hello Karthik, I am a complete beginner, I would like to know that, if as per the above trade setup, if we buy the stock, as per the favorable conditions, at 3:20 that i.e. near about closing time, then when should we set the target for the exit?
The target is expected to occur over the following trading sessions.
hi just above 9.3 how was the stop less triggered. the candle next to the bullish one did not go down to the lowest
The red candle at the end did trigger the SL right?
Sorry re the typo. – Will it still be considered a bullish harami if P2’s high surpasses P1 high but closes below P1’s opening?
Not really. But it will still be considered bullish. Do check this – https://www.youtube.com/watch?v=1kQjXFL4Mfc&list=PLX2SHiKfualEyD05J9JsklEq1JFGbG6qJ&index=10
Hi Karthik
Will it still be considered a bullish harami if P2\’s high surpasses P1 high but closes below P2\’s opening?
That would just create a long upper shadow right?
Kiran, can you please share your personal email ID. I\’m interested to know about your API.
Hello Karthik,
I was going through comments since 2014 and noticed that the images and charts shared at that time are no longer accessible. I believe these would be helpful for better understanding. Is there a way to view them or a workaround for this issue?
Ah, let me check this. Btw, can you try using another browser?
Oh, yeah right! Thank you so much, means a lot.
And you rock! <3
Happy learning!
Question –
October 18, 2019 at 7:19 pm
Sir
In bullish harami pattern, if close of P2 is higher than open of P1.Why won’t it be more reliable than ‘close of P2 lower than open of P1’?
Your reply –
October 19, 2019 at 9:21 am
The idea with this pattern is sudden, intense, and short price action by bulls. A close above P1’s open will not have the desired impact.
Question –
Why would it not have the desired impact as it clearley conveys that the bulls are pushing right? Am I missing something here?
This pattern tries to ascertain that the bulls have made an entry in otherwise a bear strong hold. This creates some panic and confusion for the bears. A close above also does this, but we look at that as an piercing patter.
😊 Thanks!
Have a successful and a great day.
You too! Good luck.
Dear Kartik Ji, I owe a lot to you for my success as a trader. You and Abid Hasan Ji are my Gurus.
I would love to watch your market analysis like KLRHM by Abid Ji. Sincerely.
Thanks, Ashutosh. I\’m happy to note that 🙂
Not sure if I can do that, but definitely will give it a thought 🙂
As per my understanding, harami pattern is an inside bar,bullish or bearish. Or else, here also the real body is contained within the previous candle and the wicks are immaterial?
Yes, in the bar chart, this is considered as an inside chart.
Hi, sir. The modules are easy for beginners to learn about the stock market. Thank you for your efforts. I have a question: can we take a trade on a Bullish Harami if the downtrend is small? Also, do I need to consider anything else before taking the trade?
I\’m glad you found the modules easy Ragunathan. Ideally, the downtrend should be at least 5% or more to qualify as a \’prior trend\’.
Hi,
Thank you for the content.
Axis Bank Chart in Bullish Harami section(Chart 2), the first candle(with second assumption on candlesticks – to have some Flexibility) seems a bearish Marubozu. If yes, then the Bearish Marubozu affirms the bearish trend. However, the next day/session, Bullish Harami takes place and trend reversal happens. Could this be taken as Multiple Candle Pattern takes precedence over Single Candle? Or the first candle is not a Marubozu?
Thanks for your consideration. 🙂
Yes, but I\’d also suggest you check this video on how to consider Candlesticks patterns – https://www.youtube.com/watch?v=1kQjXFL4Mfc
Hi Sir,
In Bullish harami pattern, what should be the minimum length of p2, for other candlesticks I have kept 1% as minimum length criteria, but for harami can we consider p2 of 0.5% as well?
Thanks
More than the length, you need to ensure that P2 is contained within P1. Given this, you can look at P2 in isolation.
Thank you for correcting me.
But can we Predict expected price movement of the stock?
Is there any module related to this?
Till now in the Modules, I haven\’t seen any such topic.
There are techniques like TA which helps you do this, apart from that there are quantitative techniques too. But regardless, they all come with some degree of speculative aspect, which you need to be aware of.
Hi, Karthik!
When we talk about that one should not exit the trade in between unless the target hits or stoploss gets triggered.
In a trade setup We get to know (From Module) what should be the Stoploss but didn\’t get what should be the target.
I know Target depends on persons greed but isn\’t there any theory related to Target.
I mean a decent target.
Target does not depend on greed, target depends on the expected price move. Your final P&L depends on greed 🙂
Hi, Can you please share the api with me and how to implement it? as zerodha pi is no more , does it work in kite (google chrome/ firefox etc??)
https://kite.trade/ – you can check this.
Alright, so what can I possibly do to capitalise on a single stock [Qty-1, since I\’m still learning 🙂 ] that I have a bearish view for the next few days.
YOu can use that to learn to place different order types.
Hello Karthik,
Why is it that in equity I can\’t short and carry forward the position for a few days just like I do with long positions?
Its becuase of the the settlement process, Royce.
In above axis bank chart of bullidh Harami, hoe the low is less than the close.
P1 – Open = 868, High = 874, Low = 810, Close = 815
Low is the lowest traded price during the day. So it can be a number lesser than close or open right?
Isn\’t the engulfing pattern stronger than the harm pattern? After reading both tha\’s what I thought
Ah, nothing like that Suneel 🙂
Hi Karthik Sir,
In last example image of this chapter a risk-averse have seen a bearish harami on D2 but as he is risk-averse he will wait for D3 and on D3 blue candle has appeared but market went and on D4 red candle has appeared so is it okay to take trade on D3 close as D2 close is greater than D3 close and we have to short on only so we will make profit as because of this gap in D2 close and D3 close we can conclude that bears are take the game from bulls?
Yeah, you can. End of the day, some of these things are flexible and with experience you will know when to initiate that trade.
I am interested in knowing about how do you achieved that can you help me.
i have a very basic question….
what is the reason forming a blue candle and a red candle?
The colour of the candle depends on the price movement, Aryan. Bullish price movements have blue candle and bearish price movements have red candle.
Thank you!!
Happy learning!
Hi Karthik,
After recognizing a candlestick pattern, you say that a risk averse trader would verify that is appropriate red or blue candle day and trade accordingly.
Now , the risk takers makes the trade around 3.20 PM on the same day a particular candlestick forms.
What about the risk averse trade? At what time (range) should he/she be initiating the trade?
They can initiate the trade around the same time, just that the trade should in overnight derivative contracts that you can carry forward overnight.
Karthik sir, I did not understand this. Why will this not be called a price reversal ?
The trend changes and the prices reverses into the opposite direction. Thats why.
In case of Bullish harami, according to the conditions mentioned above it says that closing of P2 should be lower than opening of P1. Why is that necessary? Even if the closing of P2 is higher than opening of P1 , it should work right? according to the same thought process.
All these price movements make up for the actual pattern, Sriraj. Eventually, you will have to understand the \’why\’, of the price action rather than how. I\’ve made a video on this topic, I\’d suggest you watch the same – https://www.youtube.com/watch?v=z0Rwoz6PduM&list=PLX2SHiKfualEyD05J9JsklEq1JFGbG6qJ&index=3
Karthik sir very very thanks 🙏
Virendra, happy learning 🙂
Unable to see these charts on different browser also. Please help and guide Karthik sir 🙏.
These charts are not browser dependent, should work seamlessly across browsers, Virendra.
I means attached chart by readers
Got it. Please see the previous reply.
Karthik sir you are doing great job and the way of your teaching is excellent.
My question is — in comments section I am unable to see the chart of readers. How can i see these chart . Thank a lot 🙏
Can you please try a different browser? Also, most of the links are uploaded on user\’s Gdrive, not sure if they changed the location of those files.
Thanks for the excellent tutorial.One thing i could not fathom was the neccesity of closing price of P2 lower than P1 opening price.
So these little things add that overall quality of the pattern. Remember, each movement in the candle is a reflection of price action, so it matters.
\”The current market price at 3:20 PM on P2 should be less than P1’s opening price.\”
Why is this condition necessary to initiate a trade (for bullish harami)?
If the current price is higher than P1\’s open, doesn\’t that indicate a much more bullish sentiment than harami?
All these conditions are basically a reflection of the price action in the market. A pattern is recognized as a pattern only if they all fall in place 🙂
Sir , can we use these patterns for weekly and monthly candles also.
Yes, you can Manoj.
Hello sir,
In Bullish Harami why should be the close of P2 should be lower than open of P1 ? Same Q. for Bearish Harami why should be the close of P2 should be higher than open of P1 ?
what if the close of P2 is higher than open of P1 in Bullish and close of P2 is lower than P1 in Bearish … ? what is the interpretation if this happens ?
Thank you for this amazing content. 🙂
Harit, the pattern gains significance only if the close is below P1\’s open. Its the price action that matters here. I\’d suggest you watch this – https://www.youtube.com/watch?v=z0Rwoz6PduM&list=PLX2SHiKfualEyD05J9JsklEq1JFGbG6qJ&index=3
Thanks!
Happy learning 🙂
Hi Karthik, thank you for the beautiful tutorials! I wanted to ask whether a bullish engulfing pattern can be considered a stronger indicator of future bullishness of the market than a bullish harami, as the closing price on P2 in engulfing actually crosses the opening on P1, thus recovering completely from the decrease in price from the previous day?
Sort of yes, its one of the better indicators of bullishness 🙂
is it important to consider shadow for both engulfying and harami?
like in engulfing p2 body engulf p1\’s half shadow only! and in harami p2 shadow is higher than p1! can anyone explain please.Thank you
You can ignore the shadows since the shadows can be caused due to spike or freak trades. Consider just the real body of the candle.
Hi Karthik, In General, when a stock is making higher high formation on daily basis then my entry should be above the closing price OR the high of the previous day Daily timeframe candle. Trying to understand the significance of high (from where price rejection happened) Vs closing price in terms of my entry for next day.
It depends on the pattern. Generally, when you are riding momentum, the buys would be on higher highs itself.
why the current market price of p2 should be less than opening price of p1.
Thats the pattern mandate, Kamalesh. Thats how the pattern is defined.
Hi Karthik Sir
If a bullish engulfing pattern is accompanied by a doji but the open and close of the doji is greater than the open and close of P2 candle, will it imply a reversal pattern with wide range.
Yeah, I\’d still consider it as a reversal pattern 🙂
Hello Karthik,
Can you you point me to a topic on targets. how to set the targets? whet to consider before setting the targets.
You can check this – https://zerodha.com/varsity/chapter/support-resistance/
Sir, are all these analysis applicable on every chart. I mean on 1 minute chart, 5 minute chart, 15 min chart, daily chart, monthly chart. Correct?
Yes, they are. But from my experience, these are better on longer-term charts.
are bears the ones selling the stock (after buying) or the ones that short the stock?…
Bears are selling, Ayush.
A Question
) For the risk averse traders, what will be the stop-loss? ( ref. eg. Axis Bank Chart )
Thank you for your assistance Sir, It really helps, as a novice traders this learning part plays a very crucial role.
THANK YOU !!!
Low of the pattern if you are going long, high of the pattern if you are shorting. Happy learning 🙂
Harami pattern and Inside candle are same or different ?
They are somewhat similar, Deepak.
Does this pattern only work on \”Day\” intervals?
Would this pattern work on say a 5 minute chart? or 30 minute chart..
How do we know which candlestick pattern works on which time frame effectively?
No, these apply to all these timeframes, Akshansh.
What time frame and candlestick duration are you referring to in in single and multiple candlestick patterns brother?
It is end-of-day candles mostly, but in a few places its intraday as well. I guess I have mentioned this whenever I have posted a chart.
in both Bearish and Bullish Harmis What would be the target?
Target depends on your outlook on the market. It could be based on S&R or it could be a fixed % target as well.
I didnt understood the 3rd chart under the bullish harami pattern, i mean the prior trend is bearish then i can find a new low how is it not forming a bullish harami pattern?
The P1 and P2 candles together form a bullish Harami, Akhil.
Hello Karthik Sir,
Can we consider this as a Bullish Harami Pattern
https://drive.google.com/file/d/1PKkquLM2pszgPQZzlqFXI2hvZNk09rbU/view?usp=sharing
Thanks in advance!!
Yup, but would have been nicer to see a slightly bigger blue candle.
Hi Karthik,
Thanks for the great tutorials.
I have a question, in multiple candle stick patterns (harm/engulfing patterns) you mention, two candles have to be formed on 2 different days. As in, the 1st candle should be formed at 3:20 pm on day 1 & 2nd one on the next day. This is not necessarily intra-day, is it?
Can\’t we use these patterns during the day ( eg at 11 am) over different charts like 5 or 15 mins & make our trades?
Pls note, I am very new to trading & its concepts. Hence, the question.
Look forward to the answer.
Thanks!
Yes, this is not necessary for intraday.
Long position in this chapter implies for intraday trade & not for CNC, am I right?
It can be both.
I\’m new to technical analysis. But when I look into the charts, the trends and patterns change drastically when I change the frequency from 1 day (possibility of price increase) to 3 hours (possibility of price decrease) to 2 hours, sometimes pointing in totally opposite directions. So what should we do in that cases
I agree. So you need to be clear about your trading strategy – if it\’s intraday, then look for intraday charts and it will be great if both EOD and intraday charts point to the same outcome. However, that need not be true about positional trades where you hold positions for a few days. In this case, you can look at just EOD charts.
THESE GAPS LIKE P2 OPENING PRICE HIGHER THAN P1 CLOSING PRICE.. THIS DOESNT HAPPEN IN CRYPTO.. THAN WHAT?? THESE PATTERNS WITH THIS EXPLANATION ARE NOT VALID FOR TRADING CRYPTO??
I\’ve never traded crypto, but even if I were to, I\’d use it the same way.
Hello sir, hope you are doing great!
Small correction required in 9.3 IDFC limited example. On P2, the low>the close, which doesn’t make sense.
Checking this, thanks for pointing.
Dear Sir, Please explain about tweezer top and botoom
Hmm, maybe I\’ll put up a note sometime.
What is target in this kind of patterns?
today i saw head and shoulder pattern in HDFC stock(EOD).. do you think it is head and shoulder pattern?
I\’m not really good at identifying H&S, hence not covered it Varsity as well 🙂
Thanks sir,
So to qualify harami pattern
body of P2 should be more than spinning top and P2 definitely should not be like doji, hammer or shooting star like pattern (i am talking about
Only shape and size of P2)
Yeah, ideally it should be within P1, with a small real body.
Hello sir,
I have one doubt, is the nifty 50 had formed bullish harami toady (21/12/21) in eod chart
Thanks in advance …
Not really, it does not qualify in terms of the real body, right?
Harami patter use in intraday?
You can use the same. In fact, all candlestick patterns can be used for intraday.
In downtrend, If p2candle opens above the previous close (assuming the previous candle is red) and then engulfs, then it forms blue candle engulfing previous candle(but it does not opens below or equal to previous candle for considering engulfing pattern) then will it consider as trend reversal(bullish or start of uptrend)?
Pavan, you need to look at this in the larger context of the trend and take a call. It is very hard to generalize it.
Hello sir,
1)In downtrend, candle opens above previous close and engulfs previous candle then it become trennd reversal?
2)for Gap up,gap down openning, are sometimes not become trend reversals, for considering them as trend reversal what parameters we need to consider?
1) If it opens above the previous close (assuming the previous candle is red) and then engulfs, then it implies the 2nd-day candle is also bearish, hence the trend continues right?
2) Yes, gaps can lead to trend reversals. But it\’s hard to predict them.
Will these candlestick pattern be applied in intraday trades?
Yes, Sanket, it is possible.
In Harami patterns, the two candles must be opposite?
Lets an example
P1:Open-180 Close-160
p2:Open-172 Close-164
1)Here P1 and P2 both are red and will form bullish harami?
2)If yes is it applicable to bearish harami also?
Yes, they should be of the opposite colour.
Hi Karthik,
Very well explained..
am yet to read further..i am investor but want to understand concepts of CE and PE. if i face difficulty, i will ask for help.
PLease do, Deepak. Happy learning 🙂
Which other indicators can be used to confirm the reversal with harami.
Its just the candlestick patterns that is useful.
Please ignore this comment as you have already answered this in the previous comments.
Are these patterns relevant for intra-day trading where all the trades initiated at the beginning of trading session have to be squared off by the end of the trading session ?
Not really, you can use the same for day trading as well.
Hi
What does shorting mean? selling the stock
Shorting means you sell fist and then buy back later.
Hi Kiran,
Can you share the API details for the candle pattern?.
Thanks
Sorry, thats not available Vivek.
Kiran, can you please share your email id
Hey,
When you mention either stoploss will be triggered or target will be reached.
What do you exactly mean by \”Target\”
Kindly Explain.
Thanks
Target is the price target Frank.
Hello Sir,
Why is it important for P2 to close below P1\’sprice in Bullish harami?
What if the closing price is above the opening of P1 in Bullish harami. It will indicate a strong bull presence. then why are we restraining this statement.
P2 can close below or above, based on which its either bullish harami or engulfing. If its above, its the bullish engulfing.
Dear Sir,
You are doing really a great work by educating all of us about the stock market, explaining its complex concepts in easy to understandable way.
Its very appreciable work done by Zerodha.
Thanks a lot!!!
Happy learning 🙂
What do you mean by trend reversal? Can you give example.
Trend reversal is the price reversing and moving in the opposite direction. For example, the trend reversal for a bullish stock is bearish.
The stock is at uptrend, so what pattern can we consider this as-https://www.tradingview.com/x/csHKA6xV/
Is this an engulfing pattern? I am confused as the opening of the second candle is above the closing of the 1st candle:)
Yes, looks like a bearish engulfing pattern. Would have preferred to see it close below the previous candles open though.
okay sir after complete this module I will do it thanks for your reply.
Good luck, Babu.
Sir what is the different between consolidated and standalone?.. I have absolutely no idea about it sir, can you explain me clearly.
Please do read the module on fundamental analysis.
Hi Karthik,
In Harami pattern, can we say P1 engulfs P2?
Yes, you can look at it that way as well.
Hey Karthik,
Can this be called any pattern? when in a downtrend p1 is a red candle and the next day p2 directly opens higher than the close of the red p1 candle (around 50%) and closes above the high/open of the red p1 candle?
Thanks a lot 🙂
Yeah, some sort of an englufling pattern 🙂
Is there a way I can upload an image here?
Not possible I think. But maybe you can upload it on a drive and share the link.
In the last point of bullish harami the stoploss is triggered… But what if we dont put the stoploss, and wait for a long run as in the module it is said that bullish harami have a long run.
Yes, you can choose not to place a stop loss, but the issue is that you will have an unprotected trade and in case of a crash, losses can be high.
Sir, how to set target price , here?
You can use S&R levels for this.
does all this can taken into account while using 15 and 5 min TF.
Yes, you can.
sir, to validate these pattern you are saying to see the market at 3:20 so that means we have to trade within the last 10 mints of the day? or should we take the trade on the next day say P3?
You take these positions by reviewing the market end of the day, positions can be initiated in F&O.
Hi, Don\’t you think it\’s better to have a Harami bullish pattern where in a downward trend the P2 close is higher than the P1 opening. It means bulls are so heavy in P2 that they took the price above P1 Open. Somewhere you mentioned that P2 close it should be lower than P1\’s open for it to be a trend reversal pattern.
I\’d rate both bullish harami and engulfing as equals, Asbhishek. While one pattern may work on stock, the other may not. Hence its a good idea to keep an open perspective about these patterns and know which one works best for a given stock.
Dear sir,
i guess there is mistake in IDFC LTD berish harami OHLC details in Day P2 candle.
Let me check, Omkar.
Hello sir,
Kindly explain difference between inside bar pattern n Harami candlestick pattern.
Thanks in advance
Logic wise, they are similar, Rahul.
Hi,
When you say 2 days pattern for engulfing/ piercing/ Harami etc. then, does it mean it has to be ‘2 full days’ or it can be 2 sessions also of 15 min. or 30 min. etc. ?
Yes, 2 full trading session if you are looking at EOD chart. Basically 2 full candles of whichever time frame you are looking at.
What is the importance of stock price on day 2 closing below the opening of stock price on day 1 during a bullish harami pattern? Similarly for bearish Harami pattern, what is the importance of price on day 2 closing above open price on day 1?
This is the price action part. Have explained this in the chapter itself right?
first of all thank you so much sir, and zerodha
you are a great teacher and im really greatfull
so,as i learned these candlestick pattern, sir you taught that risk averse can take trade the day after pattern formation… like if i notice bullish engulfing pattern and i want to take trade on p3 but on p3 the day is red so i avoid…. but what should we do further ? can we completly ignore that pattern and look for another opportunity or day p4 should be fine sir ?
Yes, if there is too much time after the pattern formation, then maybe you should look for something else.
Here is both engulfing and harami looks like confusing pattern . Can you elaborate more about this two things to differentiate when use of this pattern will more useful .because when i read this topic this two pattern looks same their is no different
Englufing pattern ensures that P2 candle covers P1 completely, while its only half in Harami.
Hi Karthik,
In all the examples you mention 3:20 pm before the market closes.
I intend to use TA for intraday trades. How good these analyses are for trades let\’s say at 11:30 am?
And will a 15 min candlestick pattern provides the same insights?
3:20 here refers to the close of the EOD candle. If you are using a 15-minute candle, then the reference point would be the 13th or 14th minute. Basically, the idea is to act after confirming if the candle is forming the desired pattern, which you can, near the close because the chance of forming something else is low.
sir, are these one day candle charts? are these candles of one single single day? and does these patterns works on 15 min or 5 min intraday basis? or is this for going long
These are EOD charts, but it is the same with intraday as well.
Thanks Karthik. Thanks for creating such an amazing content.
Happy learning, Girish!
I was checking INTELLECT daily candle stick chart and after 3-4 days (11th, 12th, 15th, 16th march) of uptrend, a bearish engulfing pattern is getting formed (16th, 17th March) followed by Doji on 18th march. Does that suggest strong sell sign for INTELLECT on 19th March? I can\’t post the image, but it is pretty much visible in Kite.
16th March
Open = 527. 05
Close = 617
Low = 527. 05
High = 626.20
17th March
Open = 606.50
Close = 588.60
Low = 531
High = 647.55
18th March
Open = 597.50
Close = 595
Low = 564.40
High = 624.20
I\’d not consider this as a strong sell, the bullish candle on 16th looks quite strong given the volumes as well. Would wait and watch for price action before taking any action.
I am feeling i have read so much but i won\’t be able to implement it in actual market and will loose money
Ah, take one thing at a time, Saksham. For example, concentrate on just 1 pattern, forget about everything else. Try and spot just that 1 pattern and see how you can trade that. Get good at it and then move to the next one.
Hello, First i am saying thanks for varsity app. i am getting good clear from this.
Here my doubt :
Bullish and Bearish Engulfing pattern want to see in Higher time frame (HTF) dayTF and above, only. we can\’t follow this pattern at LTF ? because your examples at LTF only… you are preferring day only?
YOu can apply and trade these patterns on an intraday basis as well.
Hello sir, a small correction on 9.3 the close price on p2 should be greater than the price of P1 (bearish harami)
Let me check this again, Harish. Thanks.
in the last bullish harami example, how did the stop loss on the trade trigger a loss?
Ah, I\’ve explained this in the comments, please do check the same. Thanks.
Is Harami pattern a really strong pattern to be traded ?
No pattern is inherently strong or weak, it depends on the overall market context. Remember these patterns only improve the odds of success in the market, no guarantee as such 🙂
Hi Karthik
After going through engulfing , piercing and harami . My understanding is that engulfing is the strongest among the three with the other two in descending order am I right in interpreting the same ?
Hard to say that, you need to look at it from the overall market perspective and then take a call 🙂 But yeah, I personally like the engulfing 🙂
Are all these candlestick pattern also applicable for a 5 minute window rather than a window of 1 day?
Yes, they are. All pattern applicable across all timeframes.
Hmm sir, a spinning top after a big red candle doesn\’t mean it\’s a bullish harami? U need something bigger than that?
Yup, the candle on P2 should be a small red candle.
But sir the approach behind a bullish harami is such that it\’s formed after a bearish candle, so how can we look at a series of dojis? I mean one bullish harami after a bearish candle at the end of the trend signifies it.
Yes, but if the candle on P2 is a spinning top, then I\’d prefer to see 2-3 spinning tops after P1. That\’s what I meant.
But sir a candle like a spinning top can also be a bullish or bearish harami at the end of the trends, right? A bit confused sir.
Thats right, Nikhil. But it cant be based on just 1 spinning top, it has to be based on a series of spinning tops and doji\’s.
Sir, why is the opening on top in the red candle? I have been trying to figure out.
That is the pattern, top opening and closes down.
Sir, I have read this topic before but I came back here for revision n noticed something I hadn\’t noticed before. A bullish harami at times looks like a spinning top, you agree?
Hmm, not really since the candle on P2 is not as small as a spinning top, although it can be.
Kiran can u share me the link for the API
What time frame in these candlesticks will validate something like a harami being formed? A day based candle can only be used right in this case?
You can use any timeframe, Pranay. These patterns are valid across all time frames.
Hi Sir ,
Can Harami , Engulfing , piercing & dark cloud be applied on intrady or it is only viewed on 2 day timeframe . And if it can be used in intrady what should be the body range because in 5 min chart it\’s very rare to find 1 % body range
Yes, it can be applied to intraday trading as well, Ayush.
Is it necessary in bullish harami pattern that the open on day 2 should be higher than close of day 1 ?
Yup, that is a necessary condition.
The market gains strength on P2 and manages to close on a positive note, thus forming a blue candle. \”However P2’s closing price is just below the previous days (P1) open price\”.
Why is it necessary for P2 Closing Price to be lesser than P1 Opening? Even if P2C>P1O, would it not be an indicator of bullish sentiments in the marker?
Think about the price action, the bears would think they are still in control, while at the same time losing grip slowly. Leads to a price squeeze.
Could you please tell us that what time period you have put to get this chart pattern? I am very confused in this , which is correct time period to see which chart pattern has occurred.
Thanks in Advance.
These are end of day candles, Madhav.
Sir should we consider wick or shadow in harami..does the wick also should be within the range of P1 Or close within the range of P1 candle
Hmm, not really. Pay particular attention to the really body.
How many days must be well spaced or candles for defining the trend
At least 3 weeks.
After reading about these candlestick pattern, it is still not guaranteed whether there will be a reversal in trend or not, it is still just a probability ,right ,its basically guessing based on previous trends(like in some patterns, reversals happen, so it is probable that it might happen again since we saw this pattern ), is it right.
That\’s right, there is no guarantee, these are just probabilities at the end of the day 🙂
Please take a look at:
https://drive.google.com/file/d/1FeDlIWrrypyXE-sBbnpeIrvhj-Gi3A5z/view?usp=sharing
Look at these 3 candles. The first red candle and the second green candle form a bullish Harami. The Harami was formed on 29th and 30th Oct at the S1 level of 1854.77. 30th Oct was the last trading day in the month of October. In the month of November, the S1 level is at 1730, which is very different from the S1 level in October, when the trade was taken. The immediate next trading after Oct 30th happened on 2nd November 2020 which is a different month altogether with a different S1 level. In this case, the candle on Nov 2nd 2020 is a red candle , whose low is lower than the lowest low of the Harami formed in October. Should a loss be booked and the trade be exited, even though the S1 level in the month of November is much lower now, than it was in October?
How do we approach the trade here?
Regards,
Kiran Hegde
Why are you looking at pivots fro S&R? You can plot these levels manually, right? Its much better that way. Else if you want to use pivot, then these level shifts are inevitable.
Hi Karthik,
In the bearish Harami Pattern, we set the stoploss to be the highest of the high between P1 and P2. This would obviously be higher than the current trading price (on P2). So what significance does stoploss have when it is higher than the LTP?
Thanks!
Since you are short, you want the SL to be higher right?
Hi Sir,
This is in reference to your previous response regarding trailing SL.
Karthik Rangappa says:
August 18, 2020 at 9:15 pm
Trail SL should be based on the number of points or on a % basis. For example, you trail the SL when the stock moves every 5 points in your favour or say 1% in your favour.
Suppose if I go long at Rs 100 with SL 95. Stock moves to 103 and I trailed my SL as 98. But again stock retraced back to 101. What I should do in such situation ? Stick to revised SL 98 or shift SL as 96 ? or again shift SL at original SL that is 95 ?
Regards,
Rajnish
Nope, you stick to 98. Also, I\’d move to 98 if the stock moved to say 105.
Hello Karthik,
Thanks for the responses so far.
I need clarity on the following part in your previous response:
My question: Would it be fair to say that with a prior down trend, as long as the P1 red candle ***engulfs*** the P2 green candle, a bullish Harami is formed?
Your response: If it engulfs, its an engulfing pattern right and not a harami pattern?
1)What exactly is the difference between \”engulfing\” and \”appears contained (pregnant) within P1’s long red candle\”?
For a bullish Harami, the phrase that has been used is: appears contained (pregnant) within P1’s long red candle?
2)Why wouldn\’t you say that in a Bullish Harami P2 blue candle is \”engulfed\” within P1\’s red candle?
Why is there a need to use the phrase: appears contained (pregnant) within P1’s long red candle
Regards,
Kiran Hegde
Yes, that would be a bullish harami.
1) The price action is slightly different. In an engulfing pattern, the conviction of the bulls is higher.
2) How else would you describe P1 and P2?
Hello Karthik,
Thanks a ton for your previous answers. Its been very very helpful.
I have been getting a lot of questions in my mind as I start trading in the markets. Apologies if this is too overwhelming for you to answer.
However, I think your answers benefit a lot of traders just getting started and hence, is helping the investing community as a whole.
1)How is the bullish harami different than the bullish engulfing? Why is there a need for distinction here?
The reason I ask this is, for both a bullish harami as well as bullish engulfing, the green candle appears ***all of a sudden on P2*** when it was least expected. The P1 candles in both cases is a red candle.
2)In terms of ***sentiment***, how is the bullish harami different from bullish engulfing?
Remember, the P2 candle is green in both cases.
3)Would it be fair to say that with a prior down trend, as long as the P1 red candle ***engulfs*** the P2 green candle, a bullish Harami is formed?
4)For a bullish Harami, what characteristics should the P1 and P2 candles have?
Something on the lines of : P1 candle\’s body should be x times bigger than the P2 candle\’s body
Should the P2 candle be small or big or how big should be the real body of the P2 candle?
5)In the chart of Axis bank at: https://drive.google.com/file/d/135iVA0y8C8x5b1t7uIw1OYPTc9D4UXOg/view?usp=sharing, Kite indicates a bullish Harami.
However, the second green candle looks like a spinning top to me.
Hence, this looks like a bug in Kite, giving a false indication as bullish Harami.
Could you please confirm?
Thanks,
Kiran Hegde
1) These two are similar, except for the amount of conviction developed for the bulls. That\’s the only difference.
2) In terms of sentiment, if I were to trade, I\’d deploy the entire designated capital on an engulfing pattern and maybe about 60% on a Harami pattern.
3) If it engulfs, its an engulfing pattern right and not a harami pattern?
4) P1 should be a red candle, P2 should open lower than P1\’s close and power its way to recover at least 50% of P1\’s losses. Thats all. No other specifics.
5) Its not a bug, that\’s the way the indicator works. I\’d suggest you ignore it.
Hello Karthik,
Thanks for the prompt response as always and patiently answering my queries. I still have few questions which I guess need clarification.
Now what confuses me is that, all through varsity, it has been mentioned that the lookback period should be the last 8-12 sessions for determining a trend. Now, this makes perfect sense for \”day\” charts.
However, the above statement just does not add up when it comes to \”1m,5m,10m,15m,30m\” charts.
Two questions:
1)Does your previous response mean that the 1m,5m,10m,15m,30m charts can also be used for \”swing\” trading where the position is held for about 8-10 days?
If yes, wouldn\’t EOD charts make more sense for swing trading?
2) It\’s my understanding that 1m,5m,10m,15m,30m are only to be used for intraday trading and the lookback period should be the last 8-12 candles on the \”very same\” day prior to the point of trade.
Am I mistaken here?
3)Why would we want to look at the charts of the past few days for \”1m,5m,10m,15m,30m\” charts when there are enough candles available on a single day itself?
Regards,
Kiran Hegde
Do read my previous comment, hopefully, that will give you the answer you are looking for.
Hello Karthik,
Thanks for responding back.
I am confused with your last response. Couple of questions.
1)We are talking about 15 mins chart here. You have stated lot of times that to determine the trend, we look at the last 8-12 sessions. For a 15 min chart, we have about 25 candles on a particular day. If that\’s the case, shouldn\’t just looking at 8-12 15 min candle formations on a single day be sufficient?
Why do we need to look at the last 2-3 days for a 15 min chart?
2)Also kindly clarify on the following timeframes:
a)Weekly
b)monthly
Regards,
Kiran Hegde
Kiran, depends on how long you want to position the trade. If its a proper swing trade that you have in mind, say position held for 8-10 days, then go back 25 days. Else a shorter lookback period is also ok.
Hello Karthik,
It has been mentioned that to determine a trend, we need to look at the last 5-8 trading sessions.
How do I correlate this to a 15 min timeframe? Should it be the last 5-8 candles on a 15 min chart?
How about the following timeframes:
-Weekly chart
-Monthly chart
Regards,
Kiran Hegde
If you are looking at 15 mins chart, then you need to look at the 15min chart for at least 2-3 days to get a sense of the prior trend.
Hi,
In the candlestick patterns, while analysing daily charts, how many days of data should be studied to classify the data as uptrend/downtrend?
Thanks.
I\’d suggest you look for at least 1 to 1.5 years of data.
In daily chart for PNB Housing, the combination of candles for 12th June and 15th June are said to be forming a Harami pattern when you enable the candlesticks in Studies. But the closing price of P2 candle is quite less than the opening of P1 candle. How is that a Harami pattern.
Its not very accurate, I\’ve mentioned it in this chapter – https://zerodha.com/varsity/chapter/the-central-pivot-range/
Why can\’t Q1 in the question above be classified as a bullish harami (provided that P2 doji is completely contained within the limits of P1 ? Strictly speaking it will be a bullish harami. If not, why ? Can you please clear this doubt ?
You need to have a proper candle on P2, unlike a doji or spinning top. Only then, by definition, it is considered a bullish harami.
Hello Karthik,
I have a question with respect to the daily charts of Eclerx.
Eclerx formed a bullish Marabuzo on 13th August 2020. On 17th and 18th August, a bearish Harami has been formed.
Now in cases like this, what candlestick pattern should be considered and why?
Any advice would be very much appreciated.
Depends on which pattern you acted first. If it is the Marubuzo, then after you initiate, stick to your Tgt or SL. If its the bearish Harami, then stick to that. The point is that if you\’ve acted on a certain pattern, ignore everything else till you trigger your Tgt or SL.
Thanks for prompt response.
With reference to my query no.1, if there is green colored Spinning Top in place of Doji then can we consider it as bullish harami ?
Regards
Not as convincing as a small green candle, but yes, you can considering the overall circumstance.
Hello Karthik,
Thanks again for the wonderful training material and for your continuous support.
Please clarify these queries for me :
1. In downtrend, on P1 red candle, P2 Doji (green colour, I know colour is not important in Doji). Can we consider this pattern as bullish harami ?
2. What should be basis of trailing SL ? For example stock X bought on Monday @ Rs 100 and SL 95. On Tuesday, EOD close price of stock is 105 and low price is 101. Should be trail SL as 101 for Wednesday onwards ?
Or, we should trail SL on basis of next support/resistance ?
What should be correct method to trail SL? Please guide.
3. On P2, if i miss to take position at 3.20 pm, should i place order next day at 9 am ?
Regards
1) No, this cannot be considered as a harami
2) Trail SL should be based on the number of points or on a % basis. For example, you trail the SL when the stock moves every 5 points in your favour or say 1% in your favour
3) Yes, you can look for the immediate next entry point
Hello Karthik
\”The risk taker will short the market near the close of P2 after ensuring P1 and P2 together forms a bearish harami. \”
So if I\’m being the risk taker here , I sell the stock at end of the day? how exactly does that work? Is there something like STBT? or can these be used for intraday ?at what timeline?
I went through all the comments searching for the answer , but only a few were there and those did not give me a clear picture to my doubt. I believe most beginners will have the same doubt So could please elaborate the same.
On a side note , Amazing content out here, really helpful , kudos for that !
Sham, if you are selling then you need to do this via a Futures or options, this way you can carry forward your position on an overnight basis.
hi kartik ,
i had a question regarding bearish harami !
In bearish harami is it necessary that the close of P2 should be higher than open of P1 , or it could be equal also and same goes with bullish harami that close of P2 should be lower than open of P1 or it could be equal also ?
Yes, the close of P2 should be higher than P1\’s opening. Equal would make it a bearish engulfing pattern.
Hi Karthik,
1. For the Bullish & Bearish Harami Pattern, on P-2 what causes the prices to open higher & lower than from the previous day\’s close? My guess is that when the bears exit their position before starting another round of selling the bulls caught hold and vice versa.
2. Similarly, how does gap opening works, you did explain that bulls are willing to buy at any price and bears are willing to sell at any price resulting in a gap, however, the only logical reason to do so should come from strong fundamentals of the underlying or are there any other reasons?
3. Is varsity the the only medium through which we can ask you questions as I have multiple other questions which are not related to this module?
1) It is usually an attempt by the bulls (for bullish harami) and bears (for bearish harami) to move the prices in the desired direction. The attempt is not successful, hence the short candle. But nevertheless it is an attempt.
2) Gaps are usually a function of excess supply or demand
3) This is the best way, although I do respond on Twitter as well.
Hello,
In case of Bullish Harami, if the closing of P2 is more than the opening of P1 (given that opening on P2 is higher than the close of P1), why won\’t the same principles apply? I think the same principles should apply because the market is anyway showing strength for the bulls on day 2.
The thought process behind the price action is very similar.
Hello Sir,
Thanks for such great learning material.
For justifying prior trend as a bullish or bearish, how much should be the price change for particular stock? Is there any relation between price change over number of trading session to justify it as a trend?
Usually, the trend should last for 8-10 trading session with at least 10% price change.
Hi Karthik,
Thank you for sharing these candlestick patterns, it has really improved my knowledge and has definitely set me on the right track as far as TA is considered.
Happy trading and learning, Pradeep!
Respected Sir, when we combine all the previous patterns mentioned i.e. bullish harami, bullish engulfing and the piercing pattern; a combined conclusion can be made that if at the end of a downward trend, you observe a red candle followed by a green candle then that shows there is an opportunity for long trading i.e. trend reversal.
Am I right, sir? and if yes, then what purpose do they solve by getting classified into different categories, instead of a single one? Thank you.
True, in fact, that is the purpose of candles, to help you identify patterns which are nothing but the manifestation of price action.
Hi Karthik,
Suppose with a prior downtrend, a Gap Up Green Candle is formed but by the end of the day, it closes above the open of the previous day\’s Red Candle. It would neither be a Bullish Harami, nor an engulfing and neither a piercing. So how would we classify such a candle? Is it to be considered an opportunity to go Long?
Thanks.
Sharan, just because a candle cannot be classified as a pattern, does not mean you don\’t trade on it. Candlesticks are all about price action with 100\’s of patterns. So yeah, if this looks convincing for you, then yes, you can track it and paper trade and gain experience. Next time you spot the same, perhaps take the trade 🙂
Thanks a ton Kartik !!
The sense is much clearer now.
Also, I quickly understood to some extent what quantifying actually means.
Thank you once again.
Good luck, Mrinal!
I mean to ask does it qualify truly as a Bullish Harami ?
Hi Kartik,
In the last chart in 9.2, (4th one in the chapter)…where you mention that the stop loss triggered leading to a loss…
Isn\’t the prior trend a bit dicey ?? As in, it\’s not actually a down trend…but a minor down and then almost flat trading ??
Just wanted to check if I am developing the right sense for reading the charts.
The best thing to do is to quantify, Mrinal. For example, you can define a downtrend only if the stock has declined 5-8% over at least 4-5 trading session. I\’ve just given an example, you can improvise on this. In fact, you can quantify every aspect of TA like this and make it more tangible.
Good day Sir,
In order to find out a pattern, do we take OHLC values and plot one candle per day in order to find out the trend?
Pardon the ignorance.
Thanks
Yes, that is right, these are called End of day candles. You can look at the end of days candle to identify trading opportunities.
sir downwards trend — then sudden Marubozu — then downwards trend following
I\’m seeing this kind of pattern more and more, am I missing anything, since Marubozu is a trend reversal pattern
https://imgur.com/a/D0ILaPd
Yes, but then you need to avoid trading on long candles, I\’ve explained why in this chapter.
Hi Karthik,
Taking bullish piercing into consideration,we say that the open on P2 should be lower than that of P1\’s close,in order to show the continuity of P1\’s sentiments,so after contemplating on P2,the long decision can only be taken at EOD ?
Whereas in Bullish Harami ,the open of P2 is more than P1\’s close giving a clear indication ?
The close again as we say is lower than p1\’s open ? Could you highlight the fundamentalism behind this.
I\’ve discussed this in the chapter itself, is there anything specific you are looking at?
Hey Karthik,
In Indian markets we cannot short on a CNC trade right? We can only short on intraday!?
No, to short and carry forward, you need to do in futures.
Are candlestick patterns useful on pullbacks?
Yup, they do. However, in most cases, look for pullback to an average.
Hi Karthik,
Thanks for wonderful content you have put together. A quick question: Can I apply the candlestick pattern to any length of session – eg instead of a day can it be a minute or 10 mins or 15 mins or 1 hour etc while intraday trading? Would it still hold good? TIA.
Yes, you can apply any asset any time frame.
Dear kartik bhai, thank you very much for all these detailed tutorials. I have just started reading this zerodha varsity.
However i have confusion about p2 day and thought process of whole pattern.
1) Here according to pattern, p2 day\’s candlestick should be in under shadow of p1 candlestick. Like most of the charts you mentioned follow this. Is it what pattern wants to convey?
2) your mention : \”However P2’s closing price is just below the previous days (P1) open price\” .
Now my confusion is in p2 candlestick. Lets say in harami bullish pattern p2 candlestick close is above p1 candlestick\’s open. If we interpret it with the thought process you mentioned we can say on p2 day bulls are in more strong position than actual harami bullish pattern. What should we do in this case?
1) Yes, that\’s what it means 🙂
2) Please treat this from a case to case basis. Not every candle had the same P2 inference
Thanks for your prompt reply Karthik
Happy learning 🙂
Dear Karthik,
Many thanks to you for bringing this amazing material. As I am progressing with Varsity modules, I am enjoying more and more. However, I have a query. Whether this candlestick patterns work in the extreme situation such as present pandemic or negative news flow such as bad news flow for banking industry?
Also, I have gone through few QA here and found that many readers have uploaded charts to clarify their doubts. But, I am not able to see them. Is there anyway to see those QA with the images?
Again, Much appreciated for your efforts to provide great content.
Regards,
Nirav
Glad to note that, Nirav 🙂
When you have a fundamental situation in the market, TA has very little relevance. I\’d suggest you don\’t rely on TA for this.
Images are user uploaded, they may have deleted the same.
Hi sir,
1. In Piercing pattern, should there be only gap down opening by P2? or, gap up also is OK?
2. In Kite charts, are the pivot points same as the Resistance and support levels studied in R&S chapter? Or should we plot R&S separately as told in that chapter?
1) Gap down
2) They are somewhat similar, I\’d suggest you stick to S&R
Are these correct assumptions?
1. An engulfing pattern is a stronger indication than a harami.
2. A piercing star is more commonly seen than a bullish engulfing (and similarly the bearish counterparts)
1) Yes, but this is just my personal opinion
2) Cannot comment on that though.
Sir,
Can you tell me the difference between The Piercing Pattern and Bullish Harami as both should have a prior down tend and The second candle is generally opposite in colour to the first candle?
Yes, the difference is in the positioning of the candle on P2.
If I am looking at daily data, how many previous candlesticks do I need to look at to recognize a trend?
For short term, at least 6 months.
Dear Sir,
An explanation in the first paragraph, you have written that On day 1 P1 and day 2 P2, sir my doubt is these P1 and P2 can form in the same day.
No, P1 and P2 are two different days, unless you are looking at intraday in which case P1 and P2 can be same day.
If Bullish harami is formed in UPTREND, it has no significance. Is it Correct?
In general, Can we say if a pattern is formed opposite to its trend in which it should have formed then it as no Significance.
Am I correct?
Sir do replay.
That\’s right, it is not a valid pattern if the prior trend does not support.
Sir, can you please explain how the triggering of the stoploss lead to a loss, in the image just above the title \”9.3 – The bearish harami\” ?
Stoploss implies that the stock has gone in the opposite direction of your trade position. Hence, a loss.
Hi Karthik
is trading can only With Futures or even it can be happen with CNC model. my question is considering deposit charges charged by DP\’s.
Yup, possible. Take delivery hold for few says and sell. This is called swing trading.
Hi Karthik, Have few doubts.
In the Harami pattern, do you recommend being risk taker or risk averse, since this is also a multiple candlestick pattern like Engulfing. For engulfing pattern you recommended being risk taker.
And if two stocks have harami and engulfing at same time, which one should be preferred
Hmm, it is hard to recommend as it really depends on many factors. If I were to trade this, I\’d imagine myself to be a risk-taker in most of the cases. Between the two patterns, I\’d go for the one which has a higher volume.
Sir
In bullish harami pattern, if close of P2 is higher than open of P1.Why won\’t it be more reliable than \’close of P2 lower than open of P1\’?
The idea with this pattern is sudden, intense, and short price action by bulls. A close above P1\’s open will not have the desired impact.
hello karthik
if shooting star appears in a downtrend so what it means ?
It simply means that the bearishness is emphasised and you should look for shorting opportunities.
Also during an uptrend or downtrend should the end value of the trend be either all time low or all time high or what is the reference point?
No, not necessarily.
it has been stated that the harmani pattern develops over two days and does this mean if we are using minute charts in intraday trading it happens and we get a confirmation in two minutes. And can someone please clarify me on basically if this is the best for intraday because all these examples over here are illustrated on the basis of days and not according to what an intraday trader would like to have.
//please help me out with the proper way to learn and practice trading even though varsity is a good material is there any other sources that can I rely on. please also feel free to mail [email protected]
Kishore, all examples are with respect to intraday, however, you can use the same techniques for day trading. For example, if you are looking at a bullish harami over a two-minute chart, then the pattern will complete at the end of 2 candles (which is 4 minutes) and you can take the trade on the 5th minute.
In my opinion, however, you should not be looking at 2 minutes charts to trade intraday 🙂
Sir, does Asian paints qualify bullish harami pattern on 11 April 19
If only it had opened a little higher 🙂
Oh.. Thanks
Hi,
For a piercing pattern, is P2\’s opening being lesser than P1\’s closing, a necessary condition?
If no, a Harami pattern that covers more than 50% of P1, could that also be interpreted as Piercing?
It should be lesser than P1\’s close or at the most equal to it.
Hi Karthik,
Would like to validate my understanding.
Can I say Maruti has formed a bullish Harami, as on 1st Mar evening? I have the trade setup as below
Stock: Maruti
Pattern: Bullish Harami
Buy: around 6930+
Target: 7300
SL: 6800
Prior trend: Downtrend – (From feb 8th it has come down, though last few sessions have been flat).
Please advise.
Regards
Bharani
Yes, it has formed a Bullish Harami. However, I think 7200 is a more reasonable target.
Thanks for the quick response Karthik.
I thought as per the charts the resistance level should be 7300 – are we choosing 7200, to be on the safer side or is there any other reason, that I am missing?
Regards
Bharani
Plotting S&R is a very visual concept and may differ from person to person (but not by a huge margin). I thought 7200 had a fair amount of price action. Why don\’t you recheck once?
Sure.. Thanks Karthik for the wonderful training material and for your continuous support
Good luck, Bharani!
Why will the bears panic if day 2 opening price is more than day 1 closing price?
The losses would mount for the bears, Diganta, hence they would panic.
Whether all these analysis apply to intraday trading as well? I mean, if the candles are 15 min candles can i use the same analysis?
Yes, the candlestick pattern can be applied to any asset (equity spot, eq futures, commodities, currencies) across any timeframe (5mins, 10 mins, 15 mins, EOC etc).
Hey Karthik,
Thanks for the excellent tutorial.
Just a small query, if after forming the pattern, the stock does not jump immediately but forms another bearish candle the next day, however the stoploss does not get triggered, does the pattern yet remain valid or is that considered the failure point?
Bearish pattern (except for marubuzo) will not matter. Remember for a bearish pattern we need the prior trend to be upwards.
https://drive.google.com/file/d/1ZJ-CIFVQF3MoVRT2AnYdezhgd1MjZ1nq/view?usp=drivesdk
Here is the link sir.
Not working, Srinath!
Sir can we consider the pattern formed in m&m as bullish harami with good volumes and price around support and go long here but macd is below signal line what would be your opinion in this kind of trades.
Sir can we consider this as bullish harami pattern with good volumes and price around support and go long here but macd is below signal line what would be your opinion in this type of trades.
https://drive.google.com/file/d/1b2P984WWz9yRIF4RlzFaQmxSVM65m4DJ/view?usp=drivesdk
Unable to open the link, Srinath.
You can check it now sir it\’s opening.
Not luck!
Hello Karthik,
Please clarify this query for me
Using these candle stick patterns in Intraday Trading , as a RISK AVERSER
1. for eg : if I see Shooting star pattern on two different occasions on the same day like one at 11a.m and another at 02;00 p.m is it safe to enter into trade for a quick shorting or should I wait for more than that to confirm a proper shorting situation.(Bulls are in control)
2. If I need to wait for more than 2 patterns to be formed wouldn\’t I missing the opportunity to trade for that day as I might not even get a similar pattern after that .
3. If two formations are enough for me to do a quick shorting then what is the time gap between these patterns should be or it doesn\’t really matter.
4. Similar above mentioned questions for Hammer or hanging man pattern as well.
Thankyou.
1) Since this is intraday, maybe you should enter the take the trade
2) Yup, hence evaluate other things in the grand checklist and take the trade if required
3) Again, these are intraday trades. It does not really matter
4) Works for all candlestick patterns
Sir..You Are Really Doing A Great Work..It is Really Very Very Helpful..
I Have Doubt..If a Stock is in downtrend and then For Few Trading Sessions it is Side way range..So Can We Apply The Candlestick Pattern Technique in Those Situation
Of course, you can, Rishabh. Look specifically for Marubuzo patterns here.
Thanx a Lot Sir..So You Mean In General Candlestick Pattern Will apply But Marubuzo Will Be More Benefiable..Am i right??..And Any Specific Reason For That Sir
Yes, specifically in sideways markets.
Thanx Sir..Is there any Telegram Group Managed By You..If There Plzz Share the Same
Nope, no telegram group.
Which is more reliable/strong among three(Engulfing/Piercing/Harami) candle stick pattern? I think Engulfing is most reliable for reversal….what do you think?
I like both Engulfing and harami patterns. I\’m not a big fan of the piercing pattern.
\”On day 2 of the pattern (P2) the market opens at a price higher than the previous day’s close\”
Shouldnt the opening price of a stock on a given day be equal to the closing price of the stock on the previous day??
No, the pattern (bullish harami) suggests that the opening on P2 is above the close of P1.
Sir,
I failed to get the point on Axis bank of 1st Oct trading results with previous days candle stick pattern.
pl explin if possible
Murali, which part are you getting stuck with? Will be happy to explain.
Dear Sir,
Many thanks for such wonderful information.
Can you please help me understand the below points?
1) While considering bullish or bearish trend, what\’s the typical timeframe/duration to be considered for assuming the trend? Is it 6 months?
2) How to take a short position for a shorter term trader? Is it to be taken in derivatives?
Thanks.
1) Look at both 6 months and shorter-term time frame (like 5-8 trading sessions)
2) Ideally yes, but no harm initiating short-term equity trades.
Hi Karthik, I really like the way you explain which has also enhanced my interest towards candle stick.
But I want to know that these candle stick tell us the trend but what should be our target. At what point we should square off the trade. You often speak about stoploss. Kindly guide
Arun, the best part of candlesticks patterns is that it comes with inbuilt risk management mechanisms (SL). However, it does not gives you insights into placing targets. For this, I think simple techniques like support and resistance helps.
Please Explain:
How the bullish harami pattern lead to loss after applying stop loss.(In the last chart of the bullish harami pattern)
Image address
https://zerodha.com/varsity/wp-content/uploads/2014/10/M2-Ch9-chart4.jpg
Apurva, like I have explained, CS patterns only enhance your probability of success. There are no guarantees here.
\”The risk averse will initiate the trade the day near the close of the day after P2, provided it is a blue candle day, which in this case is.\”
Doe this mean the risk averse will have to initiate the trade during closing time around 3.20 PM on the next day after P2?
or its nearer the close price of P2 on the next day?
Nearer to the close price of P2, the next day.
Hi Karthik Sir,
I have tried to identify instances of Bullish and Bearish Harami in the IDEA chart here.
Could you please take a look, and share your thoughts on them.
Link: https://drive.google.com/file/d/1YLnfnOTICAEs5JZb1rm3-mDIGukbpKes/view?usp=sharing
Thanks.
I think I\’d consider 5,9,11 as a good example of the pattern. Ideally, P2 should be contained halfway through P1.
Will keep that in mind while spotting the next time.
Thanks a lot for your input.
Good luck, Apurva!
Hi Karthik Sir,
In general, why is it important for the P2 candle to be as small as possible compared to the P1 candle(colour notwithstanding).
Let\’s take a Bullish Harami, I understand about the open of the P2 candle being above the close of the P1and thus indicating bullish sentiment, but wouldn\’t it be a stronger signal, if the close of P2 was above the open of P1?
Why or why not?
Thanks.
All candlestick patterns should be looked upon by the perspective of buyers and sellers. A small candle casts a doubt in the minds of the bears (who are otherwise in control). A slight move up on P3 will convert this doubt to panic, which leads to a short covering rally, which is exactly what you need as a buyer.
That\’s great. Thanks
🙂
In the above lesson, there is a minor printing mistake in the below statement.
\”Here is a chart of IDFC Limited where the bearish engulfing pattern is\”.
Instead of \”bearish engulfing\”, it should be \”bearish harami\”.
Thankyou.
Ah, let me look at this. Thanks for pointing out.
Why there is a distinction created between the two patterns ( harami and engulfing)? E.g. if we look from broader perspective, both bullish patterns i.e bullish harami and bulish engulfing, are preceded by downtrend, followed by red and blue color candles, respectively. Only thing that differentiate these two patterns is the size of candles. Hence if generalised , in any case at the bottom of a downtrend if one finds two candles one red and other blue respectively, the Patten shows trend reversal. And exactly opposite for bearish patterns.
Manish, the open and close in both cases are different. This difference leads to change in sentiment.
I have seen in so many instance where the markets makes high and on P2 opening will again be higher and hits the day high as same as in bearish pattern case also. In these cases the harami does not apply right?
As long as the real body is within the previous day candle, one can consider it as a Harami pattern.
Hi Karthik, in all these examples, a person has to carry over his position to another day. How is it possible in intraday trade? Also, if it\’s CNC, we can only do BTST, or wait for the shares to be delivered(+another day+more STT); what if the trend reverses within this time period, how should we buy/short our positions then?? Kindly help me understand.
Think about this – you notice a bullish engulfing pattern at around 3:20PM. The default trade is to go long on futures and carry forward the position. However, assume you are not comfortable with overnight risk. So you don\’t initiate this trade. Next day, you want to trade this stock? Will you go short? No right? You would want to be buyer in the stock at every possible dip. What I\’m suggesting is that you can use these patterns for intraday as well. The biggest challenge while placing intraday trades is to figure out if you are a buyer or a seller…this is where these patterns will help.
Thanks a lot Karthik for the response. So I understand that the time period of a day can be replaced by 30, 15, 10 or 5 min in each of the examples, i.e., the effect of the patterns will be same in these time periods as well. I hope the understanding is correct??
Yes, you can change the frequency, the patterns and its implication will be the same.
How we can decide target value in candle stick pattern…please suggest
CS pattern does not inherently give you targets, like the way it does give SL. You can use techniques of Support and Resistance for placing relevant SLs or even consider trailing your SLs. Both techniques are explained later on.
Check this – https://zerodha.com/tools/black-scholes/
Hi Karthik
The material prepared by you is quite omniscient and gives a holistic view of the markets. I really did find it enlightening.
Just had few queries.
1.) For pure intraday trades, which candlestick chart portrays the most accurate trend…. 5 min.. 10 min… or 30 min etc
rather … I should ask which one should be preferred the most
2.) Does keeping a daily target of overall profit/loss count as a fair strategy for rookie players ??
1) If you ask me, I think the higher the periodicity of the candle, the better it is. Given this, I\’d prefer 5 mins over 1 min or 15 mins over 10. My default preference is 15 mins
2) Don\’t do that. It will lead to stress and you cannot trade (take a rational decision based) when under stress.
Hi Karthik,
Thanks for simplifying the concepts!!
Small query
In case of Bullish Harami, what happens if P2\’s closing price is > P1\’s Open price?? Will that indicate a buy for a risk taker?? (or may be answer to my question is yes but the candle stick pattern would better be named as Piercing Pattern)?
That would kind of invalidate the harami pattern. The whole idea here is that P2 is contained within P1, there is a sudden shock for the bears here. The price is likely to increase only if this shock translates to panic and shorts starts covering up their positions. In case, the close of P2 is higher than P1\’s opening, I\’m afraid there won\’t be much panic.
Hi karthik , what if I keep my stoploss equal to the price that I have bought the shares in case of going long?
Wouldnt that reduce my losses in case the pattern reverses?
Yes, you can place it there….and by doing so, you will neither have a profit or a loss (assuming the SL triggers).
hi sir ,lets say after0330pm i started analysising 50stocks,along with candlesticks pattern,priortrends,volume,indicators,etc,now suppos i left with 4stocks,
so should i trade nextday at time of 0320pm or inthe next day at the start of morning?
Depends on your risk appetite. Some traders prefer to play it safe and trade at the close, some prefer to trade at the open. I\’d suggest you take it on a case to case basis.
hi sir kindlycheck it out
https://drive.google.com/file/d/13bv1KclboR841ewly4CmpN6ITVXWH-Ku/view?usp=sharing
Yes this is a piercing pattern.
hi sir , as we know that piercing pattern is bullish type as we double confirm by seeing the volume chart here,but sir as we see the two indicator MACD and RSI is showing selling symbol on day when piercing pattr form,for such type of case what we have to do?thanks for all your reply its really helping me learning and understanding,
Chirag, I always pay more attention to the candlestick patterns over the indicators. But then this is just my comfort level while trading. You need to discover your comfort for a better trading experience.
so for these case what will u do?by seeing that chart?
as i am asking for learning expericence
Well, you cannot have a target based on resistance for stocks at ATH. The only option is to trail the profits.
hi sir ,now open it,thanks
https://drive.google.com/file/d/1UWb3YSJFiftKbFPQWwqFRAFrO5auXhlS/view?usp=sharing
Yes, that is a bullish harami and like I have said earlier – there are no guarantees in the market. CS patterns only enhance your probability of success.
hi sir kindly go through it, and clear the querriesthanks
https://drive.google.com/open?id=1UWb3YSJFiftKbFPQWwqFRAFrO5auXhlS&disco=AAAABuFcCNA
The link is not working.
What is the timeline taken for the trends to form these patterns. In fact for all the patterns like engulf,haraami etc.
Usually, its best if these patterns occur after 8-12 trading sessions of showcasing a trend.
Can we use above candle sticks charts for buying and selling opportunities in Futures as well ? and also what time frame should we choose to observe trend?
Yes, you certainly can. If you are into swing trades, look for at least EOD charts. For intraday, look for 10 or 15 mins.
Thank you.
all these chart pattern are valid for positional or swing trading right ?
are they valid for intraday? ,because in all the articles I see that 3-4 trading sessions is mentioned
Yes, they are.
Firstly,thanks a lot for providing an exceptionally good platform for learning! I have a small doubt. Regarding all the candle stick patterns mentioned in this module which time frame would it best apply to? And what\’s your suggestion sir?
Kindly reply!
My personal preference is EOD charts, Daniel.
Good luck and happy learning!
Thank you!
Hi by the way what determines the opening price of the stock. The pre opening session? Or the very first trade after the market opens that day?
It really depends on the demand and supply for the stock on the given morning.
Sir are there any indicators similar to demand zone and supply zone on kite 3.0?
A simple support and resistance line helps you identify these zones. Have you checked this chapter – https://zerodha.com/varsity/chapter/support-resistance/
Thanks for reverting back!
Cheers!
How many data points (number of days) should we take into consideration to determine whether it is a upward trend or a downward trend in case of intra day share trading?
If you are looking at intraday or swing trading, then you need to look at at least 5-8 trading sessions. For longer-term trades, look at at least 15 days of data.
Hi Karthik, please address a few doubts of mine, Thank You.
1. What if, multiple and opposite patterns are observed in simultaneous candles? For example, if there is an uptrend in the stock and then then a bearish candle is observed (forming a Bearish Harami Pattern), but right after it a bullish candle engulfs the previously made bearish candle. What do we infer out of such a pattern?
2. While observing the intraday charts, sometimes contradicting observations occur for different time frames, for example, a buying opportunity in the 5 minute chart wheres as the 15 minute chart shows a prolonging down trend. What do we take into consideration when such crossovers take place? What should be an ideal number of points to set as the target in intraday trading since on several occasions the S&R calculated is way too high or low?
1) Possible to get stuck in such situations, hence the basic rules – buy on a blue candle day and sell on a red candle day.
2) Possible. For this reason, you need to stick to one-time frame and trade that. Also remember, longer the time frame, better is the quality of information. I\’d prefer 15 for intraday trading.
Thank You. Also, if you could please suggest an ideal number of points as target for an intraday trade?
Mayank, that would be hard to quantify. You need to look at the %return. Something as low as 0.2%, a day, achieved consistently is great in my opinion 🙂
Dear Karthik,
Thanks for providing such awesome material.
One doubt: What exactly is trading sessions? Can these multiple candlestick patterns be useful for Intraday trading? Because you are mentioning Interday (like day 1 and day 2) in these chapters of multiple candlestick patterns
Rushabh, a trading session simply refers to the daily market opening and closing.For example on Monday, the market opens at 9:15 AM and closes at 3:30 PM, this would be a considered as a trading session.
Yes, you can use candlestick patterns for intraday trading.
I\’ve been going through the chapter. My question is that if one does identify any particular multiple candlestick pattern for eg, a bearish harami, what is the levels that they should be looking to square off the position created on that chart view. Till chapter 8 i have derived where the possible stop loss for a trade is based on the information but there is no mention of prospective targets or how does one go about ascertaining that?
I\’d suggest you read the chapter on support and resistance. This will give you a perspective on how to place targets and even stoploss orders.
Both the piercing pattern and bullish harami seem the same, what\’s the difference between them?
The difference is in the positioning of the 2nd day;s candle.
Hello Karthik,
Should both the candles P1 and P2 in a Harami pattern satisfy the volume condition in checklist. Also in general for multiple candlestick patterns should all the candles involved in pattern formation should have at least avg vol traded.
Regards,
Nayan
Ideally yes – for both.
Karthik,
Thanks for the lessons.
How do I maintain a stop loss for a period of over a day? Is there a greater than day type of order in Zerodha where I can put a stop loss order for more than a day and leave it there? If yes, what is it called and how do I initiate one?
Thanks,
Ash
You will have to place it every day. Unfortunately, that feature is not available.
Thanks Karthik. The best part of these lessons are you prompt replies even after years of writing the article.
Don\’t you think a feature like GTD that we have in our competitors be a good idea to be implemented in the Zerodha Kite Platform too? Would you be willing to take this as a feedback and bring it to the attention of your leadership?
Thanks,
Ash
There are technical and regulatory challenges around this, Ash. That\’s the reason why we don\’t have this, else this would have been in place long ago.
Oh, but talking about regulatory challenges, how did Sharekhan get over it then. Not sure If I can mention a competitors name here, please delete the post if I couldn\’t. I see that option in their trading platform.
You certainly can, Ash. As long as its constructive. Did you we are probably the first broker in India to actually promote another broker 🙂 Check this – https://www.youtube.com/watch?v=fECMiFB95_U&list=PLkxTRam6E2V_Kq5l-H4Xihh-nWgO6Z4d9&index=9
About Sharekhan, let me check. Thanks.
Hi Karthik,
I have been reading these candlestick patterns since past few days. However, whenever you mention that Risk taker would initiate trade around 3:20 pm at the end of the day, I find it very difficult to understand.
(1) why would someone initiate trade around 3:20 pm, given that there are only few minutes left to execute the trade on the same day( 3:20 pm to 3:30 pm)? here I am assuming that its intraday trading.
(2) or is it like buying today around 3:20 pm and selling next day?
I am novice to trading as its apparent from questions !
-Jignesh
1) Not intraday, this is assuming he will carry forward the trade. Remember, once the trade is initiated, you hold till SL or target is hit
2) Like I mentioned, you hold till SL or target
Happy learning 🙂
Hi,
First of all, great job compiling these materials and explaining on simple language for a layman like me.
I happen to notice that in any of the charts, you have not shown the timeline in X axis. Are these for intraday? Also in the beginning it was mentioned that TA is for short term trades. You also suggest to vaise the trend referral around 3:20 pm of P2 day. So are we placing orders for few days? But isn\’t our order valid GFD. If yes, then are we taking delivery of the shares? In case of short, don\’t we have to close of our position the same day otherwise it will get auctioned that should be avoided? I\’m quite confused. Pls explain.
Thanks.
Typo- \” …You also suggest to validate the trend reversal around 3:20 pm of P2 day…\”
Got it 🙂
Shreesh, I guess I must have chopped off x axis for space constraints :)….honestly, dont know why I did that.
If a trade is taken at 3:20, then naturally we are talking about carrying forward the trade. You can do this via futures or an options position….this holds true for short positions as well. Remember, short positions in spot has to be closed within the same day, not futures and options.
Can these candle stick patterns be used for intraday.which module contains strategies regarding intraday.please sujjest
Yes, they can be. I\’d suggest you start with this module itself.
Sir
can you explain why in the IDFC Limited example , the risk averse trader avoided the trade?
Guess because of the colour of the candle on P3.
sir,
is it true that in a bearish harami or bullish harami pattern, the smaller the second candlestick, the more likely the reversal. It is thought to be a strong sign that a trend is ending when a large candle is followed by a small candle.
Not sure, I\’ve never come across such a theory.
sir,
what is mat hold pattern and how to analyse it and use it for the price behaviour ?
mat hold pattern? Sorry, I\’m not too sure about this.
Hi Sir, on 12th May Gail has formed a bearish pregnant pattern. also it looks to have formed a hammer pattern at 3.20 pm but on close because of the averaging of last 30 minutes, it closed below with a long upper shadow. can we apply exception here and treat it as bull with a SL of 400. Please share your thoughts. Thank you.
No, it does not sound too convincing for me. You may want to look at the chart on a EOD basis.
sir,
yesterday, nifty 50 formed bullish harami pattern, is it true that when such a pattern occurred during an uptrend, it is considered as bearish signal and it clearly implies that the market will continue the corrective tendency for sometime and no runaway rise is likely.
Yes, the probability is high, but as I said there are no guarantees in the market.
What if offer price(quantity) is 00(0) trade will occur or not???
Yes, no trades would occur.
Hi there, so after a span of 1 month I\’ve seen several stocks with interval of 10 or 15 minute candles.
So, as per all the candlestick patterns –
Firstly, the frequency of pattern formation with proper prior trend is pretty low in 10 or 15 min candle interval.
Secondly, if a pattern forms by chance, half or even more than that of the time the volume is below average(though several times it still does work and achieves my set target)
And finally, when a pattern forms with correct volume it still like a 50-50% chance for it to work for a decent target
So by all that mentioned above, the possibility of earning any money in intraday interval of 10 or 15 min candle via patterns is almost nothing.. Could you please advice me what should be done ?
Patterns seems to work the best imo in EOD basis only.
1) I\’m surprised, in fact it should be higher if the liquidity is good
2) If this is true, then maybe you should change the duration and check for other timeframes. Never force fit a pattern.
Hello, yes all the stocks that I\’ve kept an eye on have decent liquidity so it shouldn\’t be a problem at all, naming few stocks like techm, dlf, sbi, zee, airtel, bpcl etc
Yes, I\’m trying it in 5 min timeframe now and will tell the results as soon as I\’m able to conclude it myself. :o)
Good luck:)
So, according to you, if i am not wrong, the harami pattern formed when the traders got traped and forced to sell or buy there stocks in the loss result in reversal of the stock.
Am i right? If not, can you please explain.
Yup, traders also refer to this as short covering. Candlestick patterns is all about price action and the ensuing actions that you can take.
Does upper and lower shadow matter while forming bullish or bearish harami?
I\’d prefer looking at the real body.
for TA futures contract, whether to look at underlying scrip chart or scrip future chart?
Bcz if it is the first day of contract then to do TA on it?
Spot chart.
Does colour of the P1 candle really matter? As I came across a scenario similar to a bearish harami where both P1 and P2 being red in an uptrend.
Yes, colour represents price action, and the whole of TA is based on price action, so it is kind of important 🙂
Hi Karthik,
Is it safe to replace the word \”day\” with week in your examples of Haramai pattern.I believe the behaviour and expectation remains the same irrespective of day charts or weekly charts.Also i could see a bullish Harami kind of pattern on weekly charts of asian paints(21-11-16).It had a prior downtrend that started 4 weeks before exactly.Can we go long with this pattern now?
Here is the path to the chart image .https://kite.zerodha.com/share/C9TCVRHRGH.png
Yup.
Yes, you certainly can. In fact TA works across all time frames. You have the flexibility the apply to apply TA on minute, hourly, daily, weekly, or even monthly chart.
Can i get a pdf of this…so that i cn hv a hard copy to read and apply
PDFs and iBooks are already made available and you can freely download the same from the module page.
Sir, under the heading trade set up for Bearish Harami, you have said under 1(b)that\’The close price on P2 should be less than the open of P1\’
I think it should be closing price of P2 should be greater than the open of P1 ? would you kindly clarify.
George, thanks for pointing this. Will make the necessary corrections.
Hi Karthik,
Would you include your valuable knowledge s on chart patterns like head and shoulders, double top and bottom in varsity site.
There is already a chapter on Double top/bottom. Suggest you check the Dow Theory chapter.
Karthik Correction needed \”The current market price at 3:20 PM on P2 should NOT be less than P1’s opening price?\” NOT should be added
Please ignore it is correct
Sure 🙂
Hi karthik, in the harami method how to establish the pattern? only by observation,visualizing and interpretation? if the p2 is lower part than the middle can it be called harami?
A simple visual sniff test helps. The body of P2 should be within the P1 and preferably the shadows too. I\’d give the engulfing of body more importance over the shadows.
HI KARTHIK
THANK YOU FOR THE DETAILED AND INFORMATIVE KNOWLEDGE THAT YOU HAVE PROVIDED US TO IMPROVE OUR SKILLS
I WANTED TO ASK YOU AFTER GOING THROUGH THE CHAPTERS ON BULLISH ENGULFING, BULLISH PIERCING AND BULLISH HARAMI PATTERNS IT BASICALLY MEANS THAT WHENEVER YOU ARE IN A DOWNTREND AND IF YOU SEE EVEN ONE GREEN CANDLE DAY YOU SHOULD BUY?
AS BULLISH ENGULFING COVERS MORE THEN 100% OF THE PREVIOUS RED CANDLE
BULLISH PIERCING COVERS 50 TO 100% OF THE PREVIOUS RED CANDLE
BULLISH HARAMI COVERS 10 TO 50% OF THE PREVIOUS RED CANDLE
SO WHEN SHOULD WE NOT BUY SEEING A GREEN P2 CANDLE?
THANKS.
Yes, whenever you see a bullish pattern in a downtrend, you should look for buying opportunities. Its best if you buy it towards the close of P2, maybe around 3:15 PM.
Sir,
just started trading past15 days, can you advise me to find a coaching classes in personal, i am from Chennai. trying to study your candlestick all parts, understanding well but i can not recall it, please give me your valuable advice.
Not sure about other places…I would sincerely suggest you stick to the contents in Varsity and practice regularly.
Sir,
Thanks for your advice, please let me know how to keep remember the candlestick patern in mind. If there\’s any practical training.
I would suggest you pick up one pattern and trade that for a while till you get accustomed to it. For example you could choose to trade only Marubuzo for 3 months..end of 3 months you would be perfect in marubuzo and hence move the next pattern.
Is it the bullish harmi pattern formed in the following chart ?
Yes, it certainly looks so.
But SL hit today and then close end n green
Part of the game Abhijeet..you just have to keep improvising.
Hi Karthik,
Can i expect last candle as a Doji? I am in Dilema, Before last candle It has fomed Bullish harami right?
Bullish harami yes, but not really a doji.
Karthik sir
i am tracking the IDBI stock for couple of weeks and enjoyed a near about 50% surplus in just 8-10 days.
but now sir there is little bit of confusion about pattern
sir i am posting this image here, can u please teach me is this bearish harami pattern forming on IDBI one day chart
Good to hear this Ankit…but cant see the image.
Dear Karthik, I feel so grateful to you for sharing the immense knowledge you have. I have a few doubts about trading as a whole:
1. When should be trade in equity, futures and options?
2. As a beginner I was told that one should avoid trading in futures as it involves very high risk
3. Since then I have been trading in options (cnx Nifty) and been earning decent enough returns based on news (related to bank rate cut, if nifty rises continuously for 2 days then high chances of falling the 3rd day etc.
Kindly guide me
Vivek my answers as below –
1) I know this may sound like a boring advice, but start \’trading\’ only when you develop a trading strategy. Until then try and invest your money and experience how wealth is generated over long term.
2) As a beginner you should avoid both futures and options…at least till a stage where you are comfortable understanding how these work. Trade them only when you fully understand how to deal their risk reward characteristics.
3) Try and develop this into a proper strategy so that you can back test this and understand its behavior patterns.
could you please try to upload image on this page?
Hi Karthik,
is this bearish Engulfing with doji? and bearsih harami after that? can we sell at this level? as RSI is also showing overbought.
unable to updload chart 🙁
Need to see the chart 🙂 Btw, why are you not able to upload the chart?
Don\’t know, there must be some problem with system. Whenever i upload chart/image it took me to below page…
https://zerodha.com/413.shtml
It seems to be working fine here..
Karthik, using the flexibility rule can we treat the formation indicated by the green arrow as a bullish harami? i ask as the close of previous black candle after a sustained downtrend was at 574.35 and the opening of the BH candle was at 574.10. also, i am using a 14 day volume MA as opposed to a 10 day volume MA. what are your views.
You certainly can Madhu, although a higher open (say 576 or 578) would have been preferable. 14 day MA is just fine. No problem with that.
Karthik,
Many thanks for putting together this great material! I have been following Bharti Airtel for the past week and it seems to be at a very very interesting position. I am bearish on it due to the following reasons and i\’d be happy if you could provide your insights.
1/ Seems to be forming a triple top @ 418-430 levels
2/ Last high was made @435 at a very high volume of ~68m. On the day, stock closed ~10 bucks lower from the high (losing ~30% of the day\’s gains). Despite the volume shocker, prices could not go higher.
3/ A week of dojis and spinning tops after the long candle day. Bullish uncertainty? or are they consolidating??
4/ Last two candles are dropping. Bulls haven\’t given up yet though – low of the long candle of 29th @ 403 hasn\’t been breached yet (bears did test it though!).
5/ On the verge of an MACD crossover? 9 day EMA is still above the 26 day EMA though!
6/ Finally, is there a bearish harami?!
Seems perfect! Except for the last point on bearish Harami everything else makes sense. However it make take sometime to crack especially if the markets starts to go up from here. Hence I\’d be happy to buy a Put option here. Good luck.
sir in we go short(CNC).. is there a limitation that we have to square off within some stipulated time??
Yes when you short stocks in CNC markets you need to ensure you square off intraday before 3:20 PM, else there will be short delivery. When you have short delivery you will have to pay a heavy penalty. Here is a very well written article that helps you understand the consequence of short delivery – http://zerodha.com/z-connect/queries/stock-and-fo-queries/consequences-of-short-delivery-nse-bse
Hi Karthik,
Adaniports chart from 1st Jan 2015 attached.
1) Candle No. 2 is a doji… can candle no. 1 & 2 be considered as a BULLISH HARAMI CROSS ?
2) Can candle No. 2 & 3 be considered as a BEARISH ENGULFING PATTERN ?
3) Can candle no. 3 be considered as a HAMMER?
Thanks for your time.
ROBIN
Candle 2 is a doji.
1&2 and 2&3 are not valid Bullish Harami Cross and Bearish Engulfing patters as there is a lack of convincing prior trend.
Candle 3 is a hammer.
Karthik, why do you call Candle 3 a hammer? – is it only because of its form (it seems to be occurring during a sideways trend)?
A paper umbrella is called a Hammer only if it occurs at the end of a downtrend. Else its just a paper umbrella with no significance.
Thanks for those observations. are you suggesting that as the volumes were constantly dipping as the price moved up should have been a sign of caution? i have marked a blue line on the volume panel for the same. also, the day the bullish harami was formed the volumes were lesser compared to the days the price retraced upwards. should that have been noted too?
Absolutely. Declining volume with increase in price, especially after a bout of selling should be treated with caution. Options is the best instrument of choice if one were to trade these setups.
Also, how does one trade a spinning top or a doji at support or resistance? do we wait for a recognizable candle post them to place trades?
Yes, it makes sense for a pattern to emerge. But the bias is towards a reversal. Think about it – if there is a support the chances are that the demand could emerge. Add to this a doji – by definition a doji is supposed to show indecision, which means the sellers strength is now questionable. Hence from both the angles its justified to build a bias towards a reversal.
Hi Karhik, is this a failed Bullish harami ? The primary trend is down and the bullish harami was formed at substantial support with volumes. The RSI too is oversold. The secondary trend is up though. how does one read the secondary trend in such cases? Do you think the bearish candle today was a retracement as the volumes relatively low and can we go long from here?
Two conflicting signals here –
1) Bullish harami is suggesting a buy (the SL has not been triggered hence too early to call it failed)
2) On low volume prices are increasing suggesting a sell
Hence I would be a bit cautions although my bias would be towards a buy …also due to the fact that the stock has formed a double bottom and since support is there near the current market price.
Primary trend,Secondary trend,double bottom terms are new to me as far as i have read.
can u explain me dis terms.
I\’ve explined the same in the Dow theory chapters.
Hi Karthik,
What is the difference between BEARISH HARAMI and BEARISH HARAMI CROSS?
Thanks 4 ur time.
ROBIN.
Bearish Harami = White candle followed by a small red candle contained within.
Bearish Harami = White candle followed by a doji contained within.
so that means, in a bearish Harami Cross….instead of a small red candle after the white candle in an uptrend, there is a dogi…right?
Absolutely.
Sir,
which candle stick pattern i.e Engulfing, Piercing/Dark Cloud and Harima can be considered as strongest.
Regards
My personal preference is the engulfing pattern.
Can this be considered a Bullish Harami (The green candle is also a spinning top and the shadow is not fully contained).
I guess you can.
In HCL after a long time previous gap was filled today.How to interpret this filling and trade forward?
Thanks in advance
I\’m not really a big follower of gaps…so I would refrain from commenting 🙂
Dear Sir,
Inverted hammer appears to be an Shooting star, correct me if Iam wrong. Once has to look for shorting if prior trend is an Uptrend. Regards
Yes, you are absolutely correct.
You are looking for bullish harami pattern and not looking for confirmation if bullish harami gives confirmation than buy call otherwise this is a temporary retracement wait till it gets over and go for sell in this script when any particular sell signals generated.
Sir, Has unitech formed a bullish harami pattern on this chart ?
It looks like, but the volumes are really low, dont you think so?
Hi Karthik,
Generally you used to say,Look for the prior trend before concluding any pattern.So how many days you want us to take for calculating downtrend or uptrend?
Regards,
SaikiranGarapati.
The look back period should be at least 5-7 candles to establish prior trend. So if its a EOD chart you are looking at then it means to establish prioor trend you are looking at, at least 5-7 trading sessions to establish prior trend.
Thanks for the reply Karthik, Nifty has formed a Inverted hammer on 24-03-2015..So what does that mean? Can we expect it has started upward momentum now?
No, in fact if you think about it an inverted hammer has a long upper shadow – this means that the bulls made an attempt to take the market higher, therefore a long upper shadow was formed. However the bulls were not able to sustain the high and eventually the market gave up its gain, this is evident by the fact that the market closed near the low point of the day, thus forming an inverted hammer. Clearly there could be a bit of weakness in the market…however because there is a support at current level market may eventually bounce. These are situations which can be very tricky to trade…hence the need for options. I have spoken about a situation very similar to this in chapter 3 of \’Options Theory\’ module. Suggest you read through it. It will be uploaded in few days.
Hi Karthik…M&M continued slide after forming bullish harami…suggest what additional variables to check before taking the plunge.
Did it satisfy all other variable that we have discussed here in section 18.6 of this chapter (http://zerodha.com/varsity/chapter/dow-theory-part-2/) ? Assuming it did, do note the SL would have triggered the very next day.
OK. Will check that. Thanks.
Welcome.
Dear one have to check /wait for confirmation after bullish harami / bearish harami don\’t jump immediately into the trade you are decreasing your winning chances to 50% instead of increasing
Has M&M formed a bullish harami pattern on this chart ? It is of 4th februrary. If yes, then should the stoploss be at 1190 ?
Yes, this looks like a Bullish Harami pattern. Do check for the volumes and other variables in the checklist before you can initiate the trade. However I must say, I would have been happier to see the bullish green candle to have opened (gap up) slightly higher than what has happened now.
Can i consider the highlighted pattern as bullish engulfing? Real body of Green candle(3rd candle) engulfed around 3 times as compare to the Doji(2nd) real body.
Yes you can, but I personally would be a bit hesitant to trade on such patterns simply because the volatility seems a bit high, and the stoploss has to be a bit deeper to take up these trades.
Even though you left the trade see carefully if i consider your dozi as first candle in circle then the sixth candle also confirming bullish engulfing with confirmation the perfect one to enter and after that what a perfect rise stock taken
Kindly clarify the highlighted candle in the chart.
Vasanth – It would be difficult to classify it as a bearish harami since there is no prior trend. There has a prior uptrend before classifying a pattern as bearish. In fact I see there is a good bullish marubuzo which suggest you go long on the stock, keeping its low as the stoploss.
have you seen the signal The first Green then Harami formed by second my personal experience that ypu have to wait for confirmation which is not in third candle thats why trade failed
Probably, but I\’m not sure about this as I\’ve not traded under such a scenario.
Thank you sir for your quick response…
Can you confirm the Stop loss & target for the pattern?
This can be tricky Vasanth – I guess you are looking at a tick by tick chart where the variation is quite tight. Hence placing the stop can be difficult. I would suggest you look at least 5 minutes chart for intraday, 10 mins is even better. Anyway, the stoploss would be the higher high of the pattern, in this case it would be the upper shadow of the green candle.
Excellent Keep it Up
Regards
V.Manickame
Pondicherry
🙂
dear sir, small correction required in 9.2. ->3, a. The opening on P2 should be higher than the close of P1.
Thanks, will make the change 🙂
HI Karthik,
Does Zerodha software provides information on for what stocks the SIngle/Multiple Candlesticks patterns are happening on a day basis? IMO, It is not possible to track all stocks for all the different patterns.
No Zerodha does not do this. Suggest you read this chapter, it will help you get started – http://zerodha.com/varsity/chapter/finale-helping-get-started/
I have developed API regarding the same where user will get information on which candlestick pattern it created based on data inputs in OLHC format be it one minute chart, hourly, daily or weekly. If interested ping me on my personal email.
Hi Karthik,
Thank you for the excellent tutorials.
When you mention about shorting in these lessons, do you think that the risk averse will get an chance to gain in the cash market as the short positions are closed by the EOD?
You cannot short in the cash market for extended period – to short and carry positions you need Futures. Of course you can short cash market on a intra day basis.
Hello karthik sir,
What do we mean by a Sideway trend ?
Thank you
A sideway trend is when the stock gets stuck in a range. I have explained about it here.
Is this Hiknasi Candles? & whaT IS TARGET in this type of trade?
No, these are candlestick charts.
though i understood engulfing piercing and harami pattern, it would be nice to illustrate the differences amongst them as three are quiet similar.
All 3 patterns (Engulfing, Piercing, and Harami) are 2 candlestick patterns. The 2 candles are opposite in colour.
In Engulfing the 2nd candle is bigger than the previous candle
Piercing Pattern is similar to engulfing except that the 2nd candle engulfs little over 50% of the previous candle
In Harami Pattern, the 2nd candle is short an looks contained withing the 1st candle.
Then doesn\’t it mean that trend reversal is being suggested from candlestick chart perspective whenever 2 days candles are opposite in colour in a trend? Taking scenario of bullish engulfing, peircing pattern and bullish Harami – 2nd day opposite blue candle will be bigger/equal/shorter than 1st day red candle.
Yes, it does. As per candlesticks, all the patterns you mentioned indicate trend reversals.
two candles of opposite colors doesn\’t always mean a reversal. Lets say in a down trend, when P2 opens higher than P1\’s close and closes higher than the P1\’s open, it doesn\’t come under any of the reversal patterns.
Yes, agreed. However, along with prior trend and other checklist variable, the probability of a reversal increases.