
8.1 – The Engulfing Pattern
In a single candlestick pattern, the trader needed just one candlestick to identify a trading opportunity. However, when analyzing multiple candlestick patterns, the trader needs 2 or sometimes 3 candlesticks to identify a trading opportunity. This means the trading opportunity evolves over a minimum of 2 trading sessions.
The engulfing pattern is the first multiple candlestick patterns that we need to look into. The engulfing pattern needs 2 trading sessions to evolve. In a typical engulfing pattern, you will find a small candle on day 1 and a relatively long candle on day 2, which appears as if it engulfs the candle on day 1. If the engulfing pattern appears at the bottom of the trend, it is called the “Bullish Engulfing” pattern. If the engulfing pattern appears at the top end of the trend, it is called the “Bearish Engulfing” pattern.
8.2 – The Bullish Engulfing Pattern
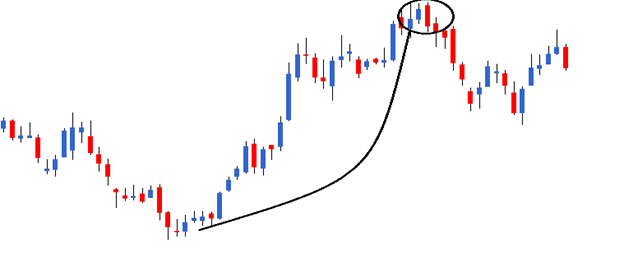
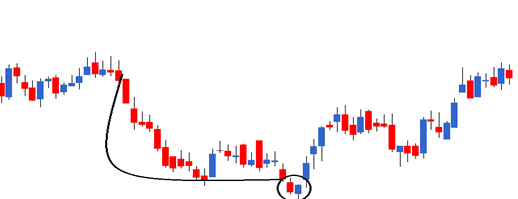
The bullish engulfing pattern is a two candlestick pattern which appears at the bottom of the downtrend. As the name suggests, this is a bullish pattern which prompts the trader to go long. The two-day bullish engulfing pattern is encircled in the chart below. The prerequisites for the pattern are as follows:
- The prior trend should be a downtrend
- The first day of the pattern (P1) should be a red candle reconfirming the bearishness in the market
- The candle on the 2nd day of the pattern (P2) should be blue, long enough to engulf the red candle
The thought process behind the bullish engulfing pattern is as follows:
- The market is in a downtrend with prices steadily moving down
- On the first day of the pattern (P1), the market opens low and makes a new low. This forms a red candle in the process
- On the second day of the pattern (P2), the stock opens near the closing prices of P1 and attempts to make a new low. However, there is a sudden buying interest at this low point of the day, which drives the prices to close higher than the previous day’s open. This price action forms a blue candle
- The price action on P2 also suggests that bulls made a very sudden and strong attempt to break the bearish trend, and they did so quite successfully. This is evident by the long blue candle on P2
- The bears would not have expected the bull’s sudden action on P2 and hence the bull’s action kind of rattles the bears causing them some amount of nervousness
- The bullishness is expected to continue over the next few successive trading sessions, driving the prices higher and hence the trader should look for buying opportunities
The trade set up for the bullish engulfing pattern is as follows:
- The bullish engulfing pattern evolves over two days
- The suggested buy price is around the close price of the blue candle, i.e. on P2
- Risk-taker initiates the trade on P2 itself after ensuring P2 is engulfing P1
- The risk-averse initiates the trade on the next day, i.e. the day after P2 around the closing price, after confirming the day is forming a blue candle
- If the day after P2 is a red candle day, the risk-averse trader will ignore the trade, owing to rule 1 of candlesticks (Buy strength and Sell weakness)
- On a personal note, in multiple candlestick patterns where the trade evolves over 2 or more days, it is worth to be a risk-taker as opposed to a risk-averse trader
- The stop loss for the trade would be at the lowest low between P1 and P2
Needless to say, once the trade has been initiated, you will have to wait until the target has been hit or the stoploss has been breached. Of course, one can always trail the stop loss to lock in profits.
Have a look at DLF’s chart below; the bullish engulfing pattern is encircled.
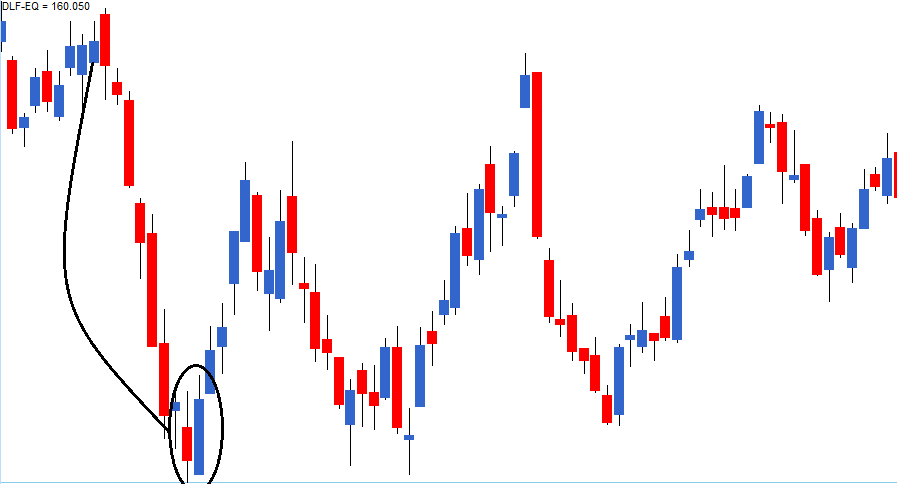
The OHLC on P1 – Open = 163, High = 168, Low = 158.5, Close = 160. On P2 the OHLC details are – Open = 159.5, High = 170.2, Low = 159, Close = 169.
The trade set up for the bullish engulfing pattern is as follows:
- The risk-taker would go long on P2 at 169. He can do this by validating P2 as an engulfing pattern. To validate P2 as an engulfing pattern, there are 2 conditions:
- One, the current market price at 3:20 PM on P2 should be higher than P1’s open.
- Second, the open on P2 should be equal to or lower than P1’s close.
- The risk-averse will initiate the trade, the day after P2 only after ensuring that the day is a blue candle day. So if the P1 falls on a Monday, the risk-averse would be initiating the trade on Wednesday, around 3:20 PM. However, as I had mentioned earlier, while trading based on multiple candlestick patterns, it may be worth initiating the trade on pattern completion day itself, i.e. P2
- The stop loss on this trade will be the lowest low between P1 and P2. In this example, the lowest low falls on P1 at 158.5
In this example, both the risk-averse and the risk-taker would have been profitable.
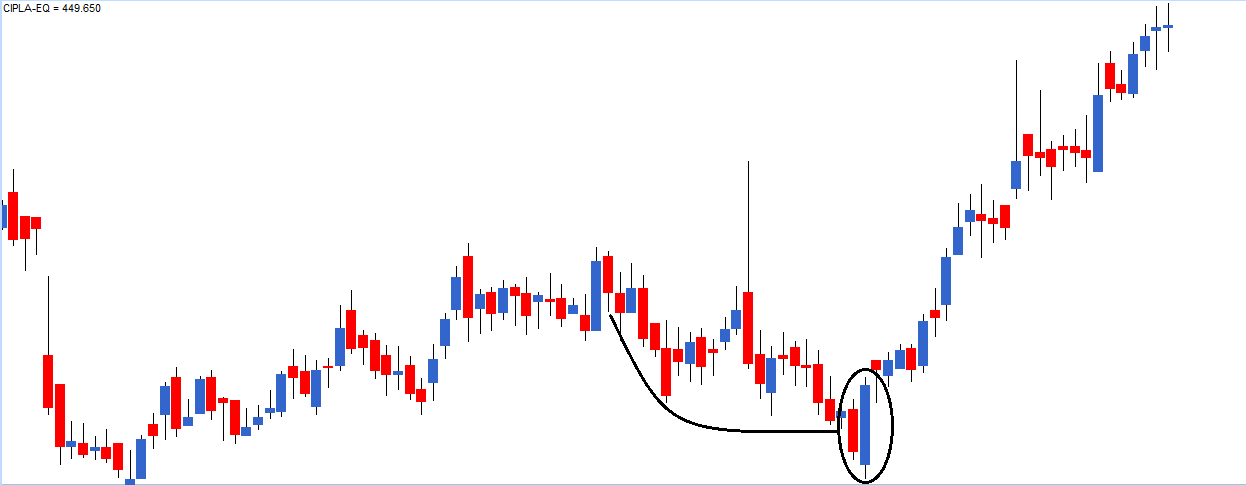
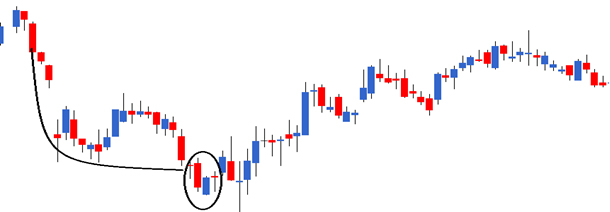
Here is an example of a perfect bullish engulfing pattern formed on Cipla Ltd, the risk-averse trader would have completely missed out a great trading opportunity.
There is often a lot of confusion on whether the candle should engulf just the real body or the whole candle, including the lower and upper shadows. As long as the real bodies are engulfed in my personal experience, I would be happy to classify the candle as a bullish engulfing pattern. Of course, candlestick sticklers would object to this but what really matters is how well you hone your trading skills with a particular candlestick pattern.
So going by that thought, I’d be happy to classify the following pattern as a bullish engulfing pattern, even though the shadows are not engulfed.
8.3 – The bearish engulfing pattern
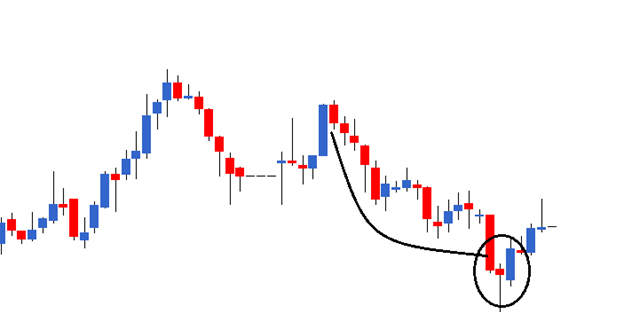
The bearish engulfing pattern is a two candlestick pattern that appears at the top end of the trend, making it a bearish pattern. The thought process remains very similar to the bullish engulfing pattern, except one has to think about it from a shorting perspective.
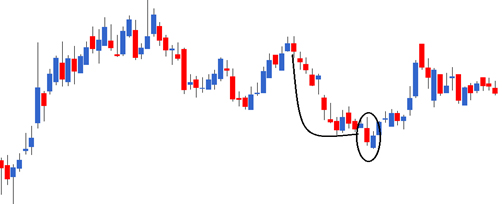
Take a look at the chart below, the two candles that make up the bearish engulfing pattern is encircled. You will notice:
- To begin with, the bulls are in absolute control, pushing the prices higher.
- On P1, as expected, the market moves up and makes a new high, reconfirming a bullish trend in the market.
- On P2, as expected, the market opens higher and attempts to make a new high. However, at this high point, selling pressure starts. This selling comes unexpected and hence tends to displace the bulls.
- The sellers push the prices lower, so much so that the stock closes below the previous day’s (P1) open. This creates nervousness amongst the bulls.
- The strong sell on P2 indicates that the bears may have successfully broken down the bull’s stronghold and the market may continue to witness selling pressure over the next few days.
- The idea is to short the index or the stock to capitalize on the expected downward slide in prices.
The trade set up would be as follows:
- The bearish engulfing pattern suggests a short trade.
- The risk-taker initiates the trade on the same day after validating two conditions.
- The open on P2 is higher than P1’s close.
- The current market price at 3:20 PM on P2 is lower than P1’s open price. If the two conditions are satisfied, then it would be logical to conclude that it is a bearish engulfing pattern.
- The risk-averse will initiate the trade on the day after P2 only after ensuring that it is a red candle day.
- Since the bearish engulfing pattern is a 2-day pattern, it makes sense to be a risk-taker. However, this purely depends on the individual’s risk appetite.
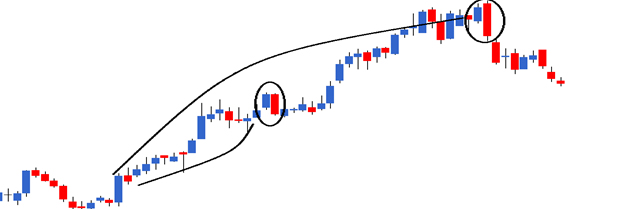
Take a look at the chart below of Ambuja Cements. There are two bearish engulfing patterns formed. The first pattern on the chart (encircled, starting from left) did not favour a risk-taker. However, the risk-averse would have completely avoided taking the trade. The second bearish engulfing pattern would have been profitable for both the risk taker and the risk-averse.
The OHLC data for the bearing engulfing pattern (encircled at the top end of the chart) is as below:
P1: Open – 214, High – 220, Low – 213.3, Close – 218.75
P2: Open – 220, High – 221, Low – 207.3, Close – 209.4
The trade setup for the short trade, based on the bearish engulfing pattern is as follows:
- On P2 by 3:20 PM the risk-taker would initiate the short trade at 209 after ensuring P1, and P2 together form a bearish engulfing pattern.
- The risk-averse will initiate the trade, the day after P2 only after ensuring that the day is a red candle day.
- The stoploss in both cases will be the highest high of P1 and P2, which in this case is at 221.
Both the risk-averse and the risk-taker would have been profitable in this particular case.
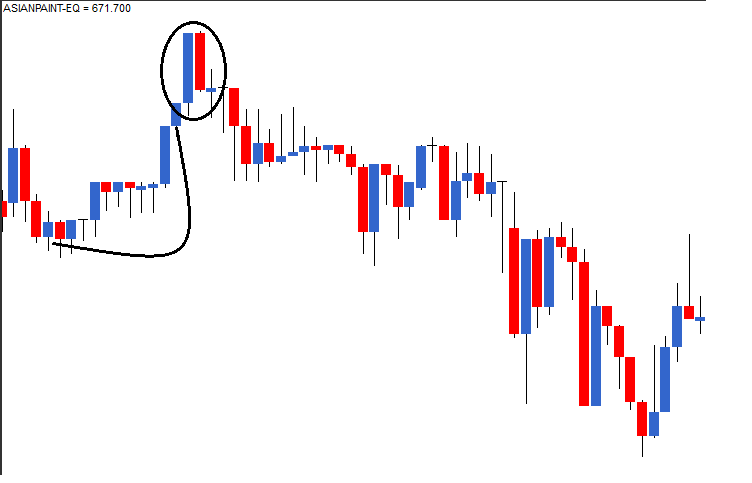
8.4 – The presence of a doji
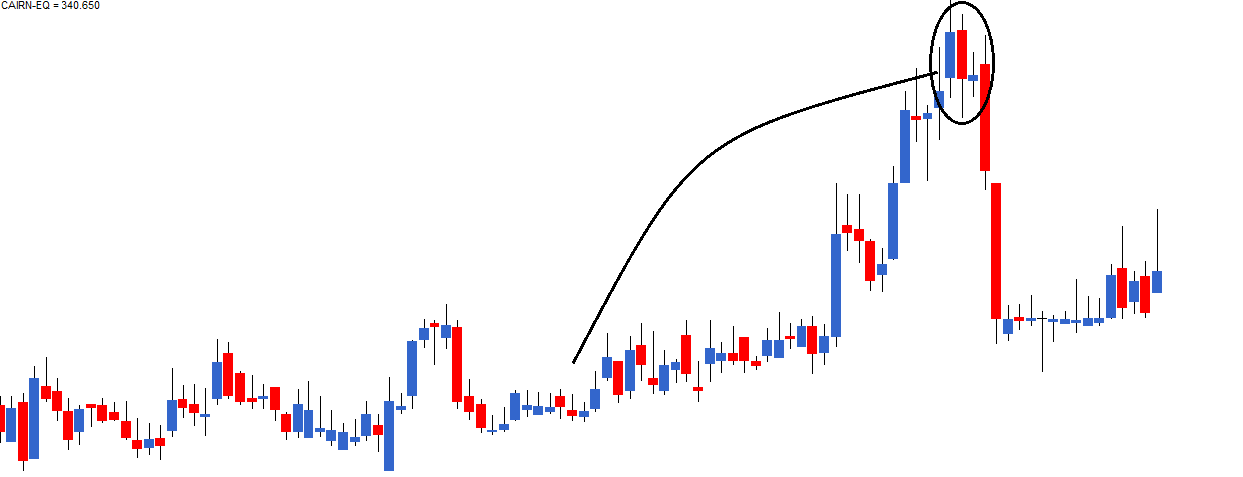
Now here is a fascinating chart. From my own personal experience, I can tell you, charts like the one shown below are highly profitable. One should not miss such trading opportunities
Take a look at the chart, what are the things that catch your attention?
- An obvious uptrend as highlighted
- A bearish engulfing pattern right at the top end of the upward rally
- A doji formation on the day following P2
What implication would a doji have in this chart?
Let us inspect this chart event by event:
- A prolonged uptrend in the chart confirms the bulls are in absolute control.
- On P1, a blue candle is formed, reconfirming the bull’s dominance in the markets.
- On P2 markets open higher and make a new high comforting the bulls. However, at the high point, a strong surge to sell builds up, to the extent that the prices close below P1’s opening prices.
- This trading action on P2 sets in a bit of panic to bulls, but they are not shaken yet.
- On day 3, let us call it as P3, though the opening is weak it is not much lower than P2’s close. This is not too comforting for the bulls, as they expect the markets to be stronger.
- During P3, the market attempts to move higher (Doji’s upper shadow); however, the high is not sustained. Even the low is not sustained and eventually, the day closes flat, forming a Doji. As you may recall, Dojis indicate indecision in the market.
- On P2 bulls panicked and on P3 bulls were uncertain.
- Panic with uncertainty is the perfect recipe for a catastrophe. Which explains the long red candle following the Doji
From my own personal trading experience, I can tell you that whenever a doji follows a recognizable candlestick pattern, the opportunity created is bigger. Besides illustrating this point, I also want to draw your attention to chart analysis methodology. Notice in this particular chart, we did not just look at what was happening on P1 or P2. Still, we went beyond that and actually combined two different patterns to develop a comprehensive market view.
8.5 – The Piercing Pattern
The piercing pattern is very similar to the bullish engulfing pattern with a minor variation. In a bullish engulfing pattern, the P2’s blue candle engulfs P1’s red candle. However in a piercing pattern P2’s blue candle partially engulfs P1’s red candle. However, engulfing should be between 50% and less than 100%. You can validate this visually or calculate the same. For example, if P1’s range (Open-Close) is 12, P2’s range should be at least 6 or higher,r but below 12.
As long as this condition is satisfied, everything else is similar to the bullish engulfing, including the trade set up. Here a risk-taker would initiate the trade on P2 around the close. The risk-averse would initiate the trade, the day after P2 only after ensuring a blue candle is formed. The stoploss would be the low of the pattern.
Have a look at the following chart:
Here P2’s blue candle engulfs just under 50% of P1’s red candle. For this reason, we do not consider this as a piercing pattern.
8.6 – The Dark Cloud Cover
The dark cloud cover is very similar to the bearish engulfing pattern with a minor variation. In a bearish engulfing pattern the red candle on P2 engulfs P1’s blue candle. However, in a dark cloud cover, the red candle on P2 engulfs about 50 to 100% of P1’s blue candle. The trade set up is the same as the bearish engulfing pattern. Think about the dark cloud cover as the inverse of a piercing pattern.
8.7 – A perspective on selecting a trade
Typically stocks in the same sector have similar price movement. For example, think about TCS and Infosys or ICICI Bank and HDFC Bank. Their price movement is similar because they are more or less of the same size, have a similar business, and have the same external factors that affect their business. However, this does not mean their stock price movement would match point to point. For example, if there is negative news in the banking sector, banking stocks are bound to fall. In such a scenario if the stock price of ICICI Bank falls by 2%, it is not really necessary that HDFC Bank’s stock price should also fall exactly 2%. Probably HDFC Bank stock price may fall by 1.5% or 2.5%. Hence the two stocks may form 2 different (but somewhat similar) candlestick patterns such as a bearish engulfing and dark cloud cover at the same time.
Both these are recognisable candlestick patterns, but I chose between the two patterns to set up a trade. I would put my money on the bearish engulfing pattern as opposed to a dark cloud cover. This is because the bearishness in a bearish engulfing pattern is more pronounced (because it engulfs the previous day’s entire candle). On the same lines, I would choose a bullish engulfing pattern over a piercing pattern.
However, there is an exception to this selection criterion. Later in this module, I will introduce a 6 point trading checklist. A trade should satisfy at least 3 to 4 points on this checklist to be considered a qualified trade. Keeping this point in perspective, assume a situation where the ICICI Bank stock forms a piercing pattern, and the HDFC Bank stock forms a bullish engulfing pattern. Naturally, one would be tempted to trade the bullish engulfing pattern, however, if the HDFC Bank stock satisfies 3 checklist points, and ICICI Bank stock satisfies 4 checklist points, I would go ahead ICICI Bank stock even though it forms a less convincing candlestick pattern.
On the other hand, if both the stocks satisfy 4 checklist points, I will go ahead with the HDFC Bank trade.
Key takeaways from this chapter
- Multiple candlestick patterns evolve over two or more trading days.
- The bullish engulfing pattern evolves over two trading days. It appears at the bottom end of a downtrend. Day one is called P1, and day 2 is called P2.
- In a bullish engulfing pattern, P1 is a red candle, and P2 is a blue candle. P2’s blue candle completely engulfs P1’s red candle.
- A risk-taker initiates a long trade at the close of P2 after ensuring P1 and P2 together form a bullish engulfing pattern. A risk-averse trader will initiate the trade the day after P2, near the close of the day.
- The stoploss for the bullish engulfing pattern is the lowest low between P1 and P2.
- The bearish engulfing pattern appears at the top end of an uptrend. P2’s red candle completely engulfs P1’s blue candle.
- A risk-taker initiates a short trade at the close of P2 after ensuring P1 and P2 together form a bearish engulfing pattern. The risk-averse trader will initiate the trade the day after P2, after confirming the day forms a red candle.
- The highest high of P1 and P2 forms the stoploss for a bearish engulfing pattern
- The presence of a doji after an engulfing pattern tends to catalyze the pattern’s evolution.
- The piercing pattern works very similarly to the bullish engulfing pattern, except that P2’s blue candle engulfs at least 50% and below 100% of P1’s red candle.
- The dark cloud cover works similar to the bearish engulfing pattern, except that P2’s red candle engulfs at least 50% and below 100% of P1’s blue candle.
The techniques that are taught here and in the rest of this module on technical analysis of stocks, can they all be applied to analysis of NIFTY and other Indian market indices also?
Yes, it is possible.
i mean in this multiple candlistic pattern the one we consider is day candlestic chart right. So if a person wants to do intraday trading how can a person identify what kind of analysis to be used or any other screener that might give some clarifications?
And how does a short trading works after doji formed on p3 whether i should buy the stock or sell on p3?
Hi Karthik,
In piercing- Can the Open of P2 be the same as close of P1 or we need a gap down? & For Dark Cloud- Can the Open of P2 be the same as close of P1 or we need a gap up?
For both, Slightly lower/higher than P1 is nice, but not necessary.
i didnt understood that how do we get to know a pattern of dark cloud/piercing will fail cauz in the video also we saw some trends which eventually failed..
There is no way you can figure that. You can only get the odds of these things working or failing, but no certainty 🙂
it took me way too long to realize that mouths and noses of the stick figure drawings at the beginning of chapters represent trends 🙂
Happy learning 🙂
you have mentioned about not taking trade if length of a candle is less than 1 percent . so is this valid also in multiple candle stick pattern . and how should we calculate length of candle – from previous day close or todays open??
Yes, it does. Basically it is about ensuring the volatility is within a perceived range. We are trying to avoid extreme or very low volatility.
(from 7/11 to12/11) a speaning top on p1(red candle) shoting star on p2(green candle) a hammer on p3(a green candle) then again a speaning top (a red candle) and its a clear downtrend on daily chart from august 2025. that means something or its just noise.
https://kite.zerodha.com/markets/ext/chart/web/tvc/NSE/HINDUNILVR/356865
The best way to establish this to correlate the price move with fundamental news. If there is some fundamental news impacting the business operations, then the downtrend is evident.
Hello Sir,
I had one doubt, lets assume we are in an uptrend and now we have a spinning top/Doji(green), let this be P1, now the next day we got a red candle (P2)which is large enough to engulf the P1. In this case what would be the situation? Is it going to be a downtrend?
How will i decide the target price is there any process for that too just like the stoploss
One of the easiest way is to look at support and resistance levels.
Question: What if a Doji occurs after bullish engulfing on P3, how to interpret it and what will be the trader\’s stance ?
On day 3, let us call it as P3, though the opening is weak it is not much lower than P2’s close. This is not too comforting for the bulls, as they expect the markets to be stronger.
During P3, the market attempts to move higher (Doji’s upper shadow); however, the high is not sustained. Even the low is not sustained and eventually, the day closes flat, forming a Doji. As you may recall, Dojis indicate indecision in the market.
On P2 bulls panicked and on P3 bulls were uncertain.
Panic with uncertainty is the perfect recipe for a catastrophe. Which explains the long red candle following the Doji.
The answer is in the lesson. please read… is it correct Ranganna?
Yes sir 🙂
That would be adding a dose of uncertainty, but I would consider this bullish 🙂
Whatif we found spinning top instead of doji after any recognised pattern..can we consider it big movelike doji?
Same reading 🙂
SilverMic(28Nov) seems to be forming 3 patterns.
1st: 16, 17 oct Bearish engulfing pattern.
2nd & 3rd: Its either a Bearish Hammer or a doji confirming the bearish engulfing pattern.
Well, my father bought 2 lots on 17 oct at 171800 and is currently at a great loss and he is still holding on it, I don\’t know why.
Should I ask him to sell now and maybe start shorting to earn some profit?
I meant Hanging man not Bearish Hammer.
Sure, please do check my previous reply.
What was the stoploss he had in mind? If its beyond the SL limit he had set, then he should liquidate. For fresh short – again, what is the premise? Take the trade if you are clear about the premise, stoploss, and target.
Thank You, Sir. Not going to take the trade because I am not completely clear on the premise, stop loss and target. I\’m still learning how to set them properly.
Super. By the way, the decision to not trade itself is a trade 🙂
What if the Nifty Bank is forming a Bullish Engulfing pattern? Does it have any influence on the banking stocks? Give your thoughts. And what do the fundamentals of a stock have on the technicals? Consider that I am looking at a longer time frame, and the fundamentals are showing positive signs, but the technicals are telling a different story. Which route to take?
Index goes up, stocks go up. They are all interconnected 🙂
What if P3 of Bullish Engulfing is a red candle and P4 is a blue candle? Is it still worth taking a trade? If not, then why not?
If the SL is not taken out, then yes, and why not 🙂
you have used daily timeframe for multiple candlestick pattern. Can I use 5 min time frame for multiple candlestick pattern in intraday?
Of course, you can.
Hello sir, I am totally beginner here. I just have one question. I can see candlestick charts for one session at a time. Generally I use kite app for this.
But how do you plot candlesticks for two different days? I could not find this option in the kite app or any other charting app. Could you please guide me?
The chart takes care of this, you dont really have to do anything specific for this 🙂
1..does it valid when at the bullish trend bullish green candle is bearish engulf with red one but not body (with mix of body and week) ??.. and also another one ,,2.., one bullish candle is formed and another red candle / green candle formed and after that bearish candle which engulf the first one . I mean there is one candle between them . does it also valid?? . ( 2 questions)
Hmm, not so much. Do check this – https://youtu.be/1kQjXFL4Mfc?si=vMlzseAliwvtivLZ
Sir, What if at the end of downtrend on P1 it\’s a doji with a very thin body and on P2 it was a normal bullish day easily engulfing P1 Candle, Should I go long with that?
Yes, as long your conviction on the pattern is high 🙂
Hi Sir,
Please guide what to do if the bullish engulfing pattern is formed during uptrend. I checked this in Dixon today i.e. July 14, 2025.
While it is not specific pattern, you can consider that the bullishness is ongoing 🙂
Karthik sir what is the difference between varsity app module and varsity website module
They are similar, just that app offers lot more features like quizzes, keeping track of progress, audio and video content etc.
sir, as we can see in the charts after a pattern formed – bullish/bearish engulf, after few minutes the pattern again starts changing. form this i understand that we should at the time of closing a stay on the trade for few minutes and book some profit and exit. am i right??
or else should we wait till the next day??
You can do this as well, based on your risk appetite.
Thats right, for this reason you need to fix on the pattern you are trading and id the SL and target.
Hello sir aditya here sorry to disturb you again but i had a doubt i was revising everything that i had studied in technical anaylsis module so doubts were popping up , sir in the piercing pattern after the red candle on P-1 there is a blue candle on P-2 on all the images that u have shown the blue candle is covering about 50 % to 100 % the lower half of the candle , but sir if the blue candle on P-2 covers 50% to 100% of the upper half of the candle is it still a piercing pattern , again sorry for taking so much of ur time sir
That wont be a piercing pattern, but I\’d consider it as a bullish sign. Check this – https://youtu.be/z0Rwoz6PduM?si=-fBQqrU5zCGyw6Qy
Hello kartik sir aditya here , sir if in the bullish engulfing pattern if the open price of candle in P-2 is higher than the close of P-1 but with a very minute difference can we still call it a engulfing pattern or no
Yes, you can still consider it as a bullish engulfing pattern.
hello kartik sir aditya here i had a doubt, sir suppose in the engulfing pattern the candle on P1 is extremely small as compared to that of P2 is it still a englufing pattern , like is there any restriction on candle size for this pattern
Technically no, but I generally tend to avoid trading such candles.
ohk thank you sir , i\’ll make a note of this
Sure, best wishes Aditya 🙂
How to place targets?? you emphasise a lot on having stoploss. My main problem occurs when i can\’t exit a trade after making profits. What can be the target for trade that we placed following a particular pattern?
For targets, you need to identify using techniques like support and resistance. Or it can simply be a time based SL or a fixed % as well.
Sir you said in the bullish engulfing pattern, \”Here is an example of perfect bullish engulfing pattern formed by Cipla Ltd, the risk-averse trader would have completely missed out a great trading opportunity.\” Can you just tell that how? is it like on the 3rd day, the day after P2 is a hammer?
Thats right, the risk-averse trader takes the trade after a confirmation is in place.
For the piercing pattern you said \”engulfing should be between 50% and less than 100%. For example, if P1’s range (Open-Close) is 12, P2’s range should be at least 6 or higher, but below 12.\”
Query – Suppose in the above example, range on P2 is 13 (i.e. more than range of P1) but it engulfs only say 90% of P1 candle. Would it still qualify as piercing pattern or both criteria, engulfing and range should qualify for the same?
Yes, anything above 50% qualifies.
Hello Sir,
I need one clarification for engulfing bearish pattern. It is suggested that after P2 validation we should take a trade. In the case you are planning to buy the share than are we not ending up buying at higher price when we know that trend is in for a reversal
The idea is to buy with a hope that the price will go higher 🙂
Oh got it
Good luck!
Sir, can I use these all patterns in crypto intraday trading.
I\’ve not used it myself, so cant comment. But I have seen ppl talk about using the same for Crypto.
sir please explain that as you said in presence of doji in up-trend, it will work in down-trend also?
and colour of doji matters?
Across sections covered in this module it is mentioned that a risk taker makes the trade on the same day as the candlestick pattern starts shaping up at around 3:20 pm, so all such trades would be delivery and not intraday right?
And if so, how come any short sell trade can get initiated at the end of the day? Are short sell trades possible in delivery too ?
Yes, these are trades that will happen in F&O where you can short and hold the positions overnight.
That has to be in lots not in few QTY , Unlike it cash segment ?
Yes, thats right.
Cash market = any quantity you want
F&O = multiple of lot size.
hai sir your content very useful in my question is using time for this 15 mins or 1 day time frame
I personally prefer end of day chart. But if you want to look at intrday, then yes, 15mins is good.
In the 3rd chart diagram on CIPLA chart, the previous bottom formed at the leftmost, Is it a morning star ? Thank You.
Looks like it. But dont really see a prior trend.
Can we consider the same conditions for Doji formation after a bullish engulfing formation?
Yes, you certainly can.
Hello Sir, in bullish engulfing pattern you have mentioned a sentence \”a bullish pattern which prompts the trader to go long\” , this means we can hold for a long term or it means the trend will go bullish. Can you please clarify
Yes, you can hold the positions for long.
bit confused . how can we trade bearish engulfing candle as a risk taker . Can we hold short position in equity?
For intraday you can. But if you wish to hold positions for multiple days, then its via F&O.
When market is in up trend…on day 1 we have a green candle and on day 2 there is a red candle engulfing the day 1 candle. So if i want to short the stock..i would probably sell it around the closing of day 2 right. So my question is regarding the stoploss, as the chapter says to have the stoploss around the open of day 2, would\’nt it be much more efficient to put the stoploss around the price you sold it at, in turn minimizing your loss instead of putting a stop loss around the opening price of day 2?
Thank you.
You can, but generally speaking, its the day\’s high (in case you are shorting) kept as the stoploss.
Market do not move linearly it may retrace and eat your stop-loss most of the time in this case
Linearity as a feature does not exist in markets 🙂
Thanks,Karthik.
You are helping me all the way…
Happy learning!
\”next few successive trading sessions\”
What you guys mean by this,some more days or some more hours.As a beginner i am little bit confused.
Every day is a trading session. For example – Mon, Tue, Wed – these are 3 consecutive trading sessions.
Hi Karthik, thank you for responding. Can you please tell me how do we calculate the momentum?
You calculate the returns on a daily basis and check. Here is a video that to help you understand – https://www.youtube.com/watch?v=eMuGV8t3ejo
August 22, 2024 at 10:47 am
Hi Karthik,
Is the candle of 20 Aug 2024 in daily TF of Bikjai an example of Dark Cloud cover pattern?
Thanks
Karthik Rangappa says:
August 23, 2024 at 10:42 am
Yup, you can consider that. But the stock seems to be in a good momentum.
In the above conversation you said the stock seems to be in good momentum, what does momentum here mean? Doesn\’t the appearance of a CS pattern means possible change in sentiment?
Thank you
Momemntum is the rate of change of returns. Higher the rate, higher is the momentum.
Right, thank you tho 🙂
Sure, happy learning!
No worries:)
Karthik can you please confirm the following in TCS Daily TF,
1. Latest trend is up (14th – 21st Aug 2024)
2. Candle of 22nd Aug is a Marubozu as well as a bearish engulfing?
Ah, Dixit, wont be possible to check and confirm stock specific trends 🙂
Thank you so much! What abut HDFC?
Ah, was unable to check.
It is Bikaji, sorry.
Also, would you say the CS pattern on 16th Aug HDFC Bank 2HR TF between 9:15 and 11:15 is Bullish Piercing?
Got it. I posted about Bikaji.
Hi Karthik,
Is the candle of 20 Aug 2024 in daily TF of Bikjai an example of Dark Cloud cover pattern?
Thanks
Yup, you can consider that. But the stock seems to be in a good momentum.
Yes! I had 15-30 mins chart in my mind whereas you meant EOD charts, got confused there a bit.
Thank You
Sure, hope all clear now. Good luck!
You said it takes 2 days to form engulfing pattern, but what if it forms on the first day itself? I\’m Confused.
Let\’s say a bullish engulfing forms on Monday at 11am itself, then why should one wait for day 2? He can go for a long trade at that time only right?
When you say it forms on Monday, you are talking about Friday and Monday candles together. Just Monday alone cant form a two candle pattern right?
I have a doubt with respect to the below statement for piercing pattern.
\”For example, if P1’s range (Open-Close) is 12, P2’s range should be at least 6 or higher,r but below 12.\”
Does this mean that (open-close) of p2 should be more than 50% of (open-close) of p1? or close of p2 should cross 50% of (open-close) of p1?
Close of P2 should be higher than the half way point (real body), of P1. Thats a easier way to look at it 🙂
Karthik, this would be for both Piercing & Dark cloud right?
Hi Karthik,
How would we know that it is forming engulfing pattern at the end of the day? Should we wait for another day? How long should or can we wait to know that an engulfing pattern would be forming?
You can compare the OHLC just before the close to get a sense of what has transpired during the day, compare it to previous day\’s candle and make a call 🙂
respected karthik
you made great sessions. can you please make it in downloadable pdf?? it will reduce dependency on internet. we can read it offline also.
once again thanks for making such great sessions.
The PDF is already made available, Shantanu 🙂
Hello Sir,
When doing short trades, one has to buy back shares before 3:30 p.m., so how will the risk taker make profit after going short at 3:20 p.m. on day 2? since he would have to buy at 3:30 right and there is no profit at that time.
You can short the stock by using derivatives contract like futures and options.
Hi Sir
when we can\’t short stocks overnight but only intraday ..
How can we use / make most of bearish engulfing or other beaish patterns ?
You can short via derivative instruments like futures and options.
Hi Mr. Karthik,
Your efforts in preparing these modules are really appreciable.
Could you please let me know,
Can we use these candlestick patterns to understand the price trade action for swing trading, if yes then what time frame is more suitable, because for a particular stock in a given time, the patterns are different in different time frame. Thanks
I\’d suggest for swing trade you look at the EOD charts itself. Any shorter time frame for this could be detrimental.
I see that you have mentioned that an MIS short trade is being initiated at 3:20 pm. But isn\’t shorting an intraday trade? If the trade is initiated at 3:20 pm, the trade would get squared off before 3:30pm right? I dug a bit and I got to know that brokers auto square off the MIS orders before 3:30pm.
You can initiate in derivatives segment.
I did not get it, EOD of the chart will be useful for intraday option and stock. If I am doing intraday on equity, what will be best 5 minute or 15 minute or 3 minute time frame
I know most people prefer 5 or 10 mins chart for intraday, but I personally like the idea of looking at EOD chart, developing a point of view for the day, and then looking at trade opportunities.
Also for intraday which time frame is best to see charts.
For intraday also, I\’d suggest end of day charts 🙂
https://drive.google.com/file/d/1it9UnH2iMqpng5wYbk4y5nV52DfquQwT/view?usp=drive_link
Thanks.
Hello Sir,
I am new in trading, learning and investing low amount in intraday. I would have attached screen shot
could you please explain pattern and price action for OIL(NSE) of 11the june (Today) for intraday 15 minutes and 5 minutes.
Thanks And Regards
Aman
Aman, you will need to upload the image to Google drive and share link here, make sure the link is public 🙂
Sir, in the trade set up of the Bearish Engulfing Pattern, you say that a risk taker would commence a short trade after checking prices around 3:20PM. But, making a short trade at 3:20PM wouldn\’t be possible right?
Its possible on a derivative contract, Vaib. You can short using futures or options.
Panic with uncertainty is the perfect recipe for a catastrophe.
This is so true.
Yup, holds true for a long time to come 🙂
sir it\’s work in small time pride??? like 15 minutes or 5 minutes or 30 minutes
Yes, but dont do not initiate the trade without any back testing.
Sir, how to determine whether after the Doji is created, we need to long or short the trade?
Just compare the real body – opening and closing, along with the shadow.
Sir good evening, Please pardon me if my question is stupid
In the bullish engulfing pattern you said \” The price action on P2 also suggest that bulls made a very sudden and strong attempt to break the bearish trend\”.
My question is where from these bulls come from very sudden and why these bulls take risk to enter in a downtrending market.
Its the same participants whose views change from bullish to bearish and vice versa.
I want to know whether the doji coming after a bearish engulfing pattern is only considered as a favourable position or is it applicable to a bullish engulfing pattern also.
You can consider this for all patterns, Sidharth.
In the comments section, i do not see the screenshots or imaoges, I am not sure why. Can anyone help me?
You cannot upload images directly, but people usually upload on Google drive and share links in comments.
If trading starts at 9:15 and the square off timing of zerodha is 3:20, then you place order and fluctuate price on 9:00 to 9:15 and from 3:20 to 3:30 ?
The market is not open till 9:15AM. So these are just pre open orders.
Why would a risk averse trader enter into trade on Wednesday 3.20pm rather than the day\’s opening time (considering P1 occurred on Monday) in case of bullish engulfing pattern?
That is to ensure that the pattern plays out as expected, so basically more confirmation before initiating the trade.
does these all candlestick patterns work in intraday trading and on 5 to 30 mins chart
These are all patterns which have odds, from my experience, better with on EOD basis rather than 5 mins.
Will the presence of a Doji after a bullish engulfing also mean a strong trade call??
Asking because, the above example you have mentioned is for a bearish engulfing pattern.
Yeah, generally it does 🙂
hey, should we have to keep in mind all the stick patterns (both single and multiple) while trading or is it fine either only single or only multiple, because i feel there are few patterns which signify upcoming downtrend but the trend tends to go up even after that also.
Check this Dhanush – https://www.youtube.com/watch?v=z0Rwoz6PduM&list=PLX2SHiKfualEyD05J9JsklEq1JFGbG6qJ&index=3
Hello Karthik, in the cgart just above section 8.6, you can see two more bullish engulfing patterns being formed. But the prices have still moved downwards. It violated the bullish engulfing pattern. Can you explain that ?
There is no guarantee that the patterns work out. Patterns are just indicators of what is could likely happen, there is no certainty in the market.
Thanks for the link and it did help me to understand what\’s important !!Appreciate your revert !
Happy learning, Jitin 🙂
Thanks for the this Session, Just realized if we missed Harami Candlesticks in this session ?? If yes where can I get that info ? Thanks again !
Do check this, at some point you will have to look at the price action and move away from remembering patters – https://www.youtube.com/watch?v=z0Rwoz6PduM&list=PLX2SHiKfualEyD05J9JsklEq1JFGbG6qJ&index=3
can we use engulfing pattern in a day or we can use it in intra day also like 15 minutes
You can use intrday as well, Anuj.
\”On day 3, let us call it as P3, though the opening is weak it is not much lower than P2’s close. This is not too comforting for the bulls, as they expect the markets to be stronger.\” Can you please explain this statement again Karthik sir.
If the opening on Day 3 is not much lower than on Day 2 it should be comforting to the bulls right?
In a bullish market, the traders, mainly bulls expect stronger opening. In the absense of a bullish opening, the confidence of traders to place long trades is not much and that can leads to giving way to the bears.
I am confused on days you said one candle will be on one day another will be on anoither day what does that means, what if graph is of the same day and the pattern forms. Why you are refering different canles with days?
Sorry, I\’m unable to get the context. Can you share with an example and elaborate your query?
can we use all of the things on 15 minutes time frame?
kuki agar hmko options me jana hai too 2 dino tk wait krna !!
please help??
Yeah, works on 15 minutes time frame as well.
You are using \’day\’ in the modules. Will these strategies work in 15 min charts if I want to trade intraday?
Yeah, the interpretation of candle stick patterns is the same across all time frames. My personal preference is to use it by end of day.
can this patterns be used in intraday trades or shorter time frames than a day?
is Color matters when we see an engulfing pattern ?
Yes, it does and I\’ve explained in the chapter on how the sequence should be.
The content published here is absolutely amazing, no amount of admiration for the teacher in the video is enough! If and when I feel confident about trading, Zerodha would be my preferred platform for the brownie points they\’ve earned for explaining to humanities student such as myself such difficult concepts so lucidly.
Thanks so much for the kind words, Bhavika. I hope you continue to enjoy learning on Varsity 🙂
Hi Karthik,
Let\’s assume a stock has down trend then appears the long red candel(p1) after next day gaps up and opens at half of the previous candle and covering p1 open
Shall we consider it as piercing.
Thanks
Yes, that is a piercing patter, although a little more than half of P1 is better.
I could not understand the failure of PIERCING & DARK CLOUD COVER PATTERN, Can you please explain it?
Which part, Padma?
do bearish engulfing pattern apprear in downtrend?
do bearish engulfing pattern apprear in downtrend?
Please refer today and yesterday pattern in Nifty 50
Bearish engulfing by defenition appears in a uptrend. If you see a pattern in downtrend, then its not really bearish engulfing.
Hello karthik ji,
Can engulfing pattern applied in day trade also on 15min chart
Thank you
Yes, you can.
Doji alone can\’t explain much, basically a doji means market is in confusion and anything can happen after a doji but to predict better, you should use multiple candlestick patterns or other indicators.
What if a doji is present as P1 of a bearish engulfing pattern?
Then its not an engulfing pattern 🙂
Hi Karthik sir, thanks for these mind-blowing lessons.
Asking this since it\’s not mentioned here in this module, can we use these multiple candle stick patterns in a 5 or 15 minutes basis for intraday?
Coz we only discuss about the \”day\” candles here.
Glad you liked it. Yes, you can, in fact have mentioned that candlesticks can be used across multiple time frames.
Hi Karthik and Team,
Thanks for the great explanations on all these. I completely learned trading basics from Varsity, Zerodha.
I have a quick question – Can we consider all engulfing patterns will make a change in the trend as a reversal?
Thanks
Thiru
Thiru, yes, in a way that works.
can also work on any time frame means,5min,15min,30min,45min
Yes, thats right.
1) In multiple candlestick pattern candle timeframe on daily chart is compulsory otherwise apply on 15 min/1 hour is also fine?
2) As a risk-averse in both piercing pattern/ dark cloud cover where we take trade
confirm p2 and take on 3rd day
low of p1 than initiaties the trade on 3rd day
1) Yes, but I\’d suggest you avoid 1-minute candles.
2) Thats right. On p3 at day opening.
Hey Can Anyone explain, how can shorting at 3:20 work, the markets will close and we have to buy back or else the position gets squared off on it\’s own. So how can someone ensure, whether it\’s a red candle day and then short?
Aniket, shorting can be done by futures contract or via options. These positions can be held overnight.
very informative
Hi Karthik, Can you help me connect with someone who can solve this issue, I am able to buy BSE stocks on Zerodha but unable to Buy NSE
Please do call the support desk for this 🙂
What is the time frame for the multiple engulfing pattern
A minimum of 2 days, Hari.
I have a confusion in selling a short in stocks. As explained in earlier chapter we can sell the stocks we don\’t have only in intraday. So how we short in long time in bearish pattern as this are day chart??
Can you explain??
To do that, you will need to short via futures or options. It is not possible in spot market.
Nice beautiful like
Sir we need RS(RELATIVE STRENGTH) in fx chart IQ
Please THANK YOU DHANYAWAD DHANYAWAD DHANYAWAD
The same charts are available for CDS too right?
What if Bullish or bearish Engulfing appears at sideways trend? can we prefer it as a englufing pattern or not?
These patterns need a prior trend Atharva. Priod trend is an integral part of the pattern, without which, we cant even consider it as a pattern.
thanks @asiam
thanks karthik sir
Happy learning!
@Dipu – yes, you can expect a downtrend, irrespective of whether it\’s Doji or other candle as it was engulfed by a Bear candle.
Having said that, you need to see whether the following P3 candle is breaking P2\’s low and sustaining. So this would confirm that the trend is reversed. (please consider at least 5&15min T-Frame for intraday and 1D T-Frame for swing). Along this, remember to consider other parameters like Resistance, Pattern too as this would help you to take a trade with confidence.
it\’s about a bearish engulfing pattern suppose on p1 green doji is formed on an uptrend, and on p2 red candle stick is formed engulfing p1. Can we say that the market will go on a downtrend because of the presence of Doji which explains indecision in the market and bearish engulfing saying it going to be a downtrend?
Hmm, so Doji should not be a replacement for a regular candle, but although in this case, I\’d be more comfortable with a short trade than a long trade.
i am new to trading,sorry if my questions sound naive.I failed to understand how the P1 & P2 pattern seen in a single chart,bcz both happens to be in 2 trading session i.e two days.Plz clear my doubt.
Dibya, a chart shows multiple trading sessions. So P1 and P2 occur on two consecutive days. I\’d suggest you check this video series – https://www.youtube.com/watch?v=yzRP-mA2eiE&list=PLX2SHiKfualH_xMbGM-3zWC47s9gUjGR_
Thanks Karthik
And can you also explain me that as a risk averse trader in the engulfing pattern when I am gonna take the trade if I am looking intraday
And also if I am looking EOD charts
Since, its intrday, you take the position on the same day but after ensuring there is a confirmation candle on P3.
And also I wanna know that we should look for P1 or 1st candlestick at the beginning or end of the trading period ?
Same for P2 candlestick?
P1 and P2 indicate the sequence of candles, Kunal.
Hi kartik
In engulfing pattern do P1 and P2 appear on same day or on different days?
If you are looking at EOD chart, then P1 and P2 appear on two consecutive days. If you looking at intraday, then yes, it will appear on the same day.
Sir, Its mentioned that a risk taker initiates the trade on the same day (P2 – in engulfing pattern). Which type of trade is initiated here (like Intraday or…)? How do we initiate trade at the end of the day??
These are overnight trades, Bibin. If you are buying stocks, buy under CNC or if its futures, then NRML will do.
Engulfing, Piercing and Dark Cloud Cover pattern\’s en pattern\’s ko intraday ke 5 or 15 minute chart par use kar sakte he kya?
Hello sir, hope you are doing well..
Sir, I was having a doubt regarding the piercing pattern, is it that the open for P2 must be lower than P1\’s close? Or holding it somewhat flexible, I can consider it as an piercing pattern if they both are same?
Thanks in advance
And sir, thank you for making all these educational contents, I want to know about financial markets(it\’s my dream, a obsession may be) and as an economics major student, wants to pursue my career in the same and these helps me a lot.
Subhrojyotee, its best if P2 opening is lower or, at best equal to P1\’s close. Definitely not higher than P2\’s close. So work around these constraints. I\’m glad you liked the content. Happy learning 🙂
Got it, Dark Cloud
Does PIERCING PATTERN is also valid for bearish engulfing?
Not really, in a piercing pattern, the candle on P2 just covers more than 50% (but less than 100%) of P1\’s losses.
Hi Karthick 🙂
Looking up the candles of ITC Ltd.(NSE) as on (21st November 2022 and 22nd November 2022), Can we name the pattern as a Bullish Engulfing? (The prior trend is a bearish trend)… and my next question is that should the High and Low of the P2 candle should also engulf the P1… or is it only the candle\’s body which would Engulf in order to form a Bullish engulf.
Yup, this can be considered as a bullish engulfing and as long as the real body engulfs, it is fine.
First of all, Karthik ji
Thank you for The lessons you have added and explained so amazingly. I am glad that I get to read it on daily basis.
My question is, when you mention Bulls and Bears who are creating buying pressure or selling pressure in market, who are they, on which basis do they trade? How do they decide that now is the time to sell or buy this particular stock? Is it based on News about a particular company or industry?
Since they are reasons behind this certain patterns in candlesticks.
These are traders like you and me, maybe institutions as well. All of them read the markets, the price action, and decide to be either buyers or sellers in the market.
Hi Karthik,
First of all, Thanks for this initiative being taken by Zerodha Team in educating all of us.
My Question: Do we have any trading system which notifies us whenever any such candlestick patterns like Hammer, Spinning Top, Bullish engulfing etc. are trigerred.
I practically feel this is very difficult to checkout all the stocks.
Raman, you can use scanners for this. Please check with folks from streak.tech once for this.
When two green candle merge/ bend , how the final green candle look like ( whats math behind it?)
When two red candle merge/ bend , how the final red candle look like ( whats math behind it?)
Ah, I;m not sure what you are referring to. Can you point to a real candle so that i can see what you are talking about?
can you tell me wheres is P1 and P2 in the chart because there is no sign on the chart so how can i understand ?
P1 is the last but 2nd candle from the right and P2 is the last candle on the right. Basically the recent two candles.
For engulfing patterns or any other candlestick pattern, there has to be a prior uptrend or downtrend. My doubt is that how many days candle we need to see to determine whether the prior trend was up or down?(I look at daily timeframe)
At least 8-10 trading sessions.
Hello Sir,I wanted to ask how many candles should we see to consider if there is an uptrend or downtrend? I mean if it\’s fine if the up/down trend is of about 3-4 candles.
For short-term swing trading, at least 8-10 trading sessions I\’d say.
Hi,
\”However, engulfing should be between 50% and less than 100%. You can validate this visually or calculate the same. For example, if P1’s range (Open-Close) is 12, P2’s range should be at least 6 or higher,r but below 12\”
I think the above statement is not entirely accurate, or I am probably missing something. If the P2 candle has to cover 50% or more but less than 100%, then we cannot specify based purely on the range of P1 what the range of P2 should be. Above statement says, if range of P1 is 12, then P2 should be at least 6 but not higher than 12, but what if P2\’s (blue) Open is well below close of P1 (red), so much so that it\’s range is 10 but it only engulfs P1 30% Does this pattern hold in that case ?
Would you be kind to clarify ?
Thanks,
Alok
In that case, it won\’t be a piercing pattern, but some other pattern. Check this – https://www.youtube.com/watch?v=z0Rwoz6PduM&list=PLX2SHiKfualEyD05J9JsklEq1JFGbG6qJ&index=3
in the bullish engulfing pattern\’s first chart, we bought the share at 169 then how come we stop-loss it at 158.5? I think it is a loss-making trade and you have mentioned it as profitable for both risk takers and risk averse. please, let me know if I am wrong?
Buy at 169, SL at 158.5, and the SL was never triggered, right? So why do you think this was a loss-making trade?
Sir, why isn\’t that the open on day 2 in bullish engulfing pattern should be equal to or lower than previous day\’s close and why can\’t it can be higher and similarly for the bearish engulfing ?
The lower open entices the short sellers to build more positions. More leveraged position = higher panic when prices increase, which is better for a long position.
Hello Karthik,
Yeah you are right.
I got confused earlier in reading P1 and P2. And I understood it now.
Thank you for all the replies and clarification.
Sure, happy learning 🙂
Prior trend*
Hello sir, in one of the comments you told that with some flexibility we can consider the pattern as engulfing pattern even if prior to trend is not accordingly…can you specify those flexibility?! Would be grateful cuz i guess I am too late here😞 Also, thank you for such wonderful & informative content
There are many such points where you can bring in some flexibility. For example, in bullish engulfing open of P2 should be equal to P1 close…..but it is still ok if P1 close is equal to P2 open.
Why am I not able to see ss in comments? I am not able to clear my doubts
Hi Karhtik,
I was referring to 8.2 – The Bullish Engulfing Pattern. Yes candles between P1 and P2
Thanks,
Vinayak
But there is nothing between P1 and P2, right?
Thanks for replying Karthik!!
for multiple candle stick patterns we need 2 or 3 trading sessions data right? (Here trading session means 1D data??)
If I assume that as 1D\’s data then we should have only 2 or 3 candle sticks isn\’t it?
Examples which you have mentioned with the chart has multiple candle sticks between Pattern 1 and Pattern 2. I wanted to understand why there are so many candle sticks.
Please help to clarify
Are you referring to dojis? Which chart/example are you talking about?
Hi Karthik,
However, when analyzing multiple candlestick patterns, the trader needs 2 or sometimes 3 candlesticks to identify a trading opportunity. This means the trading opportunity evolves over a minimum of 2 trading sessions.
If we go with above points how are we seeing so many candle sticks in between Engulfing Pattern?? Isn\’t it supposed to be 2 or 3 candlesticks?
Are we using any hourly based candle sticks between days??
Thanks,
Vinayak
Not sure what you mean. Can you quote an example?
In a Day chart of CG POWER near about 14 May is there bullish engulfing formed??
Around 11th May, you can consider that.
Hi Karthik,\’
This bullish engulfing and bearish engulfing pattern if it formed during the day time like around 10am to 1 pm so do we consider this opportunity for trade or does this patterns only work at day end time like 3:20 pm.
You can still use it for intraday trading, Sagar.
Sir one big Red candle and 5 to 6 candle inside it what that mean
Hi Sir!
what we have to choose as the stoploss , closing price or low price.
I\’d say close price, but sometimes intrday situations will force you to close right away without really waiting for the close price.
Sir with the engulfing pattern for example in bullish engulfing, the P2 open price should be lower than P1 closing price? Or It can open higher than P1 closing and still be called engulfing (provided all other conditions are met).
It can be slightly higher. But make sure P2 close is higher than P1\’s open.
Really wonderful chapter sir. Thanks.
in the 2nd chart of bearish engulfing (the first from left encircled), the p2 open is basically equal to p1 close but above you said the p2 open should be higher than p1 close. does it matter much?
What we can say is based on the time frame the trader is trading he can be classified as risk taker and risk averse.
Ex.In a 15mins time frame:-
1) A Risk Taker:-Will immediately initiate a trade after identifying a particular pattern or when a pattern is been forming.
2) A Risk Averse Trader:-Will verify the particular patterns trend after identifying the pattern by seeing the next candle. In case of bullish engulfing will verify when the third candle is formed.
Kindly throw light on the same.
Thanks in Advance! !
Yes, thats right Paras.
This is high quality.
Thanks for creating these modules !!
Happy learning, Shivam!
Sir, to conclude whether the prior trend is a downtrend or uptrend, how many candles in a daily chart should be considered. I am very confused at this point. The trend could range from a week to years and in between, there could be many ups and downs. Sir, please guide.
Rinkoo, I\’d suggest you consider at least the last 6 months\’ data to get a sense of how the market is moving (get a sense of the trend). Data less than that can be misleading.
So if the P1 falls on a Monday, the risk-averse would be initiating the trade on Wednesday, around 3:20 PM. Which means the risk averse will take position only for 10 minutes as market closes around 3:30.
And why not at the start of the day at around 9:15.
No, you can buy and hold. These are not intraday trade.
I use zerodha kite. The trading view is ok. What it would be like if zero dha kite signals when a particular candlestick pattern appears.
You can try the \’Candle pattern\’, indicator. I think its on ChartIQ.
sir,
at what timeframe the risk averse wil confirm the next day is red or blue candle day to make a decision for entring into the market for any type of candle
You can figure this out by end of the day around the market close. It will give you a sense of how market is likely to close and you can base your trades on that.
Hi Karthik,
what is the best time frame for candlestick analysis for intraday?
Would the time frame be the same for swing and intraday?
I\’d say EOD for both. But I guess 15 mins is a good time frame for intrday.
Sir what if I apply this trend in intraday strategy it will work or not if I use 5 min chart or 15 min chart for this strategy.
Sir please clarify.
You can. I\’d suggest you look at 15mins rather than 5 minutes.
shouldn\’t be the closing price of a stock be opening price on next day ? if it shouldn\’t be how that\’s happening ? can you help me understanding that ?
Nope, the opening price is different compared to the closing price. Of course, unless there is a new event which impacts the prices, the opening price wont be very different compared to the previous day closing price.
I have been studying here for last few days.
Every concept has been told in such an absolutely crystal clear way that even a layman can start understanding and following it. Great! Thanks.
Glad you liked the content, Devinder. Happy learning 🙂
as we cant short sell on cnc , so how we can short at the closing time of market if we see a bearish engulfing pattern
Dhruv, you can short via the F&O segment and carry forward the position.
As you mentioned the formation of a Doji after a recognized pattern may result in a catastrophe for either bull or bear. My question here is, in a bearish engulfing pattern, does the Doji have to be blue or it could be red as well? Either indicate indecisiveness, but to sum it up does the color of Doji matter in this case? Or if it is bearish Engulfing and a Doji has been formed the price is bound to fall irrespective of the color, am I correct.
(P.S: Tried framing the question twice i hope yall get what I\’m trying to say:))
It can be any color Mihir. The color of Doji does not really matter, it is just the pattern + doji that we need to look at.
what if bearish engulfing pattern forms on downtrend? Is it signal of further down in price?
Yes, I\’d treat that as a bearish signal.
Can these all candlestick pattern applicable for 5mins, 15mins Timeframe?
Yes, you can Vikas.
what if a good downtrend then we see a bulls try to pull the market upward and a dark cloud cover occur than what you will do
You just have to go with the flow and set up trades basis price action (candles). Once you do, stick to the trade and follow the target and SL.
Sir,
you explained reconzible candle with doji indicates more strength for reversal – is it applies only for engulfing patterns(bullish and bearish) or it applies all multiple candlestic patterns?
This is just a personal obseration, its applicable to all candles Sriram.
you said \”The open on p2 should be equal to or lower than p1 close\”. What if the open on p2 higher than p1 close? What is the psychology behind this..
That\’s ok, but it\’s comforting to see it open lower. Evaluate this on a case by case basis.
In bullish piercing pattern the green candle should open gap down ,is it necessary or not?
If you are asking my personal preference, then yes, I\’d prefer it that way.
others are added some charts, how to see them?
their charts are not visible
These are updated on the user\’s Google drive, not sure if they have deleted it.
for tata steel, 1 st dec candle, would you consider as hammer pattern or any other and is it trend reversal?(could u please check chart bcz idk how to add chart here)
other parms volume,support are satisfiyng
It is a hammer, Sriram. Would have liked it if the opening was lower than the previous candles with a longer lower wick.
Sir, what is the relation between lower time frame or higher time frame? Like we have a buy signal in 10 min but sell signal in 1-hour then which one to follow?
Stick to a single time frame, Aaksah. I\’d prefer the higher time frame charts.
Please Explain about GAP Theories. Runaway and exhaustion gaps
Sure, will add this to the list.
Does the position of p2 candle really matters in a dark cloud or a piercing pattern , as long as it is engulfing more than 50 -99 percent of p1 candle ?
Yes, plus ensure that the open is below the open of P1.
If a trader puts in a trade at either the end of P2 or at the end of day after P2 based on the risk appetite, wouldn\’t that trade be a CNC trade and not a MIS trade?
That\’s right, the idea is to buy and hold for a few days till the target is hit.
Great Learning!!
Happy learning!
Hello sir,
This is Ambuja cement chart.
The OHLC data for the bearing engulfing pattern (encircled at the top end of the chart) is as below:
P1: Open – 214, High – 220, Low – 213.3, Close – 218.75
P2: Open – 220, High – 221, Low – 207.3, Close – 209.4
The risk Taker will buy on p2 at closing price of 209.4 and stop-loss of higher of p1 & p2 i.e at 221.
My question is how can the stop-loss is higher than the closing price of p2 when there is downtrend in bearish engulfing pattern?
Thats right, SL is always at a higher price than your entry price for short positions.
Nice Read,
Can someone share their experience of using Engulfing patterns for intraday trading, where the candlesticks are available on a hourly basis. If these are not beneficial what other indicators would you recommend for intraday trading.
I hope others can answer this for you 🙂
Personally, this is one of the better patterns that I\’ve used.
all this module are super educative….superbbbb
Happy learning, Neelam!
Hi Karthik. Is presence of the Doji on a Bullish Engulfing Pattern a high probability trade. In your above teaching, you have mentioned it on a bearish Engulfing Pattern only?
Relatively yes, but please remember there are no guarantee in markets 🙂
Hi Kartik,
I am learning technical analysis from Varsity app. Thank you for bringing such an amazing content.
My query is regarding \”Presence of Doji\”. Here you have explained about the Doji following a Bearish Engulfing.
My Question: In case of downtrend if a bullish engulfing is formed followed by a doji irrespective of it being red/green, will the candle\’s real body be bigger on Day4?
The expectation is that day 4 will be a long bearish day.
How stop loss (i.e High of P1 and P2) in bearish engulfing pattern will be helpful ? As when bearish engulfing pattern formed , so one should short the trade and if stop loss is set to high of P1 and P2 then it is already reached , so trade will execute at any cost and we get loss from it?, please help to understand this. Thanks in advance.
No, SL is placed after you initiate the trade right.
Thanks for the reply sir!
Good luck, Aravindh.
Yes sir it is a EOD chart. As you had said for a bullish pattern the prior trend must be a downtrend. How many trading sessions should be considered to be qualified as a downtrend. I mean certain patterns form after a good down move whereas certain patterns form after a small down move like 4 or 5 candles. Which one can be considered as a downtrend.
I\’d look at at least 5-8 sessions of downward movement or at least 8 -10% decline in value for calling it a short term downtrend.
https://drive.google.com/file/d/1EfHAYiXi7XTVBCSDtBFnJqMSlWh67o9r/view?usp=sharing
In this chart the latest candle has formed a bullish engulfing pattern. But can it be considered as a downtrend because it is only a small move with 4 or 5 candles. How many candles or how much move can be considered as a downtrend or an uptrend?
It can be, I\’m assuming this is an EOD chart.
Sir there is a chart of Cipla in bullish engulfing pattern. So after the P2 pattern has emerged there is a red candle on the next day so does this mean that risk averse trader won\’t be executing the trade because of there is a red candle after the formation of engulfing pattern ?
Thats right, Bhavya. The risk-averse traders want a confirmation of the trade picking up in his/her favour.
Hello Karthik,
Fantastic Work!
1) Do these patterns apply to intraday 1 minute candles as well? I read your answers above and they suggest that they can for upwards of 5 min.
2) If i am trading intraday and and analysing at that granularity, then it means that my target will be not too above the CMP. In which case i will have to actually increase my position size to make decent profit = more brokerage+more transaction cost. Have you, in your personal experience, ever found this setup profitable?
Since most of the use-cases which you explain are in the swing-trading space.
Best
1) Yes, you can apply. 5 or 10 or even 15 mins is my personal preference. As a thumb rule, the higher the time frame better it is.
2) Yes, with such a short timeframe you\’d actually be scalping. This means your qty should be higher, leading to higher charges. I\’m not a big fan of this. I\’d rather do 1 trade a day with a proper setup than multiple scalps a day.
Sir to see a day candle patterns which time frames u would prefer ? & another doubt can we apply these all candle stick patterns to intraday trading sir ? and can we use this in options also ?
I\’d prefer the end of day candle, Babu. Yes, can be applied to intraday and options as well.
@karthick, Why it is mentioned as Day 1 & Day2 for the engulfing candles P1 & P2. Do we need to look the engulfing pattern in 1 day pattern chart?
Yes, I\’d suggest you use EOD charts for this.
What if Doji appears at the end of Bullish Engulfing pattern, can we consider this a big trading opportunity?
Yup, doji after any pattern indicates the possibility of a large move.
Hi Sir,
if a doji if formed on a bearish engulfing day then only a risk-averse trader can take that trading opportunity because the risk-taker would have initiated his trade on P2.. is this statement correct?
Thats right.
Hi sir,got to konw about this varsity through nikol sir\’s podcast in beerbiceps.
And it\’s absolutely fantastic content and it can be understandable with little effort as you have done the major part in realising it.🤗
Thank you very much.
I am confused to qualify a pattern as engulfing if the market open up with a gap up in bullish engulfing and gap down in bearish engulfing.
Please help me.
Happy to note that, Santhosh. I\’ve tried to explain this in the chapters itself. Do let me know if you have any questions about this.
How to select stocks for intraday?
I\’d prefer sticking to Nifty 50.
\”Day 1\” and \”day 2\” is representing the whole day of intraday trading or is it using in intraday trading?
It refers to a candle, if it\’s 5 mins intraday, then a 5 mins candle will be the reference.
Hi Sir,
Will there be any presence of doji in the downtrend?
Possible right.
I am unable to see any chart.
Please help..
Why? What is the issue, Anand?
Can you explain this (it was in the quiz)
Q. What would you expect when a doji is formed right after a bullish engulfing pattern
Doubt: you said when a doji is appeared it indicates indecision in the market, but the answer to the above question in the quiz was \”A large up-move
That\’s correct. Doji right after a bullish engulfing indicates a probable upmove.
Hi Karthik,
How can we short the position on day closing i.e 3.20 if we don\’t have shares & position need to be squared off the same day
You can always initiate the trade in the futures or in Derivatives.
Oh I did just above my last comment. I think you missed it
I\’m really beginning to be a beginner so pardon me if my question is a bit silly.
Not an issue, please ask whatever questions you have in mind.
Hi Karthik,
I didn\’t quite understand the reason behind a doji catalyzing the patterns\’ effects. When we discussed about doji in the \”single candlestick patterns\” section, it was mentioned a doji indicates indecisiveness of the market and that we could square off half our positions in the market at the occurrence of one, so why did our reception to a doji change from \’a possibility of trend reversal\’ to \’a pattern intensifier\’?
Thank you so much for such great content.
I had a smal doubt.
*From my own personal trading experience, I can tell you that whenever a doji follows a recognizable candlestick pattern, the opportunity created is bigger.*
I have borrowed this line from above text. 2 questions reagrding this:
a) If 2 dojis are formed after a recognizable candlestick pattern; is the opportunity created even bigger or should we reject it?
b) You have illustrated that doji after engulfing is better than only engulfing. Is it true with other candlestick patterns as well? With single as well as multiple candlestick patterns?
Ex. ( Marbuzo followed by doji is better than only marubuzo) or ( piercing followed by doji is better than only piercing) or ( haramifollowed by doji is better than only harami) etc.
a) 1 or 2 does not really make a difference. More than that, maybe the market is trying to signal something else.
b) Thats right, infact this is what I mean with the above line.
I really appreciate your effort on the lessons. On the few module I came across word called \’trading sessions\’. I didn\’t understand the term meaning. Is it meant trading days i.e Monday, Tuesday… Friday or stock market timings i.e pre-opening session, normal trading session. I have seen \’2 trading sessions\’ in this module also. Please clarify my doubt.
That\’s correct Leo. A trading session refers to the trading day.
ohh i got it because he is shorting !!
also a request could you change the comments layout the newest ones at the top would be much better.
Noted.
>A risk-taker initiates a short trade at the close of P2 after ensuring P1 and P2 together form a bearish engulfing pattern. The risk-averse trader will initiate the trade the day after P2, after confirming the day forms a red candle.
>The highest high of P1 and P2 forms the stoploss for a bearish engulfing pattern
sorry I did not get this if the price is going to go even lower the next day why would i buy and how highest high a stoploss
can you explain with your example of OHLC what happens how does he book profit ?
Tanmay, I\’ve explained the logic in the chapter and in the comments section. Can you please glance through it once? Thanks.
Can these trends be utilised for an intraday trade by seeing 5/10 or 15 mins chart or it has to be a one day chart ?
Yes, you can. Higher the time frame, the better it is.
What if a Doji follows a bullish engulfing pattern right at the bottom end of the downward rally.. ?
Check if the SL has been breached or not. Else continue to hold the position.
A trade should satisfy at least 3 to 4 points on this checklist to be considered a qualified trade.
What is checklist point ?
The checklist is mentioned in the latter part of this module. Please do check the same.
Sir, why is it ?
I would put my money on the bearish engulfing pattern as opposed to a dark cloud cover.
Bearish engulfing pattern — more bearishness
Dark cloud cover — bearishness (50% and below 100%)
Then, we should chose dark cloud cover right ? If not why ?
I\’d prefer the engulfing pattern since the bearishness is kind of clearer between the two.
Can we use this approach for intraday also
Yup, you can.
Hey karthik, Can you please explain about the Options and Futures?
Please do look at the subsequent modules.
\”This means the trading opportunity evolves over a minimum of 2 trading sessions.\”
In the above statement 2 trading sessions means minimum of 2 candlesticks right. So if its a 15 minutes chart then it means in the next 2 candlesticks the trading opportunity would evolve. Right?
Yes, two 15 mins candles, so basically over 30 mins.
What time frame to select for determining all these patterns for intraday trading
I\’d suggest 10 or 15 minutes.
hi! I have a confusion for uptrend and downtrend, like in the chart shown after 8.4, the presence of Doji, the uptrend shown has some downtrends too, so how many candles should be considered for it to be called a trend ? can 1 candlestick before the actual pattern also be called as a trend ? for eg, its an upward trend then 1 candle is bearish and then a hanging man is formed ? also, two conditions if its formed at the top and if its formed at the bottom?
Like I\’ve mentioned, at least 10-12 session you should consider.
Thank you sir👍🏻
Good luck, Ashish.
Dear Sir,
Does all these single and multiple candlestick patterns are applicable to identify trading signals for intraday trading too?? Or only swing for trading?
Warm Regards..
Ashish, it is applicable across all time frames, intraday and overnight.
In example you mentioned day1/day2……What about if we refer hourly chart???
You can use the same logic for hourly charts as well. Remember, TA works across all assets and all time frames.
P1 and P2 refers through out article are the candle sticks encircled in end of Day 1 and Start of Day2 or entire day?
P1 and P2 refer to the candle formation at the end of the time period, which could be the end of day or the end of an intraday time frame.
Sir from past one week even volatility based stop loss is getting triggered trade goes in my direction and one bad day like today 5-6% down and I\’m struck and no other option to exit
Hmm, thats because the markets are quite volatile Chandu.
Sir for Swing trade should we keep low as stoploss
I follow keeping volatility based stoploss due to this Risk reward ratio is not good I\’m avoiding trades because of this.
Yes, volatility-based SL is good Chandu.
Amazing content. I learnt a lot from these. Thank you for making this free for all. There is error in point no 4 and 7. Risk-averse and risk-taker is interchanged.
Thanks, Rishabh. Will make that change 🙂
Hello Sir, I am having a doubt this chapter begins with the statement
\”his means the trading opportunity evolves over a minimum of 2 trading sessions.\”
This term \”TRADING SESSION\” has been used for past few chapters does it simply mean one day? or does it depend on the timeframe in which we are viewing candlesticks
Trading session = 1 full trading day.
What would be the stop loss in the piercing pattern?
1. Low of the candle P2.
OR
2. Lowest low between the P1 and P2.
Lowest low between P1 and P2. Holds true of other patterns as well.
hi, i am looking at the candlestick chart of escorts ltd.with a 5 minute time frame, there bullish engulfing was formed 2 times and both the time the stock fell from that point. Not only here, in almost every stock i am seeing nowadays that the stock is falling after bullish engulf and rising after bearish engulf.
Rishav, there are no guarantees in the market, we just weigh in on the odds. Hence we have the checklist 🙂
It was really really knowledgeable.
Happy learning, Kevin!
can you add a dark theme
Sure, noted.
Hi sir,
Can we use these candlestick patterns to trade in intraday on 5 minute candlesticks?
By range I meant what would be the TRUSTABLE Candle Body Length for INTRADAY . And could we trust multiple candlestick pattern in intrady trading ??
Trust is a function of how rigorously you have backtested the candlestick patterns 🙂
Hi Sir ,
As mentioned Engulfing, harmai, piercing , dark cloud , morning & evening star Should be seen on 2-3 day timeframe. But when we do INTRADAY can these pattern be trusted in 5,15, or 30 min time frame & if yes then what Should be the reliable range of candle because in shorter time frame it\’s rare to have candle with 1 % body range
Thats right, Ayush. I\’d suggest you look at 10 or 15 mins candles, but I don\’t get your question on the range bit. End of the day, you only look for the pattern right?
Sir – for short term view say for few weeks – which time frame is useful on the chart – Monthly ??
I\’d say EOD.
Can elaborate EOD basis I don\’t what know what that means
EOD = End of day basis.
Are we supposed to use engulfing on only day basis ?
Can i use them in intraday as well for maybe 15min timeframe?
You can use it on EOD basis as well.
For uptrend should I set my stop loss at the support line or just below it?
Thank you so much.
Just below may be good since you have the trend going in your favour.
Sir, if a doji is engulfed by a blue or red candle, you can still call an engulfing bullish or bearish?
Thank you.
Hmm, technically yes, but I\’d not base my trades on that.
Hi Its a nice and very great effort by you . thank you so much for that..
few questions i have
Single candle stick works for which time frame best?
Does multiple Candle sticks always need to work on daily chart only, or it works on 15-30 minute time frame also?
From your experience and perspective, which candle pattern is most profitable?
There is no preference of single candlestick and timeframe. YOu can use all candlesticks patterns with all the timeframes. The profitability depends on how well you manage risk.
Sir how can one short stock when it is at resistance in spot market.. following the checklist if evening g star forms at resistance with prior uptrend should I go ahead and short if other checklist confirm
It could lead to short delivery right??
Yes, as I mentioned, give more emphasis on the CS pattern and everything else is auxiliary.
This is mind-blowing stuff… Thanks Karthik
Happy reading, Manish 🙂
I had a doubt, in the presence of a Doji situation, suppose for a bearish engulfing pattern, can\’t I consider this way that first on P2 the bears tried to exert power and stopped the bullish trend but then the next day they again tried to bring the prices down but were unsuccessful and the bulls managed to get back some control as the prices didn\’t change, so the next day bulls can bounce back as the bears didn\’t gain on P3 and this must have brought their morale down?
The thing with doji is that we cannot attribute strength to either bulls or bears. Think about it, if one of them were more successful, then the candle would have a directional bias and not really result in a doji.
Please point to a section where you might have mentioned when do you call the trend a downtrend and when do you call it an uptrend. If not covered specifically, kindly add a section for same. Needless to say, I am highly thankful to Karthik and entire team for putting this together. Loving every bit of it.
Mohit, please do check the chapter on Dow theory, we have discussed these topics.
Hello Karthik,
Thank you for your previous revert.
Question:
Bullish/Bearish Engulfing, Presence of Doji, Piercing and Dark cloud patterns holds true in Intra day Trading as well— say within a time frame of typical intra day trades of 15-20 mins??
Hello Karthik,
Thanks for responding back. Its really helpful.
Your previous response was: \”Can’t really call this a bullish engulfing pattern, since there is no convincing prior uptrend.\”
For a bullish engulfing, the prior trend should be a downtrend right and not an uptrend? Keeping this in mind, there is a clear downtrend before the small retracement, as i have highlighted in the chart.
So this is how the chart is:
Clear downtrend followed by a small retracement(highlighted in the chart) followed by the formation of bullish engulfing.
Would this qualify as a bullish engulfing?
Thanks,
Kiran Hegde
Yes, the downtrend is essential for the bullish engulfing. But I\’m concerned about the small retracement from the downtrend.
Hello Karthik,
Thanks a lot. Here is the link that i was referring to:
https://drive.google.com/file/d/1LRMOjfiSGHmKfcO-qJk0kPk291xB1WSC/view?usp=sharing
I have tested that i can access the link from 3 different systems. So hopefully you should be able to as well.
Thanks,
Kiran Hegde
Can\’t really call this a bullish engulfing pattern, since there is no convincing prior uptrend.
Hello Karthik, Thanks for responding back how about you try accessing the link now
2) how we put the candlestick patterns such as three black crows ,three white soldiers etc.
Are there any plans to add explanation for more of this candlestick patterns
Regards,
Kiran Hegde
No luck still. There are many patterns in candlesticks, the point is that it is not required to remember all. You need to ensure you figure this from a price action perspective. Once you do, it does not matter which pattern you are looking at, you will know if its a bullish or bearish one, where to place the SL and how to trade the same.
Hello Karthik,
1) Please take a look at: https://drive.google.com/file/d/1LRMOjfiSGHmKfcO-qJk0kPk291xB1WSC/view?usp=sharing
Can the highlighted chart pattern in the above URL be considered bullish engulfing, since there is a preceding small retracement?
2)For a bullish engulfing, is it absolutely essential that the engulfing is formed right after a downtrend?
3)In addition to the candlestick patterns explained on Varsity, are there any other candle stick patterns which have a high success rate in the Indian stock market?
I look forward to your response.
Regards,
Kiran Hegde
1) Unable to see the chart
2) Yes, the prior trend is important
3) Not that I know about 🙂
Hi sir
What if bullish pattern as formed and next day hanging man is formed, Sir I\’m little confused in this part
If you have initiated the trade based on hanging man, then you will have to go with it until the target or SL it hit.
does piercing pattern also require a prior downtrend for it\’s conformation
Yup, all patterns expect the marubuzo requires you to have a prior trend.
Hi Karthik,
Please clarify my doubt..In the articles so far you had mentioned placing a trade at 3.20 pm for risk takers. so that he can best capture the upcoming trend..but whats the use of placing a trade at 3.20 if its going to get squared off at end of day.? is there an option to carry over that trade order to the next day or does it have to placed again on the next day. even in this article you had mentioned under sec 8.3 place a short trade at 3.20PM..are you talking about intraday or delivery? because the price goes down only on the next day so whats the point of placing a short trade on the day before..if i place a MIS order at the end of day will it be carried over to the next day or do i have to place new order the next day.
Vaishu, you will have to place the trade in futures segment for shorting, for long positions, you can still do CNC in spot and carry forward the position.
Thanks Karthik. I didn\’t think about futures. Beginner mistake 🙂
Good luck!
Hello,
While going through all these patterns. I noticed I am always confused when it comes to the shorting part for bearish pattens.
For e.g. It is mentioned that risk taker would short on the P2 after ensuring bearish engulfing pattern emerges. However, market squares off any position at 3:20 PM.
Confusion arises since, shorting can only be done in Intraday trades.
It would really helpful if there is an example that someone can share for shorting.
1. Sell at what Price on what day and time (entry)
2. Buy at what Price on what day and time (exit)
Preetam, you can short and carry forward the position overnight in the futures market.
Short means short selling or short trade? Please elaborate.
Both means the same.
Sir,
Jeet Banker here. Sir, I follow risk averse approach while taking a call so in case of multiple day candel stick pattern I take call on second day end. For example, in case of bullish engulfing pattern, I will take call on close of the day following the day on which engulfing pattern occured.
Sir my question is, if the day following the bulish engulfing (or any recognisable pattern) the candle is red, but again on next day it is green, what interpretation should be drawn for trade? Should I take position on the green candle day considering that the pattern identified is correct? or should I let go that trade?
So bullish engulfing has occurred on P1 and P2, P3 happens to be a red candle day, then you should wait. If P4 is a green candle and you get an opportunity, take the trade. The further you go from the pattern days, the weaker is the effect of the pattern. So watch out for this.
Hi Karthik, Thank you very much for providing such an amazing content
My question is that can we apply this strategy in 15 min or 30 min time frame also or not?
Yes, you can Karan. Strategy execution remains the same.
Hello Karthik,
Thanks for responding back.
I have uploaded the same chart again with some annotations at https://drive.google.com/file/d/1DR9kcm_Qgbbi2Wq580B-LhSY1MRhPz-A/view?usp=sharing
1)So would it be fair to assume that the long red candle that can be seen as highlighted, is a ***temporary pullback*** and the major trend is still bullish?
2)How do I decide that its a temporary pullback and not the beginning of bearishness? Has this been explained somewhere on Varsity?
3)I did like to trade these situations where there is an intermediate pullback followed by a resumption of the uptrend. This is what i have highlighted in the link above.
Uptrend , follwed by 3 red candles followed by green candles.
In situations such as these, do you still recommend that we look at atleast the last 8-10 candles(EOD charts) along with atleast a 10% decline in prices?
4)Lets say a stock declines by about 12 % in about 4 sessions(EOD chart) and then resumes an uptrend forming a candlestick pattern in the last 2 trading sessions.
Would it be safe to trade on situations such as these?
Regards,
Kiran Hegde
I still can\’t see the file fully, I can only see the preview, not sure why.
1) I see this as an attempt to break out of a range, which may not be very successful. Stock seems to be back in the range. Do consider the trend before the bullish phase (which started from the bottom of the range)
2) YOu cannot, you will have to wait for the trend to establish
3) YEs, these are good trade setups, but for that, you need a proper bullish trend followed by a low volume retracement. Like I mentioned, the uptrend should be slightly longer.
4) There is nothing like safe in markets, you will have to take the trade based on pattern conviction.
Hello Karthik,
The EOD charts for Godrej consumer products can be found at: https://drive.google.com/file/d/1cy1BNhRj8S8g8wxeWmx5889eeydvIz5L/view?usp=sharing
My questions are purely from a very short term trading perspective with a holding period of around 7-8 trading days.
Couple of questions:
1)Can we consider that GCP has formed a bullish engulfing pattern today?
The scanner on Zerodha Streak also indicated that a bullish engulfing pattern was formed. However, Kite isn\’t showing the formation of this pattern.
2)Can the prior trend here be considered bearish?
The stock has been in a downtrend since the last 3 sessions.
The stock price has reduced by 5.1% since the last 3 sessions.
I ask this because, in all of your prior answers as well on Varsity, you have stressed that for a trend to be considered, we look at atleast the last 8-10 sessions. However, in this case, i am just talking about the last 3 sessions.
3)Which one would you prefer for a scanner? Zerodhat streak or Pi with expert advisors?
Thanks,
Kiran Hegde
1) I\’d not considering the previous two candles are doji/spinning tops
2) Nope, clearly the prior tend is bullish right?
Yes, the convincing prior trend should be at least 8-10 (min) with at least 10% decline in prices.
3) I\’d prefer to scan for these manually.
What should be the opening and closing price of P2 vs P1 for it to be considered a Piercing Pattern & Dark Cloud Pattern?
P2 should open lower than P1\’s close and move at least halfway past P1 for both PP and DCP.
Hello Karthik,
Thank you very much. Much appreciated. Its refreshing to see that a person who wrote these blog posts a couple of years back still takes active interest in educating the investors.
Thanks a lot for everything to the investing community at Zerodha.
Regards,
Kiran Hegde
Happy reading, Kiran!
Hello Karthik,
Thanks for the prompt response.
Could you please answer the following question as well:
1)Please provide guidance on what should be the lookback period for 1 min, 5 min, 10min, 15 min, 30 min, Weekly, Monthly charts.
I do not think this has been provided anywhere as part of the lessons.
How many sessions prior data needs to be considered for trading with candle stick patterns for the above timeframes?
Kiran, I\’d suggest you ignore 1 and 5mins data, its too much noise. Look at 10/15Mins, and EOD. Same with weekly and monthly. The look back period depends on what you plan to do. If its day trading, I\’d look at last 2-3 days of data on the 10/15min chart. If its EOD chart and I plan to do swing trdae, I\’d look at at least 30 days of data. Most importantly, load the chart and see what feels right. There is no definite answer for this.
I see you mentioned to start trade at 3:20. When will the trade be concluded?
Once either the target or Sl is triggered.
Hello Karthik,
Thanks for responding back. I have a few follow up questions.
1)So in the case of multiple candle stick patterns, even if one of the candle happens to not within the acceptable range, we ignore the pattern. Is that what you are suggesting?
2)Does \”Range\” in your answer above include both the upper and lower wicks or does it only include the \”real body\” of the candle?
3)Is there an easy way in Kite to get the average range for a stock in a lookback period of my choice?
4)Please provide guidance on what should be the lookback period for 1 min, 5 min, 10min, 15 min, 30 min, 1 D, 1 W, 1M charts.
I do not think this has been provided anywhere as part of the lessons.
Regards,
Kiran Hegde
1) Yes, both the candles should showcase the expected behaviour
2) I usually prefer to ignore the wicks
3) Hmm, don\’t think so
4) Dont look at 1 or 5 mins. I\’d prefer 15 mins or EOD.
Hello Karthik,
I cannot reply to any of your comments. I have follow up questions regarding your following response:
\”Yes, that would be a good engulfing pattern. No, not really…I’m only concerned about really large or small candles. Same holds true for all other patterns.\”
1)What candle is considered small and what is considered big?
2)What parameter needs to be considered for the calculation to decide if a candle is small or big
3)What is the inference in lets say a case of bullish engulfing if the following condition exists:
P1 candle body: 2%
P2 candle body : 12%
Regards,
Kiran Hegde
1 & 2) You will look at the general range within the lookback period you are evaluating and get a sense of this. For example, if I\’m looking at the last 3 months of data and I figure that the average daily range of the stock is 2-3%, but today happens to be an 8% move, then I know today is a large candle day. Or say 0.5% for the day, and I\’ll conclude this as a small candle day.
3) I guess the above should give you the answer.
Hi Kartik,
Why i am not able to see any image or image link in comment section.
Kindly have a look at this snapshot :-
https://drive.google.com/file/d/1Dg0WaTmSx1smAl65s88sUG3JDF2BlF71/view?usp=sharing
Regards
Ishwar
You cannot upload images in comments.
Hi Kartik,
Namskar, My friend has created one strategy. It executes automatically. Automatically it will do buy/sell activity.
We are using it since last 2 months. Strategy works with 50% success( 10 days profit but 10 days loss) but end of the month its profitable so far. How will you rate that strategy ? (Avg, Good, Bad)
Automation is not allowed by exchanges. Any strategy can be made into a good one with proper risk management 🙂
Hello Karthik,
You have already stated that for engulfing pattern(both bullish as well as bearish), there is no requirement about the minimum length of the real body of the candles. Just for my clarification, assuming that its a bullish engulfing pattern, if the **body** of the red candle on P1 is about 1%(Open-Close/Open) and the body of the green candle on P2 is 2 %(Open-Close/Open) and the red candle is fully engulfed, would it still be a valid bullish engulfing pattern?
In your experience, is there a minimum length of the real body for the candles in multiple candlestick patterns for them to be more reliable?
Also, is there a minimum length required for the real body of the candles for Harami(Bullish/bearish), Morning star,evening star.
I look forward to hearing from you.
Regards,
Kiran Hegde
Yes, that would be a good engulfing pattern. No, not really…I\’m only concerned about really large or small candles. Same holds true for all other patterns.
Thank you Sir 🙂
Is there anyway that one can identify stocks that had a Bullish Engulfing Pattern at the end of the day – any website en can refer to for this information ?
Not that I know of. But you should check the candle pattern indicator on chart IQ, check this – https://zerodha.com/varsity/chapter/the-central-pivot-range/
so, if I\’m using this strategy for stocks then I should buy the shares in CNC option right since this is in a day time frame right?… I kinda feel like this is cannot be used effectively for intraday
If it is positional, then yes, you can do this via CNC or via Futures. But you can use CS patterns to initiate intraday trades as well.
Sir, I would like to thank you for imparting knowledge in such an easy to understand manner.
Also, I have a question in continuation to my previous question I posted on 10/09/2020 but the website isn\’t allowing me to post it saying its a duplicate comment. Please help.
The comment gets posted but stays under moderation since you have a link included in the comment. I\’ve approved and posted a reply. Good luck.
Hello Sir! This question is in continuation of the previous question you answered on 10th Sept. The prior trend was a down trend and on 09/09/2020 a red candle (P1) had formed till support. On 10/09/2020 a green candle (P2) opened in the top half of the red candle (P1) and closed well above the opening price of red candle with increasing volume. I had asked if this could be considered a sign of trend reversal and you had answered in affirmative though you had said you can\’t associate this with any specific pattern name. On 11/09/2020 a Doji was formed on the chart Axis Bank and a green candle on the chart of Bajaj Finance. Here are the screen shots of both the charts:
Axis Bank – https://drive.google.com/file/d/1dZsOKpFmX_C4JXurLEWZ9FRH4sTUBGco/view?usp=sharing
Bajaj Finance – https://drive.google.com/file/d/11A1kkywPVUhhTMBpQP42JuizYDDLlBfS/view?usp=sharing
Would you recommend trading on such candlesticks in the future or should I refrain because this isn\’t a recognisable pattern?
I would also like to thank you for imparting knowledge in such an easy to understand manner through your modules.
Prashanth, the thing with CS patters is that it is a study of price action. Price action can be in multiple forms and patterns. Not all price action can be categorized and tagged with a candlestick name. For example, the one you have here is a bullish pattern. But there is no name to it or maybe I don\’t know about it. The point is to understand the philosophy of price action (which manifests as patterns) and take trades accordingly. Identification of known CS patterns (like bullish engulfing, morning star, marubuzo) is just the starting point.
Good luck.
Can all these patterns work in a daily chart with 5Minute candels or does it have to be two trading sessions?
It is applicable on a daily and intraday basis.
thank you, for keeping everything simple
Happy reading!
Hi Karthik,
Your content is absolutely amazing and I have learned a lot through Varsity. I have a doubt here.
* In this module, say in this chapter, you are mentioning P1, P2 in terms of days, but not in minutes or hours. If I want to trade Intraday, which should be exited at the end of the day, how can I apply these concepts in minutes?
~ for example, in this module, trade setup for risk taker/risk-averse is given in terms of red/blue candle \’days\’, how can I use this information to trade intraday. I cannot buy intraday stocks at 3:20 to ensure it is blue/red candle, because the stocks would be sqaured off. Did I miss something?
Please explain.
You look at intraday trade just like the EOD trade except that the timelines shrink. Yes, use P1, P2 in the same way as you would in an EOD candle.
Sir if the prior trend is a down trend and a red candle (P1) is formed till support, and then a green candle (P2) opens in the top half of the red candle (P1) and closes well above the opening price of red candle with increasing volume. Can this be considered as a sign of trend reversal?
These candlesticks have formed today on the daily charts of Axis Bank and Bajaj Finance.
Yup, can consider this a reversal, although I cant associate this with any specific pattern name.
Hello Sir! I need to ask a question with regards to candlesticks formed yesterday and today. How can I attach a screenshot here for you to see?
Please upload the file on to G Drive and share the links. Thanks.
I\’m sorry Sir, if it sounds dumb.
Has the strength of the P2 candle(blue) not already been confirmed at the end of P2 itself. So, on the basis of that candle, why can\’t he trade in the early hours of Wednesday?
Sure, if you are talking about P2, then trading on Wednesday (or I assume P3) is fine.
On page no. 53 of Chapter-8, Module-3; point no.2 on the lower-half of the page.
Q. Why would the risk-averse trader initiate the trade at 3:20 pm? Gee only has to confirm that P2 was a blue candle then why wait till 3:20 pm? Why can\’t he buy in the early hours on Wednesday?
The trade has to be initiated based on confirmation of the strength of the candle right? You get that only by the end of the day.
dear karthik sir ,
suppose i shorted a trade on today, can i carry forward it tomorrow or further . is there any objection from SEBI for carry forward of short trading.
You can do this only in the futures segment, not in spot.
when should we cut the trade and booked profit? in simple words how to move out from trade?
When the target is achieved.
Hi Karthik,
In your literature (excellent) a day is considered as the trading sessions (P1, P2, etc.). For intraday patterns, is the overall theory still hold if we flex the session/chart duration to 5min, or 10min?
Excuse if I\’ve missed the explanation that is already covered in the literature.
Regards,
It is the same, if you are looking at 15 mins chart, day or a session = 15 minutes candle.
Hi. I had a question regarding the formation of doji pattern. Since the doji pattern is formed on P3, at the end of P2, the risk taker would not be as sure of the trade he makes as the risk averse. The risk averse on the other hand will initiate a trade on P3 observing the foundation of doji. Does this mean it is better to be a risk averse than to be a risk taker ?
It is best if you treat this on a case to case basis. I\’m risk-averse for a few patterns and risk taker in few. You need to evaluate every opportunity differently 🙂
Yes…I can see it in market depth. Thanks a ton !!
Good luck!
Thanks a lot for prompt response.
Is it possible to know circuit limit for a particular stock on a given day ? If yes, how ?
Regards
Yes, its mentioned in the market watch of the stock.
Hi Karthik,
Thank you so much for taking out time from your busy schedule to help beginners like us through answering our queries. Some of my queries are :
1.What is upper circuit and lower circuit of a stock ? How it is calculated ?
2. You mentioned, whenever a Doji follows a recognizable candlestick pattern, the opportunity created is bigger. Also, you mentioned Doji indicates indecision in market and trader should avoid trade on that day. I am confused. Please help me out what one should do if Doji forms after single/multiple CS pattern ?
3. Should we trail stop loss ? As you advised to be in trade until stop loss/target is breached/hit. So, if we trail stop loss, it means we are deviating from this rule as trailing stop loss is not original stop loss. Kindly suggest.
Regards
1) The circuit limits are the price thresholds beyond which a stock cannot move for the given day. This is calculated by exchanges based on the volatility of the given stock
2) Doji on a standalone basis can be quite useless but when combined with other patterns will yield results
3) Yes, trailing SL is a far better way to set up a trade rather than a fixed SL
Karthik sir, first of all thank you for all the knowledge you are imparting. I have a querry:
you say time frame should be 15 minutes. When the p1 is formed you have told us to take action on next day. As suppose there is downtrend and it is going bearish. On next day If we keep the 15 minutes time frame we can\’t trade around 3:20 as the market opens at 9:30 and 15 minutes add on to it make it 9:45.
Can you please elucidate?
Akhil, if you are looking at 15mins, then you need to act on this purely on an intraday basis. Don\’t mix up the intraday candles with multiple trading sessions. If you are looking at intraday, then these candles are relevant only for the day. If you are looking at EOD, then you can consider these for the next day as well.
Sir suppose:
Candle 1: Red candle; O=105, C=100 and two small shadows.
Candle 2: Green candle; O=103, C=113 and two small shadows.
Prior trend is downwards.
Will it be a bullish engulfing?
Cuz If we see the position of candles in the chart, candle 2 will completely engulf candle 1 when the opening of candle 2 would also be lower than closing of candle 1 and not 103.
Or do we just see the size and consider the pattern to be bullish?
Not a bullish engulfing in the strict sense, but you can still trade on it like how you would with a bullish engulfing pattern.
Hahahaha…. well said!
Cheers!
Sir, I have understood the concept(thanks to you) but have a doubt or want some reasons and thought who better a person than the man from the field itself,so
from the first chart of the chapter we can see in the circled part that, on first day a red candle has been formed and even the price went very low but recovered at the end of the day to close on a relatively higher price from the low of the day but closes at lower price than the opening, but on the second day the (P2) candle also went down to the same price a that on the (P1) day but then the bulls took position and started buying and eventually the stock ended on a higher price than the opening of the day2 itself.
So why did it happen thst people bought the share on day2 (P2) when they were getting the same share of the same price on P1 at its low (if they were looking for a dip in the market to buy and make position)
Hope I am able to explain my doubt, Thanks!
Thats market right? Also, no one really can tell you why, as long you know what to do once a pattern has occurred.
If it’s only the (i), then doesn’t that mean any two stocks, with P2 covering at least 50% of P1 will be profitable (especially if P3 is a Doji)? Wouldn’t those kind of stocks be very common to spot?
No, both should satisfy.
For the piercing pattern, should both of these conditions be satisfied? Or, only the first one?
[Assuming a downtrend]
i. P2 covers at least 50% of P1
ii. (Close – Open) of P2 > (Open – Close) of P1
Yes, both of these are required.
Any book you would like to refer me for the Indicators?
Not sure if there is an indicator specific book 🙂
Good afternoon sir,
Sir, I have just completed the book candlestick course. ( Which you suggested in one of your comments). Now I am looking forward to strengthen my fundamental in western indicators, so what book should I study for the same?
Most indicators are from the western world. Only charting technique is Japanese.
Thank you for the suggestion sir. I would also like to ask is Intraday (analyzing 15 min chart ) good for a beginner? or should I do TA for a day frame and put money on short term.
Sarthak, if you ask me, start with short term trades wherein you will hold the positions for a few days. Get comfortable with this and then gradually move to intraday.
Can you suggest me the time frame for which i should do candle sticks analysis. I want to do short term trading but cannot decide whether to analyse 5 min chart,15 min chart, 30 min chart, day chart etc . As big opportunities come and go for a very short span of time so what would be the ideal time frame to start my TA?
If you are getting started and completely new to intraday trading, I\’d suggest you use 15 mins chart.
For a bullish engulfing pattern, the opening of P2 should be around the close price of P1 with a prior downtrend. I have two doubts in this. 1) Can the opening price of P2 be either above or below P1 close price or it must be only below the P1 close price. 2) The P2 open price must be around P1 close price by what percent? And I would like to thank you for your efforts and time you had put to create this content which is simple yet detailed.
1) Preferably below P1 close.
2) No need to quantify this. It is good as long as it is below P1\’s close.
Sir, thanks for answering my question on 19-7-2020. You said it is better with Gap down on P2 for engulfing. But does it mean it is still an engulfing pattern ?
Also, if P2 has gap up opening and close is above P1 candle, but real body of P2 ( i.e. close-open) is less than p1’s real body size, would this still be considered as engulfing pattern ?
Also, in case of harami pattern, is it harami pattern if P2 candle has close above P1 candle ?
If P2 has gap up and closes below P1, then this is more of bullish harami pattern, Jeet. If close above P1, then its engulfing.
Karthik sir,
First of all, many thanks for creating such a nice material which explains technical analysis in lucid manner. With this material I have been able to generate significant results.
Sir my question is, is it necessary that for Bullish Engulfing pattern the P2 candle should have gap down opening ? Or is it ok if there is a gap up opening and size of real body of P2 candle (i.e close-open) is more than size of P1 candle.
Please clear this confusion.
Jeet, it is better that way, with a lower opening on P2.
Sorry, the reply button isn\’t working so i have to start a new thread. For reference here is the conversation so far
Q: \”Is it possible to elaborate the Dark cloud cover and piercing pattern with OHLC example as you did with the other patterns. This one is a bit confusing and detials can help clear the doubts further.\”
Response: \”I’ve done that in the chapter itself, right? Is there anything in specific that you are unable to figure out? Do let me know.\”
So my doubt is regarding this partial engulfing. The text from the piercing pattern says:
\”in a piercing pattern P2’s blue candle partially engulfs P1’s red candle, however the engulfing should be between 50% and less than 100%. You can validate this visually or calculate the same. For example if P1’s range (Open – Close) is 12 , P2’s range should be at least 6 or higher but below 12.\”
Now lets say on P1 the Open was 10 and close was 22.
Can Open and Close for P2 be any gap of 6-12?
Is 10-16 same as 16-22 or 12-18 for that matter?
Do shadows play any part in assessing the strength of these patterns?
What if the P2 goes from 16-25, Is this same or more bullish compared to 7-16.
As englufing approaches 100%, the strength of signal is higher?
Sorry, I know some of it is knit picking and may be even plain obvious. I am very new to TA. I just want to make sure I understand it right without making assumptions.
Thanks a bunch.
Instead of absolute numbers, look at it from % terms. It will be much easier. Standard rule – at least 50% of the previous day\’s gains should be taken off, but not more than 100%. Shadows do not matter.
So suppose the morning star pattern for example has 3 candlesticks involved. So the sentiment of 3 days applies the same way for (3×15 mins) 45 minutes?
Yes, thats right.
Thanks for feeding us with knowledge.
I have a doubt. Do these multiple candlestick patterns apply only for 1D chart or for smaller time frames as well? Thanks
You can apply the chart patterns across all assets and time frames.
Is it possible to elaborate the Dark cloud cover and piercing pattern with OHLC example as you did with the other patterns. This one is a bit confusing and detials can help clear the doubts further.
Thanks a ton.
I\’ve done that in the chapter itself, right? Is there anything in specific that you are unable to figure out? Do let me know. Thanks.
Can appearance of Doji after a bullish engulfment be considered the same way as doji after a bearish engulfment, i.e. representing a big bullish reversal?
Yes, it essentially behaves the same way.
Awesome information Learning a lot 🙂
Happy reading, Mohit!
generally in all the patterns, you say that a risk taker would initiate the trade on the same day at 3:20pm based on the situation. Are you talking about initiating a CNC trade? So do we need to have so much of funds to follow the trades?
For long, it can be CNC. Else it can also be a position in futures.
Sir,
What kind of charts do we look at for multiple candlestick pattern (1 week, 1 month)?
I\’d prefer looking at end of day chart.
Well explained sir,
Solute you.
Happy reading!
Hi Karthik, the stock pattern with bearish engulfing pattern followed by shooting Star and prior trend was uptrend now can we expect the stock is dominated by bears for some time?
While that is the expectation, there is no guarantee here.
Hi Karthik,
Your modules are just the right study material I was looking for. They are easy and simple at the same time very intriguing.
Would you have any mock trading platforms where one can practise applications of the above candlestick chartings before trading real time?
Thanks, Deepa, I\’m glad you liked the content here. Regarding mock/demo platform, do check this – https://tradingqna.com/t/when-will-zerodha-launch-a-demo-trading-platforms/69105/7
These are great sessions and full of wisdom. I appreciate these but I would like to suggest if you give out more charts as an example for a specified pattern would be great so that we can have a more clearer picture.
Thanks a lot for these simple explanations.
Thanks, Shashak. Will try and include more charts when we update these chapters.
Instead of a doji if a spinning top is noticed after an engulfing candlestick can it be considered as a valid pattern?
Yup, you can treat doji and spinning top equally.
Sir,
could you please tell the use of the candle time frame as most of the cases you mentioned that P1 & P2, it means we are looking day candle, what about for intraday trader, all this pattern can occur during the day of the trade and can be used same as the examples given in your topic. please explain. thanks
The same patters can be extended to intraday as well, Sijo, since the pattern behaviour is the same irrespective of the time frame.
Thanks for the prompt replies and the clarifications Kartik !!!
Immensely grateful.
Happy reading!
Hi Kartik,
I have 3 questions. Please clarify the doubts.
1. How should one understand when to use single and multiple candle patterns if they both can be used for any timeframe ?
2. Is it generally implied that once doji forms after bear engulf pattern, it is a shorting opportunity for the next sessions (bear run) ? And vice-versa for doji after a bull engulf pattern ?
3. Can a risk averse beginner adopt a strategy of only placing trades when Dojis are formed after an engulfing pattern ? As it looks more probable to derive profits ?
1) You don\’t get to use these at discretion, you trade them as it appears on the chart. In other words, if I see a pattern and it tradable, I trade. I don\’t think much about it being single or multiple candlesticks pattern.
2) True.
3) Yes, why not. It is just that the opportunities would be limited.
The significance of a doji forming after a bearish engulfing pattern has been elaborated here. Will the same outcome occur if a doji follows a bullish engulfing pattern?
Yup, the presence of a doji after any candlestick pattern implies the same outcome.
Got it ! Thanks
Happy trading!
The risk taker would go long on P2 at 169. He can do this by validating P2 as an engulfing pattern. To validate P2 as an engulfing patterns there are 2 conditions:
One, the current market price at 3:20PM on P2 should be higher than P1’s open.
Second, the open on P2 should be equal to or lower than P1’s close
What is the essence of the second one ?
As you will have to follow P2\’s price and at the end of the day make a decision.
Yes, you will have to look at P2 on day 2 and ensure by market close both P1 and P2 together is forming an engulfing pattern.
Needless to say, once the trade has been initiated you will have to wait until the target has been hit or the stoploss has been breached. Of course, one can always trail the stop loss to lock in profits
Could you please give an example ?
To trail, the stop loss means that you increase your SL every time the stock moves in your favour. For example, you buy @ 100, SL is 95, the stock now moves to 120, you can increase your SL to 105, stock moves to 130, SL moves to 110.
Best Article For Beginner to Learn candlestick pattern !!
https://www.youthrelated.com
The highest high of P1 and P2 forms the stoploss for a bearish engulfing pattern. (Can you give an example)
How the higher value can be the stop loss?
Its explained in detail in the chapter itself, Sanket 🙂
A doji creates a big opportunity after a recognisable candlestick pattern. However, while attempting the certificate quiz on the \’Varsity\’ app, there is a wrong answer to a question that says \’Presence of doji does not make any difference\’. Please clarify. Correct the answer option if wrong. Thank you.
Presence of doji on its own probably does not convey much. But when looked at the doji along with the prior trend, it makes sense.
sir i have heard a lot about trend with the trend thing. In candlestick pattern u have suggested that for bullish pattern prior trend should be bearish. What i understand from this is, although primary trend should be bullish when we are entering into a long trade in a stock, but we should enter when the secondary trend becomes bearish for a time being and based on your checklist, a long trade can be initiated. Am i right sir? in this way we are actually trading with the main trend only.
True, you need to keep both the trends in perspective when initiating a trade.
Sir in some ur comments for swing trading u have suggested look back period should be atleast 6 to 12 months. And for prior trend it should be 6 to 8 trading session. What i understand by this is, for looking at support and resistance we should look for at least 6-12 months data and for knowing the prior trend, we should look for last 6-8 trading session. Am i right sir?
True Siddharth. Point is you need to have at least 6 months data to get a perspective.
sir, not able to see any chart attached in various comments. could u pls give any solution to this.
These charts are user-submitted, wont be available if they have deleted it.
Dear Karthik
Thanks a lot for all your input.
A small example where i request for your input.
For Cadilahc, for 20th April and 21st April we saw a bullish engulfing pattern in down trend ,but still its further declined.But do you feel this is an exceptional case since its further declined instead of showing a upward trend .Or there is some other resons which i am not considering.
Kindly share your inputs.
Regards
Indranil
Candlestick patterns only enhance the probability of a directional move, but it is not a guarantee 🙂
simplest explanation I have come across. congratulations on the effort and the way it has spanned out.
question on OHLC – should we take c- as closing or LTP? If you look at 20/05/2020 Tata steel prices – H was = to LTP and low was almost = to open
Open = 272
H= 284
L=270
c=272
but LTP = 283.8 – I am tempted to consider this as a Marubozu, but if I consider c as 272, then the story is entirely different.
C is the closing price, you cannot reference the LTP price for this.
Thanks Zerodha and Karthik Rangappa for nicely writing this very helpful modules on stock market. Though I am in module 2 only, hope i will be able to prepare myself trading ready after completing all the modules.
Keep growing and helping people !!!
Happy reading, Dipesh 🙂
Dear Sir,
Is M&M today formed bearish engulfing pattern?
Looks like it 🙂
Dear Sir,
What if Bullish Engulfing formed at uptrend and bearish engulfing at the bottom.Please advise sir.
Then these are not valid patterns 🙂
while learning I have observed that there is very little information given about setting targets, can anyone tell me what is the ideal target in percentage for these trades.
Please do read through the chapter on support and resistance, Tejendar, that will give you a perspective.
Where Do we get information regarding intraday candlesticks (15mins , 30mins).?
You can log into Kite and get all the info, Aditya.
What if I am about to be a risk taker? Should I infer the pattern made around 3 20 pm with the help of a 5 min candlestick chart?
More specifically, a candle formed in between 3: 10 pm and 3:15 pm as P1 and the candle formed between 3:15 and 3: 20 pm as P2.
Is it okay or should I use some other timeframe for candlesticks?
Hmm, not when it is so close to the market close. YOu can earlier during the day.
Hello Rohit,
You can place a short sell on the stock.
Gotcha, Thanks!
What to do in presence of a Doji after the bearish engulfing patter?
Emphasis more bearishness, Rohit.
Hello Karthik,
At 3:20 pm, do I need to verify the pattern based on a 5 minute candlestick chart?
Regards,
Dhiraj
YOu can still look at the EOD chart, Dhiraj.
does these patterns also works in intra-day trading sessions
Yes, they do as TA can be applied across all assets and time frames
sir,
A risk trader will make the trade on day P2 after detecting any pattern . You said risk averse trader will make it on p3 after ensuring
the day\’s candle is in his favour( assuming he will make the trade on starting of day ) but the colour at the start of the day may be something else and as the day passes it might change .
Does that not make risk taker and risk averse trader equally risky?
Or the risk averse trader makes the trade at the end of p3?
He is supposed to initiate the trade towards the end of the day, after ensuring the colour of the candle.
Presence of doji after engulfing pattern can be of both ways as
after a bearish engulfing pattern if doji occurs
1) You may think that first b\’caz of engulfing pattern bulls were lost there up trend and now they are confused also b\’caz of doji, so it makes sense for bears to take command and make a downtrend .
2) But you can also think that after bearish engulfing pattern a doji occur and it is sign that bulls are coming back as you see it is a doji which says no one have control .
So my question is shall i look for another candle or make my trade to sell the stock ( as you have suggested)
Hmm, but that means you are waiting for 4 days in all to take a trade on engulfing position. Not sure if it is a good thing to do.
Hi Karthik.
Sorry for misspelling your name in my previous comment.
Probably this is not the right platform, but I just wanted to bring it to your attention that I am unable to reply to a comment. On clicking \’reply\’ it just redirects me to post new comment. There might be some issues with the UI.
Thanks.
Thats ok with my name 🙂
About the comment, let me check.
Hi Kartik. Thanks for responding.
So can i assume the pattern holds irrespective of the length of the real body, however small or big it may be?
Yup, but do keep in mind that trading on large range candles may not be a great idea. I\’ve explained the reasons why in this module.
Hi.
Is there any threshold on the minimum length of the candles for the engulfing patterns?
Not really.
Hi Mr Karthik,
Is a Doji formation on P3 (after a bearish engulfing pattern) considered more effective than a *complete* red candle on P3 (after bearish engulfing pattern)? The reasoning for why bearish engulfing pattern + Doji (on P3) is effective is given as \”bulls were uncertain\”, right? So, in a red-candle on P3, the bears completely dominated bulls. Doesn\’t that imply a red-candle on P3 is more effective than a Doji formation? Would like to listen your views on this. Btw thanks for the effort!
The thought process behind the price action is this – doji induces uncertainty. Uncertainty creates more panic, which further leads to a sudden and rapid decline in price, which is good for the short-sellers
Hi,
I am new to to trading and this course content is a great read. However some of the patterns here are Like Bearish engulfing pattern are for short selling and it is mentioned that we must look at P1 & P2 which are the candle stick for 2 consecutive days. So can we short sell without prior holding the share and then book profit after 2-3 days?? Is it allowed in CNC type orders?
Not on CNC, best you do this via Futures or Options.
You may like to review the following line and make appropriate correction in the content, if it is found to be correct.
Ref 8.3 Bears Engulfing Pattern
Point No. 4. The sellers push the prices lower, so much so that the stock closes below the previous day’s (P1) open.
Actually, P2 depicted there shows that stock closed above the previous day\’s (P1) open. But the content mentions that the stock closes below the previous day\’s (P1) open. Actually, the stock made low below the previous day\’s (P1) open.
Correction suggested – Point No. 4. The sellers push the prices lower, so much so that the stock makes low below the previous day\’s (P1) open.
Let me review this again. But yes, P2 makes a low below P2\’s close and closes higher than P1\’s open.
hi sir, how can we use bullish engulfiling for intraday??
The same way you\’d for on an EOD basis.
Dear Karthik,
Thank you for your reply.
1. My ques is linked with the above ques if any of pattern formed between that time frame. Does it mean that I can do trade based upon that inference?
2. In the case of swing trader how it is applicable?
Regards,
Saurabh
1) Yes, you can
2) If you are a swing trader, then you look for patterns on an EOD basis and hold them till the desired period. Usually for 3-4 days.
Dear Karthik Sir,
Could you please explain what is the time frame. If we are focusing on a 1-day candlestick why 5 min or 15 min time frame.
Time frame is the period we are looking back at to make forward inference. It could be 1 day, 1 hour, 30 mins or any other time period. Its basically our analysis window.
I request you to add a time interval in the graphs indicated above. This will help in understanding the concepts that are being indicated by the candles.
Most of the charts are EOD unless otherwise mentioned.
Hello,
My question is does these pattern work effectively for Intra-day trading? Iin above examples, it is a 2 day pattern. Also, what time graph should be best used on Intra-day trading and are all patterns work on that Intra-day chart?
Yup, you can use these for intraday as well.
1.today in icici bank in a 10 minute candle at 9.55 a.m p1 is a spinning top and p2 at 10.15 a.m is doji with small candle but open and close of p2 within open and close of p1 can this pattern be considered as bearish harami. anyway it is on the bearish side only from opening.
2. at 10.45 p1was a bearish candle and 10.55 p2 was also a doji with small green candle and open and close of p2 was well within open and close of p2. can it be considered as bullish harami. pattern.
can i go short based on my first question and long on my 2nd question
i am trading on 10 mt candle chart . what time is the best time to enter trade (intraday) , based on candlesticks
can i enter trade if a bullish engulfing or bearish engulfing is formed immediately after opening ,say at 9.35 or should i wait till a proper trend is opened or closed.
1) No because these two patterns on its own do not convey any directional bias
2) Hmm, not sure if I get this
Sir. I have a series of questions on double candlestick patterns
In bullish engulfing pattern I read that it is not necessary that the entire of p2 is engulfed including the wick. The real body engulfed of p2 alone is ok. It can be traded based on that
Is it ok if the open price of p2 is lower or equal to closing price of p1
The same way in bearish engulfing pattern if open price of p2 is higher or equal to the closing price of p1
If that criteria gets satisfied can I go for long or short or the real body should be completely overlapped or engulfed( ie) the opening of p2 being lessthan to closing of p1 and closing of p2should be above the open of p1 same in the case of bearish engulfing pattern . should the opening price of p2 should be above the closing price of p1 and closing price of p2 is lower than that of opening of p1 .why cant it be equal price , any how p2 will be completely engulfed is it not.
Can same type of criteria applied for harami patterns also.
1) I\’d agree too. The real body of P2 should engulf P1
2) Lower is better
3) Same is applicable to bearish engulfing pattern
Why cant it be equal – Well this is because a lower opening traps in more bears and positions get built. This is the needed pre condition.
Is there a stock market stimulation game ?that would help me sharpen my practical market knowledge..
I think the NSE website has something to this regard.
How do you identify a trend (upwards or downwards)? Are there any rules around identifying and validating a trend (eg. price should constantly be decreasing in last X days?) Or is it mostly intuition-based?
Hi Karthik,
I\’m new to the TA analysis world and hence the query could be pretty basic but I\’m asking nevertheless.
I understand that before we use a particular chart pattern to initiate a trade we should also validate that it appears in a particular trend. For e.g: in order to initiate a trade based on a bullish engulfing pattern, it should occur in a downtrend. Does that mean we ignore the pattern if it is part of an uptrend? If so, why? Should we not consider it a validation of the uptrend and hence initiate a long position to profit from it?
In general, I\’m trying to understand how critical is the rule that the patterns should be part of a particular trend.
Thanks in advance!
Gokul, thats right. The prior trend of a pattern is an integral part of the candlestick pattern and not just the candles. So a bullish engulfing in an uptrend is not really a pattern.
Hi karthik,
In case of Doji formation, if P1, P2 and P3 are three patterns in three consecutive days, how can the candles co-exits side to side?
Hmm, 3 continuous days of sideway movement. Possible right?
Hi,
Will it be called a piercing pattern if P2 opening is higher than P1 closing? Even though there is a downward trend and body coverage of P2 is between 50-100% of P1.
Thanks.
Hmm, technically it should be lower than P1 close. But you can consider this on a case to case basis.
What I meant was, you\’ve been saying that risk-averse trader will wait for the next day to confirm the trend. So the next day here is a literal next day or next candle ?
Thats right, it is the next trading session.
Are these opportunities only for BTST or is it applicable for intraday also?
I\’m not sure about the context, Thejus. Can you please elaborate? Thanks.
Wow. These concepts are damn interesting. Thanks Karthik
Happy reading, Vinay!
Mr Karthik
is the engulfing pattern applicable to intraday trading also incase someone is following a 15 min candle or P1 / P2 are applicable for D/ D+1 days
thanks
All candlestick patterns are applicable on an intraday basis, Vikas.
which is most preferable candle time for intraday trading to seen above forms of patterns? its 1or 5?
I\’d prefer the 15mins chart.
*Engulfing *bearish
Sir,
Is percing valid for both bullish enfiguring and bariese enfiguring?
Piercing pattern is different compared to these patterns.
Hello Karthik Sir. In Indian markets, we cannot short stocks across days. So are we supposed to place different intra-day orders everyday for short opportunities? If not, how do we perform those trades?
You can short the futures contract and hold the positions overnight.
in bearish engulfing pattern p1 close and p2 open are same and we are trading using 10 min chart so its called bearish EGP or not ?
P2 open should be higher than P1 close, this makes it a bearish engulfing pattern.
Dear Karthik,
This is a general question you may have heard before. What was your learning curve like when you started as a trader? And how would you suggest everyone maximises his/her learning curve?
Regards.
It was slow but steady 🙂 I committed a lot of mistakes, lost money, and that forced me to learn. So in the long run, it did help. So in my opinion, the only thing that helps is to actually place a trade to validate your learning and then learn from it.
Gone Through till Chapter-7, I would like to know on what time frames this types of Candlestick should be used to trade for studying charts.
Depends on the trading style, for example, I prefer to use EOD for both intraday and swing trades.
Thanks for such a lucid explanation. I have a question though. I understand that for the patterns to be engulfing it is required that opening at P2 continues with the trend of P1. For instance for bullish engulfing, opening at P2 should be below close of P1. But I couldn\’t understand why is this important. After all it is possible for P2 to open higher than close of P1 and still present a bullish reversal and close higher than open of P1. Thus a risk taking trader might initiate the trade at close of P2 after ensuring that close of P2 is higher than open of P1. So why is the open of P2 relevant here?
If you think about it, these patterns is a representation of how traders look at the markets. An opening below P1 ensures that it sucks in more bear positions and therefore the when the unwinding starts, it creates more panic, eventually leading to a rally.
Hi,
Good Morning Kathik Sir,
You Are So fast in replying.
On Last Friday, As Markets Zoomed, I expect to see Bulling Engulfing Pattern in Many stocks.
Happy trading, Channa 🙂
Hi Karthik Sir,
As You Said, Bullish engulfing Pattern Looks more interesting to buy a stock. and at the sane time Bearish Engulfing pattern is for selling( Shorting) the stock, Am I correct?
1). Where can we study Technical Analysis on Zerodha.
2). How To Select a good stock ( /any Stock )in this universe of 5000 + stocks)
Yes, thats correct.
1) You can log into Kite and get access to charting. We have charts from Tradingview as well. Check this – https://zerodha.com/varsity/chapter/interesting-features-on-tradingview/
2) I\’d suggest you start with the Nifty 50 index stocks.
Thank you sir
Cheers!
🙂 definitely i agreed that
Good luck 🙂
Thank you sir…
Is there any training course in Zerodha who want to become professional ?
All our training is via Varsity 🙂
Dear Karthik sir,
If i get good engulfing bullish signal in 30 min chart , can i trade that for long time like 1 month? or only for intraday i have to use that?
Kindly confirm.
Ideally, all the TA patterns should be used for short term trading, which is at the most few days to couple of weeks.
Thanks for your reply but let me know which time frame is suitable in intraday for the trade
based on bullish engulfing? Thanks in-advance.
I personally prefer the 10 or 15-minute timeframe for intraday.
What should be the Target if trade is initiated based on Bullish /Bearish Engulfing ? & what time frame is suitable
if I want to trade this engulfing pattern in Intraday?
The target depends on multiple factors, but I usually look up to the immediate resistance level and estimate the risk-reward ratio.
can we apply this engulfing pattern analysis on intraday chart ?
Yes, you can. All TA patterns can be applied across all timeframes.
in the last chart of peircing pattern on p3 can we call it as a doji or a hammer
That is a doji and not hammer, Rohit.
Hello sir,
On8.5 – The Piercing Pattern, why you are not considering its piercing pattern? Both charts. It\’s showing a prior down tend. I think p2 is between 50-100%. And it\’s profitabl if we initiate the trade also. Please suggest.
I think it is under 50%, hence not a PP.
Hi Karthik,
Does it appear to you a Doji with Bearish Engulfing
HCL Tech 14-08-2019
https://drive.google.com/open?id=1AGLjjEAp2xzJr1TkgCiugvFWxAxDF0-B
Yes, but the prior trend is lacking. Maybe you\’ll get a great opportunity to long soon 🙂
i couldnt see any images here. Please help me out…
Please upload the image on Google drive and share the link. That will work. Thanks.
On a personal note, in multiple candlestick patterns where the trade evolves over 2 or more days it is worth to be a risk taker as opposed to a risk averse trader…
Sir, Thanks for the article! For a risk averse taker we can screen charts by using various screeners available, But if I want to make a position at 3:20 PM (Risk trader) , on the day itself where can i screen stocks. I know some of the websites but they will give only EOD screener to find engulfing pattern.
But is there are any live screener that can be used to screen the charts on the day itself, Please let me know.
Yes, Dharani. It does, really depends on your conviction on the trade. I guess you should check this – https://streak.tech/
What time period do we consider to identify an uptrend and a downtrend? Coz even with an uptrend there may be bearish candles for a fee days before it starts rising?
This depends on your time frame. If you are looking at intraday, then you are better off looking at an intraday chart of say 10 or 15 mins. If you are swing trading, then maybe you should look at the end of day charts.
Will you call this Piercing Pattern?
https://www.tradingview.com/x/2e9HDtcx/
actually the open of blue P2 candle has not opened at the close of P1 or below P1, but I am being flexible according to the rules though it does cover almost 50%
Have posted a reply for your earlier query.
Karthik will you call this Piercing Pattern?
https://www.tradingview.com/x/7u3CQ6nM/
I guess, you mean to say dark cloud cover. No, this does not qualify as the candle on P2 needs to be below the candle on P1 by at least 50%.
Sir is it correctly drawn flag pole pattern in crude oil ……it is current day market chart…
https://drive.google.com/file/d/1tqGWLR9h2FxdTfdpbFYrgTUkRyLOZ4P5/view?usp=drivesdk
Sir plz suggest and correct if wrong…
Seems like a valid pattern, Satish.
Sir, in case of Dark Cloud how substantial should be the uptrend? will the dark cloud pattern appearing after 3-4 days of uptrend be reliable enough provided such uptrend of 3-4 days was after a significant downtrend.
It is hard to give you a definite answer. However, to give you a perspective, if SBI created a DCC with prior trend lasting for 8 trading session and at the same time ICIC too formed a DCC with prior trend lasting 3-4 sessions, then I\’d bet on SBI.
Karthik Sir, do these pattern work in shorter sessions like a 1 Hr, 30min, 15min or even shorter ones?
Li
Yes, Yogesh. CS patters are applicable across all time frames and assets. However, do make sure you check the checklist before initiating the trade.
Ok thank u sir for your reply…
But sir can i know how should volume must behave for both flag pole and triple top/bottom for strong confirmation..
And sir do volume really help for breakout?
The volume should be on the higher side, especially on the day you initiate the trade. If you are looking at a flag formation, then the decline (after the rapid increase) should be on lower volume.
Hello Sir,
Sir I want to know how to identify difference in tripple top and upward rise flag pole pattern….
The flag pattern can be identified by an upward sloping trend. This may not be true with the triple/double top formation.
Hey Karthik, is bullish/bearish engulfing pattern works on 15 min charts for intraday?
And what about other patterns do they work on 15 mins chart?
Yes, all patterns, across all time frames.
Yup, across all time frames.
Dear Kartik,
Please explain why during \’Bearish Engulfing Pattern\’ Stop Loss is set at High of P1 and P2….couldnt understand the concept.
For example if I already own a few shares of a company I would have already set my Target price and Stop Loss right? Like if I would have bought a share at 100 and I expect it to go to 105 which is my Target and I would have already set my Stop Loss at say 95. If already all these values are set…..then I could not understand the above said concept. Please explain.
Thanks,
Srinivas
In continuation to the above comment…..Stop Loss is something which would help us arrest our losses during a fall right? but why are we setting a Stop Loss that is above the current market price and limiting our profits?
As I mentioned, this is a short trade.
Srinivas, the Bearish engulfing pattern suggests you short the stock, hence the SL is higher than the entry price.
Hi
I saw few academic article that show that candles doesn\’t work in predicted next stock price. Did u hear about this? And if so maybe u have to say about it..
Yes, for this reason, the whole of TA like any other predictive philosophy is empirical.
It would be very helpful if there are any videos explaining this content as it helps in understanding it as someone explaining this. Incase if there are any please let me know
Hello Karthik,
As said examples are daily candlestick or 15mins? If it\’s 15mins then how can we identify Bullish/Bearish engulfing?
Confused the time frame of candlesticks in the above said examples whether its daily,15min,1hour… As you were mentioned Day1 P1,Day2 P2 candlestick etc
Thanks,
AK
The candlestick pattern works across all time frames and assets. For example, if you are looking at the bullish engulfing pattern, then the previous 15 min candle is referred to as P1 and the current 15 candle (engulfing P1), becomes P2.
Thank you Karthik for prompt response.
Hi Kartik,
You\’ve shown examples of how the piercing pattern works similar to the bullish engulfing. Can this work in reverse like a bearish engulfing? Example in an uptrend, does a piercing pattern indicate a possible downward trend reversal?
Dark Cloud cover answered my question. Your explanations are so easy to understand. Thanks you so much for writing this module.
Happy to note that, Benny 🙂
In an uptrend you need to look for a dark cloud cover for reversal. If you find a piercing pattern in an uptrend, then it only indicates more bullishness.
Hi Karthik
In idea vodafone chart, with a formation of doji and spinning tops there was downtrend in the price, yesterday with a increase in volumes there was a bullish engulfing pattern forming , can you please look into it? whether i am interpreting it in a correct manner?
It does appear to be a bullish engulfing pattern, however, I\’d be cautious with bullish strategies around this stock given the fundamentals.
Thanks for replying Karthik Sir. The modules on technical and fundamental analysis as well as options are pretty good. One who doesnot have any knowledge, should definitely refer to it.
Sir one my friend has invested in vodafone idea, for the purpose of rights issue, like playing it as a special situation, should one hedge the position or keep it unhedge (average buying price 17.5) . what are your views regarding?
Hedging may not be very effective in this case, Gaurav. Btw, the right issue window is over right?
The rights issue starts on April 10 and issue closes on April 24. He purchased the shares before Ex-date at 29.3 and is still holding. the rights issue price is 12.5. after applying for shares at 12.5 the average buying price turns out to be somewhere near 17.5, that is for the shares previously purchased and rights shares. so if he hedges buy shorting one lot of futures he is locking in the price which is currently 15.7
Quick question on Engulfing patterns, is it necessary for P1 to be bullish and P2 to be bearish or vice-versa? What if in a bullish trending market we see two red candlesticks with P2 candlestick engulfing P1? Does situation like these occur (given that P2\’s opening will be higher than P1\’s opening and (goes without saying) P1\’s closing?
That fine too, Rahul. The idea is to ensure that that P2\’s price either erodes all the gains (bearish) or recovers all the loses ( bullish). The point is to look at the price action and not really textbook defined patterns.
well i cant see any of the screenshots shared by others in the comment post to analyze the particular trade they are discussing about.
Most of them upload to google drive and share the link, Abhijeet.
Hi,
As you have mentioned, for the bullish engulfing pattern (or bearish) or other above mentioned multiple candlestick patterns, it is worth to be risk taker than risk-averse and thus trade (take action) on P2.
But you have also mentioned the likelihood of doji formation and thus forming even powerful combo to cash on the opportunity. This we can only identify if we wait till EOD P3 and behave as risk-averse.
So, what is the right way? Which is more helpful and which one average out (longer run) to be better?
P.S: I am still going through the modules and just reached here sequentially.
Well, the occurrence of doji or spinning top will not be known until it happens. So if you are a risk taker, the best bet is to take up the trade, if doji, then probably increase the stakes. But do remember, doing so will also increase your exposure to risk, so you need to be within your limits.
Hey Karthik,
Once again, hats off to you and the entire Zerodha team. Teaching people about candlesticks, you guys are really lighting up the candle of knowledge in the dark, gloomy stock market arena.
I have recently begun trading and it really seems very interesting, all thanks to varsity. I had a few queries about engulfing pattern, and I\’d be obliged if you would answer.
1. If P1 is a doji, or a star,and P2 engulfs in entirely but say, as a spinning top, then does this still qualify as an engulfing pattern? I am asking this since dojis and spinning tops indicate uncertainty in the markets.
2. If say, P1 is not a doji, but P2 is a spinning top, then does this still mean that its a bullish engulfing pattern?
Thanks, Maaz. Glad you liked the content here 🙂
1) Ideally, the engulfing pattern has a longish candle on P1, and a P2 candle long enough to engulf P1. Any variations to this should be treated with a pinch of salt
2) I\’d ignore this.
Hi karthik,
For a bullish engulfing pattern/ bearish engulfing pattern, or whatever may be the pattern it is! You\’ve said that if a recognizable signal occurs then one has to look for buying/shorting opportunities.
My doubt here is: I\’ve observed different candlestick patterns like 15 mins, 30 mins, 1 hr, 1 day, 1 week and 1 month candles. Each of them are conveying different signals i.e., 15 mins pattern is different from 1 hr ; 1 hr is different from 1 day ; 1 week is different from 1 month.
I\’m unable to decide which pattern would be applied to the stock during the intraday.
If suppose I\’m shorting a stock by looking at 15 mins chart, within half an hour or an hour the stock is reversing its direction and my stoploss got hit. This happened to me many times.
Need some help from you! Any suggestions or corrections that I need to implement??
1) Stick to 1 time frame and follow charts only from that time frame. For example if are looking at 15mins chart, then stick to just that. This will avoid a lot of confusion
2) Try and look at longer term time frame – for example 15mins is better than 10 mins and EOD is better than hourly chart.
Take a look at the chart below of Ambuja Cements. There are two bearish engulfing patterns formed. The first pattern on the chart (encircled, starting from left) did not work in favor of a risk taker. However the risk averse would have completely avoided taking the trade. The second bearish engulfing pattern would have been profitable for both the risk taker and the risk averse
can you please explain these if it\’s a bearish day how can it be in the favor of risk taker because he will be losing money.
Shivam, this is explained in the chapter in great detail. Can you please look through once? Thanks.
Hi,
In today\’s Yes Bank 1 hour chart closing at 10:15, there was a Gap up but the shadow (low) engulfed the whole of friday\’s 1 hour candle.
Since the bull candle body opened with a gap up and the shadow engulfed the whole bearish candle, can I still call it a bullish engulfing? Or like you have shown in the example of bullish engulfing, the body should engulf the body?
Hope you got my question.
Ideally, the body should engulf the previous day/period\’s candle and not the shadow.
Hi..
Understood the engulfing pattern. But which chart shall be considered to exercise the same?
The spot chart of the underlying (end of day basis) should give you a good start.
Is this type of chart can be drawn in Kite or Pi ? If yes then what should I select in type?
I\’d suggest you select the standard Candlestick charts.
So in that case will I be able to see all the candles which are mentioned in above tutorial . I see in other comments section that they are able to identify engulfing pattern.
I did not find any way to see two days chart at same level. Is that required some extra software ?
No, Shailesh. Each candle is one day\’s price action. So if you are looking at 2 candles, you are essentially looking at 2 day\’s candle.
And even ioc after some 8-9 sessions of down trend it has formed bullish engulfing with excellent volumes can u please check these charts becoz I\’m not able upload the charts here.
Yes, it looks like a decent pattern 🙂
P2 open should be around equal to or low off p1 close.Is it ok if it has some gapup or gapdown of some % of opening and it forms engulfing pattern as it has formed in yesterday\’s ITC stock.
Yup, as long as the % difference is not too high. High enough to impact the pattern.
Hi Karthik,
1. As you said in bearish engulfing, if there is a doji formation on 3rd day (P2) then there will be a long red candle and stock will be bearish for next few sessions.
Ques- Is the same thing applies to bullish engulfing as well ??
2. How to find the target of all the single and multiple candlestick patterns??
Thankyou!
Yup, it does. By the way, the presence of doji with candlestick is just my interpretation. You may want to double check this.
For targets, you can always use the support and resistance techniques.
Thanks for the reply!! 🙂
I have 1 more doubt:
I am seeing many charts, in multiple candlestick patterns chart, we can see single candlestick patterns as well..
so my question is-
In a chart what should be the priority? single or multiple candlestick pattern? which pattern we should look at first?
As the charts are increasing, confusion is also increasing!
2. Is there any priorities for the patterns?
1) Both are good and reliable, Sumit..although, my preference is for multiple CS patterns
2) Nope, there isn\’t any.
Sir,
You said that for forming bullish or bearish englufing pattern we can see if whether real bodies are engulfed or not rather than just the whole body ,can this also apply on the piercing pattern and dark cloud cover
No, in piercing and DCC, the candle on P2 should not engulf.
However I\’m in learning phase but I\’ll keep this punch line in mind for lifetime – \”Panic with uncertainty is the perfect recipe for a catastrophe\”
Always works, Rakesh. Human behavior does not change in markets 🙂
Karthik, I provided an email address while commenting but did not get notification such someone has reply or similar.
Could you please confirm with technical writing team because it is really required. As of now what I\’m doing, for example I asked a questions to you in 8 different chapters, and I\’m sure you would have reply for all the questions but I need to go all chapters comment section and need to search with my name/query; and sometime it becomes tedious.
Suggestion: User should get notification(if he/she provided and email id while commenting) when you or someone reply on his/her comment (as like Quora)
-Thanks
Rakesh, the problem is that there are many comments flowing into each chapter that at some point you will start getting irritated with all the notifications 🙂
We stopped this of the same reason!
Hi Karthik ,
As in 8.4 here , National Aluminum Co. Ltd (Nalco) formed the pattern (Doji after Bearish Engulfing) on 7thSept and took the Short position. But today I don\’t see any major changes in the stock. Could you please confirm whether I followed correctly?
Thx in advance
I see that the stock has declined quite nicely 🙂
Sir,
If a bullish engulfing pattern formed n on P3 red candle formed but upto the midline of green P2- is the pattern still valid??
Refernece- Today\’s YESBANK trade.
Hmm, I would be a bit hesitant, remember you have to buy on strength 🙂
want to understand the pattern formed by Yes Bank as on EOD 31.08.18. There is a gap formed with constant red candles
I guess there is some fundamental factors at play. Request you to please double check that.
Is there any difference between a tweezer top and dark cloud pattern?
I guess tweezer tops have a similar opening on P1 & P2, while DCC have a difference in the opening. Guess this is the only difference between the two patterns.
Hey Karthik, can you take a look at the following charts ?
1.) Cipla – If I am not wrong a shooting star has been formed on 23-08-2018 and a red candle has been formed on the next day. Is it a good opportunity to short ? (link – https://drive.google.com/open?id=17MfiwxhXyqQjKaFS-8iifcRBjaUiVj8I)
2.) UPL – A shooting star has been formed on 24-08-2018 if I am not wrong. So can I consider it as a shorting opportunity ? (link – https://drive.google.com/open?id=1-J0rjKbjSOAr87-E-KsEfXrOzq5mKm2A)
1) That is a shooting star. You can combine both the candles and consider it as an engulfing pattern as well
2) Yes, it is a shooting star. Please make sure the other variables are in place before you place a short order.
Previously I thought that technical analysis is very difficult (next to impossible) but thanks to you Karthik it is like a dream come true. Stock trading and markets is my passion and I am fortunate that I have such a good mentor. I appreciate your efforts, keep going 😉
Hey, thanks for the kind words, Sawrikar! Happy learning 🙂
Hey Karthik, I have initiated trade on both Cipla and UPL but the trades have gone against me unfortunately. Why is it so ?
Ajinkya, did you check all the other variables mentioned in the checklist towards the end of this module?
I am afraid that I didn\’t. Since it was a bearish engulfing pattern I executed the trade.
hmm, you need to stick to the checklist be a more probable outcome in your favor.
Hello there,
Karthik can you take a look at the below attached screen shot of Cipla ( as on 24/08/2018) ?
Looks like an engulfing pattern?
Hi Karthik,
Thank you so much for giving so much insight on various different concepts. This is the first reading material I am going through and it\’s really awesome. I am able to follow along pretty well. We truly appreciate your team\’s efforts.
I have a question (I have many but asking only one as of now 🙂 ):
https://drive.google.com/file/d/1WinTF_ahNuQeubLSe05RxN_k26LqD-_g/view?usp=sharing
In the above chart what could be the pattern, we can conclude for the UpTrend started where I highlighted in Yellow color. It\’s definitely not Bullish Engulfing or Bullish Harami pattern.
Is the UpTrend started here can be evaluated by any Multiple Candlestick pattern or by a Bullish Marubozu?
Request you to please share your thoughts around this.
Regards,
Abhinav
Thanks for the kind words, Abhinav 🙂
As such, there is no solid candlestick pattern here which indicates a reversal. However, you could check for the following –
1) Was it a solid support area, which was tested and the stock bounced back?
2) Was there a double or triple bottom being formed?
In the case of dark cloud cover.. Should P2 has to open above the P1 close price or it doesnt matter?
Yes, the opening on P2 should be higher than the close of P1.
what if in \”bullish engulfing pattern\” PR2 is red and engulfing PR1 (Also red)?..after looking this can we say ,this pattern is ostensibly bullish?….
I\’d see this as two strong bearish candles, Amandeep. Think about it, if P2 is bearish, then the stock opened lower, made a new high but was unable to sustain the high, hence closed lower again.
Should I complete all modules in order to start trading in equities or can I start trading after completing till technical analysis part only in this varsity?
Also,can you share your trading story?
You can certainly start after going through TA.
Sir, does imfa forming bullish engulfing pattern on 17/7/18..
Yup, it certainly looks like one, Roshan!
Many thanks sir for the
reply..
Welcome!
Hi Karthik,
I have spotted what I think is a Dark Cloud Cover in the BajajAuto charts for just yesterday.
I am unable to post a link of the screenshot here. However the OHLC data is as follows:
O: 3194.9 H: 3194.95 L: 3070.00 C: 3096.70 V: 932K —> 12-Jul-2018
O: 3078.00 H: 3174.95 L: 3057.05 C: 3161.60 V: 1.16 M —> 11-Jul-2018
My opinion is that shorting can be done here.
Could you share your thoughts on this?
Thanks,
Apurva
Hi Karthik,
I am sharing an instance of what I think is a Dark cloud cover and think that it is a short call.
Could you please share your thoughts on it?
https://drive.google.com/file/d/1TYef8-TVrgz4NBiKNJPpl3FSUOTKv0_8/view?usp=sharing
Thanks.
Apurva
Certainly looks like one…but volumes a low?
Since it\’s well above average, I reckoned it should qualify.
should it?
Yes, if the volumes are above average.
Great. Thanks.
Hi,
What if we get a Doji after bullish engulfing pattern, it means that there is a chance of greater upmove?
Yes, I believe that may happen 🙂
Hi,
Would the patterns formed on 25-Mar-1998 and 26-Mar-1998 in TataPower,together, be qualified as a Dark Cloud Cover.
Also the same for 04-Aug-2003 and 05-Aug-2003.
More importantly, I want to know whether the trends before each of them can be called, Up trends?
Could you share your thoughts on this?
Thanks.
I\’ll have to dig through the charts for this. By the way, why are you looking so far back in time?
Hi Karthik,
No worries. I was just trying to see how effective the engulfing pattern has been throughout the history of TataPower.
Secondly I attempted to spot as many instances of the aforementioned patterns, as possible.
Probably I am being a little naive here, but I was trying to check how frequently, these patterns caused a price reversal.
Thanks.
I get that, makes sense Apurva. The more you train your eyes and mind to spot these, the better 🙂
Good luck.
Hello Sir,
The above information has one statement as \’Later in this module I will introduce a 6 point trading checklist. \’; however, I could not see it at end of this module/chapter.
Can you please let me know which topic I need to refer.
Thank you.
Regards,
Harshajeet
There is an elaborate checklist towards the end of this module, Harshajeet. Request you to please look at it. Thanks.
Got it mate. Thanks!
Cheers!
Hi Karthick,
I came across an interesting candlestick while going through the charts of TataPower, please check the link for it. I have marked the candlestick with a rectangle. The OHLC data has also been highlighted for reference. I can\’t comprehend the happenings on that day.
Link: https://drive.google.com/file/d/1CHI5fTy8JtzvYigIc8ARD6kUn7VRRz-M/view?usp=sharing
How can a stock open at 0 when the previous day it was trading at 84.85?
Even if the close on that day is 84.85, then how come the high is 0?
Even if we consider the candle as a Marubozu, then the high and close should be equal, right?
How come the price could jump from 0 to 84.85 just because of a volume of 100 shares?
So how to understand what exactly might have happened on that day?
Tata Power went through a category change on 14th May 1999 from EQ to BE. As per the bhavcopy for 17th May 1999(next trading day), the previous day\’s close was captured as 0 instead of the price it closed on 14th May which has resulted in the erroneous candle being formed.
That\’s great. Thanks.
Hello sir, please correct me, is on 26/6/18 in coal india stock the bullish engulfing pattern was formed. As there was down trend, 26/6 candle was green, 27/6 was green too. Volume was above average, perfect for long position. But 28/6 is red candle.
Rohan, the patterns don\’t guarantee outcomes. They only increase the odds of a profitable outcome.
Sir, is the chart of Coal India satisfying Key takeaways no.9 – The presence of a doji after an engulfing pattern tends to catalyze the pattern’s evolution?
Yes, it does 🙂
Thank you Mr. Rangappa. I am currently long on Coal India. Should I add more here? Kindly advice.
Please make sure all the other variables comply with the checklist. Remember your stop loss. Also, since the overall market is weak, you may want to consider taking an options trade on CIL instead of futures. Good luck.
I am confused. Engulfing means is that the P2 first candle of the day should engulf the P1 last candle of the day?
ok, it means when you see the chart of a single day candle?
Yes.
It means the 2nd days candle (P2) should engulf the 1st day\’s candle (P1).
Hi, sir
Please help me out in understanding, what does the day means does it mean next day or next candle and why should we check the time at 3.20 pm before entering the trade after we see engulfing pattern..
Day means, end of day. I\’ve explained why 3:20 PM is relevant in this chapter – https://zerodha.com/varsity/chapter/single-candlestick-patterns-part-1/
Hello Sir,
I must say, the modules are amazing for starter like me. Your way of teaching is amazingly unique. Thank you so much.
I have a question. Let\’s say, I placed a trade based on Bullish Engulfing Pattern and Market moved in favour and after few sessions (1 or 2 trading sessions) I saw Bearish Marubozu. What should I do? Should I exit ? What to do in such cases, where another recognizable candle stick appears before my Target is hit ?
Waiting for your reply!
Glad you liked the content here 🙂
Here is the thing – once you enter a trade, you hold on to it till your target is hit or till your SL is triggered. Even if you see another pattern emerging.
If Presence of doji forms a big red candle in next day how is that profitable? How is this a good opportunity?
You should not look at it as an isolated candle. Look for it in the backdrop of the other candles and see what the price action is suggesting.
I am sorry Sir.I did not understand what you are trying to say here.
Meaning, you will have to take a holistic view of the candlestick pattern, and not just one candle, especially if it is a doji or spinning top.
Okay Got it..Thank you sir
Nice! Keep learning 🙂
very good book very nicely written. Recommended for absolute beginner who want to learn basic to advance.
Happy learning, Ujjal!
In the bullish engulfing pattern\’s last chart.Can we consider the red candle as a hammer?
That is an inverted paper umbrella – sort of a shooting star.
hi,
how can u enter a short trade at 3:20 pm….isn\’t it too close to the end of the day to be able to square off?
You can always take a position in futures.
assume there is a situation where the ICICI Bank stock forms a piercing pattern and the HDFC Bank stock forms a bullish engulfing pattern
—-icici stock forms a piercing pattern ? It is dark cloud pattern right…
Sorry, I\’m unable to get your question. Can you kindly rephrase?
hi sir kindly check it out
https://drive.google.com/file/d/1fa330Mih36zMMmXwOVJfAet0lHKUjZ8a/view?usp=sharing
Yes, this is a bearish engulfing pattern.
Hello Karthik Sir,
I have opened an account with zerodha 1 year back and then I came across Varsity. I am glad to have access to such an insightful content. I thank you (especially you because I already consider you my Guru, not just in words. I\’ve watched your videos on youtube about – How Much Money Do You Need When You Retire and Reading Cash Flow Statements and analysing a company. Sir all the information and knowledge you deliver goes straight into the head. It is absolutely crystal clear) and your team from the bottom of my heart for all the efforts you have put to educate people on stock markets.
I\’m a civil engg student with no knowledge about stock markets and I\’ve been reading through varsity since past few days. Sir, I\’d be grateful to you if you help me with the following:
1) Other than Varsity should I also refer some books available in market on value investing etc. or is varsity content sufficient for a novice like me? If yes which books would you recommend?
2) I have opened account for equity as well as Commodity but I have no knowledge of Commodity and F&O markets. Should I first learn everything about equities and then step into Commodity and F&O or should I simultaneously learn that too? Is it true that the equity market is safe if I go through the fundamental analysis?
3) Should I completely avoid Intraday trading as a beginner or it shouldn\’t be done at all at any stage?
4) In the technical analysis I understood the stoploss we should place while buying a stock so that once the trade is started either target is achieved or if the stock goes down, the stoploss is hit. The confusion is the stoploss while selling. I didn\’t understand how is stoploss used while selling.
I would be grateful if you reply to my queries.
Thank you.
Akshay, I\’m so glad you liked all the content on Varsity. Thank you very much for the kind words.
1) The content on Varsity certainly helps but then you should look at going beyond. I\’ve recommended a set of books here – https://zerodha.com/varsity/chapter/finale/
2) Yes, that sequencing will certainly help. There is nothing that can be considered safe in markets, they all come with its own set of risk and reward characteristics.
3) Take your time, experience holding positions overnight before even venturing into day trading
4) I\’d suggest you read the chapter on shorting, this will give you a sense on how shorting works and therefore the stoploss placemenet.
Thanks a lot for the guidance and your time Sir. 🙂
Happy learning!
Today HCLTECH has formed bearsih Harami. Am i correct?
Assuming all other checklist is satisfied, one should short the trade. But at 3.20 pm i cant short the trade.
Shorting on intraday is working but that wont be the scenario in the articles.
what should i do here. Going long is clear for me. Going short it what killing me as i am unable to do.
Please help me in this Karthik with some clear answer how to go ahead on shorting.
Thanks in advance
Soory its bearish Engulfing
Nope, like I said, there is no prior trend. Bearish engulfing sits at the top of an uptrend.
There is no prior trend, so not a pattern at all. For a pattern to be considered, the prior trend is extremely important. In the absence of this, it is not a pattern at all.
Sir. Can i call this The Piercing Pattern?
https://drive.google.com/file/d/1wKUDdAqx54ATdwLOVXVvR30HxCFuyPxT/view
Would have been happy if it had moved slightly higher, but anyway, yes, I\’d consider this a piercing pattern.
Hi Karthick,
I have tried to spot a few patterns in Hindalco chart and the description is as follows:
1. Dark Cloud cover.
2. Bearish Engulfing
3. Piercing
4. Bearish Engulfing
5. bearish Engulfing
6. Bearish Engulfing.
7. DCC
8. DCC
9. Bearish Engulfing
10. Bullish Engulfing
11. Bullish Engulfing.
12. Piercing pattern.
13. Bullish Engulfing.
I tried to post the screenshot, but it just won\’t happen. I would appreciate it if you could let me know how I can send you the same.
Thanks.
Try uploading on Gdrive, but don\’t include too many links in 1 comment, it may get blocked.
1. Can you please tell me if these patterns can be applied to only intraday charts that is 1, 3, 5 or 15 minute charts (which is the most suitable among these based on your experience) or can be applied to 1D, 1W, 1M charts as well?
2. If I use this on, let\’s say a 1D chart and I find bears will dominate, how do I go short? I thought we can only short on intraday trades.
3. Can you also tell me how to set the target price and how long we can hold the stock?
Suggest you read the chapter on support and resistance.
Like I said, read the chapter on support and resistance.
1) Yes you can. Longer the time frame, the better it is. I\’d opt for 15 mins
2) YOu can short the futures.
Hi Karthik,
Great write up…!!!
On 08-02-2018 Tata Steel formed a bullish engulfing patter and the the very next day i.e on 09-02-2018 we saw the trend continues i.e the Bulls took the stock up.
I just want to know how we find out till when this upside move will continue .Whether the next trading session will be dominated by the Bulls or the Bears will come into play.
Regards,
Rohit
You cannot really predict this, Rohit. The candlestick patterns only enhance the probability of the trade turning positive. There is no guarantee that the price will move in the desired direction.
Hi karthik
In 15 min or 30 min intraday chart, sometimes rule 1 that is buy on blue candle day may be violated. Can this come under flexibility in the context of small time frame trades. Or Rule 1 is better to be followed in small time frames also?
Ideally, it should be followed across all time frames 🙂
Dear Sir, I have a doubt with regard to the first chart of this chapter (Biocon). In this chart the 10,11,12 candle from the left show no movement at all, its been stagnant that entire three days. Could you please teach me Why and How this happens?
Thank You!
Hmm, if this was any other stock, I\’d attribute this to no activity. Cant really do that with Biocon. I suspect that is some erroneous data.
Ok, thank you Sir.
Happy learning!
Dear Sir, I found the same pattern of candle stick with Just Dial futures (15 min chart), should I consider it as no activity or an error?
Ah, you can ignore this on intraday charts, Daniel.
Karthik Sir,
Awesome study material and you have the gods gift to explain things in a simplified way. May God bless you !
How can I view the charts posted by others to understand the xplanation/comments better. Use Chrome / Windows10
I\’m a newbie to this forum and stock mkt.
Thanks
Thanks for the kind words, Chimbu. Unfortunately, you cannot upload charts in the comments section.
The first day of the pattern (P1) should be a red candle reconfirming the bearishness in the market. What really is the meaning of this?
It means just that – the price action should confirm bearishness.
Hi,
What is P1 and P2 in this case and how do we establish that the day is bearish or bullish?
P1 refers to the first day of the patter occurrence and P2 refers to the 2nd. You combine these patterns to identify if the outlook going forward is bullish or bearish.
While we trade using candle stick pattern and there is sudden general but important news (i. e; unfavorable Standard and Poor rating for India or India\’s rating downgrade) which may cause the stop loss to hit due to overall fall in the market. In this event should be temporarily remove the stop-loss as there is nothing wrong with the scrip but just the overall sentiment of the market caused the fall in the stock?
This is quite common and happens almost all the time 🙂
As long you have the conviction to hold the trade, you should. But remember, your conviction is also a function of how well you can factor in the macros.
The example shown in Dark cloud looks more lo Bearish Harami… why can\’t we consider it as Bearish Harami?
Kindly reply me
Thank you
Not really, P2 of bearish Harami pattern is completely contained within P1, whereas in DCC, P2 is just halfway through within P1.
Hey,
I got confused in short forms used like P1 & P2. It seems like P1 is for hole day pattern of day 1 but at some places its seems like P1 use to talking about one single candle.
In P1, p stands for the pattern and 1 stands on the day pattern has formed. So P1 means the 1dt day of pattern formation, P2 for the 2nd day of pattern formation etc.
What time frame use to study market?
Really depends on your trading frequency and risk appetite. If you are looking at short-term trading then, maybe something like a 5 or 10 mins time frame may work…if you are looking at longer term then something like end of day works.
Do candle stick patterns apply for any quanta of session or is there a limit on that? For eg. Can I go with the candle patterns formed hourly? Is there a limit on min or max duration for candle stick? How duration size impacts candle stick patterns?
Candlestick patterns or in fact any Technical analysis principles can be applied to any asset across any time frame.
But ,there was an unanticipated fall at the end in the stock today .This I guess represents the classic case where we have a bullish engulfing patter but still the stock feel ,though after initial gains in early hours of trading.
I would like to know how are we suppose to anticipate the movement tomorrow in case such situation comes into play.
Regards,
Rohit
This is exactly why we need to stick to stoplosses 🙂
Sometimes the pattern looks so convincing, but then the market is full of surprises!
Hello Rangappa,
That was simply a great document which you made.Really simple and illustrative,hats off to you.
I can see that a bullish engulfing patter was formed in Tata Motors on 30-12-2017 and the trend continues as per your description of the pattern .Now as the pattern goes this trend i.e the uptrend is suppose to continue.Would like to have your comments on this .
Regards,
Rohit
Well, if all the items on the checklist is checked, then the probability of a continued uptrend increases.
Hi Sir,
1) What if the P2 day of the Bullish engulfing has a slight gap up opening(say a 0.1% to 0.2%) instead of \”Second, the open on P2 should be equal to or lower than P1’s close\” .Can this be taken as a positive factor to enter the trade,if all the other checklist item are positive? or it isn\’t a bullish engulfing and should we avoid it?
2) If so we can enter a trade for a bullish engulfing pattern with slight gap up opening on P2 ,then what about a large gap up opening (say more than 0.5 % to 1% or even more),can that to be considered as a good signal to enter the trade,if all the other checklist item are positive ? or these trade to be avoided?
1) Yes, you can accommodate this as a bullish engulfing. Remember, candlestick pattern permits you some flexibility.
2) Not really. Remember, P2 opening should be as close to as possible with respect to P1 closing.
Hi Sir,
what is the reason for the second answer.Why isn\’t that gap up opening can\’t be taken as positive factor?
You can, but that will no longer be a bullish engulfing pattern.
hey sir first of all really thank you for assembling such a great content at a single place.
Sir my doubt is that during watching for multiple candlestick pattern should we ignore the upper and lower shadow and only consider the body?
I\’d pay more emphasis on the body rather than the shadows. However, shadows too are important.
What target do we set for bullish and bearish engulfing? I guess you have mentioned only about stop loss. Also wanted to know a tentative investment period in the above patterns..
Stoploss is based on support and resistance (at least one way to look at it). I\’ve explained this later in the chapter. You hold these patterns, till about the time your target is achieved.
Hi Sir,
You have illustrated that whenever a doji follows a recognizable candlestick pattern,the opportunity created is big ,I have a doubt that say in bearish engulfing pattern,if there is a Doji on P3 ,doesn\’t it mean that the bear are not yet strong even after forming the engulfing pattern on the P2? This doubt arises because in one chapter you have mentioned that \”hammer is more better than hanging man since bears couldn\’t take the control yet that why the price goes up again\”.
Yes, confusion prevails and this is exactly what makes the presence of doji so powerful. Remember, confusion creates panic, and panic leads to bigger price movements.
Hi Kartik,
Have a look at this link below
https://drive.google.com/open?id=1vBE7c8A7jXvJU4BYJxZeVkCEKtyQ1XoL
We have a bearish engulfing pattern followed by a bullish harami in the recent two-three trading days. What is the usual sentiment in such cases? Being a risk averse trader, I presumed the price would go down, however, with a bullish harami the situation entirely changed. These are confusing positions in the market, please help me understand this situation and how do we read such patterns.
Always look for the prior trend. If the prior trend indicates bearishness, then I\’d go with the pattern which indicates a bullish reversal. Vice versa.
Prior trend for how many days? Assume we are doing swing trading for a week.
At least 5-8 trading sessions.
The DLF Nov future today forms a bearish engulfing with doji. Will it tantamount to larger decline tomorrow?
Generally true, but I don\’t really see a bearish engulfing here.
Which software is good for scanning live candlestick patterns currently formed or forming in Cash and Derivatives and MCX market such as bullish engulfing, hammer etc. Please advise the cost per month as well if you have any info?
Have you tried the expert adviser feature in Pi? Check this – https://zerodha.com/expert-advisors/
How can i apply these patterns for intraday trades as positions have to be squared off on same day after initiating trade at 3:20pm.
You can always base your trades for the day based on the previous day\’s pattern.
Hello,
Zerodha Varisty is a very nicely curated learning material and easy to understand as well.
My question is whether these technical analyses patterns apply to the option premium charts as well?
option prices move according to the option greeks.I don\’t think technical analysis can be applied to option charts
It is not a good idea to do that, Palash. Premiums are driven by multiple forces and not just direction which the chart captures.
Hi, In lot of places you have mentioned to enter the trade(Short) at 3:20 PM (for Risk Taker). As far as I know short trades have to be squared off on the same day. So how does one go short beyond 1 day. Thanks.
Short positions for Equity stocks cannot be taken for more than a day. However, for Futures and Options, short positions can be taken until expiry. You can read Module 4 and 5 to get more information on the derivatives segment- https://zerodha.com/varsity/module/futures-trading/
Thanks a lot Faisal. That really helps.
Sorry for the naive question but can positional trade be shorted?
When is it shorted, what is delivered to the person who buys it until my target is hit or stop-loss is breached?
If you short stocks then it has to be squared off on an intraday basis. However, if you short using futures, then you can carry forward the position overnight.
Got it. Thanks 🙂
Super!
Hello Sir,
You are just great who even after being so busy takes out time to help others we are really grateful to you.
I have one confusion sir as you had explained in the beginning of this module in a chapter that when there is a buyer of a particular share at the same time there is also a seller to sell the share and the trade is carried out between them.
So my question is if there is same amount of buyers and sellers in the market how are the prices drived from going up and down please help me with this.
Thanks & Regards,
Ketan 🙂
This depends on the market sentiment. If the sentiment is bullish, then the sellers will quote higher prices and buyers would not really mind paying higher prices (therefore the price tends to go up). Likewise, if the sentiment is bearish, then the buyers would be willing to buy by paying lower prices and hence the price starts to move lower.
It\’s so nice to see that Kartik still takes time out to reply to the queries. Just wanted to know what drives you to be so motivated after more than 2 years.
All of us at Zerodha believe in good Karma, Abhishek 🙂
what u mean by session here?
1 trading day is also called a trading session.
Can we use the chart patterns for the Nifty 50 Index and buy or sell Nifty 50 Index option contracts accordingly like how we do for the stocks?
Yes, thats it needs to be done.
So is the nifty driven by the people selling or buying the nifty 50 index futures/options itself or as a result of the performance of the 50 stocks under it or both? Hope you got the intent behind the question. Asking since I thought the pattern is not determined by the buying or selling of the nifty index themselves but because of the stock performance under it, so how will the candle stick pattern correctly work in general when playing nifty index (since the 50 stocks are diversified from different industries and hence there can\’t be a general trend), it won\’t work right?
This is exactly the point, the collective action results in the index movement and is further summarised as OHLC, which is represented in the candlestick format.
Ok so when I trade in the Nifty 50 Index in derivatives segment, if say I trade in Options, the demand affects the option price right, if more people buy the option price may go up and the trade might not be much profitable, so is it safe to say that its always beneficial to trade in Futures than in Options when I know for sure where the Nifty index is headed?
Not really, remember, for every buy trade there is a counter sell trade.
Putting stop loss at lowest low of two candles when buying, i can understand it, it is to minimise the loss. But putting highest high of two candles when selling,
I didn\’t catch it properly.
Pls help.
It is for the same reason!
Hi karthik,
I was going through chart of ACC . I have a query on that .Should i consider a drop of 5% price (in 8-9 trading days)in previous trend to satisfy for a bullish engulfing pattern .Or should the drop be grater than that?
Yeah, at least 5%.
Hi Karthik,
Cheers for the great work.
A question: for Bearish engulfing pattern, If we do shorting at the end of P2, then can we carry it( the trade) forward to next day or more number of days in order to square off. I have understanding that shorting is an intraday activity, please correct me if I\’m wrong; A beginner.
Shorting in the spot market is an intraday activity. However, you can short and carry forward the position in the futures market.
I have posted a query with a image url on 5/8/17,but seems the comment is deleted..
No, it was not approved then I guess.
Hi karthik,
can you please check the attached chart in https://ibb.co/mEMvCF . I could see that the stock has formed Bullish Engulfing pattern on 4th Aug 2017.Kindly confirm.Also how to set targets for such trades when there are suitables resistance points?
Thanks,
Sudheer
Yes, it is a Bullish engulfing pattern. One of the easiest way to identify target levels is by tracking the resistance level.
ok.Thanks karthik.
Welcome!
Is PDF\’s of Varsity content removed from the site? If not, could you please provide the link? It will help me to use it in my Kindle and refresh while I am in commute.
We will bring it back.
Hello karthik,
can u plz tell me how authentic is the screener website? have u used it?
http://www.screener.in
Yes, they are quite reliable. You can also check out – https://screener.smallcase.com/welcome
In the example of piercing pattern example u have mentioned that if P1s range is 12, P2 s range should be atleast 6 or higher but below 12.
Shouldnt it be If P1s range is 12, P2 should engulfs atleast 6 or higher but below 12???
The idea is to ensure that that the range of P2 is at least 50% of P1 but lesser than 100%. If it is 100%, then that is essentially an engulfing pattern.
Today TCS EOD forms the pattern of doji and earlier it formed a dark cloud cover. Also volume is more than 10 day avg. Does it confirm that TCS will fall from 2446?
Remember, when fundamental news is around, keep aside TA 🙂
when a bearish candle is formed, the opportunity is to short the stock and risk taker would do it on P2 day itself. But aren\’t we supposed to square off the short selling transaction on same day itself?
Short position in futures can be carried forward till expiry.
the chart https://ibb.co/ieQcfk shows formation of the hammer after a downtrend of 5-6 trading sessions but the volumes are not above average of last 10 days so the hammer pattern is not credible hence ignored, but at the end a bullish engulfing pattern is formed with volumes above the average of last 10 days however the next days (last day on chart ) a red candle is formed. My question is, can this pattern qualify as a bullish engulfing pattern? the prior trend should be a downtrend for a bullish engulfing pattern. is the prior trend enough downtrend for the formation of a bullish engulfing pattern ?
should the trend after the hammer formation be only considered for bullish engulfing pattern (they are all red candles but mostly are spinning tops) or the downtrend from around 67.50 after which hammer pattern was formed should also be considered?
Tricky, I would not really qualify this as a bullish engulfing pattern due to the lack of prior trend. But then, its all about being flexible, I may have considered this as a trade, but would have played safe with an options trade.
have not reached the options module yet, but will get it soon.
for now it seems every pattern i find it fails and trades in the opposite direction.
There is nothing equivalent to experience in markets 🙂
Hi Karthik,
How do I upload a file here? I\’m seeing TGBL today and I think it was forming a bearish engulfing pattern with a Doji…but today it is going up. 2 questions –
1. Is it a correct pattern that I have identified?
2. If yes, any reason why is it going up today?
If possible, I\’ll try and upload a file for it.
1) Yes
2) TA does not guarantee a movement, it only enhances the probability of an event occurring.
Thanks for the confirmation Karthik. Is it possible that for bearish engulfing pattern(or for any pattern for that matter) the stock will go down even if the pattern is broken today? If yes, what is the max. no. of intervals we can consider (like 1 day if considering EOD).
Yes, I usually keep the pattern under radar for 2-3 trading sessions.
Thanks a lot Karthik!!
Welcome!
Hello Karthik,
This varsity is really informative and easy to understand.
I have a query. in the Engulfing patterns, In intraday, how can an trader be risk taker at 3:20 on P2. I mean at 3:30 markets close and why should a risk averse trader wait till 3:20 of next day of P2, can he not validate this pattern after market close on P2 and go long next day.
Glad you liked it 🙂
Technically, the trader is expected to take the position after he gets a confirmation of the pattern on a closing basis.
In the fourth diagram,
isn\’t it a formation of hammer instead of bullish engulfing pattern.
if is not, please explain.
P1 is a hammer. P1 + P2 together form a bullish engulfing pattern.
I was looking at the chart of Axis Bank for 11th (P1) and 12th Apr (P2). Based on that I have few questions.
Scenario:
On P1 it has formed a blue candle and on P2, a long red candle which engulfs the P1’s real body. Based on this, I concluded that it is has formed a bearish-engulfing pattern (The prior trend does not seems to be bullish, it seems sideways or slightly bullish, but lets assume it is bullish for this example)
(Q1)
What should be the length of the P1\’s real body in proportion to P2’s candle? (A) P1’s length be slightly less than the P2’s candle (B) It can be of any length but shorter than P2’s candle?
If your answer is (B), then:
What if P1’s candle is already a recognized candle stick pattern like Marubozu, spinning top, Doji, paper umbrella or shooting star.
In this example, on P1 candle is a spinning top and is a blue color candle.
So in this case, should we ignore the P2 candle and read the chart based on P1 candle only? OR combine the P2 candle with P1?
(Q2)
Does all the candles in a chart have a recognized name? Does the candle of 12th Apr form any recognized pattern? As per my understanding it is just a long red candle.
Thank you in Advance. I have tried to make my query as clear as possible for you and other readers.
Q1-
A) Can be any length but shorter than P2.
B) Does not matter – its best if both P1\’s pattern and P1 and P2 together point to the same possible outcome. However, I wont read too much into the colour of a spinning top.
Q2 –
1) There are multiple patterns, practically impossible to know everything. However, you need to eventually start relating to the price action behind the candlestick patterns. Pattern names dont matter much.
how to attach a chart image in the comments ?
I think the upload feature has been disabled for security reasons.
Hey Karthik,
First of all, thank you!
My question is, do we have any module where we can find how to set Target, as you taught us how to set stoploss.
Regards
Mayank
Yes, we have discussed this later in this module 🙂
Sorry for the typo errors.
I\’d be sorry too for the multiple typos across all the modules and chapters 🙂
Hello Karthik,
While going through the queries I found one of the answers where you mentioned that you prefer 15 minutes time frame for intra day for determining the trade using the checklist. If I am looking at Nifty 50 shares then, my quirks are:
1. Is it possible to check all 50 shares in 15 minute time frame. If yes then how. Or any other alternatives.
2. For the swing traders like you have mentioned if there are positive pattern to enter into the trade at 3.20 pm, however for 15 minutes trader at what minute he should enter into the trade.
3. For intra day is better to be a risk trader or risk averse trader due to less time frame.
Please clarify. Thank you in advance.
1) You could use a scanner, check this – https://zerodha.com/expert-advisors/
2) 3:20 PM can be set as the hard stop for markets for taking positions, does not matter which time frame you are following.
3) Intra day by definition is a risk taker.
Is multiple candle stick pattern mostly used for two or more trading days?
Its used across many time frames – starting from intraday to multiple weeks.
Thank you?
Welcome!
Hi Karthik Sir,
Amar Raja was in downtrend for a while but from last 4 trading sessions it gives a signal of uptrend as of my knowledge, But Yesterdat again it has formed a Dark Cloud Cover Pattern with low volumes, So can i consider it goes down? What are all the possible outcomes here?
The Dark Cloud Cover
Couldn\’t reply there dunno why
Yes, the % change is 5.1% for the Cairn chart, but still arent the candles low in number ?
And sorry but I didn\’t get what secondary trend taking over primary meant. Do you mean that the primary trend which was up has ended as several red candles are taking place after every few green 1s ?
Yes, it means the primary trend is weakening out (for the time being) and the chance of secondary trend dominating the market is high.
Thank you for ALL the replies you\’ve given till now I REALLY appreciate it:)
As I tried to trade intraday for a few days following the chart patterns for practice I noticed this bug/shortcoming that the formed candles are not always correct.
So, I started reloading chart every few seconds to be sure(which is quite a pain :L ) that the formed candle is correct but even then some candles pattern change after a while..What is the solution for this ? Because in 5 minute candles you gotta buy/sell quickly as a pattern forms and if the pattern formed is faulty it\’ll result to a wrong trade. Till now I\’ve initiated wrong trades twice due to this problem.
Nothing wrong with the charts. Anyway, base your trades in such a way that the you initiate the position at the completion of a 5 mins candle.
Yes, I do buy at the end of a 5 minute candle(like 10-15 seconds before the creation of a new candle).
Proof of what I\’m saying on Kite and Pi… if the charts keep changing like shown in the photos below then how am I supposed to start a correct trade because who knows in 2-3 minutes the candle would change into something else ?
Same chart pointing to the same candle after reloading the chart after every few intervals for 5 minutes
Chart – 1
https://drive.google.com/open?id=0B0bePrdjZCDobmVZVnlEbVpzUU0
Chart – 1.1
https://drive.google.com/open?id=0B0bePrdjZCDoaG5aQ1U3Y1BraDg
Chart – 1.2
https://drive.google.com/open?id=0B0bePrdjZCDoSkNXNXpQSU85NTA
On Pi
Chart – 2
https://drive.google.com/open?id=0B0bePrdjZCDoTGhpZU5mcTN4VkE
Chart – 2.1
https://drive.google.com/open?id=0B0bePrdjZCDoSHhRWUZBZDBDNlk
Have you checked this ? – https://tradingqna.com/t/i-placed-a-stop-loss-order-which-got-executed-but-i-dont-see-my-stop-loss-price-on-any-charts-be-it-on-nest-nse-amibroker-or-any-other-chart/577/2
Yes, I\’ve seen that link and I know that it\’s not possible for a chart to show every tick but at least when you reload the chart it should show the exact data from Zerodhas server. But as you can see above in the charts that the candle has a huge difference in the interval of 5 minutes for every time the chart was reloaded. All I wanna know is what is the solution for this ? Because if I had to base my trade on that particular candle my trade would\’ve been 100% wrong
Can you please email [email protected] for this?
Mail sent to the email with the chat transcript.
Ok.
Hello! A fabulous guide thanks for the effort!
Please clarify my doubts-
Yesterday I saw a Marubuzo being formed in SBI so I expected it to be a bullish day today as the support and stop loss was under 4% difference and even the volume almost near the avg volume(not touching the volume SMA). But yet it just went the opposite direction today. What could be the possible reason for this ?
Link to SBI chart – https://drive.google.com/file/d/0B0bePrdjZCDoVmYwXzVabkdra3c/view?usp=sharing
Also, I saw a piercing pattern in SonataSoft which was followed by a doji, so as you\’ve suggested that a doji highly increases the chances of a trade going in the pattern direction I expected this to go bullish today, even the support was under 4% difference and volume was almost close to the avg volume(not touching tho). But today it went the opposite direction. What did I do wrong ?
Link to Sonata chart – https://drive.google.com/file/d/0B0bePrdjZCDoOUU5dUlYdktrRVU/view?usp=sharing
A general question – Consider a hammer has formed, the subsequent candles are green and the volume stays above average for 2 trading sessions but after that the volume gets below the average volume on 3rd day(the candle is still green). So, does it mean that the pattern trend is diminishing or weakening ?
SBI trade is still valid right? SL has not been triggered yet.
Sonata is not a valid piercing pattern…there is no prior downtrend.
No, you look at the pattern and associated variables on the day of initiating the trades. Once trade is executed, only thing you need to look out for is price moving to either target or SL.
Thank you for replying
In Sonata, is the downtrend there only from mid 7-14th date ? After that it went kinda straight so thats why it isnt downtrend ?
I was actually trying to do this, please correct me if what I\’m doing isn\’t the right way
I check all the variables for it to be a valid trade as per the checklist, if it is I buy/sell the stock next day as MIS and try to get whatever profit it makes in that by the EOD.
Because the downtrend has to have at least 4-5 consecutive downtrend session, contributing at least 5-6% down move.
If you are starting fresh, I\’d suggest you not take excess leverage with MIS. Look for overnight opportunities.
Thanks for the explanation but here in this chart of Cairn you said that it was a correct uptrend but before the shooting star(marked with arrow) there are only 3 candles behind it.
https://drive.google.com/file/d/0B0bePrdjZCDoZ05UUldldWNvQ251aC1nRmM1QW8tTmUtQ3JV/view
Please guide me with the trends(if they\’re even right) by the numbered lines.
Chart 1 – https://drive.google.com/file/d/0B0bePrdjZCDoM19sVnZENjdCS2M/view?usp=sharing
Chart 2 – https://drive.google.com/file/d/0B0bePrdjZCDoRlo1U2Q1Mng0UWc/view?usp=sharing
Sorry, I cant seem to understand the charts you\’ve posted.
Hello, is this a downtrend in LIC ? it has 4 red candles in total making an evening star if its a downtrend
link – https://drive.google.com/file/d/0B0bePrdjZCDoMEdZemhDN1BwVVE/view?usp=sharing
Yeah, looks like.
🙂 Please tell me about these candles, it\’s going up but I couldn\’t figure out what trend is going on right now in them(if any) ?
https://drive.google.com/file/d/0B0bePrdjZCDoci1LSTRIVWwyeGs/view?usp=sharing
Looks like the secondary trend is taking over the primary.
What I meant was there are only 3 candles behind the shooting star then how is it an uptrend as you\’ve mentioned earlier ?
https://drive.google.com/file/d/0B0bePrdjZCDoZ05UUldldWNvQ251aC1nRmM1QW8tTmUtQ3JV/view
Did you check the percentage move?
dear sir;
kindly clarify my doubts-
1)can we use MOVING AVERAGE for confirming the trend? If yes, than what would be the paramaters?
2)For intraday trading whether to identify trend on EOD , HOURLY, intraday chart?
Thanks in Advance.
1) Yes, depends on your time frame
2) I\’ve answered this earlier.
What exactly is the thought process for piercing pattern and dark cloud??
Explained in 8.5 & 8.6 – http://zerodha.com/varsity/chapter/multiple-candlestick-patterns-part-1/
Hi KARTHIK!
To see/read such content, it\’s wonderful. I hope this will be bringing a lot of business to Zerodha.
My Q: to start with I am a rookie, but i have this basic concern about the highest/lowest as the stoploss in bearish/bullish engulfing pattern. Why high/low respectively & not any other value? need a little clarity around the same. Thanks in advance!
High / low are crucial turning points for the stock….at these points the sentiment changes. Hence the importance for these price points.
Hi karthik
Thanks for the initiative.
Would like to ask that at 8.4 the presence of doji u mention about the chart but there is no chart visible. This has happened earlier as well sometimes.
One more thing sir I m not able to distinguish between an online and offline broker as both give almost all the services barring the trading tips. Can u please help.
Thanks in advance.
I\’m able to see the chart Mehul, can you please refresh your browser again?
An online broker renders all his services online, however an offline broker has physical office, and services are rendered both off and online. The world is moving towards online services, it is more efficient, transparent, and quicker. I\’d suggest you opt for an online broker.
Hi Sir, can you please clarify if HCLTECH on Dec 16 formed a bearish engulfing pattern with volume above SIMPLE 10 day average. This is on a daily chart. Thanks. I am not seeing a place to upload the screenshot. apologies for the inconvenience. Thanks.
Yes, it seems to have formed one. Good luck.
Do you think NIFTY has formed a piercing pattern on Dec 5 ?
No, because of the absence of a prior trend.
Can\’t upload the attachment here?
You can I guess, many folks here do that.
Sir,Please confirm that M&M has formed a Bullish Engulfing pattern with good volumes?
Help me to identify the Support and Resistance, As of my knowledge Support at Pattern low and Resistance is at 1350 to 1370?
It seems to have formed one. I can help you if you have been stuck somewhere, so please do let me know which part is difficult for you to understand.
which time frame suits best to identify engulfing patterns ?
TA works across all timeframes. My personal preference is to look at EOD data. However, if you can choose to work with 5,10, or 15 mins candles for intraday trading.
Thanks a lot karthik
Welcome!
can we take this as bullish engulf ? just to test my understanding, see 1/11 and 2/11
https://kite.zerodha.com/share/Q2JM7K3WQ5.png
I do see a BE pattern, but not sure if both of us are seeing the same. I\’m referring to the 6th and 5th candle from the right.
Sir,
The subject presented is very good and useful to beginners.I have gone through many books but are very exhaustive and this material is exceptional and very useful.Koodos to your effort.
Many thanks for the kind words, happy to know you liked the content here 🙂
Hi Karthik, a small doubt
what if a doji is formed after a bullish engulfing pattern , will the consecutive sessions form blue candles???
Thanks and Regards
Thats the general opinion and I\’ve explained the logic as well as to why traders think so.
Sir, can tell me by seeing the chart of the SBI on 14th Oct 16 …..If it is a bullish Harami
Yup, looks like it.
Rule snout the stop loss is described, but what shall be target is not explained. Is there any rule for the same.
Well, the immediate resistance could be the target.
Hi Sir, on the topic of \” whenever a doji follows a recognizable candlestick pattern, the opportunity created is bigger.\”My query is can the candlestick pattern be single pattern followed by doji also give bigger opportunity? also what should be the volume on p3? should that also be above 10 day average volume. Thanks.
Yes it can be. Volume on P3 has to be higher than 10 day avg.
what will happen with allotment of equity shares ?>will it leads to decrease or increase the price?
Sorry, dint get that.
Hi Karthick,
Images on the comments are not visible, earlier I have informed about it along with Vishal Saini in this page , any updates on that? Not able to see a reply option on that chain message , so posting it again here separately.
—
Thanks
We have checked this on many different browsers and it seems to be working fine. Note sure which images you are talking about.
Images in articles are visible and in fact they are really superb , credits to the designer. I am talking about the Images that people attach in the comments it\’s not visible. I don\’t see option to add images in my reply either…
Let me check this right away!
Hi Karthick,
Sorry for bugging you too often, just to let you know the issue still exists for me.
Really sorry, we are uable to figure out the issue. This is working absolutely fine with all of us here.
Me too…
I\’m using chrome and is able to read the questions raised in comments however no charts are visible… Request to kindly sort it..
I use Chrome too, Senthil. I can see the charts. Can you please do a hard refresh of the browser once? Thanks.
While going through the technical analysis part I came across 2 candlestick patterns listed below :
1. The Dark Cloud Cover
2. The Piercing Pattern
1. The Dark Cloud Cover formation requires the second day red candle to open above the highs of the first day candle, than only it forms a classic dark cloud cover pattern. Whereas in Bearish Engulfing Pattern the second day red candle needs to open above the first day\’s close and not the high. I had a doubt what happens if its a dark cloud cover with a variation where the second day red candle opens above the previous day\’s close and not above the highs. Will the pattern still hold significance? The same doubt applies to The Piercing Pattern?
Tejas, in the whole module I\’ve given importance to close/open, and not the high/low. This is not a hard fast rule, depends on your trading experience i guess.
Okay. Thanks Karthik.
Welcome!
These have been the most useful stuff i have ever come across related to stocks- right from the first module and I\’m enjoying every bit of it. Eager to continue learning from the later modules as well. Thank you so much Karthik for the efforts you and the team have put in.
Most welcome Pratik! Happy you liked the content here!
Hi Karthik Sir,
I hope Drreddys formed a Morning star with increased volumes compared to last 10 days and SL is on support level and i am finding difficulties in finding targets(i know next resistance will act as target1), but unable to find a Resistance (target) and what are all other check points i should consider to take a trade other than Candle stick Pattern, Volumes ans S/R?
Please let me know your views.
Regards,
SaikiranGarapati.
It certainly qualifies for a long trade, I\’d believe 3008 as the next resistance level..however you need to check the reward to risk ration before initiating the trade.
Thank you sir
Welcome!
Hi Karthik Sir,
Is HCL chart has formed a Piercing pattern?
If possible please identify a support and resistance for me?
Regards,
SaikiranGarapati.
Dont think so, the low was not really lower than P1 and I dont think P2 recovered 50% of the losses made on P1.
Thanks Karthik Sir…
Welcome!
Hi Karthik Sir,
To day i have seen a Bearish engulfing pattern in Voltas(please confirm it from your end also) but volumes are 1,35,000 lower than last 10 daya avg volume? Can i consider this short trade even though volumes are low?
It does, please do confirm if all the other parameters fall in line before initiating a short trade. Good luck.
Hi Sir,
My Doubt is even though it is lower than the 10 days avg volume, Can i proceed up to what extent like if is below just 50,000 of last 10 days avg volume, can i proceed or not?
Its best to compare today\’s volume to recent past average volume….something like 10 days is good as it gives a good sense of whats happening in the recent past.
Hey Karthik –
Is it possible to do a short trade at the close of day. I was thinking all short trades other that F&O get squared off at the end of day. Is there a chapter clarifying this ?
If you short in spot market then you will have to square off by 3:20 PM, however you can carry forward your short position in Futures and Options.
Hi Karthik,
I can understand for bullish engulfing trend should be down. But what if bullish engulfing pattern is formed in up-trend. And vice-versa for bearish engulfing. For example Lupin has formed bearish engulfing twice in last 7 days on daily chart when trend was donw.
Thank you.
Regards,
Jitendra
Prior trend is an important factor for the Pattern to work. I would suggest you ignore patterns which don\’t comply to this rule.
Hi kartik
Can i consider the multiple candle sticks for 5 min chart.?
Of course you can.
Hi Karthik,
As Maruthi has formed, Bullish engulfing pattern with good volumes,What is your view on this?
Certainly seems bullish, please do consider other checklist items before taking a trade.
the chart..
Replied earlier.
your comment..
in one of your previous comment(shown in the pic below..) you have asked the person to hold on to the stock till the SL is reached.
But in shorting the trade has to be squared off the same day itself.. how then can we hold on??
You can hold short trades overnight via Futures.
Hi
Can you kindly confirm the patter weather it\’s an bullish engulfing do I need to go long on this ??
For a Bullish Engulfing pattern, the opening on P2 should be lower than the close on P1. For this reason the pattern is not really a Bullish Engulfing pattern.
Hi,
Bearish engulfing pattern should be followed by a up trend, but what if I see this pattern after a down trend does it signifies more down side or nothing
Below is CAIRN Fut daily chart
Last candle is certainly engulfing the previous one, it is also red.
But the problem is it is at the toon of the down trend
Bit confused ……
Yes, bearish engulfing pattern needs to appear on top of the chart. This one can be treated as a continuation of bearishness.
Hi,
Can you tell me your view on last candle of the Bharatforge? Is it a Doji or Paper Umbrella? Last previous candle is a Bearish Marubuzu, I am in dilemma whether it is a Bullish Harami or Maubuzu with Doji?
At best this can be considered as a continuation of bearish trend as its not really a defined pattern.
Ok..Thank you very much
Welcome!
Hi Karthik,
Please confirm me NTPC has formed a Bearish Engulfing pattern or not?
As i draw some boxes, Please confirm me Whether my understanding is correct or not.
First box is Resistance one
Second box Resistance two
Third box Support one
these three points are align with our Bearish engulfing pattern(On the same zone) but low volumes on last day. Please provide me your insight on this?
Both 1st and 2nd boxes refer to the same resistance level, which later turns out to be the support level. This explains why the stock is showing some signs of correction at the same level now. I would be bullish on the stock considering it has moved up in the recent past.
As it has formed Bearish Engulfing pattern with Doji on next day, to day it has formed a Red signal by covering that Doji..(I am speaking about last four candles)
Can i expect the trend has been reversed? Volumes are not encouraging but Resistance is ok for me in the zone of 147 to 140 in 1 year chart..please help me to identify Resistance for this or confirm me whether my resistance zone is correct or not.
My Resistance Zone Chart…
Here i am assuming like sell signal Entry at Rs-142/-,SL 147, Tgt 138..please give me your insight on this?
Seems good, hope it works in your favor.
Yes, this looks like a bearish engulfing followed by doji, conducive for a short trade. However keeping in view the recent uptrend in the stock, I would look out for buying opportunity on corrections. Suggest you read about the low volume retracement here – http://zerodha.com/varsity/chapter/volumes/
Thanks Karthik..I will definitely read that module.
Sure.
Hi Karthik,
Can we consider the last 2 cadles of SBI chart as a Piercing pattern?
Regards,
SaikiranGarapati.
Not really, in piercing pattern the candle on P2 should open below P1\’s close and then move up to close at least higher than 50% of P1\’s range. Since this is missing in SBI, its not really a Piercing Pattern.
Thank you Very Much…
Can you help me to identify the Support for Canara bank and confirm me whether it has formed a Bullish Engulfing Pattern or not?
It seems ok for me, but i could not able to find support and volumes also low on last day.So please give me your insight on this..
Clearly there is no visible Support for Canara Bank. Yes, this looks like a bullish signal…I would set up an options trade here rather than naked future or spot market transaction.
Sir,
For a Engulfing Pattern both bullish and bearish how to set a profit target.
The immediate Support and Resistance level usually acts as a target level.
Hi Karthik, these tutorials have demystified TA , thanks for this tutorial initiative. Can I know your view if the last 2 candle form a DCC, so we can initiate short with SL being high of the bullish green candle.Also the volumes on the last candle are convincing. Thanks in advance
One of the prerequisites for DCC is that the open on P2 should be higher than the close of P1, which is missing here. For this reason I would be hesitant to call this a DCC pattern. The volumes seems ok.
Can we consider 4th candle from right as hammer, followed by a doji showing indecision and then a green candle
The hammer is not really convincing Anand, the ratio of lower shadow to the real body does not seem to be ok.
Hallo karthik,
can i consider this bullish engulfing partten after doji on M&M on 18 dec 2015
can i go long plz advice
At best you can consider this as a bullish Harami, please look for confirmation from other items on the checklist before going long.
sir,can u tell me parameters for EMA,Bollinger Bands,MACD and please tell me Afl when close >EMA,Close>Bollinger Middle Band,Close>Macd Line this is buy situation .
Suggest you reach out to [email protected] for this.
Karthik bro,
Please help me with queries from image. Thank You 🙂
If the pattern occurs at the top end of the rally, then its called Dark cloud cover. The one below is not a dark cloud cover. Same for piercing pattern.
ok.
Can you also please tell if the thin body can be considered as shooting star in up trend?
Thank You
Hi Karthik,
I heard DOJI is a Trend reversal pattern some where. I mean if we see DOJI after a down trend, it will be a BULLISH signal and vice versa. As per the above article I read like it is indecision. I am confused now. Please clarify my doubt 🙂
As I said, it does indicate indecision and most likely there could be a reversal…but you need to be prepared for both!
Sir,
In piercing pattern is opening of P2 SHOULD BE BELOW/LOWERTHAN CLOSING OF P1(OP2<CP1)
Yes, this is a key requirement.
Hi Karthik,
What is Free float Market Cap(crs) which is showing in Nseindia.com for every script?
Check this – http://zerodha.com/varsity/chapter/the-stock-markets-index/
Thanks For all Your Queries .. As you said
(any engulfing pattern with Doji will give good opprtunity)To day just dial has given proved that. Will it be applicable to only for engulfing pattern or any other patterns will it applicable?..Here one more chart with Bullish Engulfing Pattern..Am i right?
Once again Thanks for your patience,,really i am getting confidence..
Any recogonizable candlestick patter followed by doji tends to give good results. Good luck!!
Hi karthik,
Can i Consider Attached Ambuja Chart has formed Bullish Engulfing Pattern? Sorry to ask this type of queries..I am in dilemma whether to consider it or not because the present trend is sideways for me in the chart from last few candles..
Since there is no prior trend I would not consider this as bullish engulfing.
Hi Karthik,
Can i expect circled one as a Support for this Stock as it has formed Bearish Engulfing pattern with Doji with increased volumes?
It looks like correct opportunity for me to enter the trade(Paper trade)?
Entering the Trade at 991.5 Target 760 – 780, SL 1058.Please correct me if my support position is wrong?
Regards,
SaikiranGarapati.
In fact the stock has formed a double bottom (encircled area).
Hi Karthik,
Can i consider the candle which is 2nd candle from last as a Doji or Hanging man?
Regards,
SaikiranGarapati.
The candle look like a paper umbrella.
Hi Karthik,
If you see in Futures & Options, For each month there is a separate lot size is appearing. How they decide for this month, this is the lot size for particular script? Is there any formula for this?
Regards,
SaikiranGarapati.
No, lot sizes are same across different months. However the lot sizes are changing in November hence you see different lot size for Oct and Nov. From Nov onwards you will observe all lot sizes to be the same.
8th candle from Last, Can i consider that candle as a Doji or Hanging Man?
From the 8th Candle, Again market is in Downtrend as per the chart, but as a basic rule for forming the bearish Engulfing pattern, The prior trend should be Up Trend? I am confusing whether to take last 8 candles or not, So please let me know, to check whether a particular signal has formed or not, How many candles i should consider?
Regards,
SaikiranGarapati.
Yes, the 8th candle from last is a doji. In this case even though the last 8 candles form a downtrend …and therefore the prior trend criteria does not really qualify. However if you look at the generic trend you will realize that the stock is in a good up trend and more recently there is some sort of exhaustion in the rally. So you may want to take notice of this and initiate the trade.
Thanks Karthik. With this pattern can we trade in options? Because i want to take less risk with very limited capital. Mean while i will read Options module. In Nseindia.com i used to get a Options PDFs(In education) but these are not available now. If you have that copy please give it to me.
Thanks for this lessons…
You can, in fact have a look at this chapter http://zerodha.com/varsity/chapter/case-studies-wrapping-it-all-up/ .
Sorry, dont think I have the PDFs as well.
Hi Karthi,
Can i Consider the attached Just Dial Chart formed a Bearish Engulfing Pattern?
Regards,
SaikiranGarapati.
Yup, looks like a good candidate to short. Do make sure other parameters are verified.
Hi Karthik,
I am new to charting. Can you please explain from this live chart, what is the trend for the stock and how can one trade into it.
Chirayu I\’m afraid my response may confuse you more 🙂 – I would suggest you start from chapter 1 and follow the flow.
Hi Karthik,
Please do respond, I will start with chapter 1 and then use your response as validating the learning.
That way I will re-nforce the learning.
Looks like the stock is bottoming out!
Hi Karthik,
Thanks for the response
1) What are the signals that indicate that the stock is bottoming out
2) The stock made a high of 573 today and closed at 550 today ( of course NIFTY also went down today).
I saw that the 5 day EMA crossed the 20 day EMA on october 13th.
The fact that the stock is not making new lows indicates that its bottoming out.
So when can we enter this stock. Are there any visible patterns ?
Chirayu – this depends on lots of things. Please do read the whole module to build a perspective. No shortcuts in trading 🙂
In the 8.4(Presence of Doji), you did not mention whether we have to take position or short position. As per your saying, whenever a Doji is formed one should look for trading opportunity, but I am not able to get whether to buy or sell at that point. Please clarify. Thanks.
The presence of a Doji after a recognizable candlestick pattern only strengthens the pattern. For example a doji after Bullish engulfing builds a stronger case for buying.
Karthick ,
Is a green candle after bullish engulfing seems more positive signal than a doji after a bullish engulfing, since doji has some uncertainty whereas green candle denotes positiveness on bulls ?
—
Thanks
The presence of doji causes more panic to bears and kind of creates a desperation to square off the position. This usually leads to a sharper rally.
Thanks Karthick , that sounds logical . Now I take Doji candle after other pattern to be a stronger signal than any other candle.
This would be my preference 🙂
Hi Sir,
This is 7-oct daily chart for Infy
6th oct i have seen Bearish Engulfing pattern occurred in this share. But today 7th oct it will not go further down.
Hi Sir
This is today Nifty Futures (Oct Series) 5 min Chart taken from pi,
1.Bearish Engulfing
2.Hanging man
3.Bullish Engulfing
4&5.Shooting Star
6.Two Hammers
Sir am i correct ?
Thank you
Uday – the 1st one Bearish Engulfing pattern looks ok as long there is a prior up trend to it.
2nd one – is not a hanging man since by definition a hanging man needs to have a prior up trend
The rest are ok.
Shouldn\’t the six one be a piercing pattern?
Which six are you referring too?
the sixth one marked in the image in the comment of uday nara
Thank you Karthik.
Yeah, I need to start making a list of the stocks v/s the pattern. But I guess that would come from experience isn\’t it?
The more you read through charts, the more you know which pattern works for which charts.
Absolutely!
Hello Karthik,
Please find attached the daily chart for crude oil.
Let me know your take on this please. Would be of interest to know how you would look at this chart.
I see a hammer at the bottom there and a doji. Would you have gone long seeing this pattern mate?
Thanks
Nayan
It would take lots of guts to go long looking at that tiny hammer. I would not have. However after the 1st green candle, I may have initiated a long trade.
Thank you Karthik.
I have been surfing through charts after going though the whole module and I have noticed that especially on intraday charts you get to observe plenty of patterns through the day. Some of them give good results, some don\’t. With your experience trading the markets, how would you rate these candlestick patterns?
I read that you prefer the hammer over a hanging man. Likewise, which patterns would you consider the strongest and which would be second on your list.
Thanks
Nayan
Nayan- honestly speaking simple S&R levels work well for intraday…combine it with patters such as engulfing, piercing, hammer, and hanging man. Also just make sure that you know which pattern to use for which stocks. Remember not all patterns work for all stocks….for example Bullish engulfing may work well for ICICI but may not work on HDFC. So make sure you get this part right.
Sir,
As you said no sure method to know whethet the trade shall be possitive or negative. But we must look for odds by which we can have a positive trade.
Your method of teaching is very fine and one can understand it well.After learning from you about the candlesticks,we need to know those odds.you may be talking about the technical analysis which we should know about each commodity.Which is difficult for all commodities.We must concentrate on one or to technicaly analyse those.For this we need to know about the reasonable data.
So my questions
1. where to get the data about commodities
2And do we have a software which could calculate standard deviation or other factors taught by you.
3 if we know all this then possibly we could get a positive trade.
thanks, rest next
Usha you can contact Neo trade analytic for MCX data – http://www.neotradeanalytics.com/
The SD can be calculated using excel.
And i assume that these are technical analysis strategies that will good for any instruments. Any futures i mean, even commodities…
yup, thats right.
Mr. Karthik, how many of these candlestick patterns can be considered for intraday trading. i am more keen on that.
Almost all of it can be considered for intraday!
And for intraday whats the best Data interval to be used? 5, 15 mins or 30 min candles?
I prefer 15 mins.
In the material on DLF example on bullish engulfing pattern for risk taking trader you have mentioned:
One, the current market price at 3:20PM on P2 should be higher than P1’s close.
Shouldn\’t CMP at 3:20 be higher than P1\’s Open and not Close?
Oh yes, thanks for pointing it. Will makes the change.
Karthik, a Dark cloud cover? the volumes were lower than the average on the pattern formation day though . the stock did correct the next day with a doji. how would you have traded the DCC day?
This looks good Madhu, I would be tempted to set up a short trade on this – but the over all market seems to be positive. Hence shorting futures is ruled out. Hence I\’d be happy to buy the ATM Puts.
Sir, DId not get the logic here. Market is positive so trading in options better? If I see a pattern why shouldn\’t I short in Futures?
The risk reward of Futures and Options are very different. You have an unlimited risk in Futures, while in options the risk is limited. Hence people prefer options over futures.
sir how do i set a target for engulfing patterns?
One of the easiest ways to set targets is to identify the nearest resistance or support levels.
sir how should we select the shares trade in??
To begin with I would suggest you stick to Nifty 50 – they are liquid and easy to trade actively.
Karthik can the second last bearish candle be treated as a failed dark cover? or do you think the side ways trend negates it?
DCC requires a penetration of more than 50% which is missing here – btw, we are building a mini library of sorts here where some of these patterns are covered, check out – https://zerodha.com/expert-advisors/
appreciate the library. but, in the above chart do you think the trend was sideways before the DCC and hence the pattern should not have been considered?
Two reasons why I would be hesitant to initiate a trade –
1) After a good upmove, the stock was stuck in a range with low volumes – I would naturally tend to look for breakouts.
2) The preceding few candles were stuck in a range, so as you mentioned it is not very comforting. Hence I\’d tend to avoid.
Hi Karthik,
In a PIERCING pattern, the blue candle should be more than 50% but less than 100% of the previous red candle (it is a bullish sign)…..If the blue candle is 100% or more than 100% then it is BULLISH ENGULFING pattern. If the blue candle is less than 50% but within the red candle body, then it is a BULLISH HARAMI pattern…right?
So, is it safe to assume that a red candle followed by a blue candle in a down trend is bullish signal…provided…the blue candle is either fully covering the red candle (BULLISH ENGULFING) or the blue candle body is within the body size of the red candle (PIERCING or BULLISH HARAMI)
Same logic (in opposite way) for in an uptrend .
Thanks 4 ur time.
ROBIN.
Yup, the understanding seems to be right. But please do make sure the other variables confirm before taking the trade.
Hi Kartik,
What other variables we should consider ?
These are good for a start, Nikhil.
In the chart i have highlighted the Bullish engulfing pattern. The pattern formed after the formation of 5-6 candles downtrend. But the volume of the green candle is not sufficient. While considering the bullish engulfing pattern whether the first red candle volume to be considered or the second green?
The volumes should certainly be good for the 2nd green candle.
Also, in the chart you have posted I\’m not too convinced that the pattern is a bullish engulfing. My reasons –
1) The down trend before the pattern is not really convincing
2) The green candle should have opened below the red candle\’s close and then moved to a price point higher than the red candles\’s opening.
Karthik Sir…Which Chart are you discussing as i am not finding any chart here????
Also in many comments i saw people are discussing charts they have posted but i am not able to see any of those. Why is that????
The charts are all showing up, can you please refresh your browser and check once?
Sir i have tried everything like updating browser, tried other browsers also and finally even i switched to another device to see if problem is with my device but nothing worked for me.
Charts which you used for explanations are visible but rest on comments are not showing up at all.I cannot even see option to upload image.
Please Sir help me
Ah, not sure Vishal. Let me check this on multiple systems here.
Hi Karthick,
Same issue for me like Vishal Saini, I couldn\’t see any images in the comment area, neither an option to add an image. Tried Chrome/Mozilla latest versions .
Will get this checked soon. Thanks.
Actually, even I am not able to see the charts posted here, by other people.
Also could you guide as to how I can attach a chart in my query here?
Thanks a tonne.
People usually upload the pics on Gdrive and share the link here. That works.
Kindly click on the symbol which looks somewhat like a comma below the comment.
What are the differences between single and multiple candlestick patterns? And which one is more reliable? And how does bullish engulfing pattern differ from hammer ? And bearish engulfing pattern from hanging man?
All these things are already explained in chapters concerning candlesticks 🙂
Karhik, a bullish harami formed with strong volume near the support, RSI at oversold. Though the stock opened with a gap up the next day, it was a doji. followed by a bearish candle with low volume today. what do you make of it? how does one trade this?
I would be inclined to go long but since the markets are a bit weak I would not be comfortable trading futures or spot. I would instead trade slightly OTM call option here.
Hi Karthik,
I am going through all the modules once again. Could you please justify your above statement as to if market is weak going long on call is better option. How?
Thanks in advance
Weak markets implies low premium value for call options…in case your expect a market rebound, then buying calls makes sense.
Hi Karthik, I really appreciate your work and knowledge and most importantly yours sharing those knowledge to others :-).
My query is of today\’s DLF chart and want to confirm if the below DLF chart shows Bullish Engulfing or is there anything more to confirm the same. If its indeed bullish sign, so can i say it will atleast touch 150 in week or 2?
Thanks
Thank you, knowledge should be shared freely. Have you read this – http://zerodha.com/z-connect/queries/stock-and-fo-queries/introducing-varsity ? It talks about the philosophy behind Varsity.
Anyway, the pattern resemble a bullish harami rather than a bullish engulfing pattern. You also need to check the volume status before taking a call on the stock. I see a resistance at 145/- so 150 seems a bit challenging especially given the fact we are in weak markets.
Karthik, can the last candle be classified as a piercing pattern? it seems to be withing the support zone. is the volume substantial? the RSI is reversing from the oversold line too. compelling to go long?
Indeed, good luck, and be quick to book profits considering markets are a bit weak 🙂
Hi karthik.
If I\’m going short on day\’s end. Say 3:20pm. Will it get squared off by 3:30.
I\’ve been told that shorting is only possible in intra day trade and not in delivery ones.
Is that right?
Thats right. Hence all shorts (for overnight positions) should be in futures.
Hi Karthik
Really find this website interesting. I know learning TA and mastering it is not easy, but slowly getting there. Thanks for the material.
Karthik, could you please refer to the TCS chart here and confirm if it is a bullish engulfing?? I have my doubts because of the prior trend but would love a confirmation from you 🙂
Thanks
This is more of a volume play here – Increase in price with decline is volumes should be treated with caution. Check this – http://zerodha.com/varsity/chapter/volumes/
Good luck.
dear karthik sir…
How are you..?
I\’m rocking in market karthik sir… Here I\’m sending bearish engulfing pattern…..
I\’m really feeling fantastic karthik sir…I\’m funning with indicators, ta is increasing my knowledge in market…
with all my heart thank you karthik ji….very useful ta study material.
Sory, Monthly chart not weekly chart sir..
Glad to know this Girish. Good luck and I hope you find more success.
thank you karthik sir 🙂 …..
Can someone suggest me which provider is the right one to provide metastock platform???
Viratech Software provides Metastock data, I have personally used their services and they are quite reliable.
Thanx a lot Karthik Sir.
Most welcome!
Which provider is the right one to provide metastock platform???
Check out Viratech software, they are quite good.
Can someone suggest me Real Time Intraday Commodity Charts provider???
Check out Metastock.
Thanx a lot sir
Welcome!
Consider a Red candle with a prior downtrend,Now the next day a Blue candle appears which opens above the close of the red candle and closes above the high of the previous red candle with good volumes.Doesn\’t this blue candle shows strength of bulls throughout the day and warrants a long trade.I see this pattern a lot and more often than not it is successful.Thanks
This appears to be \’almost\’ like a bullish engulfing pattern, it certain seems to show strength. Although there is no name for this pattern (or at least I dont know) you can still treat this as it is a recognizable candlestick pattern (as you have tracked it over and over again). Please make sure other checklist items comply before you initiate the trade. Good luck.
DEAR SIR,
The situation decribed by the Katrikey Is it not like a Piercing Pattern??
It seems so I guess.
I did real trade also in Crude oil its giving good profit.
Thanks. Please remove my mobile no from my previous comment
Good luck!
Thanks for your support
almost my 75% investment i lost. After reading this i started with Engulfing pattern in commodities
Its working good when i did paper trad now i got the hope i can recover my losses
once again thanking you Karthick for your support
Very glad to know this, hope more success comes your way! Good luck.
Hi Karthik,
On the below chart for AuroPharma there was perfect bearish engulfing happened. Also you can see there was spinning top on third day, yet the stock has not fallen. What should i do when such situation arises.
Hi Rajesh, few thoughts on this trade –
1) Yes the stock has formed a good bearish engulfing pattern
2) The volumes seems to be good as well
3) The 3rd day spinning top looks encouraging
4) The last two green candles are on low volumes, which is again encouraging
5) The trade is still valid assuming you have initiated the trade after spotting the bearish engulfing pattern
If I were you I would hold on to it as the stoploss is still in tact (1375 as SL). Rememebr after initiating the trade you have to exit only when your SL is triggered or target is achieved…so just wait for the trade to evolve. According to me everything seems to be ok here. However, in case the trade goes against you, be prepared to cut your losses ard 1375. Good luck.
Hi Karthik,
you suggest to hold on to the trade. But since its a short, it would be squared off at the end of the day right? so, hewould be getting loss at the end of first candle., and cant do anything. Please correct me if i am wrong.
hi sir actually ididnt get the point 3,point 4 why r u saying that is encouraging?
Can you please requote the lines here? Thanks.
Sir,
Your chart is very fine as compare to other service provider.Please tell me about this.Thanks
Check out http://www.zerodha.com/pi
Ok,thanx a lot sir
Welcome!
Sir,
What is the 6 point trading checklist a trade should satisfy (at least 3 to 4 points out of 6) for it to be considered as a qualified trade. plz reply.
Here is the 6 point check like that – http://zerodha.com/varsity/chapter/dow-theory-part-2/. I would like to see at least 3 things out of these – recognizable candlestick pattern, S&R, and Volumes.
Dear Kartik
which pattern is this is a bullish engulf?
1 candle : O-149.80 H- 149.90 L-143.50 Close -144.40
2 O-144 H- 152.70 L-143 Close -151.90
Yes, this certainly looks like a bullish engulfing pattern.
Dear Kartik
which pattern is this is a hammer or piercing pattern?
It is not a piercing pattern as piercing pattern requires –
1) Alternate candles – Day 1 to be a black candle (bearish) and day 2 to be a white (bullish) candles
2) The bullish candle should recover at least 50% of the previous days losses
Both these conditions do not match, hence not a piercing pattern.
It looks more like a hammer – but then it would have been so much better if the opening of the pattern day was lower than the previous days low. However with some amount of flexibility you can consider this as a hammer.
Sir,Thanks for this wonderful series.
With regards to the above ,I feel it does not look like a hammer considering that the length of the wick is not even twice of the length of the body! Am I missing something?
Yes, for hammer the length of shadow should be at least twice the length of the real body.
Thanks for the Reply and for your support.
Most welcome 🙂
Hi Karthik Sir,
As you said, any pattern with doji formation will create a great opportunity,Please have a look on the attached chart and let me know my identification (Bullish Engulfing Pattern along with Doji on P3) is correct or not and also tell me what i need to follow if i want to take a long position on the same?
Regards,
SaikiranGarapati,
08148860968
Yes, I agree..but you should have initiated a long trade on the day of the doji formation. The chart pattern looks attractive though. Good luck.
Also please note – as per SEBI rules, I cannot advice on trade positions 🙂
Seriously, one cannot advice on trading positions as per SEBI guidelines!?
Then how do the people on business news channels advise the people to buy or sell some specific stocks!?
To that you need to be registered as an Investment Adviser or a Research Analyst. I suppose they have the required registration.
Hi Karthik,
Thanks in advance for your help and for these wonderful set of explanations.
also, because of your detailed level answering, learning has been on an additional pace.
So, I was checking on the TVS scrip after the doji formation and found that prices fell for next few sessions. Is it because the close of P2 and open of P3 had significant difference. If yes, is there a range?
Romi – It could be attributed to that. Also do remember there is a fundamental angle here – TVS is a Chennai based company and unfortunately because of the floods in Chennai both sales and production have taken a hit.
thanks Karthik.
The data I referred was actually for Mar\’15 and Apr\’15 but still I guess the angle u pointed out is also an important one for considering the trades in future. 🙂
Hi Karthik,
Thanks in advance for such initiative. also, with these Q&As, learning has been on an additional pace.
My query is on the above chart where a doji is formed. when I checked the historical prices, there was a fall for a few sessions post the pattern formation. Was it because the P3(Open) and P2(Close) had reasonable difference? If yes, what is the range?
Guess you were talking about TVS, have already posted to an answer to that.
Do you want me to tell you why your trade wasn\’t worked out ?
Thanks…
Dear Sir,
This is great and information is pretty much insightful. I was following Technical Analysis textbook, but what it lacks is real market experiences. Thank you for this.
And I have a query:
Given the range bound in intraday trading and using these technicalities, we have to do multiple trades. Don\’t you think making these many trades will be taken away by brokerage charges and other expenses. As a retail investor, can I have some suggestions?
Thank you.
Yes, in a range bound market trades can get a bit choppy. So one has to be quick to realize this. Also, if you are actively day trading then you have to ensure your costs are low. Make sure you are with a broker who not only charges you less broker but also less transaction charge.
Hi BNS,
Can you tell me Which Technical Text book you have?
Have quite a few, Steve Nison\’s book on candlesticks is one of the best.
Hi Karthik,
First of all, I thank you for this wonderful initiative . Is this a bearish engulfing pattern with presence of a doji?
Perfect. In fact its very enticing for a short 🙂
Dear Karthik Sir, today found presence of doji followed bearish engulf(chapter 8.4) in ASHOKLEY ,
many many thanks for your valuable support.
The chart looks ripe for a good trade ! Hope you have initiated a trade on it 🙂
Yes, I have done it .
Thanks.
In the 4th chart, before the bullish engulfing pattern, is there a failed bullish harami pattern after 5 consecutive red candles. Thanks in advance.
That\’s good spotting :). Yes, it seems to be a failed bullish harami pattern.
Hi,
Do you want me to tell you why your trade wasn’t worked out ?
Thanks…
Please do share your insights for everybodys benefit.
Hi Karthik, Thank you for clearing yesterday\’s query in previous chapter.
You have clearly explained about the stop loss limit that we need to put while following these patterns… what about the target… Could you please advise? Thank you.
In fact the chapter on Support & Resistance talks about setting targets. I would advice you to read through it sequentially, chapter by chapter to appreciate it fully.
Thank you for the immediate reply sir.. I am going in sequential order only…. So in the last few chapters, I have read about stop loss only.. so just got curious…. 🙂
Thank you verymuch Mr Karthi Rangappa . My Hearty Wishes for a happy and prosperous NEW YEAR to You and Your Family.
Regards
V.Manikame
Pondicherry.
Thanks Mani. Wishing you the same.
here p1 high=168 is less than p2 close =169 but p1 high is above p2 close in graph, also the lower shadow on p2 candle is missing.
Agreed, will look into this. Thanks for pointing this out 🙂
Hi Vishvendra,
Could you please name the company whose candlesticks you\’re describing?
Thanks.
Nice article Karthik!
So far so good! Thanks!
Glad you are liking them! Hope you like the rest of the material as well 🙂
Sir, which candlestick pattern is more convincing downtrend or uptrend assumption.
Both and it clearly depends on the opportunity 🙂
Hi Karthik
Can this Multiple candlestick be used in intraday also or they can be used only in 2 or 3 days basis as saw for Morning and evening star its mentioned for 3 days , means 3 candles for 3 days ?
Can very well be used on a intra day basis.
Thanks for the contents Karthik, it is wonderfull. Given that there are 1000\’s of listed stocks. How do we go about looking into these patterns in these stocks. Is it practically possible to scan each one of the stocks for these patterns?
Glad you liked the content Amit. The best way to start would be to look at opportunities in the Nifty 50 stocks, I have explained the rational behind this in this chapter – http://zerodha.com/varsity/chapter/finale-helping-get-started/
Hi Karthik
am i Right in Saying that in the Below Coalindia 3 Month Chart we have 2 Bearish Engulfing and 1 Bullish engulfing .
They are perfect.
Hi Karthik 🙂 ,
from Nitesh screenshot, First and Second didn\’t form an engulfing pattern due to prior trend. Am I correct?
but the third one did form a bearish engulfing pattern. Am I correct?
Thanks brother
With some flexibility you can consider them as engulfing 🙂
Hi Karthik
Can the Candlestick of axis bank be considered as Bullish engulfing on the daily chart .
The only thing not convincing about this is the prior trend, else everything is perfect.
Hello sir,
Can i call the circled one as a bullish engulfing pattern???
No Sir. Bullish Engulfing pattern needs a prior down trend and the 2nd candle should completely engulf the previous candle. Both these are missing. Hence I \’m afraid you can call this a bullish engulfing pattern.
Thanks sir. Do you mean the shadows of the bearish candle should also be engulfed??
The green body must completely engulf the previous red candle body. And as Sir said there must be a prior trend, here the stock is trading in a range.
Got that Charles. Thanks.. 🙂
Hi JAGADEESH
The Above Charts You have used is from a paid software or any free Site ? if yes can you please help me with the same . That will be of great help 🙂
Got From Screen Shot Ami Broker
Yeah. Its from amibroker Nitesh.
Hello Sir, if the bearish engulfing pattern appears at the bottom of downtrend in a stock at 52 Week lows, so can this be considered for more deepening of downtrend?
Tricky call, but I\’d be tempted to do so.
If there’s an engulfing pattern during the day and not at around 3.20 pm should we seize the opportunity to go long or wait ?
You need to wait, what if by the end of the day, the candle formed is something else?
Jagdish,
Which data provider you are using with your Amibroker and how much they charge
brain storming session..new things for me 🙂