
We have all learnt about averages in school, moving average is just an extension of that. Moving averages are trend indicators and are frequently used due to their simplicity and effectiveness. Before we learn moving averages, let us have a quick recap on how averages are calculated.

Assume 5 people are sitting on a nice sunny beach enjoying a nice chilled bottled beverage. The sun is so bright and nice that each one of them ends up drinking several bottles of the beverage. Assume the final count to be something like this:
| Sl No | Person | No of Bottles |
|---|---|---|
| 01 | A | 07 |
| 02 | B | 05 |
| 03 | C | 06 |
| 04 | D | 03 |
| 05 | E | 08 |
| Total # of bottles consumed | 29 | |
Assume a 6th person walks in to find out 29 bottles of beverages lying around them. He can quickly get a sense of ‘roughly’ how many bottles each of them consumed by dividing [the total number of bottles] by [total number of people].
In this case, it would be:
=29/5
=5.8 bottles per head.
So, the average, in this case, tells us roughly how many bottles each person had consumed. Obviously, there would be few of them who had consumed above and below the average. For example, Person E drank 8 bottles of beverage, which is way above the average of 5.8 bottles. Likewise, person D drank just 3 bottles of beverage, which is way below the average of 5.8 bottles. Therefore the average is just an estimate, and one cannot expect it to be accurate.
Extending the concept to stocks, here are the closing prices of ITC Limited for the last 5 trading sessions. The last 5-day average close would be calculated as follows:
| Date | Closing Price |
|---|---|
| 14/07/14 | 344.95 |
| 15/07/14 | 342.35 |
| 16/07/14 | 344.20 |
| 17/07/14 | 344.25 |
| 18/07/14 | 344.0 |
| Total | 1719.75 |
= 1719.75 / 5
= 343.95
Hence the average closing price of ITC over the last 5 trading sessions is 343.95.
13.1 – The ‘moving’ average (also called the simple moving average)
Consider a situation where you want to calculate the average closing price of Marico Limited for the latest 5 days. The data is as follows:
| Date | Closing Price |
|---|---|
| 21/07/14 | 239.2 |
| 22/07/14 | 240.6 |
| 23/07/14 | 241.8 |
| 24/07/14 | 242.8 |
| 25/07/14 | 247.9 |
| Total | 1212.3 |
= 1212.3/ 5
= 242.5
Hence the average closing price of Marico over the last 5 trading sessions is 242.5
Moving forward, the next day, i.e. 28th July (26th and 27th were Saturday and Sunday respectively) we have a new data point. This implies now the ‘new’ latest 5 days would be 22nd, 23rd, 24th, 25th and 28th. We will drop the data point belonging to the 21st as our objective is to calculate the latest 5-day average.
| Date | Closing Price |
|---|---|
| 22/07/14 | 240.6 |
| 23/07/14 | 241.8 |
| 24/07/14 | 242.8 |
| 25/07/14 | 247.9 |
| 28/07/14 | 250.2 |
| Total | 1223.3 |
= 1223.3/ 5
= 244.66
Hence the average closing price of Marico over the last 5 trading sessions is 244.66
As you can see, we have included the latest data (28th July) and discarded the oldest data (21st July) to calculate the 5-day average. On 29th, we would include 29th data and exclude 22nd data, on 30th, we would include 30th data point but eliminate 23rd data, so on.
We are essentially moving to the latest data point and discarding the oldest to calculate the latest 5-day average. Hence the name “moving” average!
In the above example, the calculation of the moving average is based on the closing prices. Sometimes, moving averages are also calculated using other parameters such as high, low, and open. However, the closing prices are used mostly by the traders and investors as it reflects the price at which the market finally settles down.
Moving averages can be calculated for any time frame, from minutes, hours to years. Any time frame can be selected from the charting software-based of your requirements.
For those of you familiar with excel, here is a screenshot of how moving averages are calculated on MS Excel. Notice how the cell reference moves in the average formula, eliminating the oldest to include the latest data points.
| Cell Ref | Date | Close Price | 5 Day Average | Average Formula |
|---|---|---|---|---|
| D3 | 1-Jan-14 | 1287.7 | ||
| D4 | 2-Jan-14 | 1279.25 | ||
| D5 | 3-Jan-14 | 1258.95 | ||
| D6 | 6-Jan-14 | 1249.7 | ||
| D7 | 7-Jan-14 | 1242.4 | ||
| D8 | 8-Jan-14 | 1268.75 | 1263.6 | =AVERAGE(D3:D7) |
| D9 | 9-Jan-14 | 1231.2 | 1259.81 | =AVERAGE(D4:D8) |
| D10 | 10-Jan-14 | 1201.75 | 1250.2 | =AVERAGE(D5:D9) |
| D11 | 13-Jan-14 | 1159.2 | 1238.76 | =AVERAGE(D6:D10) |
| D12 | 14-Jan-14 | 1157.25 | 1220.66 | =AVERAGE(D7:D11) |
| D13 | 15-Jan-14 | 1141.35 | 1203.63 | =AVERAGE(D8:D12) |
| D14 | 16-Jan-14 | 1152.5 | 1178.15 | =AVERAGE(D9:D13) |
| D15 | 17-Jan-14 | 1139.6 | 1162.41 | =AVERAGE(D10:D14) |
| D16 | 20-Jan-14 | 1140.6 | 1149.98 | =AVERAGE(D11:D15) |
| D17 | 21-Jan-14 | 1166.35 | 1146.26 | =AVERAGE(D12:D16) |
| D18 | 22-Jan-14 | 1165.4 | 1148.08 | =AVERAGE(D13:D17) |
| D19 | 23-Jan-14 | 1168.25 | 1152.89 | =AVERAGE(D14:D18) |
As it is evident, the moving average changes as and when the closing price changes. As calculated above, a moving average is called a ‘Simple Moving Average’ (SMA). Since we are calculating it as per the latest 5 days of data, it is called referred to as 5 Day SMA.
The averages for the 5 days (or it could be anything like 5, 10, 50, 100, 200 days) are then joined to form a smooth curving line known as the moving average line, and it continues to move as the time progresses.
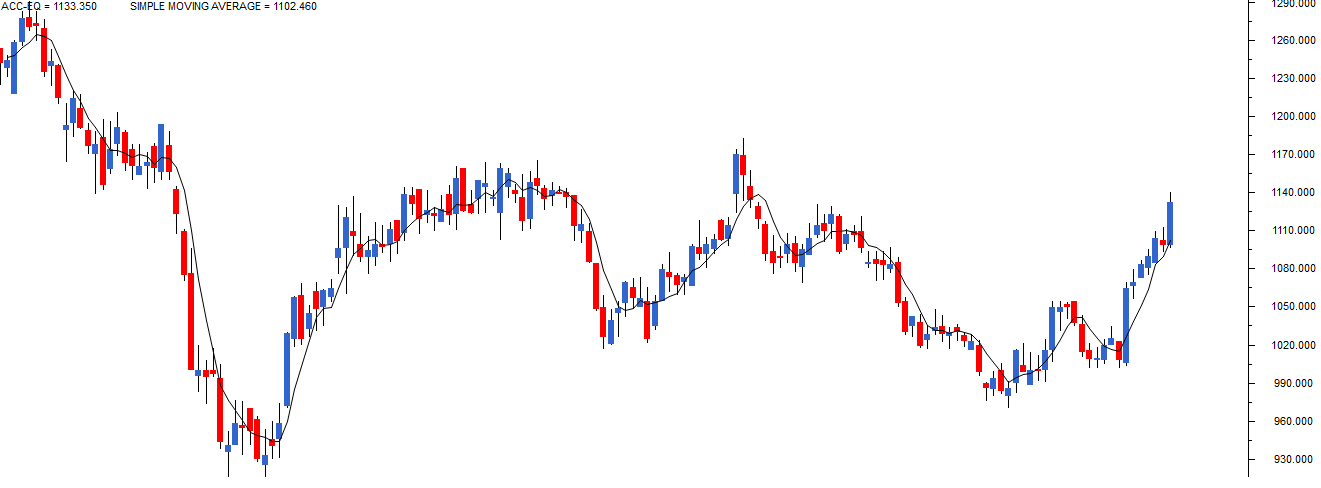
In the chart shown below, I have overlaid a 5 day SMA over ACC’s candlestick graph.
So what does a moving average indicator, and how does one use it? There are many moving average applications, and shortly I will introduce a simple trading system based on moving averages. But before that, let us learn about the Exponential Moving Average.
13.2 – The exponential moving average
Consider the data points used in this example,
| Date | Closing Price |
|---|---|
| 22/07/14 | 240.6 |
| 23/07/14 | 241.8 |
| 24/07/14 | 242.8 |
| 25/07/14 | 247.9 |
| 28/07/14 | 250.2 |
| Total | 1214.5 |
When one calculates the average across these numbers, there is an unstated assumption. We are essentially giving each data point equal importance. We are assuming that the data point on 22nd July is as important as the data point on 28th July. However, when it comes to markets, this may not always be true
Remember the basic assumption of technical analysis – markets discount everything. This means the latest price you see (on 28th July) discounts all the known and unknown information. This also implies the price on 28th is more sacred than the price on 25th.
One would like to assign weightage to data points based on the ‘newness’ of the data. Therefore the data point on 28th July gets the highest weightage, 25th July gets the next highest weightage, 24th July gets the 3rd highest, and so on.
By doing so, I have essentially scaled the data points according to its newness – the latest data point gets the maximum attention, and the oldest data point gets the least attention.
The average calculated on this scaled set of numbers gives us the Exponential Moving Average (EMA). I deliberately skipped the EMA calculation part, simply because most of the technical analysis software lets us drag and drop the EMA on prices. Hence we will focus on EMA’s application as opposed to its calculation.
Here is a chart of Cipla Ltd. I have plotted a 50 day SMA (black) and a 50 day EMA (red) on Cipla’s closing prices. Though both SMA and EMA are for a 50 day period, you can notice that the EMA is more reactive to the prices and sticks closer to the price.
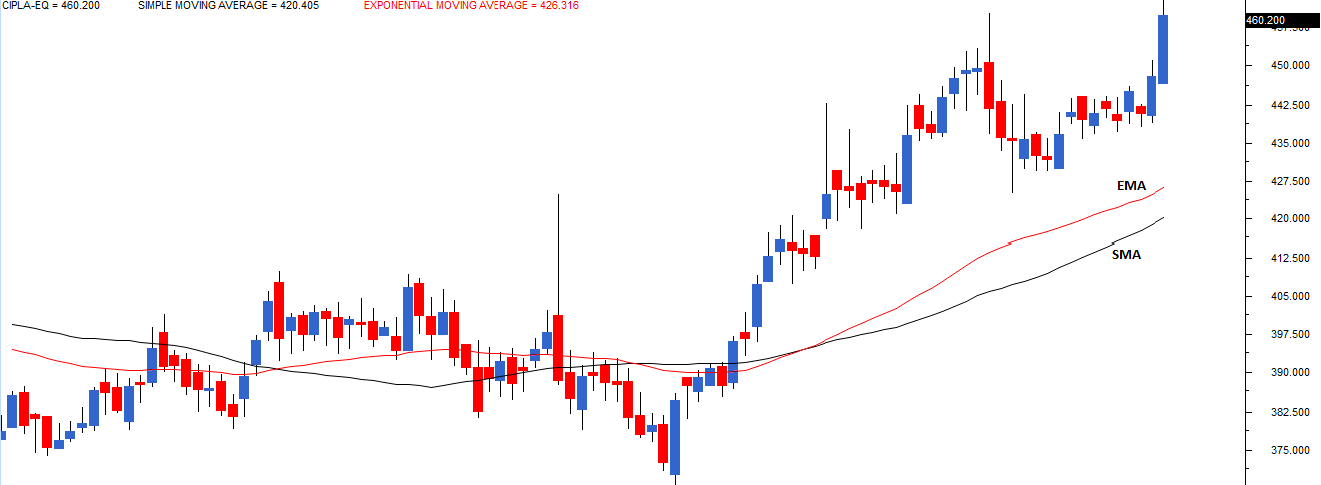
EMA is quicker to react to the current market price because EMA gives more importance to the most recent data points. This helps the trader to take quicker trading decisions. Hence, for this reason, traders prefer the use of the EMA over the SMA.
13.3 – A simple application of moving average
The moving average can be used to identify buying and selling opportunities with its own merit. When the stock price trades above its average price, it means the traders are willing to buy the stock at a price higher than its average price. This means the traders are optimistic about the stock price going higher. Therefore one should look at buying opportunities.
Likewise, when the stock price trades below its average price, it means the traders are willing to sell the stock at a price lesser than its average price. This means the traders are pessimistic about the stock price movement. Therefore one should look at selling opportunities.
We can develop a simple trading system based on these conclusions. A trading system can be defined as a set of rules that help you identify entry and exit points.
We will now try and define one such trading system based on a 50-day exponential moving average. Remember a good trading system gives you a signal to enter a trade and a signal to close out the trade. We can define the moving average trading system with the following rules:
Rule 1) Buy (go long) when the current market price turns greater than the 50 days EMA. Once you go long, you should stay invested till the necessary sell condition is satisfied.
Rule 2) Exit the long position (square off) when the current market price turns lesser than the 50 days EMA.
Here is a chart that shows the application of the trading system on Ambuja cement. The black line on the price chart is the 50-day exponential moving average.
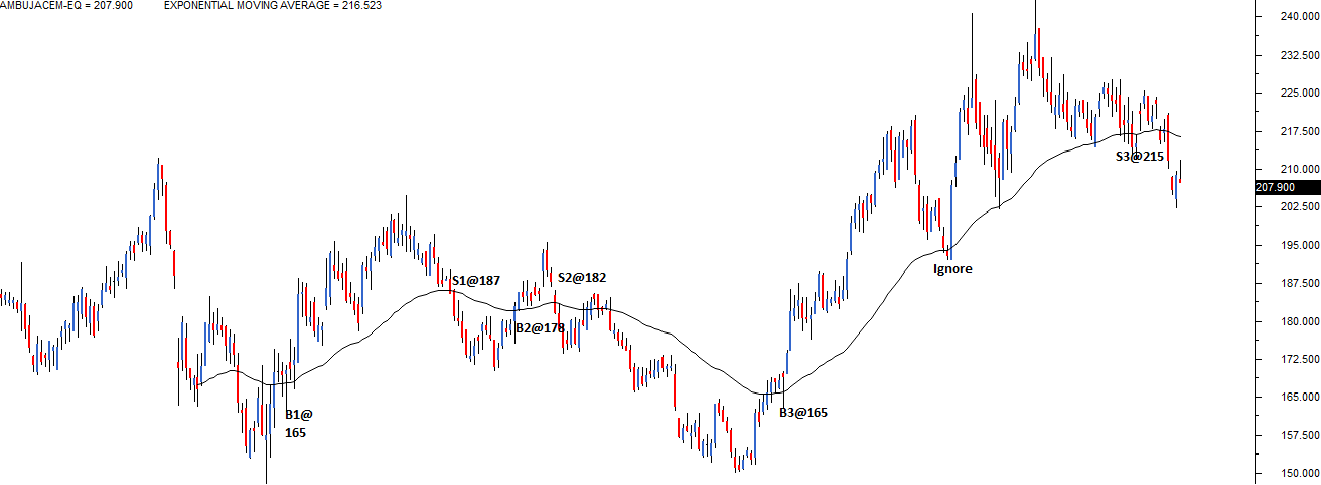
Starting from left, the first opportunity to buy originated at 165, highlighted on the charts as B1@165. Notice, at point B1, the stock price moved to a point higher than its 50 days EMA. Hence as per the trading system rule, we initiate a fresh long position.
We stay invested by the trading system till we get an exit signal, which we eventually got at 187, marked as S1@187. This trade generated a profit of Rs.22 per share.
The next signal to go long came at B2@178, followed by a signal to square off at S2@182. This trade was not as impressive as it resulted in a profit of just Rs.4. However, the last trade, B3@165, and S3@215 were quite impressive, resulting in a profit of Rs.50.
Here is a quick summary of these trades based on the trading system fared:
| Sl No | Buy Price | Sell Price | Gain/Loss | % Return |
|---|---|---|---|---|
| 01 | 165 | 187 | 22 | 13% |
| 02 | 178 | 182 | 04 | 2.2% |
| 03 | 165 | 215 | 50 | 30% |
From the above table, it is obvious that the first and last trades were profitable, but the 2nd trade was not so profitable. If you inspect why this happened, it is evident that the stock was trending during the 1st and the 3rd trade, but during the 2nd trade, the stock moved sideways.
This leads us to a significant conclusion about the moving averages. Moving averages works brilliantly when there is a trend and fails to perform when the stock moves sideways. This basically means the ‘Moving average’ in its simplest form is a trend following system.
From my own personal experience of trading based on moving averages, I have noticed a few important characteristics:
- Moving averages gives you many trading signals (buy and sell) during a sideways market. Most of these signals result in marginal profits, if not for losses
- However usually one of those many trades results in a massive rally (like the B3@165 trade) leading to impressive gains
- It would be tough to segregate the big winner from the many small trades
- Hence the trader should not be selective in terms of selecting signals that moving average system suggest. In fact, the trader should trade all the trades that the system suggests
- Remember the losses are minimized in a moving average system, but that 1 big trade is good enough to compensate for all the losses and can give you sufficient profits
- The profit-making trade ensures you are in the trend as long as the trend lasts. Sometimes even upto several months. For this reason, MA can be used as a proxy for identifying long term investment ideas
- The key to MA trading system is to take all the trades and not be judgmental about the signals being generated by the system.
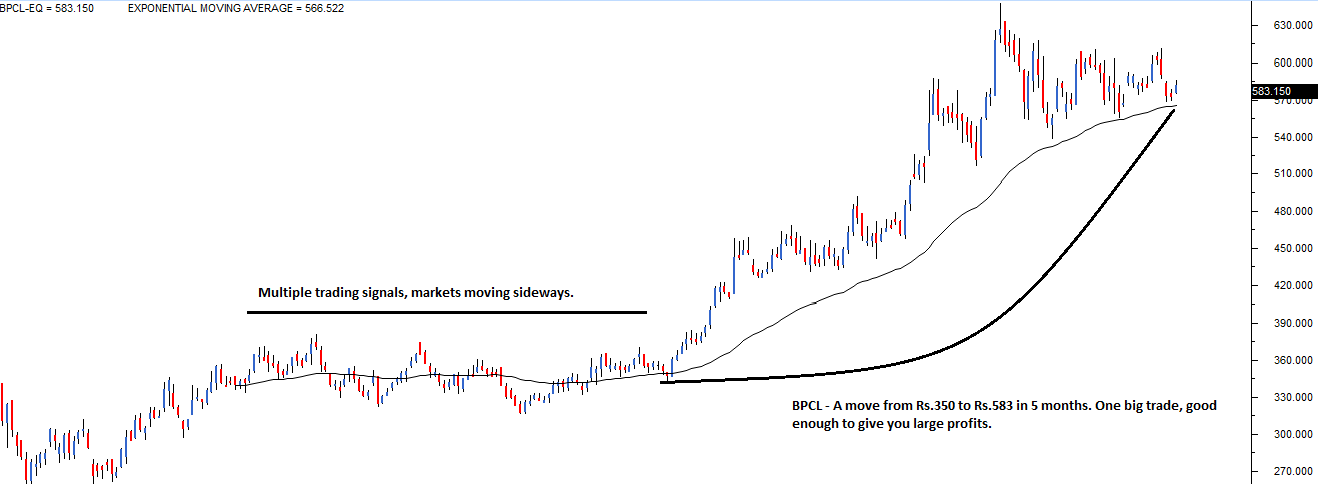
Here is another example of BPCL, where the MA system suggested multiple trades during the sideways market; however, none of them was really profitable. However, the last trade resulted in a 67% profit in about 5 months.
13.4 – Moving average crossover system
As its evident now the problem with the plain vanilla moving average system is that it generates far too many trading signals in a sideways market. A moving average crossover system is an improvisation over the plain vanilla moving average system. It helps the trader to take fewer trades in a sideways market.
Instead of the usual single moving average in a MA crossover system, the trader combines two moving averages. This is usually referred to as ‘smoothing’.
A typical example of this would be to combine a 50 day EMA, with a 100 day EMA. The shorter moving average (50 days in this case) is also referred to as the faster-moving average. The longer moving average (100 days moving average) is referred to as the slower moving average.
The shorter moving average takes a lesser number of data points to calculate the average, and hence it tends to stick closer to the current market price and therefore reacts more quickly. A longer moving average takes more data points to calculate the average, and hence it tends to stay away from the current market price. Hence the reactions are slower.
Here is the Bank of Baroda chart, showing you how the two moving averages stack up when loaded on a chart.
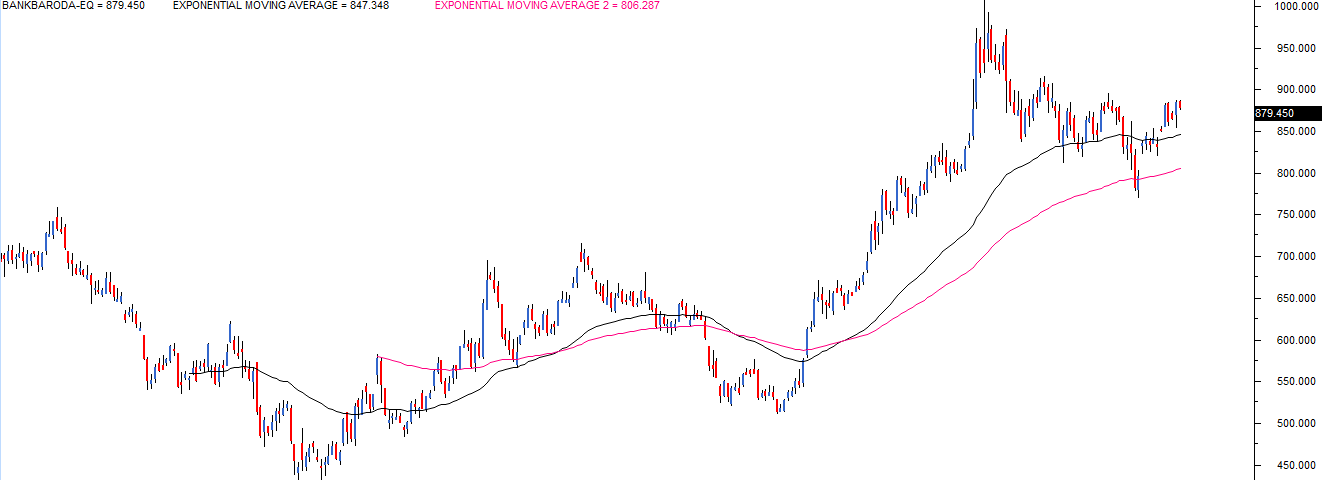
As you can see, the black 50 day EMA line is closer to the current market price (as it reacts faster) compared to the pink 100 days EMA (as it reacts slower).
Traders have modified the plain vanilla MA system with the crossover system to smoothen out the entry and exit points. The trader gets far fewer signals in the process, but the chances of the trade being profitable are quite high.
The entry and exit rules for the crossover system is as stated below:
Rule 1) – Buy (fresh long) when the short term moving averages turns greater than the long term moving average. Stay in the trade as long as this condition is satisfied
Rule 2) – Exit the long position (square off) when the short term moving average turns lesser than the longer-term moving average
Let us apply the MA crossover system to the same BPCL example that we looked at. For ease of comparison, I have reproduced the BPCL’s chart with a single 50 day MA.
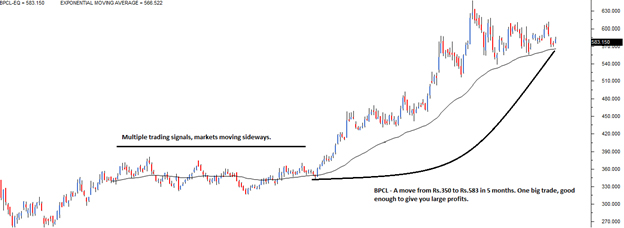
Notice, when the markets were moving sideways, MA suggested at least 3 trading signals. However, the 4th trade was the winner which resulted in 67% profit.
The chart shown below shows the application of a MA crossover system with 50 and 100 days EMA.
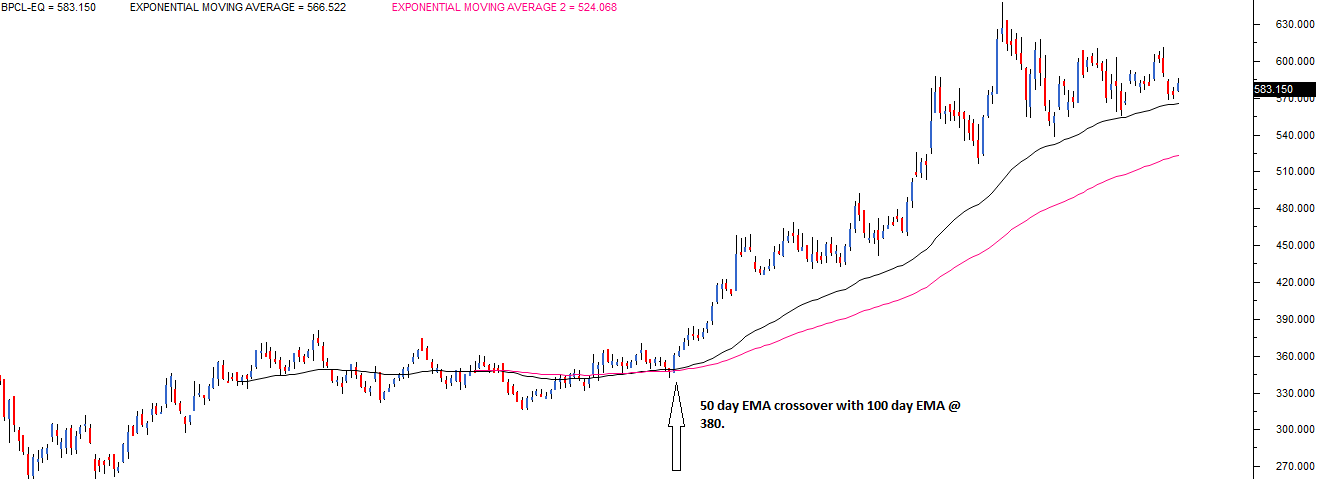
The black line plots the 50-day moving average and the pink line plots the 100-day moving average. As per the cross overrule, the signal to go long originates when the 50-day moving average (short term MA) crosses over the 100-day moving average (long term MA). The crossover point has been highlighted with an arrow. Please do notice how the crossover system keeps the trader away from the 3 unprofitable trades. This is the biggest advantage of a cross over system.
A trader can use any combination to create a MA cross over system. Some of the popular combinations for a swing trader would be:
- 9 day EMA with 21 days EMA – use this for short term trades ( upto few trading session)
- 25 day EMA with 50 days EMA – use this to identify medium-term trade (upto few weeks)
- 50 day EMA with 100 Day EMA – use this to identify trades that lasts upto few months
- 100 day EMA with 200 days EMA – use this to identify long term trades (investment opportunities), some of them can even last for over a year or more.
Remember, longer the time frame, the lesser the number of trading signals.
Here is an example of a 25 x 50 EMA crossover. Three trading signals qualify under the crossover rule.

Needless to say, the MA crossover system can also be applied for intraday trading. For instance, one could use the 15 x 30 minutes crossover to identify intraday opportunities. A more aggressive trader could use a 5 x 10-minute crossover.
You may have heard this popular saying in the markets – “The trend is your, friend”. Well, the moving averages help you identify this friend.
Remember, MA is a trend following system – as long as there is a trend, the moving averages work brilliantly. It does not matter which time frame you use or which cross over combination you use.
Key takeaways from this chapter
- A standard average calculation is a quick approximation of a series of numbers
- In an average calculation where the latest data is included, and the oldest is excluded called a Moving Average
- The simple moving average (SMA) gives equal weightage to all data points in the series
- An exponential moving average (EMA) scales the data according to its newness. Recent data gets the maximum weightage, and the oldest gets the least weightage
- For all practical purposes, use an EMA as opposed to SMA. This is because the EMA gives more weightage to the most recent data points
- The outlook is bullish when the current market price is greater than the EMA. The outlook turns bearish when the current market price turns lesser than the EMA
- In a non-trending market, moving averages may result in whipsaws, thereby causing frequent losses. To overcome this, an EMA crossover system is adopted
- In a typical crossover system, the price chart is overlaid with two EMAs. The shorter EMA is faster to react, while the longer EMA is slower to react
- The outlook turns bullish when the faster EMA crosses and is above the slower EMA. Hence one should look at buying the stock. The trade lasts upto a point where the faster EMA starts going below, the slower EMA
- The longer the time frame one chooses for a crossover system, the lesser the trading signals.
Sar my question is that if I want to use 50dayema with 100dayema what time frame should I use also can you please tell the best time frame for 9ema with 21ema , 25ema with 50ema
I\’d suggest you use EOD charts for this. Also, there is no such thing as best time frame 🙂
HI SIR..
i am learning the modules with whole interest and trying to imply it in the paper trading… but here there are more technical terms and other checklist tt i cant gasp with in the moment… so after learning for 2 weeks i have made a huge progress in the paper trading but still im afraid i might be left back for not fully understanding the technical terms… my question is… is it totally mandatory to learn all the technical terms and to satisfy the checklist… if so how do i do so.. knowing there r no short cuts.. i seek ur help sir
thank you
No it is not mandatory. Break down you learning process into small chunks, pick up one thing at a time and try to perfect it. Dont try to learn too many things in 1 go. This learning process will help.
ok sir thank you… is there any guide tt i can go through with and give me a road map
thank you si
r
Sorry, unable to understand guided tt means. Can you please give more context?
like sir i asked… if u could give me a detailed road map… or any guide which would help me out… and sir also have a doubt that… which platform would be good to implement first… stoke market or crypto?
thnk u sir..
Road map for what? I\’d suggest you go through the modules once.
Hi Sir,
What is the significance of numbers in EMA. Why only fixed numbers like 9, 21, 50, 100 why not the other numbers. Crossover of 9 & 21 is used why not 10 & 20.
You can use any number you want actually 🙂
hello sir , in chart iq variable moving average is calculated how?, can you give the formula
Please check the chartiq documentation for this 🙂
Hello Sir,
Can I use 9×21 cross over system for 75 min chart to identify short term opportunity.
Thanks
Yes, you can. Do backtest before taking it live.
Hello sir,
In 9×21 cross over, I made a simple strategy in chatgpt, it gives entry in sideways market also, and exit too late. How we can avoid this.
Regards
S D Prasad
You can always optimize it by suggesting all entries in sideways market should be avoided – define sideways market as stock trading within X% range over last n number of session.
Hi Karthik,
You mentioned EMA gives too many trading signals during whipsaws. For ex: I see that MP is above the EMA for that day and immediately the next day MP is below the EMA which is a loss making trade and there are too many scenarios like these. What\’s the purpose of single EMA then-Do we use it anywhere? because it\’s giving too many signals to buy and immediately asking to sell the next day if use EOD chart? I know you also said we have crossover to replace the single EMA. Please advise!
EMA stabilizes when momentum picks up, if EMA is moving so erratically, then there is no momentum, and you should not be trading basis EMA.
Ok, Thank you
Sure. Happy learning 🙂
Hi Karthik,
In Crossover- You said Go for long when Shorter timeframe is Greater than longer timeframe and Sell when Shorter is lesser than longer. My Question is: We are going to buy based on the current market price right?
If Shorter TF is > Longer and the candles are below it and I buy it. Similarly Shorters TF is < Longer and the candles are above it and I sell it. How am I going to make a profit out of it? Your DLF chart also has the same situation. Please share your thoughts and advise how to go about this!
Yes, you buy based on current market price. You are using the moving average as in indicator of where the prices are going in the near future.
1) What time frame is good for a intraday options trader? I guess 5 Minute?
2) what to use, SMA or EMA?
1) If its intrday, then yes, 5, 10, or 15 works. I prefer 10.
2) EMA.
Which EMA crossover is good for intraday equity and also which timeframe is good. Can you tell me i have a doubt on this?
Hi Karthik
In the first chart of Ambuja Cements, you marked one point as \”Ignore\” although the closing price went below the MA line once. Is it because of low volumes on that day?
Thanks
Regards
Kalyan
It is most likely since the close is not below the average. Please double check on that 🙂
OK thanks
sir
please look at the page no 103 and 104 I think there are some mistakes in charts provided and the theory as on page no 103 RULE 1 say (Buy fresh long when the short-term moving average turns greater than the long-term moving average. stays in the trade as long as this condition is satisfied)
but the charts provided contradict this statement as according to the charts we can earn profit only when the black line is greater than the shorter 50 days pink line and same happen in the chart on page no 104.
please correct me I misunderstood some thing
I\’ll check this Umesh. But please do check the main text on the website as well.
I do not get it when you say 15*30 minutes cross over for intraday. What does it exactly mean in terms of plotting it on chart. Usually we have 9*21 or 25*50 etc but how to plot one for 15*30 ? do i need to change the input to 5 and 30 but on which timeframe chart?
Yes, you need to change from to 15 and 30 minute chart. Make sure you are not looking at EOD chart.
What data point is used to calculate the moving average, be it MA or EMA or cross over?
Is it Closing prices average always?
Yeah, its the closing prices Priya.
sir can explain trend in detail i dont known what trend means?
Trend is the general direction in which a stock or index is moving.
Sir what is the resistance level when it is all time high
There is no resistance when the stock or Index is at an all time high. Likewise, there is no support when the stock is at an all time low.
So how can we check the sl and calculate target
You can use simple techniques of support and resistance to begin with.
You mean like Bollinger bands n Fibonacci techniques?
none as best resistance levels are the ones that are formed by the previous high zones.
since the stock is trading at all time high, you should trail your position and use 9 20 ema, if it gives a closing down on 20 ema, book the trade.
I don\’t understand Please elaborate
Why dont you share some context, will be happy to help 🙂
Dear Sir,
I have a friend who is using other platform for chart.
And I see he is using multiple days EMA in the same chart and drawing one single MA line.
It reads as EMA 10/20/50/100/200, on the chart.
Can you please help how can I draw that in Kite Platform.
Thank you
Seema, for this I\’d suggest you speak to out customer support desk. They will help you with it – https://www.youtube.com/@ZerodhaVarsityKannada
where can I find exponential moving averages. Not able to find in Kite
Its there in Kite, I\’d suggest you call the support for this and they will help you.
Sir as you told – 9 day EMA with 21 days EMA – use this for short term trades ( upto few trading session)
25 day EMA with 50 days EMA – use this to identify medium-term trade (upto few weeks)
50 day EMA with 100 Day EMA – use this to identify trades that lasts upto few months
100 day EMA with 200 days EMA upto few years
Sir My doubt is what time frame should we use for above EMA combination ??
YOu can use end of day charts for all, Pramod.
Thanks sir . It really help me .
Loves zerodha and team
Happy learning 🙂
The MA crossover system can also be applied for intraday trading. For instance, one could use the 15 x 30 minutes crossover to identify intraday opportunities. A more aggressive trader could use a 5 x 10-minute crossover.
Hi Karthik Sir,
Can you pls explain this.
Hi sir,
Can you suggest Time interval for 15X30 and 5X10.
Is it advisable to use 9X21 for Intraday 15 minutes Time Frame.
Yes, give it a try.
It just means that you can load the intrday chart of any stock or index you want to trade, it could be 10 or 15 mins chart. Once you do, you can you plot the MA over the chart and trade it as per the crossover.
what is the Time Frame want to use for EMA Crossover of 100 days EMA with 200 days EMA.
You can use EOD charts for this, that should work.
I\’m sorry, would you explain elaborate. I need some clarity of this one.
I mean, you can load daily charts for this.
Hi Karthik!
I want to start paper trading before I get into real trading. I haven\’t yet finished the modules, though. I am currently learning TA. Should I start simulation trading alongside, or should I first complete the modules and then get into it? What should be the right approach?
Read up as much as you can and then start the paper trading practice. This will be a better approch in my opinion.
Okay. Thanks for the guidance:)
Happy learning!
Hi,
I have one doubt, should we observe only EMA cross over for entry or EMA cross over and nearest resistance break both are required for entry. Pls clarify.
I\’d prefer both EMA crossover and the nearest resistance to get a signal.
best way to use both EMA and MA crossover as EMA crossover gave you initial signal and MA crossover gave you confirmation crossover signal .
Please do back test it thoroughly before you use it in markets 🙂
Is the WELLES WILDER MOVING AVERAGE AVAILABLE ON ZERODHA?
I guess so, I\’d request you to check both TradingQnA and ChartIQ for this 🙂
The entry and exit rules for the crossover system is as stated below:
Rule 1) – Buy (fresh long) when the short term moving averages turns greater than the long term moving average. Stay in the trade as long as this condition is satisfied
Rule 2) – Exit the long position (square off) when the short term moving average turns lesser than the longer-term moving average
and
The outlook turns bullish when the faster EMA crosses and is above the slower EMA. Hence one should look at buying the stock. The trade lasts upto a point where the faster EMA starts going below, the slower EMA
Are these both same ? if not how different are these , i am a bit confused between these statements the one above and the one below separated by and
Yes, essentially both these are similar moving average systems.
Faster EMA = Short term EMA
Slower EMA = Long term EMA
Can you please explain ROMA, COMA & TOMA in moving averages
Oh, I\’m not sure about this myself. Need to dig up a bit 🙂
ema 50,100 crossover with volume MA > 10/20 days , helps a lot to confirm big money or institutional money also has enter the trend . thanks
It is a general perception that any big volume is caused by institutional money.
Hi, Can we use MA crossover along with ADX to ensure the trend is strong and to avoid sideways movement? (say ADX> 25)
You can, please do back test is possible.
Hi Karthik,
Can I use 50/100EMA for ENTRY (to ensure tangible crossover) and 25/50EMA to EXIT (to cut losses early)? Is this recommended?
Of course, you can. Since its moving average, you can lay this over and check how it has performed historically and check for yourself before relying on it.
Hello,
Thank you for your notes
Can you please advice for 1 day candle which 2 EMA should be used??
Thank you
I\’d suggest 9×21 for short term, 100X200 for long term.
Hey Karthik,
what are the timeframes in which I should apply these EMAs??
I observed that for 1hr timeframe chart the crossovers are different from 1 day timeframe charts
Yes, the timeframes vary based on the data points you load. Generally speaking, shorter time frames mean a higher number of signals.
Hi Karthik,
For looking at daily candlestick charts, I should look at 9 EMA and 21 EMA crossover right?
Also, if I am looking at charts with 1 hour candlesticks, which two EMAs will you recommend to use?
Thank you.
You look at 9 and 21 only if you are interested in figuring the crossover. Otherwise, you can check the CS without the 9×21 as well. Even for 1 hr, you can stick to the same 9×21.
hello,
i have a clarification lets say we are using a 50, 150, 200 days moving average what will be their corresponding MA on a Weekly and Monthly.
ie
50 days MA will it be a 10 Week MA when i need to see on a weekly chart
150 days MA as 30 Week MA
200 Days MA as 40. is my understanding correct.
Can you clarify the numbers and also share for the monthly MA. or guide on what will be the best MA for weekly and monthly.
It will be as is, meaning –
If you load 50 MA on a weekly chart, then it will correspond to 50 week chart. Likewise, if you load 50 MA on monthly chart, then it will correspond to 50 monthly chart.
Thank you. Are there such established methodologies for taking contra positions as well? Something like a tutorial or a list of such methodologies.
Ah, not really, these are views you develop from your own observations in the markets.
Please let me know of how many days\’EMA I should use- 20 & 50 days; 20 & 100 days, 10 & 100 days, or 20 & 200 days for mid-term and long-term trading.
If its short term, then maybe 20×50 EMA will work, else stick to 100 and 200.
First of all, thanks for the wonderful tutorial.
Have a question regarding an EMA. Converse to what you said in the chapter, when the current price is below the EMA, can\’t we think that the stock which has historically shown the potential to move at the EMA is actually available at a discounted price and will soon reach its potential i.e. the EMA. Hence, instead of selling at that point, why not buy & stay long.
I have completely understood your point about identifying & capitalizing on trends. But, can the above thought be considered as well? If not, why? Apologies if this sounds like a stupid question. Just a learner\’s mind at play here.
Mausam, of course you can do that if you are coming from a contra position perspective. But if you are someone who likes to follow the trend, then you have to stick to what the EMA and price are suggesting you to do 🙂
Can we use 50 day ema and 200 ema crossover on daily chart. I backtested it and result is pretty amazing . From 15 backtest i got 12 positive result.
Of course, you can use, moreso since you\’ve back tested it.
Sir if I use 9×21 days EMA .
WHAT time frame would be appropriate for it.
And what for 25×50 days EMA??
You can use EOD charts for both Nadeem.
Thanks for learning Sessions, very much appreciated !
How can I select the EMA in kite, I can only see moving average ?
I\’d suggest you call the support desk for this, it will be easy to explain over call.
Sir,
You taught complex topics in much simple and lucid way & Most importantly it\’s almost 10yrs, you\’re clearing everyone\’s doubt regarding the topic till now.That makes you special…
Sabki Dua apke sath hain..
Thanks so much for the very kind words 🙂
extremely helpful
Happy learning!
Hello,
Please illustrate the method of calculation of EMA with an example.
Thanks
Shreyas
Shreyas, you can look up the EMA working description in ChartIQ or Tradingview notes, they would have given this anyway.
There is too many stocks, How can I find a suitable stock to trade? I can\’t check all stocks graph to find the pattern and apply technical analysis. How can I choose a stock and then apply technical analysis on it\’s graph?
So you start with a small set of stocks that you can track regularly to find opportunities. Maybe Nifty 50?
CAN I KNOW HOW HULL MOVING AVERAGE IS CALCULATED ON AN XL SHEET WITH REFERENCE TO NIFTY EOD DATA.
PLEASE LET ME KNOW WITH AN EXAMPLE ON AN XL SPREAD SHEET.
REGARDS.
THANK YOU.
ID DS 4465.
Ah, we dont have that for now. Will probably add a note sometime soon.
Can you please elaborate?
Please check my previous comment.
Can we analyse the chat with EMA and volume together?
Ex- if the volume of a stock shows increasing and the price is decreasing so there must be a chance of short sell. And as per EMA chart shorter is higher than faster chance of move upward. Then how we can conclude whether initiate the stock to buy or sell?
Yes, you can overlay the volume chart with EMA instead of SMA.
informative material on zerodha varsity, all you presenters are excellent teachers, thank you very much.
Thanks, Anisha. Happy learning 🙂
All the examples you had given for moving averages were for taking a long position only, can you take a short position also using moving averages? In that case how to use it for intra day opportunities?
Yes, of course you can.
Hi, Karthik Brother
Previously (in the chapters) we were preparing the Checklist with
1. Candlestick Pattern
2. S&R
3. Volume
I want to ask that Is this Chapter (Moving Averages) related to previous one?
Can we merge this in the checklist to make a better trading setup OR
Can I use this as the only Tool to Trade, without considering other tools (like tools of Checklist).
Because in this chapter I haven\’t find any use of previous knowledge of Like S&R, Candlestick Pattern, Volume, etc.
Hopefully I am able to Tell you what I want to ask.
Waiting for you Reply.
Yes, please consider TA as a whole, but that said, you can use MA as a separate system.
Hello Karthik!
What MA crossover do you suggest for 15-minute, daily, and weekly charts?
You can start with 9×21 and see if that works for you. You can tweek it as you gain more experience trading with MA.
Hi Karthik,
Needless to say, the MA crossover system can also be applied for intraday trading. For instance, one could use the 15 x 30 minutes crossover to identify intraday opportunities. A more aggressive trader could use a 5 x 10-minute crossover.
the above lines from chapter i have a doubt,
15*30 minutes means 15 min timeframe and 30 days EMA or MA ??
In this case, 15*30 both refer to the same period. Either day or mins, but they cant be two different timeframes. Also, its all EMA, not MA.
Hi Karthik,
As mentioned one has to enter fresh trade once short ema crosses over longer ema. So, how to setup alert or gtt for this?
Because as far as I know, by seeing shorter ema crossing longer ema I enter trade but how to set target at high and also Stop loss at point of shorter ema crossing down longer ema to avoid loss, In SL only price can be defined but not ema conditions?
Ah, you can probably check streak.tech for this. They can help you set up price alerts.
Karthik Sir, Your point about the \”end of the day\” is unclear to me. As far as I can see, you would advise utilizing longer period MA, such as 100 or 200 day MA, for sideways markets with shorter time frames.
Thanks,
Yes, I\’d suggest long time periods laid over the end of day charts.
Hi karthik sir,
Thank you for making such great videos and resources available on Varsity.
Question:
Can I utilize the intraday 5/10/15 minute period with the triple exponential moving average (10EMA, 20EMA, and 50EMA)?
I am aware that in sideways markets, moving averages are less helpful. Would you kindly offer some guidance on how to effectively utilize moving averages in sideways market, or please suggest any other tools?
Thanks,
You can, but then it will lead to many choppy signals. I\’d suggest you use MA or any MA based systems with slightly longer term data…like at least end of day data.
9 day EMA with 21 days EMA – use this for short term trades ( upto few trading session)
25 day EMA with 50 days EMA – use this to identify medium-term trade (upto few weeks)
50 day EMA with 100 Day EMA – use this to identify trades that lasts upto few months
100 day EMA with 200 days EMA ……………
Sir, I have some doubts …please suggest candle time frame for above mentioned EMA days..
9×21 for intrday/swing positions, 50×100 for shorter term, and 100×200 for few months.
Thanks Karthik. The video was helpful.
However, just wanted clarify that in such trades you cannot have a fixed stoploss or target and it will only depend on when the crossover happens. Hope my understanding is correct
Yes, thats right. The targets are moving based on the averages.
Hi Karthik,
Thanks for the entire set of modules you have curated.
In the above examples you have shown with the EMA cross over, I am not sure of the entry and exit points in each. So when the the faster moving EMA is higher than the slower EMA then what time and price should one enter and what should be the stoploss in the trade?
When the faster Ema crosses over and above the slower EMA the price can be quite high for a long trade and when it goes under the slower EMA the price could actually be very low, which could be quite a loss for the trader.
So can you please explain the trade setup with EMA and EMA crossover
Thanks Kunal. The idea is to buy as soon as the cross over happens and hold the trade till the crossover stays intact. You exit the trade if the crossover fails and the moving averages does the crossover again 🙂
You can check this video – https://www.youtube.com/watch?v=810jmf7drFw&list=PLX2SHiKfualH_xMbGM-3zWC47s9gUjGR_&index=10
Hi Kartik,
In the video example of Voltas, the entry is at 625 on 08 Mar 2019, and the exit is at 594 on 17 Mar 2020. In this case, after holding for that long, the trade ended in a loss. Please advise if I understand it correctly. What other strategy should be used to end this trade at a profit.
Yes, what results in a profit is the way the stock moves after you initiate the trade, which unfortunately is not in anyone hands.
Hi,
When you say 15 min X 30 Min, do you mean 15 and 30 periods ? The time frame can be 5 min, 30 mins, 1 hour etc. Moving average is of Periods we used in the timeframe. There is no option of using min or hours or day on Moving average settings, the length used is number of Periods. I hope I am right.
You can mix and match any combination of moving averages, Nipun. I\’d suggest you call the support desk, they will be happy to explain the settings for the moving averages.
Hey first of all i appreciate what you are doing. This is amazing.
A small suggestion – In the end you guys should also include how to use zerodha kite and all it\’s features.
Thanks Lakshay, the idea is to purely educate. Some may have kite, some may have other broking app, so it does not seem fair to explain thing just for Kite users 🙂
Karthik, the amount of time you have invested for crafting these intuitive and informative modules is worth mentioning, priceless and ineffable. Thank you and the Zerodha\’s founders \”The Kamath\” brothers very much for all the modules and for the beautiful idea to not just provide a platform for trading but also for educating the new comers like me.
Thanks for letting me know Sohail. I\’m really glad you liked the contents on Varsity. Happy learning!
Hi Karthik,
While using MA on intraday trade, how do we deside on stop-loss
For intraday you\’d anyway be using a short term MA, so you can use that itself to suggest a SL price.
Karthik sir this question is very immature I know but I don\’t know any other place to ask this question. I\’ve read you book of fundamental analysis many times but I never paisa much attention to technical analysis and even tho I have good fundamentally sound companies in my portfolio I don\’t see much return. So I feel I need to pay some attention to technical analysis also. Recently some people suggested me few books which I read one of them is How to make money in stocks by William O Neil in that I saw few charts I am trying to replicate same in trading views but my knowledge with trading view is very primitive I don\’t even know the terminology. What should be my starting point? Never the less my question is how to add 10 week moving average in TV? Is 10 week MA same as 50 day MA? What does length mean is it days or week?
Length or frequency is in terms of number of days, unless you are looking at an intraday chart.
10week MA is good amount time to consider, you are unlikely to get any erratic movement in this Mohit. Here is how I\’d suggest you start – learn one small TA technique and try to implement it in the market. Do it till you are comfortable with it. Once you are comfortable, move ahead to the next concept and repeat.
In 13.3 chart 1, price has touched the average line between b3 and s3 thrice, why that is not considered as exit? (Of course the price rised after that)?
One of the ways to look for this is to ensure the price movement is on closing basis and not intraday, Anil.
Hi Karthik,
Amazing content and extremely comprehensive.
Is it fair to say that EMA/MA is more suited for long term investments rather than for options.
Thanks!!
Arun, EMA or Moving averages in general are quite versatile. They can be used from both active trading and long term investments.
Hi,
what is the function of offset option that we see while setting the MA ?
Its a smoothing factor.
Okay, then I think this question should be asked from Tradingview. Thanks for your help Karthik.
Cheers, and good luck Ankit.
Hi Karthik,
I tried this link math, but it doesn\’t give same value which we get from Kite Tradingview EMA indicator. When try to get larger period EMA, then sometimes the difference is upto 2.5 rs. as well. Could you please check again the actual math being used in kite and share?
We dont do any charting math, Ankit. We use the charting engine as is from the provider.
But we can not access any indicator values using kite connect api or historical api, we can just access OHLC and volume data. So we have to create our own indicators using calculations. And I couldn\’t find right calculation on internet which can give us the same value that kite chart platform emi indicator gives.
Ah, got it. So one of the easiest way to figure out the math is to look for documentation from the charting engine. Check this – https://documentation.chartiq.com/tutorial-Using%20and%20Customizing%20Studies%20-%20Definitions.html
Could you please describe EMA Calculation? it will be helpful in aligning algo trading correct ema calculation with kite ema calculation.
The calculation is a bit complex and you dont really need that as most platforms provide you with the EMA directly.
sir,
please could you tell me my doubts? in general, all one knows that the above 50-day moving average is good for trading which is why retail traders buy stock above 50 ema. then how is stock bullish in below 50 days EMA?
all are smart money BUYING or including retail traders?
That is an indicator of bullishness picking up. No guarantee 🙂
When can i enter the trade if crossover has already happened and the fast MA has already moved far from slow MA?
It depends on how far away the prices have moved from the crossover price. If the divergence between current market price and the crossover price is high, then wait for retraction and time your entry accordingly.
Hi Mr Karthik,
Thanks for this valuable knowledge, with due respect you are doing a great job by giving such knowledge, thanks to Zerodha\’s all members,
can you pls tell me more about the term \”15 x 30 minutes crossover\”, I didn\’t get it. are u saying that 15 and 30 are EMA? or do you mean something else?
Thanks
Thanks Ajay. 15×30 means the crossover between 15 and 30 period averages. These can be simple averages of exponential moving averages.
Hey Karthik, I see this is very old article. Are these concepts still valid in today\’s economic conditions?
Can you please also suggest how to test these theories before actually doing active trading? Is there any terminal where we can try out these charts and averages?
Lastly, lot of thanks for making these blogs. It must have been a hard work. I started investing after reading personal finance modules about mutual fund.
These are core concepts and dont really change with time 🙂 I\’d suggest you try both the charting engines on Kite.
hi,
can you give a clarity which ema combination would be suitable at which timeframe
for eg: 25 day x 50 day ema is good for only daily charts for can be used on hourly charts as well?
same goes for rest of ema combinations..
I personally prefer 50, 100, and maybe 200 day EMA.
Why in EMA example of Ambuja Cements, when CMP touches 50 days EMA @190, trade is not exited from?
I supposed it was ignores since it was not a conclusive break of the moving average line.
only for buying…. not for short
Intraday Trading Me konsa moving average use kar skte hai
Isme 20 EMA ki strategy Ke bareme nhi bataya Aisa q
Why 200 day Ema is not showing in chart of stocks? I have checked with many stocks n even if it shows ,it is for small time.
Arpita, it is working for me. Can you call the support desk for this? They will explain in detail.
how to calculate ema ?
You can check the ChartIQ documentation on this, Kamalesh.
Great work
Happy learning.
Hi Sir,
why cant Zerodha to provide the adaptive moving average Indicator? Isnt this helpful ?
I could not fine \”Moving Average Exponential\” under the drop down table of \”Studies\”. Has the name been changed in Kite?
No, not at all. Why dont you call the support desk for this? They will help you with this.
Hi Karthik,
How we determine the SL for the trades, because if we apply moving average, i feel we have to go with a minimum of 20-30 points SL otherwise we cannot pick bigger targets, but if the market are not in trending zone then good chance that we will get SL hits continuously.
One of the better ways to set a stop loss is by looking at the Volatility of the stock. Please do check this where I\’ve discussed the topic – https://zerodha.com/varsity/chapter/volatility-applications/
Hi Karthik
In zerodha kite how do we set ema period in minutes?
Please call the support desk for this.
Dear karthik sir ,
I have been following your articles on the moving average crossover system and find them very insightful. I have been using a trading system based on the two EMA crossover for Nifty and Bank Nifty options, trading deep in the money options on Wednesdays and Thursdays. I have prior experience in intraday trading and scalping.
My trading system involves using the 9 and 26 EMA numbers and a 3-minute chart. I set a fixed stop loss below the crossover price and set a target based on a risk-to-reward ratio. I am curious to know your thoughts on this approach and how it compares to the traditional moving average crossover system. I am particularly interested in understanding how options trading and a fixed stop loss affect the profitability and risk management of the strategy.
Any insights you could provide would be greatly appreciated. Thank you for your time and expertise.
Manish, this is good…any cross over system is good in terms of helping you catch a trend. My only suggestion, increase the frequency from 3 mins to more…at least 10 or 15 mins. Since this is for intraday, its best done with equity spot or futures. Not options i think.
can we get code or any details for VIDYA Moving Average
I guess you will have to look it up online 🙂
Hi Karthik Sir
please ignore Heikin Ashi question. Found it.
Please review & advise on 10EMA trendline question
Thanks
Done 🙂
Hi Karthik Sir
(1)similar to SMA study, where we can check the SMA line to monitor price w.r.t SMA line
do we have a 10EMA line to view on our charts in Zerodha?
(2) Also, has Zerodha removed Heikin Ashi study?
Request advise
Thanks
1) You will have to plot multiple SMA to get a reference
2) Nope
Hi Team
Which study should I chose to select 10EMA? I only need the 10EMA line
Thanks & Regards
10 EMA is very specific study in itself. Not sure if I understand your query fully.
How can I apply 15×30 min/5×10 min crossover? I didn\’t understand.
Its the same way you\’d drag and drop the moving avg indicator.
Can you please explain in Detail about the offset setting which is available.
Hello,
I have a question: For a trade for 3-5 days, I can choose 9 days EMA and 21 days EMA as given in above chapter. Just wanted to know what will be the time frame we should use, Is it 1h, 2h, 4h or 1 day. I was littler confused in this.
Thank you in advance.
You can use EOD time frame only, Binny.
sir what should i find in stock that can be help for swing trade if i want to trade xyz stock for swing trade so how can i find the stock and when i take entry and exit, pls help me
Shoban, the main thing thats required for a swing trade is momentum. Look for stocks which are moving above short term averages to get a sense of momentum.
WILL ZERODHA PROVIDE HULL MOVING AVERAGE IN THEIR PLATFORM KITE ?
Not sure about that.
Which MA cross over should be used for intraday index trading? You have not covered this point.
YOu can sart with 9×21 and experiment with it. Change to either longer or short averages if need be.
Why such EMA\’s will taking to treding like 5, 9, 20, 50, 100.
Why can not take like this EMA\’s 3, 7, 13, 35 ??
ROund figures like 50,100, 200 etc are looked up by people more often, hence these are popular averages 🙂
But you can check whatever average you\’d want.
Hi Sir..Is moving average indicator works only for long trades…which means works only in uptrend? or we can use it for short selling also?
You can use it for both trends, Babu.
somehow it looks like trading with candle and MA is better than smoothing method because in the first we are at least timing it via candles but in latter part though the hit rate is high but most of the profits are being eaten just by waiting for the crossover to happen. what do you think karthik?
Yeah, end of the day, you just have to mix and match a few things to figure the techniques which work for you 🙂
Hi Kartik,
Can you please confirm my previous comment? Should the MA crossover be 2 and 4 points?
Sorry missed that. Since this is an intraday trade you are talking about, yeah something like 5 points should be good enough. The only problem is that with intrday, whipsaws could be high and you can get stopped out easily.
Dear Kartik,
When you say that one could use the 15 x 30 minutes crossover to identify intraday opportunities, do you mean that MA crossover should be 2 and 4 points?
Thank you
Thanks sir,
I am quoting few lines from volume chapter
\”As a practice, traders usually compare today’s volume over the average of the last 10 days volume. Generally, the rule of thumb is as follows:
High Volume = Today’s volume > last 10 days average volume
Low Volume = Today’s volume < last 10 days average volume
Average Volume = Today’s volume = last 10 days average volume
To get the last 10-day average, all you need to do is draw a moving average line on the volume bars, and the job is done."**
So if I put 10 days in period box of moving average , even though line extent to many many bars, the line will give last 10 days average volume.
That\’s correct. The latest value of the moving average is the average of the last 10 days.
Yes sir, I have called them but they said its not possible to draw SMA line over only 10 volume bar. I am sharing ticket number once again. #20230104472280
#20230103132877
That\’s right, you can draw only for 10 bars. It will be a moving average. By the way, it is of no use to draw SMA over 10 bars, it has to be a moving average, because the number change daily.
Hello sir,
Not able to draw SMA line on volume bar for 10 days ONLY
Roshan, I\’d suggest you call the support desk for this. They will help you with this.
Hi Karthik,
If i keep 200 period MA in the chart, How will i come to know that the stock has gone above or below 200 period MA?
You see the current market price and compare it to the 200 MA value. If the current market price is higher, then its gone up, else its below the 200 ema.
1. Yes Sir, ONLY last 10 days avg volume
2. #20230104472280
#20230103132877
Sure, getting this checked.
1. Then what is usefulness of rolling over avg line. As it won\’t serve purpose if I want to calculate 10 days only volume avg.
2. Yesterday, i did the same, In response, they have transferred call to senior advicer and senior advicer requested time to resolve this issue. Currently query is \’\’under processing status\”
1) The latest value of the 10 – average value on the volume bar is the 10-day average, right?
2) Can you share the ticket number with me?
Thanks sir
1. What is meaning of rolling line ?
2. How to plot the line If I want to calculate avg volume of last 10 days only
1) A continuous average line…it could be last 10 day, 50 days, or whatever.
2) It will be easy to explain over the phone. Why don\’t you call the support desk about this, they will help you.
Hello sir,
I want to put moving average line on volume bar for period of last 10 days. To know above average volume in last 10 days. On kite I have open function – moving average – period (10 ) – filed (volume ) – type (simple). Ideally the moving average line should be on only last 10 days volume charge. But that line extend to many many volume bars. Plz suggest. Thanks in advance.
When you plot a moving avg, the line will be on all bars. It is a rolling 10-day line and not just for the last ten days.
For instance, one could use the 15 x 30 minutes crossover to identify intraday opportunities. A more aggressive trader could use a 5 x 10-minute crossover.
what i understand from the above line is–
mostly i use 5 mins time frame chart in intraday, so if i want to use 15*30 minutes Crossover method in 5 mins time frame, firstly i have to take length as 15(i.e.,avg of last 15 five minutes candlesticks closing prices),then plot the line. Next,take length as 30(i.e.,avg of last 30 five minutes candlesticks closing prices),nd plot the line.
Now i have to check where the cross where happened to see proper trading opportunities.
is my understanding right ? correct me if i m wrong sir?
Yes, Shiva. You need to check for the crossover to initiate a trade.
can u please explain how to draw 15mins*30mins crossover on the chart
Shiva, you just have to drop the averages on the price chart. I\’d suggest you call support desk, they will be happy to explain.
Thank you Karthik , for the Clarification.
Regards,
Manjunath
Sure, happy learning 🙂
Dear Karthik,
Thank you for this kind of comprehensive tutorial on Trading Process . the way you explain the critical concepts , is really good and easy to understand.
after searching many indicators i felt RSI and EMA is better stragey for Intraday trades.
Please can you clarify, out of the below 2 combination which is better.
Time frame – 5 mins.
RSI ( 14 ) / EMA 9
RSI (14) /EMA 21
Thanks,
Manjunath
Thanks, Manjunath. Glad you liked the content. Both combinations will give you similar results.
Hi Karthik
I am confused on which one to use SMA or EMA ?
Correct me if I am wrong
We can short a trade if the shorter moving average turns lesser than the longer moving average
Yes, thats right.
Approx how many signals we can get from EMA in 1 day intraday trading.
Impossible to figure that 🙂
I can see that on applying MA crossover on some charts, the trades are rather loosing one\’s i.e the sell signal is coming when the price is lower than I bought at. Is this too common ?
It is common when markets arent trending and moving sideways.
Muje port call chaheye
Is there DEMA indicator available in zerodha
I remember seeing it in ChartIQ. Can you please check once?
Sir nice explanation for next day 9 21 crossover on 1 day frame or less pls correct if i am wrong
Yes, you can start with this and see how it goes for you.
What is the terminal the instructor uses? the one where he pulls up all these candle stick charts
Sorry, can you share some more context?
Hi,
Thank you for educating people. Appreciate your knowledge.
Can you pls help me with what do the different fields mean when I try to create an EMA.
I\’d like to know what is the difference if I take chart as the timeframe and if I chose other timeframes.Also about the length, source, offset fields. Please help with what is smoothing and what should be the length of smoothing.
If you could tell what Ema crossover works on time 15 min, 1 hr and 1 day time it would be helpful.Which one works for intraday and which for swing.
Thank you in advance.
I am sorry. I didn\’t understand \”zero in\” on above statement. Could you please eloborate?
By Zero in, I mean finalize 🙂
One more question to find a support and resistance for Intraday. What time frame candle should i include? Suppose i upload a last 3-6 months data points and now should i keep a candle of 15 mins or 1 day to get a more accurate S&R for intraday strategy.
YOu can load EOD data to get an idea of an overall trend and then zero in on last five days data to get a closer look on the intrday trends. It is best if the direction of your trade aligns with the overall trend and the intraday trend.
Hi,
I read this from above module – 25 day EMA with 50 days EMA – use this to identify medium-term trade (upto few weeks). If i choose 25/50 EMA on 15 minutes candle chart. So, should i keep trade for intraday or for few weeks as 25/50 EMA is for few weeks trade and 15 minutes candle is for intraday trade.
It depends on your time frame. If you are trading for intraday, all the setup is applicable for intraday only.
Won\’t it be even more profitable if the entry point is where the MA turns upwards and exit when the direction reverses. (quantitatively by looking at the % change in MA, entering when it turns positive and exiting when it turns negative)
Yes, but then you also want the momentum to pick up. Just to ensure that the crossover is not yet another sideways momentum.
SMA or EMA which is best
I prefer EMA for the price, SMA for volume.
sir how single candlestick pattern and multiple candlestick pattern work with moving average i have this doubt or we have to develop one strategy out of this whole learning ?
You can trade them individually or combine them to create a cross-over strategy. I\’ve explained the crossover strategy in this chapter.
Thinking of giving swing trading a shot. I want to start out with NIFTYBEES first. Will be using MACD, RSI and 7/15 Day EMA to base my decisions. I chose an index etf to play it safe. Any suggestions for a noob?
The idea of a swing trade is to ride the momentum, usually for a 10-15% pop over a week or so. The index is unlikely to give you this pop. I\’d suggest you check out stock positional trades instead.
What is Spot chart means ?? if we are taking call option of TCS stock, So do not apply TA on TCS CE option right,? we should apply TA on individual TCS stock to analyze is it right?
Yes, you need to run your TA on TCS\’s spot chart.
1) Please do not use TA on Options chart. It does not work. Many people end up making the mistake of applying TA on Options, which is not really a good practice. This is commented by you sir, what does this means? if we are doing option trade example in bank nifty then which chart i have to use for technicals.
You need to look at the spot chart, Neeraj.
Hello sir. Thank you for the wonderful information. It is very clear and helpful. What should be the stoploss when we take intra or positional trade using MA crossover. Thank you
If you are following the MA crossover as a system, then you will get the SL basis the system suggestion right?
Hi sir, you said CS pattern should be the priority in check list, is it same for all intraday as well as swing and F&O. can we buy/sell according to CS pattern in all trading segment like for intraday ,swing and F&O also.
Yes, it is the same for intraday as well as swing trades.
thanks a lot ,means a lot, everytime got satisfied with your response.
Happy learning, Neeraj!
if i use EMA and got signal to buy after crossover but there is not any candlestick pattern formed so should i go to take trade.
You can, as you are buying purely on the moving average cross over system.
if i do swing for weeks and i know price will move up but in between if there is fluctuate down further it will move up,so why should i need to put stop loss, because if i know price will move up according to my target so if i put stoploss then may be my stoploss will hit for duration in between , so i am confused to put stoploss for that, to book loss, i think stoploss is good for intraday or scalp,
because i take positional trade also and go long but didnot put stoploss because i think it will hit stopploss anytime as i cant decide stoploss on that, because i think it will move up in somedays by fundamentally after fluctuating down in between,so i think if i put stoploss than it may hit that SL and book my loss so with that fear i didnt put stoploss is it right? for ex nifty fifty stocks like itc ,hdfc and all we know they are good stocks and people buy on dips also for long ,so for swing i know for some reason it may be down but over a period of time it will move up so why need to put stoploss, it may hit SL and have to book loss automatic,please give explanation on this SL
Neeraj, SL is just to ensure that you don\’t get stuck in a wrong trade and lose money. Because you never know right? What if the market reverses direction and declines non-stop and you don\’t have a stop loss? How will you get out? What will be your plan?
and 9*21 MA means these are two MA diffrent right one is 9 and other is 21 ,so we should have to apply both and observe the crossover them each other right
Thats right.
my frst query response you said\”Neeraj, you will have to stick to one-time frame based on the kind of trading you do. For example, if you are into intrday trading, stick to something like 15 mins. Swing trading, stick to EOD. So choose your time frame and go with it, don’t mix and match.\”
i understood by your response sir, but generally asking for knowledge that both different time frame are there and price moves with same numbers so why there is need of diffrnt time frames , i want to know the logic behind this. thanks for your guidance sir
Neeraj, check this – https://www.youtube.com/watch?v=pYC5RfXAm-4&list=PLX2SHiKfualH_xMbGM-3zWC47s9gUjGR_&index=4
Also,you said in above comments that use 9 over 21 MA for swing trade and some times you mention that use larger time frame for swing trade like 20, 50 ,100 i am confused what time frame to be used for swing and intraday and F&O, i prefer to do swing trade in paper trading
Start with 9 and 21, Neeraj.
My second query is in tradingview ,i am applying MA there is option i am getting in that is – 1.timeframe ,2. length, 3. source,and 4. offset and next in smoothing section two option are there 1. method and 2. length ……please explain what to fill in these all options if i want to apply single 50 MA. there are other option like timeframes and all there are to be filled but i dont know what to fill in other options.
For this, I\’d suggest you call the support desk, they will help you with the setup.
like for any stock ex- infosys, i have opened both time frame charts one is for intraday tha is 15 min , and onw for other like swing that is for 1D time frame, the thing i am observing that price is moving or fluctuating same in both the charts, so what is the meaning of different time frame used in different types of trades and observe the different time frame chart to take trade , when price is moving same in all the time frames , i think u understand my query, in 15m time frame price of ex stock is 320 at sometime like at 10:30 and at same time at 1D time frame price is 320 same and so on at other time,so what is the mean of different time frame used for different types of trades to take.please explain
Neeraj, you will have to stick to one-time frame based on the kind of trading you do. For example, if you are into intrday trading, stick to something like 15 mins. Swing trading, stick to EOD. So choose your time frame and go with it, don\’t mix and match.
For an average trader the information & explanation are sufficient. But for a new comer some more clarity on EMA is required, please.
Sure, if you can share where you are getting stuck in terms of understanding, then I can help.
Dear Sir,
Moving Aerages – you suggested, \”one could use the 5 x 10 or 15 x 30 minutes crossover to identify intraday opportunities. As regard, by default the period is counted in days in the charts\’ software, so how to adjust 5 x 10 or 15 x 30 minutes crossover? Would you plz respond — this is just for the knowledge.
Thanks & Regards.
Narayan Borhade,
Thane West.
Narayan, you can switch the time frame from intraday to whatever intraday time frame you want. After that drop the moving averages on the chart.
How can I add the Adaptive Moving Average Indicator to Kite Chart (TradingView)
Pl let me know …..in charts provided by you …. whether Adoptive Moving Average indicator available.
It is probably available on TV. Please do check once.
Let me make it more simple.If today is a trading day(3 June) then today\’s Closing price will be generated at the end of the day ,Right?
As I am using a 50 day MA then in that case the 50th day will be 2 June and MA will be based on latest 50 days till 2june.3 June\’s data will be added only when market is closed .Right?
Guide for the same.
Thanks in advance!!
I got your point, have shared my response to the previous query.
That means in case of 15mins MA
Closing price on minutely basis are added of the latest 15 mins to form data points which are plotted on the graph.
Right?
As in case of 5 day MA we considered Closing prices on daily basis for the latest 5 days and average was plotted on the graph.
Similarly in case of 15 mins MA we will consider Closing prices on minutely basis for latest 15 mins and average will be plotted on the graph right??
Guide for the same.
Thanks in advance!!
Yes, 15 mins include minutes data and \’days\’, chart includes EOD data.
Yes, the average will be plotted on minutes data.
Moving Average changes as per time frame in which we are trading.Is it that in case of 50 day MA ,last 49 days+ current market days Closing price(based on the time frame)we are trading.
Eg. 49 days Closing price+ Closing Price of stock on 5 mins basis(added till the market closes)
Guide for the same
Thanks in Advance!!
If you are using EOD data, then its 49 days + the 50th day, wont be 5 mins basis, right?
As we are talking about 15mins and 20 mins moving average how can we add it as I think by default it is set for days??
You just have to load it once and save it as a template.
If we could apply moving averages while trading in options of index to track the movement of specific index
Sorry, dint get your query, can you please eloborate?
Can we also say that the patterns we identify can be validated with the use of MA\’s just as we can do with volumes and S&R??
Yes, sure. I personally prefer MA 🙂
When we say 15*20 mins crossover that means the latest 15 & 20 mins data points will be considered .i.e first 15 mins Closing price+next 15 mins Closing price…so on to form MA line.
Is it correct?
Or Closing prices on minutely basis are joined for entire 15 mins and it\’s average is considered to form points which are joined further to form 15 mins MA??
Do explain
Thanks in advance!!
Its for the 15 mins which is on a rolling basis. Another way to look at it is that it refers to the most recent 15 minutes.
Hi, I am really fascinated to see how the candlestick charts help us in taking positions in the markets, I want to do my own research and proceed ahead in the markets, are there any good sites that give a proper technical analysis chart to help with your research?
By research, I assume you are looking at backtesting the patterns. If yes, do check out—https://www.streak.tech/.
Hello sir, suppose I want to plot 50/100 Ema cross-over ,should I plot two different Ema i.e one for 50ema and another for 100ema or I have to plot Ema cross indicator. And sir another question is what is golden cross-over?
You need to plot two EMAs. I think the golden crossover is 100x 200 EMA. Even I\’m not sure 🙂
Hello, How to create 15* 30 minutes crossover for intraday trading?
could you explain please.
Pavan, you just have to change the timeframe from EOD to whichever timeframe you want and then drop the respective averages.
Can i use 50×100 crossover system on 5min. chart for intraday opportunities?or which one works better in intraday?
Yes, you can. But I\’d suggest you look at 10 mins or 15 mins, not 5 mins. Do backtest one, you can on do that streak.tech.
Hi Karthik, on zerodha trading view, we can only modify EMA cross over for days. You have mentioned one can go for minute wise as well for intraday. Can you please clarify how we can create EMA cross overs for minutes? Thanks.
Shahul, for that you just have to change the time frame from one day to whatever minute you wish.
If we use 50*100, death cross appear after steep fall. to reduce loss in portfolio, can we use 25*50. so that we can book loss quickly.
1. can we go confidently to use this strategy?
Like I mentioned earlier, you will have to back test this Suresh. Once you do you will know the risk profile of this strategy and hence manage this better.
Hi Karthik, I do want to swing trade in NIFTY 50 stocks along with job.
1. I would like to follow 25 EMA*50 EMA crossover system in daily timeframe.
Can i go ahead follow trade signals confidently for long term?
2. How much return can i expect in long term? any test data to prove this strategy?
3. How to manage positions when capital grow to some significant amount after 10 years from now?
1) Yes, you can use this to swing trade but you will get short-term signals with 25*50. For long term, maybe you can check 50*100
2) You can backtest on Streak.tech
3) You can rebalance by booking profit and reducing your exposure to EQ.
what is the maximum pain theory in option trading?
Manish, check this – https://zerodha.com/varsity/chapter/max-pain-pcr-ratio/
I have been trying to Option trade with the help of five min chart.
I apply chart with an indicator
RSI (40,60), MACD, and Open Interest.
My strategy is to Buy the call option while
RSI crosses over 60 with the Macd Cross Signal line.
For confirmation, I monitor the open interest indicator.
Is this strategy is alright for Option trade?
Manish, the right way to figure this is to back-test the strategy. To backtest, you need to figure out how many times in the past the market has given you such signals and how many of them were successful.
In the above MA crossover system, it says 50 day EMA takes lesser no. of data points and 100 day EMA takes more no. of data points. Shouldn\’t it be vice versa.
which length/period EMA crossover combination is suitable for intraday 5min or 15min chart.
hlo sir, which period EMA is best for intraday for 5min or 15min chart pattern.
hlo sir, which period EMA is best for intraday of 5min or 15min chart
You can start with something like 9×21 minutes EMA. Give it a try and calibrate it along the way.
Thank you so much for Zerodha Varsity.
You make everything seem so simple by your wonderful explanation.
That is genius – hats off!
Happy learning, Shaunik!
Thanks for this information. But I need some more information regarding Moving Average. This is basically about different type moving averages those are not discussed here. But If I open Kite and on chart if I select \”Moving Average\” then in I can see there is pop-down window to select \”Type\” of moving average.
Here is list of all types that I can choose from.
—>
01) Simple
02) Exponential
03) Time Series
04) Triangular
05) Variable
06) VIDYA
07) Weighted
08) Welles Wilder
09) Hull/ Double Exponential
10) Triple Exponential.
I want to know what is difference among them. And most important what parameters Zerodha use for calculation.
Like Alpha value for exponential moving average ? And how Zerodha decide for weights automatically when we select \”Weighted\” moving average.
Where I can read more about all these in general and specific to Zerodha calculation.
Regards,
Anurag
Anurag, these are different methods to calculate the moving averages. I\’d suggest you stick to the Simple and exponential averages. These are easy to understand and quite effective as well. I\’m myself not aware (and have not used) some of these other moving averages. Maybe I should to check how they work 🙂
Hi Karthik,
Amazing insights and gyaan, superb !
Query:
I am a long term investor with horizon of 1-2 years. Can I use below at the same time/together? Or should I necessarily use only 100 day EMA with 200 days EMA?
50 day EMA with 100 Day EMA – use this to identify trades that lasts upto few months
100 day EMA with 200 days EMA – use this to identify long term trades (investment opportunities), some of them can even last for over a year or more.
Thanks Ashish!
Yes, of course, you can use this. As a rule of thumb, the higher the moving average timeframe, the better suited for long term investing.
How Can we plot moving average +1% on chart?
Not possible, I guess.
Hi Karthik,
Thanks for your reply.
So if i want to plot the 13 week EMA on the chart, I just need to select \”1w\” as the time frame and \”13\” as the period right?
Yes, thats correct, Dhairya.
Hi,
Is a 65 day moving average on a daily chart the same as a 13 week moving average on a weekly chart?
Example: The current 13 week moving average for nifty is 17413.Is my assessment correct?
Thanks.
Ah no, these are two different time frames altogether. OHLC values are different, hence Works differently.
Hi Karthik
What timeframe charts should I use with crossover EMAs for both longer positions as well as intraday / short positions ( 5 minutes / hourly etc.) ? Also please tell about how many days of EMAs should I take into account for respective positions (intraday and long term )?
For anything other than intraday, you can use EOD charts. For intraday, I\’d suggest you use 10 mins. Regarding how many days, you need to calibrate this as per your risk appetite.
can we set an alert for when the two EMA lines intersect or we have to check all day manually ?
Pls suggest
thanks
Check this – https://sentinel.zerodha.com/
thank you Sir for answering My questions ! 🙂
I also had one more doubt , \” while drawing trend lines (for any price action strategy ) Should we consider the upper and the lower wicks or not ???? \”
I prefer looking at just the real bodies.
Sorry I posted this question twice due to some technical error
pls ignore this question
If market price touches support/resistance(i.e target price) before getting the signal to sell (i.e. ema lines intersecting), should I exit or continue to hold
Thanks
In intraday if market price touches support/resistance(i.e target price) before getting the signal to sell (i.e. ema lines intersecting), should I exit or continue to hold
Pl suggest
Thanks
Depends on your risk appetite Mohit. I\’d wait for the close, but if you feel it\’s too much risk, then you can act based on intraday signals.
Hi
I am using 9*21 EMA Crossover system for intraday. And as u said we have to enter and exit when both the lines intersect.
But what if, after entering into a trade, both the lines do not intersect each other till day end.
When should I exit then ?
Pls suggest.
Thanks
If the trade is intraday then you will have to close the position regardless. But if its overnight, then you can continue holding the same till you get a signal to sell.
Hi
Pl tell whether the crossover MA system is also useful for intraday or is it for just higher holding period (from few weeks to few months )
also pl tell if 9*21 crossover is the best for intraday or some other is better ?
Thanks
You can use it for intraday also, ensure you are looking at the intraday chart.
Sir , I didn\’t get that , what will be the values that we will be using in Ema indicator ? Will it be 15 x 30 or something else . If 15 x 30 than what will be the time frame on chart ? I understood everything else properly but this is something which makes me confused !
Thank you Sir !:)
EMA Values = It can be any, for example, if you are using a 10-minute chart, and load 15×30, then this means you are looking at the exponential moving average of the last 15 of ten-minute charts against the 30.
Thank you Sir .
I also had one more doubt , Sir in the moving averages chapter in page number 105 it is written that \”one could use the 15 x 30 minutes crossover to identify intraday
opportunities. A more aggressive trader could use 5 x 10 minute crossover. \” Sir i didn\’t understand this . How will we apply the 15×30 minutes crossover ? what will be the values that we will be using in EMA Crossover indicator and the time frame also ! and also please expalin that why is it written 15×30 minutes crossover ?
Thank you Sir ! 🙂
Generally speaking, a shorter time frame like 5×10 gives more trading signals compared to a higher timeframe like 15×30. Hence if you are an aggressive trader, then you can use these to generate trades. But this can be a double-edged sword, so use it wisely 🙂
By the way, 15×30 means 15 minute EMA over a 30 minute EMA. You can apply this by dropping two moving averages over the price chart.
I have a question. For cross over moving average what is the ideal window that we need to check.. as i can see that same 9D/ 21 D averages show different value when we see charts at 1 day, 5day, 1 month, 3 months, 1 year and 5 year levels. similarly for 11D/200D moving average have different cross overs for different time windows (1 day, 5day, 1 month, 3 months, 1 year and 5 year)?
There is no idea window, Akhilesh. I\’d suggest you stick to a time frame you are comfortable with and work with it. For example, I prefer EOD chart and prefer averages like 9, 21, 50 and 100.
Sir , Do Chart patterns like ( cup with handle , Double bottom and many more …….) and Candlesticks ( marubuzo , evening Star and Many More ……) work On 5 Minutes or 15 Minutes Charts ?
Yes, Prakam, it works on an intraday basis. However, my personal preference is to use a longer-term time frame.
Hello I have a question
As u stated that crossover EMA system helps in a sideways moving market.
Also in such a market the price does not touch the support and resistance levels often. so can we trade solely based on the EMA Crossover system ignoring the candlesticks ?
Thanks
You can, in fact, the moving average system does not incorporate candles at all. It is purely based on the price.
Lets say on Day1 short term MA becomes greater than the Long term MA, and it is still above Long term MA on day 4 as well. Can i consider entring into the trade on Day4 or i should always enter On Day1 or Day2 of crossover?
YEs, as long as you think the stock has not run up quite a bit.
Hello Karthik hope you\’re doing really well, I started learning intraday trading can you please clear my doubt 👇
As a trader how many indicators should we follow becuz there are so many indicators and tools available for a trader but i personally felt very confused to learn and follow each.. is it okay we learn and master 2-3 indicators and tools to apply them in our trading???
Looking forward for your reply
Yes, in fact, I\’d suggest you learn and understand just 1 or 2 indicators well. There is no need to learn all the indicators that are available 🙂
Hi Karthik
Can u explain the logic for the below statement?
The entry and exit rules for the crossover system is as stated below for EMA
Rule 1) – Buy (fresh long) when the short-term moving averages turn greater than the long-term moving average. Stay in the trade as long as this condition is satisfied
Rule 2) – Exit the long position (square off) when the short term moving average turns lesser than the longer-term moving average
The logic is simple, we buy when there is a surge in price (indicated by price going higher), with an expectation that the price will continue to trend up. Like wise when we sell.
i\’ve got two questions
1. what exactly do you mean when you say sideways market?? I didn\’t really understood the concept of sideways market .
2. what would happen if you short a stock and didn\’t but it back on the same day??
1) It means to say that the stock is stuck within a price range for a long time
2) It will be auctioned, and you will be forced to buy back at a higher price.
Does zerodha have the facilities relating with AMOs ?? After market orders
Yes, we do – https://support.zerodha.com/category/trading-and-markets/kite-web-and-mobile/others/articles/what-is-amo-and-when-can-we-place-it
Muje roj beja karo 44 moving average
HI,
I would like to understand the difference between Moving Average Exponential and EMA Cross indicators. Can you please elaborate on these two?
hello,
thank you very much for your valuable blog.
i have a doubt that, i have seen that EMA crossover system can be built, days as a unit. but in 13.4 you wrote that \”Needless to say, the MA crossover system can also be applied for intraday trading. For instance, one could use the 15 x 30 minutes crossover to identify intraday opportunities. A more aggressive trader could use a 5 x 10-minute crossover.\” how to build a 15 X 30 minutes or 5 X 10 minutes EMA crossover system in Chart. or how to built a EMA Crossover system, Time as a unit rather than day.
Thank you.
Ah, you just need to convert the time frame from days to minutes, Krishan. You have 1 minute, 5 minutes, 10 minutes etc as ready time frames in the chart dropdown.
When will whipsaw of stock \’IDEA\’ covert into trendline?
I wish I could answer that for you.
Hi Karthik,
Why you have not explained other moving average types,like Hull, Double exponential,Vidia, variable,etc, how can I know about them?
Thought SMA and EMA are more than sufficient for most traders 🙂
What is the best time frame for 50 days moving average while buying stock options
There is nothing really like best time frame 🙂
sir i think this moving average analysis especially EMA CROSS OVER is sufficient and i also think that there is no need for other indicators like RSI AROON etc . because they also work on this pattern but not as accurate as EMA. what is opinion sir ?
I kind of agree with you 🙂
In article you said that, \”Needless to say, the MA crossover system can also be applied for intraday trading. For instance, one could use the 15 x 30 minutes crossover to identify intraday opportunities. A more aggressive trader could use a 5 x 10-minute crossover.\” But how can I apply a 15 and 30 min crossover because I am not able to apply this indicator in zerodha with chartiq and also with tradingview.
Use two moving averages, and apply both these on the price and you will get the overlay system. It is in fact the same way as you\’d do on a EOD chart.
Sir please answer.
Is it ok to use ONLY 20 SMA ON 5 OR 15 minutes time frame for intraday trading.
Yes, it is absolutely ok to do that.
Why The Exponential Moving Average Indicator is not showing in zerodha???
It is, I guess you need to explore the chart studies a bit more.
SIR, I want to do Intraday trading, which crossovers to apply for it?
Simple MA crossover on intraday timeframe is good to start with.
Very good. Explanation with examples is quite easy to understand. More such articles are needed. Keep it up writers!
Happy learning!
Amazing explanation, simple terms and recap as well. Superb!
Happy learning 🙂
Can we use moving average for buying call and put . If yes then time frame and which candle duration to be used for better result
Yes, you can. You need to use a short term average here, something like 21 of lesser.
How to select EMA in Zerodha Kite? Under Studies menu I couldn\’t find entry for EMA
Hmm not sure of you are looking at it right. I\’d suggest you call the support team for this.
Hello Sir,
First of all thank you so much for what you guys are doing.
I have a doubt. Which time frame should i select 9×21 crossover system. hourly, daily ??
Thanks and regards,
Kunal
I\’d suggest you start with daily, Kunal.
How can i see 10 DEMA of a company?
You will have to select it from the drop-down in the studies.
Firstly thank you for such awsome insights. My question is for selecting EMA practically on trading charts for intraday trades, There are two things which we can select one is time frame of candles and other is moving average period, So if we select 5minutes timeframe and moving average period (9 X 21) two moving average than what exactly in back ground it means. Also please enlighten on slection for intraday trades
Dinesh, it means that you are calculating the last 9, five minute candle\’s moving average.
Thank you for the explanation. could you tell me if you use 20 and 50 MA for intraday trading or should I use little lesser time frame.?
I\’d be inclined to use 20 or lesser for intrday.
Hello Team,
In chart, there is no way to select EMA (or Exponential Moving Average ). Kindly help to know where is the option in chart. thank you.
Why? It is quite straightforward. Which part did you find difficult?
Hello Sir,
What corrections have you made to this chapter?
Could you put your corrections or edits in red so one can identify what was changed?
No updates as such, Hasan.
Hello Karthik!
There is a typo in the paragraph before the last one: \”Trend is your friend\” is mistyped as \”Trend is you, friend\”.
Now, with that aside, thanks for putting together this educational material. Varsity is an amazing resource! Clearly, a lot of love and attention has gone into putting this together – it shows in subtle things. You folks are doing a great job at Zerodha!
Thanks!
Thanks for pointing that also thanks for the kind words 🙂
How to select number of candles in a chart?
At least last 3 months of data.
In the second trade b2@178 and s2@ 182 the trend can be said to be sideways. But it is only established when the selling position arrives. Before the seeling position arise we are not sure of the trend. same can be said for position @b1. In trading we will not have the final exit point unless we reach there. How can we use this approach better in that scenario? Please help
Abhishek, MA as a system is better used when the prices are trending. Its hard to use this in a sideway market.
Hi Sir, actually I had a doubt that what is best suitable timeframe to use these averages…like 15 min 1hr chart..
I\’d say 15 mins for intraday.
sir I have a doubt when candle touch the stop loss we should exit or after the candle formed. today when I see the chart I put a stop loss , but the long bearish candle touch and over my stop loss but end with hammer, the close price is above my stop loss but the candles lower shadow are crossed my stop loss . what we should do in the situation sir…is we have to wait for the candle to form over the stop loss or we should exit when it touch the stop loss.
Babu, it depends on what kind of risk appetite you have. I personally prefer to wait for a close and confirmation. But if the crack is getting too big, way beyond my threshold, then I do get rid of the position to cut my loss.
Can we consider sma 50 day and ema 50 day crossover to trade in intraday or swing trading
If not plz explain reason for same
Thanks in advance
Yeah, you can. Do a back test before you trade this.
Software like trending view provides EMA plotting. There is something like offset in that setting. YOu define length, offset and source. What is this offset?
Yeah, I usually prefer to ignore the offset bit.
What is the best moving average selection?
Karthik , How to plot difference between 2 Moving averages as an histogram?
Ah, I think some charting engines allow you to do this. TV does I guess, but I\’ve not checked this. Btw, as a side note, I prefer to see the 2 MAs rather than the histogram. Just a personal preference.
Why 9 SMA on DAILY CHART And Monthly CHARTS of Any stock are Different,and How they are calculated.
The OHLC will be different right?
Hi Karthik, As you mentioned \”one could use the 15 x 30 minutes cross\” for intraday. May I please know what should be the time frame to use for intraday ? Is it 1min or 5min or 15min ??
I\’d suggest 10 or 15 mins.
Thank you so much for your reply. Really thankful to you and the entire team of Zerodha to making us learn.
Happy learning!
Sir I have a small doubt.
Let\’s Say I have taken two EMAs for few trading sessions
one is 9 days and another one is 21 days.
Now the Faster moving EMA is higher than the slower moving one but the CMP is lower than both the Faster moving and slower moving EMAs.
So what should be the decision taken by the trader?
In a nutshell, should we consider the cross over system in accordance with CMP or the cross over system works independent of the CMP?
This is highly unlikely since the 9 day will hug the CMP. However, its possible in a situation where the stock prices has sustained momentum but one fine day drop quite a bit (or the other way round). No, I\’d wait for the price to go back above the 9 day or at least the 21 day to place a trade. Basially wait for reversal. The reason to do this is that you dont want to get caught with a trade in the opposite direction.
karthik sir Thank you very much if ive doubts means it\’s you who clears that ☺
9 EMA & 21 EMA @ 5 or 15 mins TF ,which is good for intraday?
Once again Thank you
Higher the better. I\’d prefer 9×21.
sir ,which is the best crossover system for an intraday trader using 5 mints time frame?
? X ? mints
Sir you said \’when the short term MA crosses over the long term MA its a buy signal and the buy should be retained till the short term MA is higher than long term MA\’, so does this work vice versa i.e. if long term MA crosses short term, it can be a signal for short? Thank you in advance.
Yes, you can reverse this for short trades.
Hi ,
Please let me know, is there any free software to scan the moving average of a particular stock
Do check streak.tech.
Can MA be used as resistance and support.
Yup, you can.
Hi ,
How is target, SL be determined if we use MAs?
MA system itself has SL in build, Vineet.
Hello Sir,
For moving averages
Why does one use the basic 20, 50,100, 200 etc
There are 21 trading days in a month so instead of 20 one should use 21?
63 trading days per quarter so one could use that instead of 50?
Why are people stuck up on 20,50,100,200 etc?
These are just conventions, Hussain. Not necessary to stick to these numbers 🙂
I m new in terms of trading in stocks,need to know if I use 50 EMA for trading or else investment,what should be my chart duration,1 day,1 week or one month?
YOu should start to look at 1-day chart, Rajesh.
Thanks. The topics discussed are really informative and quite easy for a beginner to understand.
Happy learning, John!
Hi Karthik. Reading the topics has been really enlightening and the learning has been multi fold. For something like banknifty options where the movement is extremely rapid what would be a good indicator to use. I use 9 and 20 EMA along with Stochastic RSI and MACD on a 3 minute chart. However it seems quite tricky to detect a movement especially in a sideways market. What would be a preferable set up for something with such rapid movements. Will be great if you can comment. Thanks
John, I\’d prefer to use price action, as depicted by the candlesticks. I find this far more reliable compared to any indicators.
Where we can find Exponential Moving Average in Zerodha Chart?
Kite > studies.
How to find 5 ema cross
Hi Karthik,
So far I have been a long term investor. But today, I went through this MA lesson. Please clarify:
1. For Intraday trading, what time period , I mean to say for candlesticks, 1 minute or 2 minutes or higher at 5 minutes or 10 minutes chart will be best?
2. When we talk of EMA, say for 5 minutes chart, 20 EMA means past 20 candles moving average or 20 days data moving average? Because you are using the word DAY like 9 days EMA or 25 days EMA in your lesson.
3. Please throw some light on Double EMA?
1) Higher the better. I\’d prefer 15 mins over 10 mins
2) It refers to the past 20 candles. So if you are looking at 15 mins candles, it could mean past 20 candles of 15 mins each.
How to draw 15 x 30 minutes crossover to identify intraday opportunities?
Sujay, try plotting that over 10 or 15 minutes candle.
Can we trade a share only after analyzing moving averages cross over if we are a beginner?
The 9days -21 days cross over?
Yup, you can.
Sir if we calculate 50 days MA then we have 50 average points but how we say current market prize( CMP) is greater than MA or less than MA. Based on which we say CMP is greater or less than MA. Kindly clear this doubt.
The market price keeps moving right? Also, I\’m not sure what you mean by calculate 50 days Avg and also 50 average points can you please add more context? Thanks.
It was very informative I learnt a lot Thanks I want your suggestions on using tools to calculate
moving averages.Will SMA serve the purpose or the EMA must be plotted,will you suggest some useful
software for the purpose Thanks
The charting system within Kite will help you calculate this.
Hi!
Can you tell me the role of offset? I cannot see moving average line if offset is zero. But if I remove offset, i see only half moving average line.
Vijit, offset is basically a smoothening factor. You can ignore this.
Hello Karthik,
Your Article is good. It clears my doubt but could you please elaborate \”the markets discount everything\”?
Dhiraj, this means all the know and unknown information is factored into the price that you see on the screen.
Hi Karthik,
Are the moving averages (SMA, EMA, DEMA, TEMA) interchangeable by varying the look-back?
i.e., (please ignore the numbers) is SMA (100) ~ EMA (200) ~ DEMA (300) ~ TEMA (400) ?
Any tips or words of caution while optimising \’which MA with how much lookback\’?
Amit, while these are all moving averages, the way they are calculated are different.
hey Karthik. I wanted to how can we filter out false signals in the MA crossover? and which indicator/s should I use to complement the crossover system so that many false signals are filtered out?
Thanks.
One good way is to check if the market is sideways, if yes, changes of false signals are high.
why 200 day moving avarage, candle time frame 1 month is not available in most of the charts?
Monthly charts are available, Viren.
how can it get 44 days moving average raising all stock list in single query
Hmm, I guess you will have to try steak.tech for this.
Thank you for sharing such a valuable information.
Happy learning, Paras.
Got it. Thank you.
Sir,in your kite app I didnot found exponential moving average .
How can I apply on the chart
It is the most used feature, Shailesh. Are you sure you are looking for it in the right place?
Karthik sir,
In last chart, after exiting at right side last red arrow position (following Rule 2). But the stock price keep on increasing for so long and could have given lots of profit, but with the current technique I couldn\’t recognise the opportunity, so my question is how can we identify this kind of opportunities which are out of course for MA.
There is an immediate buy sign after the sell signal, right?
What are \’offset\’ and \’underlay\’ in MA? While setting MA on charts it asks me about setting these terms.
You can ignore the offset bit, Ritik.
Hi investors, I need to add Moving average and MACD in Zerodha application. how can we add please explain ?
Siva, you have to add these from the studies. I\’d suggest you call the support desk, they will help you with it.
SIR FIRSTY I\’M SO THANKFULL TO YOU OF WHAT YOU ARE DOING FOR US THANKYOU SO MUCH WITH ALL OF MY RESPECT I WANT KNOW TWO THINGS
1} HOW CAN I GET THE INDICATOR OF 9*21 OR 10*15 EMA
2} IN INTRADAY IF I ENTER WITH THE HELP OF 5 MIN CHART SO ITS COMPULSORY TO EXIT WITHIN THOSE 5 MIN???
1) YOu have to plot the EOD chart, and then overlay it with the required moving average
2) Its better that way.
Hi,
Please let me know how to set the 21-day SMA as my Stoploss in Zerodha?
Thanks,
Gunjika
If you know the percentage, then maybe you can use the GTT order. Check this https://zerodha.com/z-connect/tradezerodha/kite/introducing-gtt-good-till-triggered-orders
Hi, I find scalping good idea, but still don\’t understand which duration of chart to be taken, does MA period of 9,21 mean days in minute chart or as chart changes to hours, days weeks, the ma period also changes. So what chart I should use
For scalping, you are better off looking at a 5 min chart. Most of the decisions to buy sell while scalping depends on your ability to read price movements on the fly. Conventional charts and an indicator-based approach may not help much.
Needless to say, the MA crossover system can also be applied for intraday trading. For instance, one could use the 15 x 30 minutes crossover to identify intraday opportunities. A more aggressive trader could use a 5 x 10-minute crossover.
Sir please make me understand this statement unbale to make it clear about the 15x 30 minutes and 5x 10 minutes crossover ..read the comments but still not cleared ..
Aditya, the crossover is when a slow-moving average crosses a fast moving average. In this case, I\’m suggesting a 15-minute (fast) candle crossover against a 30-minute (fast) candle. The trades are based on this. I\’d suggest you observe this for few days till you get a hang of it 🙂
1)Your articles are very helpful.could you please clarify below doubts since I am beginner for stock market and investing for long term.
clarification1:-
1)which chart I need to consider for entry price SMA,EMA,cross over?If it is cross over can I consider 100 day EMA with 200 days EMA
2)can I follow below rule for entry price?
Rule 1) – Buy (fresh long) when the short term moving averages turns greater than the long term moving average. Stay in the trade as long as this condition is satisfied
1) Try the EMA crossover
2) Yes
None can simply this MA concept than you. Great work. Keep it up Karthik.
Thanks for the kind words, and happy reading!
What multiple SMA should I use for scalp trading?
Thank you karthik.
Start with 9 x 21 on 5-minute charts and see how it goes for you.
Can we apply moving averages to stocks nd stock options
Yes, you can. Although I\’m not a big fan of applying MA on stock options.
Sir, if I want to use a 5 day moving averages, what are the requirements? I mean is it only useful when the prices r moving fast?
You use 5 days when you want to trade short term. That\’s the only requirement.
Pls let me know where to get simple moving average charts fot 30 days for different stocks
On Kite 🙂
Hi
Thanks, I am new to this field but your explanations are pretty much in layman’s language.
I have a doubt, what is the criteria for short sell using MA indicator? I mean what will be our entry and exit rules?
Regards
Shweta
Shweta, the criteria is the same – a cross over in MA which indicates a short opportunity.
Hi Karthik
The rule in case of EMA says
Rule 1) Buy (go long) when the current market price turns greater than the 50 days EMA. Once you go long, you should stay invested till the necessary sell condition is satisfied.
This seems different from the logic where we say the price would move towards it\’s mean. In such a scenario should not we going short with the expectation that price would eventually move towards the EMA
These are two different concepts – trend following and mean reversion. Mean reversion should be timed (As far as possible) and measured. Have discussed this in the module on trading strategies.
what is the preferred time interval for crossover mva for a day trader ?
Start with the 9 over 21 across 10 or 15 min candles?
Excellent. Very will explained. Keep it up.
Thanks, Doc! Happy learning 🙂
what should be the minimum duration for the effective inference of the trend in the EMA – whether it is 7d ema,14d ema or 50d ema. I feel it is better to keep all the three in the graph and see how each one trends. Pls comments on this to have better idea
The default us 14 days, I find that the most useful one.
9 and 21 days or minutes, sir? All this while I thought it was days.
If you load a 10-minute chart and plot a 9 EMA, then you will get the average of the last 9, 10-minute candles.
Sir, I have a similiar doubt as aman ji. When you have chosen a 21 day Moving average, it gives you a thorough information about the prices but when you are into 30 mins or an hour long trading, will the 9 day or 21 still be useful considering the shorter trade time? Should we not be switching to a lesser moving averages?
If you are looking at 30Mins, you can still look at 9 and 21, but these will be the average of nine, 30 mins candle overlayed on twenty-one, 30 min candles.
Wonderful sirji, you finally cleared my doubts🙏.
Sirji, using anything below 9 days or using anything of 1 day or a few hours will not give us a very good picture of it, right?
It depends on your risk and reward temperament, Aman. Some people can do this quite well, while others find it really tough to trade with low-frequency time frames.
Ok so i will stick to 10-15 mins candle now what timeframe of MA should I use?
You can still use a 9 and 21 MA.
Hello Karthik sir I have some questions.
1. I Trade in intraday and my watchlist is Nifty 50 or sometimes sensex 30. It\’s like my opportunity universe as you guided. So many times I observed that there is a tremendous bullish or bearish rally in a particular stock with more than average volume but what I missing in that stock is a candlesticks formation. For better understanding just look at the 15mins chart of Maruti Suzuki of 22 Dec 20 there is a constant bull run of 6-7% but there is no candlesticks pattern. Not having a candlesticks pattern is actually a caution for a deciplined trader. There are so many stocks like this, they going up & up and down & down but not having a candlesticks pattern. What to do in this kinds of situation. I was very confused in this kinds of situation.
Rajesh, if there is no pattern, then you should not be force-fitting a trade. Leave it at that and let the charts do what its supposed to do 🙂
Sirji, I think I am finally getting it. If it\’s a 15 or a 30 min trade, what MA time frame would you suggest?
I\’d suggest you look at 10 or 15mins candels.
Oh wow, I see, sir.
If the 10 day SMA falls below 20 or 50 period SMA , it\’s a clear indication that the market is falling, so can I use the moving averages now?
Thank you boss. 😊
Its not a clear indication, in fact, there are no clear indications of any sorts about markets falling or raising 🙂
In a market thats not moving fast , is it a good idea to use EMA over SMA?
Moving averages may not work in sideways market, Varun.
Sir, 30 Mins over 1 hour won\’t give smoother results?
1 hour would be smoother compared to 30 mins. Higher the time frame, smoother it is.
Sir, then what time frame of moving average would you use for intra day trading?
Start with 9 over 21 and see how it goes for you. Calibrate as per your risk and reward temperament.
Sir, now the real question is, how do I choose the time frame?
If I am using a 15 mins chart and I use a 30 mins or 1 hr average, will it not be far from the current market price n too unclear? (This is my biggest doubt, sirji)
Thank you.
The current market price is always indicated in the last candle of whichever time frame you select, Aman. Also, generally speaking, the higher the time frame, the smoother your average is.
sir, what has happened is, I have got confused after a lot of research into this MA. If u dont mind, please clear a few things for me.
20 days moving averages shows last 20 days\’s, 15 mins moving averages shows last 15 mins, 1 hour shows last one hours\’s, correct?
That\’s correct, Aman. The average shows the average of the time period selected.
Sir, if I choose 5 min candle chart, should I keep a low moving average like 1 min, 5 min n 15 mins? Some use higher MA for smaller time frame charts. Will it not be vague n inaccurate?
I would like to get your comprehensive explanation on this ,sirji.
Thank you.
Aman, you can select any moving average, it should not really matter as long you have the right trading setup.
Sir, Can I set moving averages of 5 mins of 1 week, 1 month or of any time frame?
Yes, you can.
Sir, sideways means when it moves above the moving averages line?
Sideways means the movement in stocks is restricted within a price range.
Sir for intraday which EMA would you prefer me I\’m confused sir, I don\’t trade on indicators but how can I use EMA 25,50 for 15 min intraday chart
Thank you☺
Start with 9 and 21 and see how it goes, improvise on this.
Thanks for your extraordinary technical explanation on MA.
Can I know which combination of MA would be best suited for Banknifty in intraday? Maybe be different volatilities
Very hard to comment on that. You could start with the 9 and 21 day EMA crossover and see how this works.
How to use the concept of MAs on intraday trades, I am not clear with that i.e how to build a 5* 10-minute crossover
It is the same way you\’d use for EOD, concepts remain the same. Just the timelines shrink.
1)What is recommended more? EMA crossover technique or candlestick patterns?
When do you use one over the other?
2)In a trending market, do we use EMA crossover technique or candlestick patterns?
3)Can we rely on candlesticks only and not use EMA crossover technique whatsoever?
If so, what would i be losing by doing so?
4)Can we rely on EMA crossover only and not use candlestick patterns whatsoever?
If so, what would i be losing by doing so?
Regards,
Kiran Hegde
1) I like to use both these. In fact, EMA is the only indicator I prefer.
2) Both 🙂
3) Yes. EMA is a complete trading system, which means you have a defined entry an exit. You\’d miss that
4) Same as 3rd query right?
Sir,
You said that in cross moving average systems go long when faster EMA is above slower EMA but I think we must also keep in mind the criteria intially mentioned that current price should be higher than both the EMA\’s (in order to go long on a trade).
That is implied. Without the price moving up, the averages wont move up, remember, MA is a lagging indicator.
can i have these notes in written form…from where i can purchase it
YOu can print this only, PDF copies are available for downloading.
Which frequency(1 min/5 min/10 min/15 min) charting is better for Intraday Trading while referring EMA of 9 and 20 days?
15Min is my opinion.
Dear Karthik, I looked at ITC’s chart and seems cannot apply the EMA rule to them. 9th April 2020, it’s price crossed the EMA. Closing was 185.25. It kept crossing the EMA daily on the downside which would make a loss making trade. Am I missing something?
The stock is trending down, hence the MA will point to short trade, Ajit.
what time frame to use for swing trading 1day candle or any other specially for short position for 50 & 100 dma and 100 and 200 dma for long position
You can use EOD candle for swing trading, Viren.
Hi Kartik,
Shall we go short in moving average ? is it possible ?
Regards
Ishwar
Yes, you can use futures to short.
SIR REALLY THANKFUL TO YOU FOR LETTING US LEARN THIS GREAT TRICK, GOD BLESS YOU.
Happy learning, Amit.
Hi Karthik,
Does the concept of Eliott Wave Theory work in technical analysis?
If yes, what should it be used in combination with?
Thanks.
I\’m not sure, Anuj. I\’ve never used these so, I should not really be commenting on it.
hello karthik sir,
My question for is , which MA crossovers has worked best for you for intraday like based on your own experience, what has worked for you the most?
and
MY second question is can i plot 9*21 ma on 15mins heikin ashi candle for intraday signals?
THANK YOU,
Any short term configuration such as 9*21 works Mosmi. Remember your main cues should come from candle patterns and not the indicator.
Thanks Kartik for your reply. But, could you provide a bit more clarity on this. I have started trading recently. So, I might be missing the basic principle behind using the moving average. I am not a day trader. I like to buy a stock at some breakout and I give that stock atleast 3-4 months to achieve the target unless I see any better opportunity. So, which moving averages would you suggest in a weekly chart? If I use 20 day moving average, it will be average of just 4 candles on a weekly chart. It is penetrated by the price a lot. Actually I have not used the simple or exponential averages a lot. So, I am confused how much importance should be given to which average.
Why are you keen to use a weekly chart? You can use daily charts with a higher moving average. It will lead to similar outcomes. For example, I\’d prefer to use a 50 over 100 day EMA on weekly for identifying long term trends.
I have heard people use 5 day, 20 day, 50 day ,100 day exponential moving averages. I trade by looking at weekly charts. So, if I talk about 50 day exponential moving average, should I take 10 week exponential moving average on weekly chart (just diving by number of trading days in a week…50/5) …??
Hmm, but that would be a very slow reactive average, are you ok with that? The only issue is that you may miss the opportunity to react quickly to reversal trends.
Sir, can we use moving average crossover system during sideways market?
I use moving average convergence and divergence in the charts while in the trend. So, should i use both?
No, it does not work very well. Both MACD and MA cross over works equally well in trending market. But I\’d suggest you stick to one of them.
Hi,
If I want to plot 50 day EMA and 100 day EMA on the zerodha chart, what option do I select at the bottom of the page \”1D , 5D, 1M, 3M, 6M or 1y?\”
And what option do I select at the top of the page which has options from 1m to 1 month?
Please let me know.
You need to select 1D.
Hi Karthik,
I have not fully grasped what the EMA is on the Ambuja Cements chart. Could you please let me know what this means \’The black line on the price chart is the 50 day exponential moving average.\’
Could you please also enlighten me on the steps one has to select to get the 50 Day EMA on Zerodha charts.
Many thanks.
I\’ve explained the concept of moving averages in this chapter, please do read through. For loading the 50DEMA, goto studies in Kite charts and search for exponential moving average.
Hi Karthik sir,
If EMA crossovers alone is so effective in getting profitable trades, why do traders look into other indicators and patterns? Will the trader be able to catch the trend in advance by using other tools or is there any other reason? Can you please clarify?
I\’ve wondered about this often 🙂
But I guess its a matter of finding trades frequently and putting your capital to best use.
Thanks a lot.
Good luck, Nikhil!
Hello Sir,
Thanks for your reply.
Sir, in Swing Trading, can I use Green color for 7 days EMA line and Red color for 21 days EMA line? And in positional trading, can I use Green color for 21 days EMA line and Red color for 50 day EMA line? May I right? Please reply to me.
Thanks,
Nikhil Nafde
Yes, thats totally fine.
Hello Sir,
I want to ask you which of the EMA combination should I use 9 days & 21 days or 21 days & 50 days in Swing Trading or Positional Trading.
Please also write which line of EMA (9 days & 21 days or 21 days & 50 days) should be used for green and red?
Thanks,
Nikhil Nafde
For swing I\’d suggest 9×21, for positional 21×50. You can keep this as starting setup, improvise on it as you get comfortable with markets.
sir which moving average crossover best for intraday 5 min chart
Any short term crossover pairs is ok, like 9×15 or 9×21.
Hello sir,
can i use moving averages(9*21) on heikin ashi instead of normal candles. Would it be feasible for trading with heikin ashi or would there be any difference
I supposed you can. Btw, I’m not too comfortable with Heiken Ashi, so I may not be the best person to comment on it.
Hello Karthik Sir,
Please help to clarify following questions :
1. MA crossover works best when we have a trending market and fails when we are in sideways market. If we are planning long in a particular stock then whom we should see Index or stock, is in trending/sideways market?
2. What should be best EMA crossover periods for Swing trades ? 9×21 days/ 25×50 days/ 20×50 days or something else. I am bit confused. Of course, I need to backtest and verify what works best for me but I request for your opinion on the basis of your rich experience.
3. If EMA crossover previously happened and short term EMA is already above the long term EMA. Can we go long on such cases for swing trade? CS pattern and Other indicators like RSI & volume are in favour.
Thanks in advance!
1) You need to check both, its best when the stock and index show similar trend
2) I\’d say 25×50
3) Depends on what extent the crossover is, if its too much already, I\’d avoid.
Hi Karthik Sir,
Happy Teachers Day! I started learning stock trading just 4 months back and whatever I learnt till today, it because of you. You have become my Guru and Mentor. Thank you so much for everything. May god bless you with good health and immense happiness of life.
Regards,
Rajnish
Thanks for the kind words, Rajnish! I\’m overwhelmed with all the messages flowing in today. Happy reading 🙂
HOW TO SELECT 2 EMA\’S IN ZERODHA APP
I\’d suggest you call the support for this, they will help you with this.
Thanks Karthik,
Have checked its only the one day candle which differs, lower time-frame are intact,
anyways thanks for highlighting this,
Guessed as much! Good luck, Vinod.
HI karthik,
Any update from your team on the difference of EMA in Chartiq and TV, the problem is not sorted even I tried today with Ramco cement and TCS, different data for 200 EMA.
I can switch myself to TV but to be honest my eyeballs are well trained on chartiq because of various studies not available with TV especially the dark theme and candle volumes. Hence request your team to sort this, thanks
Vinod, I\’ve reported this. I personally don\’t think this is possible since charts are served from the same server. Do make sure you have loaded the same data range. If there is a difference, then that can also lead to a difference.
EMA is not there in zerodha chart studies section?
Its there, Neeraj. Request you to check again.
Hello Sir,
What to do if moving average is giving signal to go long but candlestick patterns are giving signals to short.
In this case, you will have to take a call by considering your trading strategy. If you are looking at long term averages and intend to hold for long, then consider the MA. If the intention is to do a quick trade, then go with the CS pattern.
Hello,
Few ques
1. For all the indicators length depends on chart frequency right? If we are viewing 15 min freq chart then all the parameters configured will be calculated in minutes. Like wise till we use the chart in minutes it remains the same and once we change frequency to hours then all parameters are changed to hours?
2. During intraday trading, let\’s say we got one crossover for buy trade and later to exit the position what would be the target if no cross over happens again? Square off at end of the day or S &R ?
3. For intraday trades, once we enter I understand we need to set SL and target. Do I need to set a limit order as target to exit?
1) Yes, the chart adapts to it.
2) Once you initiate the trade, just track the target. Dont mix up with other signals
3) Limit is better, especially in cases where the stock is illiquid.
This is within kite, zerodha only
Got that.
HI Karthik,
Just a quick clarification, was going through some scripts suddenly one thing got my attention in UPL. The DEMA200 for UPL on chartiq is 475.41 and on Tradingview its showing 470.14- difference of 5 points which is huge when trying to set up a trade around the 200DEMA.
checked with one of my friend in his charting software (he is using a desktop application of another broker and the same script 200 DEMA is 470.06. All are NSE only
SMA values are same but ema are different, please suggest which one to rely chrtingiq or TV,…
I\’m surprised, charts are served from the same internal system, so both platform should reflect the same. Anyway, I\’ve highlighted this to the team, they will check and get back, and I\’ll post an update here. Thanks.
Dear Karthik,
When I try to plot 200 day MA on the chart, the line is differing in ChartIQ and Trading View.
Which one we need to follow and how can they differ.
Please help me out.
Thanks.
Can you add more data points? This should not happen assuming you are looking at both ChartIQ and TV within Kite.
i did\’t understand this statement which creates confusion so please help me to clarify.
Here is an example of a 25 x 50 EMA crossover. There are three trading signals that qualify under the crossover rule.
needless to say, the MA crossover system can also be applied for intraday trading. For instance one could use the 15 x 30 minutes crossover to identify intraday opportunities. A more aggressive trader could use 5 x 10 minute crossover.
Pulkit, can you please specify which part is confusing?
Hello Karthik sir,
In all the topics I found u have metioned that it is very important to cut the loss and get out of the trade when SL hits. And I took bad trades and lost money .But when I compared the price after weeks each and every share price has gone up.
So my queston is that is it really necessery to put SL and get out o the trade ?? As If i hold it for few more weeks the share price is going up .
I am a beginner and have been trading for over a month now .
This happens, but in the long run, sticking to a SL helps you protect your capital and sustain through. So always plan your trades by keeping SL in perspective.
Can I make Exponential moving averages crossovers alone effective in making decisions with respect to buy/sell? By following this strategy am I safe to leave out all other indicators and patterns? Could anyone please help in answering my question? Thanks.
Yes, you can use just the EMA, there is no issue with that. In fact, I personally prefer EMAs over others.
Hi, my question may sound dumb, but I know you will be able to clear it so why not,
1) Can we smooth an SMA with an EMA , like for example a 50 day SMA with 100 day EMA or any like any other wild combination?
2) Does this make any sense , if not then why?
3) I got to read the word \’backtesting\’ a lot of times can you plesse explain what does that mean and how does it work?
Thankyou!
1) But why do you want to do this over-engineer a really simple tool? EMA is more than good enough 🙂
2) I\’d like to believe that it does not add any value
3) Check streak.tech, you will get a perspective on backtesting.
In above example of a 25 x 50 EMA crossover. There are three trading signals that qualify under the crossover rule. first two of them are making loss after seeing buying points and selling points and third one makes profit. Am I correct or I am interpreting the chart wrong. If I am right, will it be wise to consider MA crossover little less reliable and go for standard moving avg system and considering each and every trade signals generated by it?
Thanks in advance.
That\’s right Yogesh. No, MA cross over is not less reliable. Whenever there is a trend, these systems work.
How do you set 9 mins and 21 mins EMA in kite? The minimum value which can be set is 1 day
You convert it to 1 minute chart and then you can plot 9 and 12 EMA.
15*30 and 5*10 means EMA..right?
It can be EMA or SMA. Preferably EMA.
What does it mean by 15*30 minute crossover and 5*10 minute crossover?
Assuming you are looking at 5 minutes, then 15 * 30 means 15 and 30 candles crossover with each candle being 5 minutes duration. Same with 5 * 10.
Thank You Sir
Hi Karthik Sir,
Is there any significance in selecting 50- 100 days EMA, and 100-200 days EMA? like 6 months 1 year and 2 years. In other words, what does 25-50 EMA, 50-100 EMA, 100 -200 EMA Signify?
This depends on your trading strategy. 25-100, 50-100, 100-200 are all few popular EMA crossover combo, but there is no need to stick to these presets. You can choose to do 50-200 as well.
Hello karthik sir recently i was studying the moving average, but i have a question. i plotted the 50 day EMA with 100 day but every time i changed the time period the EMA plot also changed a bit. If i take a 1 day chart on kite app the plot is different, if i take 1 month chart then the plot is slightly different. My question is how do i guess the trade in such conditions. What should be the time period?
Also, what should be time period & EMA for intraday trading when there is constant changes/movement in the candlestick patterns.
That\’s right, Sanjay. Different time period, different plots. You need to stick to a time frame that you want to trade with and design trades around that. For example, I prefer to look at EOD charts and trade based on the patterns and indicators on the EOD charts.
what is the difference between hull moving average and exponential moving average. which one is better. for option trading i am using 20 and 50 hma cross. is it correct.
I\’ve not really used the Hull Moving average, hence cannot comment on this.
Dear Sir,
please guide me how to write this strategy in pi backtest script.
SHORT SELL : 34EMA LOWER THAN MOVING AVERAGE(20,LOW,SIMPLE,0) AND ADX(13,0) HIGHER THAN 25
BUY BACK : STOP LOSS: 1 % AND TARGET 1 %
Please guide me it would be helpful for me.
Sorry, this is not the right platform for this. I\’d suggest you speak to the support desk for this. Thanks.
Hi
Say I have short sold one stock at 12000 like bosch and I have kept slm order to buy at 12300. I know slm is market order that gets triggered at my slm price 12300. Say some stupid kept sell order at 12800. though other orders are around 12300 as per depth, does my order gets executed at 12800. My expectation is to buy around 12300 to close position.
I got 5000 loss because of this issue because my slm 12300 order got executed at 12800
Yeah, that is the risk of a market order.
I am wondering if I see chart for 30 mins or 1 hour.
Does EMA or EMA cross still take 9 and 21 in days or will it take on basis of candles according to the chart chosen ?
Is it effective in very short time frame charts ?
If you are looking at 30 mins, then 9 and 21 will reflect the EMA of 9 and 21 candles of 30 mins. Yes, many trader use these EMA to trade intraday markets.
Sir,
What time frame for chart will be suitable for 25*50day EMA and 50*100day EMA?
End of day charts.
Understood. So, even if we are making losses in the small trades, we just have to keep going and wait for the rally where we cover everything and come out with some profits. Am I right?
Thank you for answering this.
Yes, that is the way you\’d want to play a MA system.
Hi Karthik,
First of all, I\’d like to thank you for the true effort to bring trading to everyone\’s reach. This is one of the most sorted tutorials I\’ve ever gone through. Thank you for your patience in answering almost all the questions for such a long time.
I\’ve had few questions regarding the candles, time frames and which mix should be used but it is clear now. I had one other question regarding the entry and exit points while using the EMA crossovers.
1. I\’ve observed that when the short term EMA crosses the long term one, there is usually a very big green candle. By the time I place the order, I feel that the price has reached its resistance and am confused as to take the trade or ignore it?
2. Let us assume for SBI, the crossover occurred at 190.5 and the candle is currently at 194. Should I take the trade at the closing price of the candle or take the trade at market price immediately after the crossover happens?
Really appreciate all the effort and hard work.
1) This really depends on the situation. Sometimes the trade could be genuine and it makes sense to ignore the trade, however, if there is a fresh crossover, chances are that the resistance is not anywhere close by
2) Yes, you should because the philosophy with a MA system is that the trend will sustain through and the move will be much larger.
Hi Karthik,
Assuming that I go ahead with the 25-50 EMA Crossover system and let\’s say today in the day when 25 day EMA crosses the 50day EMA but the current day is a red candle day? Should one go ahead and still buy the stock even if it\’s a red candle day?
You should base your buy-sell decision based on candles, MA is an overlay on the price action. However, I do know traders who only follow MA system, but these are people who have thoroughly backtested and know the behaviour well.
Please tell how to add Exponential Moving Average in Zerodha kite, i m using the chart, \” ChartIQ\” in my zerodha platform…??
Please click on studies and select the moving average you need.
Sir, while seeing the charts from the perspective of moving average crossover system does the rule of EMA being greater or lower than the current market price matters?
Yes, you need to see the latest price wrt to where the average is. It gives you a perspective on the trade.
You said;
“ The outlook is bullish when the current market price is greater than the EMA. The outlook turns bearish when the current market price turns lesser than the EMA”
Which EMA ( time period ) has to be considered, relative to the stock price, to deduce this ?
Thanks and regards,
Sudhir Kochhar
Selecting the EMA depends on your trading style. If you trade EOD, then maybe start with 9 day EMA over 21 day EMA. You can improvise on it.
Hi Karthik, Which time frame chart and EMA Crossover, i should use for swing trade ?
EOD is best, I\’d suggest you start with 9 x 21 and build from there.
Hi Karthik, I understand that EMA crossover analysis will not work well for choppy market with no trends. In order to avoid getting into a sideways movement, which candlestick patterns will be good to look along with this?
In a sideways market, it is best to look at dow patterns along with things like support and resistance. These are the best indicators of a breakout or trading within the range if that\’s what you are looking for.
If I take 15 mins candles
What is difference between applying 5*10 and 15*30 crossover
Does 15*30 generate accurate signals than 5*10
Or
Does 15*30 gives cross over late than 5*10 ?
You cant comment on the accuracy. In general, higher the time frame i.e. better is the quality of the signal. So 15*30 is better than 5*10.
Hi sir
Your tutorials are too good.
But your answers on this cross over are very confusing
Do we have seperate crossovers that we need to use for different time frames like 5 mins,10 mins and 15 mins ?
Or we can take any cross over like 5*10 ,15*30 or 9*21 and can apply on all time frames like 5 mins 10 mins and hour
Pls clarify clearly
Please do check the previous comments.
Hi sir,
Your tutorials are awesome.i have learnt many.
But somehow your answers to the cross over and time frames are very confusing
You have mentioned needless to say we can use 5*10 and 15*30 for intra dat
I have understood that 5 means avg of 5 candles and 10 means average of 10 candles but which time frame is it 5 or 10 or 15 or 1 hour ?Many people has same doubt and many are not clarified please mention clearly
I\’ve cleared this in previous few comments.
The time frame can be any – if I\’m looking at 10 mins then a 5*10, implies that it is 5 candles (10 mins duration) average and 10 candles (10 mins duration) average.
can you enlighten me, why is 50 day ema(black line) in the chart of Bank of Baroda longer than the 100 day ema(short line).
Thats because the 50 day shows the trend, its more reactive to current prices.
In one of the comments you said, moving averages is also a kind of checklist. They don\’t need any other confirming factors.
So, which one is a better checklist: moving averages crossover or price action(S&R and candlestick patterns) ? And, why ?
Like I\’ve mentioned, candlestick and S&R take precedence because they represent price action, MA is a system build on the price action. However, I\’d prefer MA over another indicator.
Hi sir
You told 9*21 is best for intraday but u haven\’t specified which time frame
9*21 Best on which time frame?
On 1 minute or 5 mins or 15 mins
Please clarify which time frame u were referring to
You can use this across any timeframe, Madhavi. There is no restriction on that.
Hi karthik
You mentioned at many places 9*21 is good.
Is 9*21 applicable for 1 minute, 10 minutes, 15 mins, 30 mins
Or should I consider a different cross over for different time frames?
Please clarify
Can you give example like this
For 1 min you need to use 9*21
For 5 mins you need to use so and so
For 15 mins you need to use so and so
Yes, you can use 9 * 21 across any time frame.
Yes, you did. Thanks
Hey Karthik,
Firstly thanks for this content, it is really helpful.
I\’m confused about how can I use the 15 x 30 minutes crossover? Like how can I input the duration in EMA in minutes? Or you\’re just suggesting using 9 days EMA over 21 days EMA (or some other combination) on 15 minutes candlestick chart?
Yes, I mean you have to use a 9 and 21, 15 minutes candles. Please check the previous comments, have clarified this.
Hi, I want to know if I could use pi to back test these moving average strategies without having coding skills ?
One more question: Is it really possible for a system trader to be profitable in long run if he/she blindly trust that system ?
I\’d suggest you use streak.tech for backtesting.
Understood. Thanks.
Welcome!
Hi Kartik,
I have a few doubts. Please clarify them.
1. In the case of Swing long trades, how can one predict the exit point (faster EMA crossing below slower EMA) ? Is it even realistic to think so ?
2. If not, then does this imply that one has to regularly keep track of the chart during entire multiple sessions until the selling signal appears ?
3. And how to use EMA for short positions ?
1) Yes, you can track this and take a call to exit
2) Yup, you need to keep track of the charts
3) The same way you;d for a long position, its just that the direction of the trade reverses.
hello sir, can you tell how do i screen stocks for intraday
If you are new to markets, I\’d suggest you stick to the Nifty 50 universe.
Karthik Rangappa says:
June 9, 2020 at 8:04 pm
Crossover is the crisscrossing of the moving averages line. 15×30 minutes means the moving averages here are the 15 and 30-minute averages. It can be EMA or SMA.
Hi Karthik , Your above explanation is incomplete without specifying the TF ( i.e. the timeframe of the candle ) .I really do not know what do you mean by 15 X 30 mins ?Why dont you simply clarify what is the TF and the periods X & 2X .e.g. If 15 mins candle TF is taken then 9 & 21 SMA or EMA is simply MA of 9 candles of 15 mins TF & 2nd MA of 21 candles of 15 mins TF .pl. correct me if I am wrong. And also request you clarify this in little details as too much confusion has been created on this.
Tapas, I think I clarified this in one of the queries above. Anyway, what you have said is correct. By 15 and 30 I mean, a 15 candle and 30 candle average of the candle series which has a 15 minutes time frame.
Can you give me some insight on how high length of MA and how difference in the 2 lengths of MA increases or decreases accuracy in intraday trades.
I\’m sorry Prajwal, I\’m not sure if I understand your query completely. Can you share more context?
thank you sir.
Good luck, Khushabu.
Not a problem sir thank you. one more request can you please share some tips for indraday. I know its very difficult to judge market in intraday. still if you can share some your experience. In varsity, I found some discussion about Intraday. However there is no separate chapter for Intraday.
Thank you.
All I can say is, ensure your costs as low, know your plan very well (and stick to it), do not overtrade, know your stocks well, and finally do not over leverage!
Sir, thank you. Understood now.
Much appreciated your guidance.
Stay safe!
Good luck and apologies for the confusion 🙂
Sir in the last chart the first two crossovers will not be a profitable trade I am I right and then can we add this moving average system to our checklist as fourth point
MA is a system on its own, no need to add other checklists to it 🙂
Sir thanks for clarification. The statement below is little bit confusing. I can see many people have asked the same query. Appreciate if you can provide more details so every one doubt get cleared. As per below statement I understand 15 x 30 minutes crossever means I need to select either 15 min candle form chart or 30 min candle frame chart and select EMA one period 9 and second 21. Please correct me if I am wrong.
For instance one could use the 15 x 30 minutes crossover to identify intraday opportunities. A more aggressive trader could use 5 x 10 minute crossover”
Please also confirm if below is correct :
For Intraday (on Kite plateform): 1. 10 or 15 min candle frame is good. This is on Top side.
2. 1 Day to selected for Intraday. (which is on down side) 1D, 5D, 1 M etc
3. Two EMA crossever. one for 9 period and second is for 21 Days and look for crossover.
My bad if I\’ve confused everyone. Here you go –
1) The chart can be either 10 mins, 15mins, 30 mins, 1 day, 1 month or 1 year. At any given point it can be only one of these charts
2) Let us assume I select 15 mins chart here. On this chart, a 9 x 21 EMA means I\’m taking the rolling average for nine fifteen-minute candles and then taking a rolling average of 21 fifteen-minute candles and plotting two moving averages on 15 minutes chart.
3) The method to calculate 9 and 21 fifteen minute average can either be a simple moving average or an exponential moving average. I prefer the EMA.
4) Yes, as you said, 5 x 10 is for aggressive traders, 15 x 30 is for less aggressive traders.
5) You buy or sell based on the crossovers as per the logic is explained in the chapter.
Sir, what do you mean by 15 x 30 minutes or 5 x 10 minute crossover? Are 15 and 30 EMAs that we should use?
Crossover is the crisscrossing of the moving averages line. 15×30 minutes means the moving averages here are the 15 and 30-minute averages. It can be EMA or SMA.
Dear Sir, I was reading Varsity and your comments above However I dint understand below :
\”For instance one could use the 15 x 30 minutes crossover to identify intraday opportunities. A more aggressive trader could use 5 x 10 minute crossover\”
I selected two EMA. One 9 day and 15 day but how to selectt EMA \”15 X 30 Minutues\” or \”5 X 10 mins\” Where is setting.. I cant find it on Kite. Appreciate your guidance. If possible can you show chart screenshot.
Thank you.
There is no special wherein you get to select 9×15 MA. You just have to overlay 9 and 15 EMA on the chart, once loaded look for crossovers.
Understood Thanks! 🙂
Hi Karthick,
Could you please clarify one point? When you say \”no. of days\” of MA, is it the days or is it the trading session? I mean, if I choose a daily chart, and if I choose a 100 day MA, then it is avg. of 100 nos. of daily sessions. But If I choose weekly chart, then, is it avg. of 100 nos. of weekly session or is it avg. of 100 nos. of daily sessions plotted on a weekly chart? Like wise if I choose a 15min chart, then is it avg. of 100 nos. of 15 min session or daily session plotted on 15min chart?
Please clarify.
It is the number of the session within the selected frequency. For example, if you choose 100 weeks MA, then it factors in 100 weeks of data. 100 SMA over 15mins is the simple average of 100 15 minutes candles.
hi karthik.
1.index mf are actively managed funds or passive managed funds .plz clarify
2.have u written any chapter or article on it .
1) Passive
2) Will be updated today/tomorrow in the Personal finance module
hi karthik
u r saying index mutual fund or index etf or mutual fund .plz clarify
u have writen
2. Index MF if you ask me.
Index MF. Unfortunately, Index ETF is not liquid enough.
Moving Average is best indicator i used in trading.
https://www.youthrelated.com
hi karthik ,
1. i want to know an average investor should invest directly to stocks or not .
2. if no then plz tell which are instruments are best for him for long term 20 years +
(MF INDEX FUND ETC ) for optimum return of 10 to 15 percent per annum.
ur views plz.
i really like ur quote .index fund has decade old shelf life 🙂
1) Depends on how you define average 🙂
2) Index MF if you ask me.
hi karthik .
if i sell call instead of puts .wat is ur view
It depends on volatility and the associated premium. If the market is conducive for it then you have to opt to sell rather than buy.
hi karthik.
suppose i have taken a long futures position in marico or any another stock futures today.i want to carry my futures position overnight .
plz tell me how to put the stop loss in it and how to hedge my position (best way )
You can carry it forward as long as you have the necessary margins. Also, you can hedge long position with puts 🙂
hiii sir,
I have doubt regarding combination of indicators,
1. according to you, what would be the best combination of various indicators for intraday trading on 15min chart? suggest me 2-3 indicators. on 15min chart ma cross should be 9*21 or 25*50?
2. and I experienced at the end of the month like in last week market is kinda unpredictable. I am newbie so should I avoid trading in the last week?
1) I wish I had an answer for this 🙂
2) Not really, the market is unpredictable all the time and not just the last week 🙂
hi karthik.
i applied macd tomorrow but it is giving wrong signals.
yes will join ur session today for sure .(gold)
option strategies from the man itself (karthik) a treat to learn .
ur concepts and method of explaining is really nice and clear
I hope you liked the session, Ankit 🙂
hi karthik ,
can u plz tell me how can i ride the trend today in nifty and bank nifty .from 10 am the trend is upwards .how to identify it at around 10 am or wat is the processs (follow) to ride the trend .beause at 10 am u can not judge the trend will be upwards .
i have also atttended ur nse webinar(gold) .ur nice and soft spoken always .plz answer .
Ankit, I\’m glad you attended the session, hope you liked it and I hope you will join the session t\’row as well.
As far as the trend is concerned, you have use techniques like MA or MACD and get a sense of where the market is heading. Of course, you can look at the candlestick patterns also,
My Question is that if we follow the moving averages crossover for taking a trade, in this scenario what will be our targets on a particular stock.
For e.g. if 9EMA crosses 21EMA towards above, it is time to take a buy trade.
But what target we need to keep while trading.
You can use S&R to set targets and stoploss.
Hello,
My question is regarding 5min*10min crossover.
keeping period as 5days and 10days in EMA on the candlestick chart of the time frame 5min will give the result right?
While going for a horizon of few weeks, I put EMA studies of 21 days and 50 days. I am using EOD Charts.
Now, I am plotting MACD signal line(12,26,9) as well. Can I do that for the same trade?
As the time frame are different for both – EMA has 21 days and 50 days whereas MACD is (12,26,9)
Yes, this is ok as long as you are looking at EOD charts and thinking of a short term trade. The time frame is not different, even MACD is plotted on the EOD chart.
Hello,
In section 13.3, for the first chart,between B3 & S3 (@highlighted as \”ignore\”) the current price seems to be less than the MA. This is an indication to sell right? Is there any reason to ignore ?
Thanks
Yes, if the current market price is below the MA, then its a sell. However, it depends on when the crossover has taken place and how below is the CMP wrt the MA.
While going for a horizon of few weeks, I put EMA studies of 25 days and 50 days. So, for that I need to keep the frequency of chart as 1 Day, Am I correct with my understanding
Yes, that\’s right, stick to EOD charts.
Needless to say, the MA crossover system can also be applied for intraday trading. For instance one could use the 15 x 30 minutes crossover to identify intraday opportunities. A more aggressive trader could use 5 x 10 minute crossover.
Sir,
moving avg least value is 1 day ….how can I apply 15 * 30 mins cross over ?
Or is that I have to keep 9*21 days crossover with 15mins time frame ?
confused sir .
U said we can change the setting in chart field ..i m not able to find that chart field?
plz guide
thank u
You just have to change the time frame to any intraday frequency – 5,10, or 15mins chart.
I have below questions on different chapters-
1) Ch-Volume
a.How you plot average line on volume bars?
b.Is there any option in pi to plot this line?
c.Is that average line which you plotted on volume bars is moving average line?
2) Ch-Moving average
a.which time frame I have to select and how many candlesticks needs to be load?
b.Which type of candle stick I have to use?(e.g. Heikin Ashi, Candle chart,kagi)
c.As you mentioned above, \”9 day EMA with 21 day EMA – use this for short term trades ( upto few trading session)\” few trading session means what upto some days,hrs or minis?
It is best if you ask these question in relevant chapters, will help others as well 🙂
Volume –
1) Select the field as volume.
2) Yes
3) Yes
Moving Averages –
1) Depends on your risk and reward temperament
2) Candle works
3) End of day candles
FOR INTRADAY
If the market is UP(Green) for the day, should we short sell stocks using Averages (i.e. go against the market? Or should I buy the stocks using Averages (Going with the market)?
It is always a good idea to stay with the trend and not against it, unless you are absolutely sure about what you are doing.
If I am using 15 min chart for Intraday, which is the best combination for EMA?
You can try 9 x 21, to begin with.
I have 2 questions?
Q1) While applying moving averages, does the \”PERIOD\” in the zerodha software means that we have to choose number of candles to apply the averages?
Q2) If \”PERIOD\” does not means number of candles, then How to apply 9 and 21 EMA on a 15 min candle?
1) Yes, you need to choose the timeframe – EOD or intraday frequency
2) Hopefully the first answer your 2nd question
Hi Karthik,
Is there ere any training or write-up on how to lay EMAs on a chart?
There is nothing much to it, you just have to choose price field to overlay.
Hi Karthik, please correct me if I am wrong, as I am a bit confused.
If I want to participate in trading over say a few days to 1 or 2 weeks (ie. buy and sell stocks within 1 or 2 weeks):
– To calculate S&R, I will look at EOD charts for at least 6 months data.
– To calculate moving average line of volumes, I will look at last 10 days volume.
– To recognize a prior trend for a candlestick pattern, I will look at last 5-7 days(ie. trading sessions)
– To create a MA crossover system, I will use a 25 day EMA with 50 day EMA on EOD charts for at least 3-6 months data.
Thank you so much!
1) Yes
2) Yes
3) Yes
4) Yes
Perfect 🙂
So please guide me
For Intraday which is best crossover ?
9*21 or 15*30
Same
Swing trading which is best ?
For mid term trade which is best ?
For long term which is best ?
Also can we short sell on this crossover.
Intraday – 9 * 21.
But honestly, I can\’t give you the answers for these. You will have to work with your own risk-reward temperament as arrive at what works for you.
What should i type in the value field of EMA for a 5 minutes moving average line?
Nothing as such, 5 mins EMA implies you are choosing 5 mins time frame.
There is a suggestion that we can use 5 MINUTES EMA for intraday. But how am i supposed to enter EMA length in minutes…I mean a value of 1 means 1 day right? So how to draw a EMA which shows data of minutes instead of days?
YOu can change the settings in the chart fields.
THANKS
Hello Karthik,
Very Nicely written and easy to understand.
However, need your help in understanding on what time frame do we have to set the ema to get the desired results for swing trading, for example setting 9×21 or 25×50.
Thanks in advance!!
Regards,
Suresh.
For swing trading, I\’d suggest you use slightly higher term averages – something line 20 versus 50. Of course, you can backtest this and verify if its working for you – https://www.streak.tech/
Dear Sir,
I am aware of ET, but what is HBT?
Is it Hindu business times?
Business Line I mean.
Dear Sir,
If we remove a few data points that are highly volatile while calculating the EMA. Does it lead to better predictability?
Hmm, it smoothes out the data, but that also means you are tampering the data, which you should not be.
Dear Sir,
Could you plz tell suggest some business news sources that would better insight of companies and their management.
ET and HBL do a good job, Saurabh.
How do I get 100 day or 200 day Exponential Moving Average Line on Zerodha – Kite App.
I am able only able to get length and offset option in MA and EMA. Nothing related to period.
Earlier there was option under studies option to change period but now instead of studies we have indicator with no option to change the period in MA or EMA.
Please advice. I am unable to install PI due to some issues in my laptop.
I think its best if you call the support desk for this, Arjun. Will be hard to explain here.
Sir,
While analyzing \’5 min\’ chart and moving average period is set to 10. what does it mean?
will it show moving average of 5×10= 50 minutes or 1×10= 10 min.?
It is the 10-period average of the 5 mins candle.
How to get \”Smoothed Moving Average\” on Kite chart? There are many option for Simple moving average, exponential Moving Average & many others, but not able to find settings for Smoothed Moving Average.
Please guide
Did you check both ChartIQ and TradingView?
hello sir,
U said we can use 15*30minutes (MACD) for intraday
MACD settings are limited to days only .
how we can convert it into minutes.
Plz guide
You can change the chart period to intraday periods.
Dear Sir,
Thank you for valuable details explained clearly.
As i am beginner i still have some questions. Please help to clarify those.
I have Three questions in this chapter
Q1: In the section 13.3 first diagram, it is shown once the MA line is crossed by the CMP (Price fallen below the MA), but in the diagram, it is mentioned as \”Ignore\”. Can you please tell me what is the criteria to ignore such cases?
Q2: In the section 13.4 last diagram, the second buy signal (cross over point to buy), and corresponding sell signal (cross over point to sell) leads to loss in the trade. Is it to show the intention of the trainer to tell that there can be loss making trades also Or is it profitable trade. From my understanding it does not look like profit making trade.
Q3: In Continuation to Q2, can you please explain how to we place trade set up with such MA (cross over indicators). By Trade setup i mean entry point, exit point and stop loss. If this is already answered in forth coming chapters please ignore this Q.
Thanks & Regards
Praveen Aruru
1) I\’m unable to spot the ignore bit, can you please tell me which diagram you are referring to?
2) The thing is that you will know if its profit or loss only on hindsight. In real markets, you need to act as soon as the price crosses over the MA, hence one would have close the trade.
3) The set up is explained in this chapter only no?
How do you plot a Smoothed Moving Average on Kite chart? I see the option for Simple moving average, exponential Moving Average & many others, but not able to find settings for Smoothed Moving Average. Thanks in advance
I need to check this. Btw, a MA itself is smoothening out the series, right?
sir, in 100×200 EMA cross, how to identify buying and selling position, I\’m little confused like, EMA should be 100 and EMA cross should be 200?? please explain.
If 100 EMA crosses over the 200 EMA, buy. Sell otherwise.
Thanks Karthik and kudos to you guys for providing such an awesome material.
Happy learning, Vasu!
Does the moving average system eliminates the need to set target price while trading? As my understanding of this chapter says that we sell the stock only when exit signal is triggered by the MA system.
Vasu, the MA system does not give you a target, however, comes with an in-built SL mechanism. The system allows you to stay in the trend as long as it lasts.
I do not see a EMA option on my indicators in the Kite app. How do I put the EMA?
Look for moving average and change the type to exponential.
What type of view and studies should I set for tracking smart money in stocks ? For eg. Does viewing 30 min chart of a stock for 9 day EMA and 21 day EMA crossover on closing price with 10 day SMA on volume good enough ?
You can track the FII and DII inflows for this, Gaurav.
Hi can you tell the combination for intraday trading as i didn\’t get the meaning of 15*30 as mentioned above.
By 15 * 30, I mean 15-minute cross 30 minutes moving average.
Hi Karthik,
Thanks for the detailed explanation of each and every concept.
I am a bit confused between mean reversion and momentum strategies. Chart patterns discussed here are reversal patterns.
My questions are
1) Are reversal patterns part of mean reversion strategies?
2) Can be use moving averages for mean reversion strategies?
Thanks
1) No, patterns are not related to mean reversion. The indicator Bollinger band is a good example of mean reversion.
2) No, MA is a momentum indicator, not mean reversion.
Hi,
You are right, I trade 50×120 and usually the megatrend takes care of the losers.
My concern is that the losers are sometimes too big, of course you can never get a loser free trading system.But you do want to minimise these losses as much as possible.
Can you suggest a stop loss for a moving crossover of 50×100 over daily or weekly timeframes?
Jay, you are right…there is no fool proof system 🙂
I\’d suggest you stick to the daily timeframe.
Hi
Sometimes when I use the crossovers, there is a late entry. That is the peak has already been reached by the time the moving average crossover occurs.Next sell of begins.
This sell off continues till the cross over is complete resulting in big losses. So by using a crossover I am actually entering into a losing trade. It would be great
a) if you had tips on how to avoid these kind of crossover situations.
b) Also what kind of stop loss do you recommend for the crossover strategies. I generally trade daily or weekly timeframes.
Jay, this is the nature of the MA system. It makes you trade several average/loss-making trade before you hit that 1 megatrend trade. The thing is that you will have to take up all the trades and you cannot pick and choose which one to trade and not to trade…since you\’ll never know which trade would result in the megatrend trade. Having said so,
1) Use slightly larger term averages…something like a 50 x 100
2) Stick to the SL suggested by the system.
Hi Karthik,
I see there is a moving average type \”time series\” while adding a moving average indicator.
Can you please explain me about how zerodha calculates that TSMA?
It would be helpful if you could share the formula or related links where i can find the explanation.
I have searched internet but not able to find how TSMA is formed.
Thanks,
Shanmu
I\’m not sure about this, need to check. By the way we do not compute any of these indicator values. It either comes from chartIQ or Tradingview.
January 16, 2020 at 10:17 pm
Dear Karthik,
Can i add the following parameter to your chart
StochRSI(14,14,E,3)
RSI period =14
Stochastic period =14
Average Type = E
Average Period = 3
Please let me know how to add the following parameter to the chart
Hello sir,
Thanks for the immediate response.
Can you suggest some books that specifically deal with the indicators and has all the calculation behind it ?
I am sure they are not needed for the trading part, but I would like to learn more about it.
Hmm, there are no specific books on indicators. However, I remember reading/seeing a slightly elaborate section on indicators in this book – https://www.amazon.in/Technical-Analysis-Trends-Robert-Edwards/dp/0814408648
Hello Team,
Happy New Year.
I am new here and would like to know as to why standard EMAs are used for trading. Say why 9 x 21 day EMA instead of 8 x 20 day EMA? Is there a calculation behind it ?
There is no specific reason to choose 9×21 over 8×20, its just a matter of preference and convenience of using them over the years.
Hi Karthik,
Please reply,
are these,
9 day EMA with 21 day EMA –
25 day EMA with 50 day EMA –
50 day EMA with 100 Day EMA –
100 day EMA with 200 day EMA
automatically created in zerodha upon setting some settings or do we have to manually draw this MA graph or is there any different software available for it?
Regards,
Kiran
Kiran, you will have to specify this when you load the indicator.
How minimum can you go with crossover emas in terms of time intervals ? Can it be 5 or 10 seconds also ? And will the same 9 and 21 apply for small and large emas ?
Rohit, it has to be in multiples of 1 minute.
Mr Karthik
when ive opened a day candle with two EMa cross over (short, long) and then change the candle to minutes candle, does the EMA cross also change automatically to min or is it reqd to be done manually. i,m talking abt looking at charts on kite
thanks
Vikas, it changes but takes upto 30 secs.
how do you decide how many day averages you want
No rule for that, your market experience guide you.
Mr Karthik
totally a beiginner in the world of trade.
beginning is reading ur tuorials and opening of acct on zerodha.
can u tell pl if there is any tutorial onusing the zerodha platform and how to open the various MAs, vol etc u hav covered till now
thanks
Everything we have has been put up online, here. We don\’t have physical classroom sessions.
For intraday as you have mentioned 15 x 30 minutes exponential moving averages. By this, I have to set the period as 15 in one moving average and 30 in another moving average. so what should be the candles sticks for it 15 minutes or 10 minutes or any candlesticks based on our needs?
15 minutes is good enough, I\’d suggest you start with this.
hello karthik
i am very confused while apply ma crossover on a crude oil or silver bcz if i am using longer EMA than it does not seems like profitable and if i am using shorter EMA than there is so much trading signals in a single day so here again a major problem bcz in MA CROSSOVER we are not selecting the trade bt we must trade so please help me in this condition.
Rajesh, the thing is that you cannot force fit a trade 🙂
I\’d suggest you continue to use long term average lines and wait for the right opportunity to get into a trade.
And one more thing when the cross-over happens the market is already up or down by a very huge margin. How to make sure that we are not entering when its a peak of that rally.
You cannot be sure about that, you will have to take the trades as suggested by the system.
Dear Karthik,
When I use the moving average line of say, 9 and 21 days, your advice has been to keep the trade till the 21 day line crosses the 9 day line. With this strategy, when I sell the stock, it may not be at the peak, and some profits maybe lost. Is there any reason it is suggested to keep the trade till the condition is satisfied?
The thing is that it is tough to capture the entire rally since it involves timing the market. Given this, even if you manage to capture 50% of the rally, then its job well done. This is what the system helps you do.
Hi,
What is the best time period for 9*21 EMA for Nifty Intraday. (1,3,5mins)?
To begin with, you may want to check the 10 min chart for this.
but for 9 ema and 21 ema putting 30 min candle is giving me a perfect result . I want to ask what should be my candle patten and ema cross format for a positional trading like keeping a stock for a week and then selling it
Yes, its best if you can hold the position for a few sessions.
there are arithmatical mistakes in the pdf version of this module,also some charts and topics are not there.
Will review it. Thanks for pointing.
Hello,
first of all thanks for this wonderful explanation. I wanted to ask that what should be candlestick pattern for Ema cross of (25,50).Like i should keep the candle for 1 day or 1 week. Because i dont have time for intraday buying and selling.I just want to buy on monday a good number of stocks and sell it on maybe friday or next monday. Like a MID TERM POSITIONAL CALL.
I\’d suggest you look at EOD candle for medium term or swing positions.
Hi Karthik,
As moving average cross over system gives the signal once the trend is established, we are already entering into the trade at higher level than moving average crossing point ( we miss some initial part of bullish trend), again during sell time, once the bearish trend established we will wait for the crossing point and again we miss some points from high ( we exit after some days of bearish trend).
Basically we are missing some trend at entry and exit level. Is there any better system to overcome this? Am I missing some thing here?
Thanks
Satya.
Hmm, I understand. However, it is not possible to capture the trend in entirety 🙂
Anyway, to overcome this, you can overlay other momentum indicators such as MACD, but that will just start complicating the system.
Hi Karthik,
How to check the intraday charts, if there is any link to go through, please share.
Thanks
Satya.
Satya, just change teh frequency to either 10 of 15 mins, and thats the intraday chart.
Hi Karthik,
Since the average is considered based the previous values also, I have noticed significant difference between the short term moving average line crossing point and spot price.
If we want to go long based on 9*21 five minutes candle chart for intraday trading, when the short term moving average line crosses the long term moving average line, we are supposed to initiate the trade, but the spot price is far higher than the crossing point. Still do we need to initiate the long trade though it is higher than the crossing line.
Thanks & Regards
Satya.
Yes, because the idea here is to trade the moving average and not the spot price directly.
Dear Sir,
Thank you so much again for the wonderful modules. Its very simple but very powerful.
I have two doubts here
1. can we do shorting when the short term moving average turns lesser than the longer term moving average also?
2. Can we initiate a trade only with EMA?
Please clarify…
1) Yes, you can
2) Yes, you certainly can.
Hi Karthik,
If we want to take the trading decision for intraday on 9 * 21 on 5 minutes chart, Do we need to wait till it generates 21 five minutes candles (i.e 5*21 =105 minutes)? How to take trading decision in the first one hour based on 9*21 – 5 minutes candles?
Thanks
Satya.
Hmm, yes. But then you can always look at the intraday charts, which are continuous.
Sir in 10 min EMA & 10 Days EMA i understood that in 10 Days EMA lookback period is of 10 days but in 10 min EMA the lookback period is of 10 minute candle but for how much time/days?
Vikas, just like the 10 day EMA, the 10 mins EMA looks at the last days candle to evaluate the 10 min EMA.
you said that In case to avoid the sideways market the \”MA Cross over should be high \”.
Instead can we use ADX Indicator to avoid sideways market
Yes, ADX too is a momentum indicator, you can use this to identify trending and sideways markets.
About how can I setup 15*30 min EMA in zerodha?
Sujin, do check this thread – https://tradingqna.com/t/how-do-i-add-a-moving-average-overlay-on-volume-in-kite/13565
Can you please explain about this?
About?
My doubt is how to calculate Length in MA. Can anyone clear it out for me?
The length (look back period) I suppose…this depends on your trading style. If you are doing intraday, then you should be looking at say the 10-minute average. If you are doing an end of the day, then maybe a 50-day average will help.
How can I setup 15*30 min EMA in zerodha.
You can load both the EMAs on the price data, Sujin.
How can I load 21 sma band (high to low) in zerodha kite. Which option I should go?
You can load the SMA, need to check on the band.
Please let me know if any pre defined function exist for hull moving average. I have find out SMA, EMA and TMA for moving average screener. But I am unable to code for hull moving average function in zerodha PI…..pls help me
I\’m not too sure, let me check this up.
Hi Karthik ,
I had gone through complete TA and Options Theory for Professional Trading ,among that ,the concept which have more confidence on Candlestick pattern(15 min time frame ) and EMA (5*10) that trading is possible with these concept .Moreover i am trading for past 6 month based on EMA crossover .
The advice which i required from Pro trade like you ,whether i can take this trading as a carrier for rest of the life in discipline manner . Right now i am trading in Bank nifty Option
1.If 5 EMA greater or crossover 10 EMA will take CE as position ,This CE position will be squared off when 5 EMA lesser or crossover 10 EMA
2.If 5 EMA lesser or crossover 10 EMA will take PE as position ,This PE position will be squared off when 5 EMA greater or crossover 10 EMA
Is any thing want to correct me pls
The short answer is no. Trading as a full-time career is too risky and unstainable. Only a few amongst 1000s survive. Do this as a secondary job, but do something which will give you steady cash flow every month.
What do you mean by EMA is 9 over 21 minute candles
I want to know 9 is minute or day
What do means by cross over exactly
Its explained in the chapter/comments itself, Pankaj. Can you please read through it again? Thanks.
Dear Karthik ji
Which crossover either 9 x 21 EMA or 5×10 EMA on 1 hr time frame is best crossover for good profits ?
I wish there was a simple and direct answer for that 🙂
You really have to experiment and figure out which one works well for you 🙂
Dear Karthik Ji
Could pls clarify the below content which was mentioned in your Zerodha varsity in MA chapter ?
\”Needless to say, the MA crossover system can also be applied for intraday trading. For instance one could use the 15 x 30 minutes crossover to identify intraday opportunities. A more aggressive trader could use 5 x 10 minute crossover\”
As per the above if i want to trade on 15 x 30 mnts crossover then which MA should I use i.e. 9 x 21 day on 15 / 30 mnts
or 25 / 50 day for Intraday on 15 /30 mnts or 5 /10 mnts ?
You need to load 15-minute time frame and overlay on it 9 and 21 EMAs. If this does not work, then maybe you should try changing the values. The idea is to experiment and calibrate these to match your risk-reward temperament.
Can you please explain exactly how to place these moving averages on a chart, say for example 15*30 mins for intraday with all the necessary time frames? I also dont know how to select the number of candles for a particular chart.
If you are interested in intraday trading, I\’d suggest you look for at least 10-15mins chart. Yes, you can use 15*30 for intraday with 3-5 days of the intraday chart.
what are field,type,offset and underlay in ploting moving average across a chart is there any tutorial to know in detail about this.
I want to know about 15*30 and 5*10 cross overs
I\’d suggest you ignore the offset bit, it does not really add much value. The rest is explained in the chapter.
Also, if we have to wait for the short average to cross with the longer average again but in the opposite manner of a golden cross (death cross) to exit the position, won\’t that lead to missing of the highest price for exit? I backtested it and many times waiting for the death cross leads to a loss of more than 20 percent. Even in the example chart in the module. The averages don\’t actually cross when the suggested exit point comes (BPCL).
Yes, it will. But remember, the MA system is not about getting the timing right..it is about catching a part of a larger trend.
In the above chapter, it says that you exit the position when the shorter average(eg. 50 day) turns less than the longer one(eg. 100 day) . How do we judge the \”turn\”?
How do we set targets and stoploss here ?
How as in the technicality of placing the order or the identification of these levels?
identification of levels .. is it by identifying support and resistance ?
we use 9 day * 21 day ema crossover for short term trading and for intraday trading in 5 minute charts how much candle do u suggest for better results. whether 5*10 minute candle is better or 15*30 minute is better for intraday trading
5*10 is ok, make sure you look at, at least the last 5 days charts for this.
Today I buy stock of JSW steel and on basis of Bollinger band macd and some 1-2 other indicators.Today is the bearish market and my stoploss is hit.How can I find my mistake in this trade and I took risk to reward as 1:2.
You need to access the overall set up, Akshay. Did it match all the checklist items?
Sir I think 9*21 moving average is better than 9*18 MA crossover is it true?
Not really, what works for you may not work for others. No good or bad MA.
Hello,
Can you please tell me what time frames and crossover EMA\’s are ideal for intraday and swing trading. I am confused a bit.
Thanks in advance.
I personally prefer EOD time frame. Crossover EMA\’s…hmm there is no such thing as ideal 🙂
YOu will have to experiment and figure out what works for you.
Dear Karthik
EMA crossovers in addition to S/R levels you talked about is mixing of two independent strategies. Would it not be better if we take every EMA crossover trade without considering S/R levels so that one big trending trade will overshadow the marginal profits or few minimum losses..because after all we want to ride the trend and it may easily surpass historical supports and resistances in that case leaving S/R levels with no utility in bigger picture scenario.
Sunil, of course it does. In fact, if you decide to follow only EMA, then you should take all signals hoping for that 1 trade which can compensate for all the tiny losses when the mkts traded sideways. No point complicating this by looking at S&R.
My suggestion to look at S&R and EMA was from a very short term perspective.
Thank you Karthik for replying in the most satisfactory manner.
From SHORT TERM perspective, I think it would be right to exit the trade once the target as per S/R level is hit; instead of waiting for one wild swing . Correct me if I am wrong.
Regards.
Of course, you are free to add as many calibration techniques as possible to enhance the profitability of your system!
Hi,
Crossover EMA is explained brilliantly and in easy way. After a long research on crossover EMA, my doubts are clarified in this article. Before reading this study, i was very confused with respect to which crossover EMA to be used for short term trading and for long term trading. It will be very helpful for me if you clarified that which time frame candle should be used for intraday trading.
Thanks.
Ajay, for intraday, I personally find 9 day EMA over 21 day EMA quite helpful. I\’d suggest you check this and improvise on it.
Thanks for reply. But which time frame candle should be used for intraday.
Like I\’ve mentioned earlier, you can start with 9×21 and calibrate as you progress.
on 5 minutes charts??
Maybe 10 minutes chart.
Dear Karthik,
First all let me congratulate you for becoming India\’s number 1 broker, absolutely amazing job.
I can tell you that you guys are the best and nothing can Zerodha\’s trading platform.
All said, there is a small issue ( I think, it\’s small and should be given attention to ). In your Pi trading platform you offer Expert Advisory code for Ichimoku Cloud but the indicator itself is not available in the Pi platform. After many reminders and emails to Zerodha I still get the same reply from you guys to use Kite for Ichimoku.
To be honest when you are planning your trade using a particular strategies/indicator it\’s not very convenient to change platform. You really want to see all the details in one screen so you can make your trading decision smartly.
Also, I guess Ichimoku is consider a very basic Indicator which is available with almost every trading platform in the world.
I just hope it not too much of work and by paying little attention to small details you will make many people happy. I have seen in your Trading Q&A and observed that there are many request for the same.
So, I\’ll really appreciate if you can take this matter seriously and try to help us by providing us Ichimoku cloud in Pi software. At least I can say for myself that I\’ll perform better if it is available for us. Once again please please don\’t ignore my request and hopefully you will help me out with this.
Thank you very much indeed for all you do for us. Really appreciated all the time and energy you put in for us. Please please please don\’t disappoint me on this one.
Regards
Ron
Good to hear from you, Ron. I will pass on this info to the team.
Sir what is market profile and order flow analysis and how important is it I don\’t find any material here on these topics.
I\’ve not written about in Varsity. Maybe I will sometime.
CONGRATULATIONS 💐💐karthik sir for becoming No1 brokerage in India congrats for the whole zerodha team and nithin.
Thank you so much 🙂 I think the journey has just started!
Sir since moving averages are lagging indicators instead of going with full quantity can we go with half quantity because before crossover there will be already trend will be established so instead of going full we can go and trade with half quantity right.
Yes, you certainly can split your cash and manage the trade better.
Hi, I tried plotting the charts after reading the content here, but i don\’t seem to understand what \”offset\” stands for in Zerodha?
Ah, you can ignore that bit, Shrey.
Dear Sir,
Would plz suggest me best strategy for sure shot 30 points in Mcx Gold Intraday??????
I\’d be God, if I could do that, Amit 🙂
According to u, what is best strategy to trade gold intraday??? Which EMA corssover according to u is best for Gold intraday????
Well, trend following via EMAs certainly help, but may not be the best, Amit.
Dear Sir,
How do I use the 15 x 30 minutes crossover on the kite software or app? How should I get the days part into minutes?
Regards,
Sid
Also can I use this for understanding stock movement for option trading? Which one should I use? 15×20 MINS? OR SHORTER?
Yes. Higher the better.
Check the 1st drop down on the chart, you can use this to modify the frequency.
Dear Karthik Ji
I want to initiate trades based on crossover system that too in Intraday time frame only,so when I should I initiate trade?
either after particular time frame candle close is above/below crossover or just immediately after crossover is done?
Can I use 5x 10EMA crossover on 15 mnts time frame or only I should use 9×21 EMA
I read in one of your answers that CS patter should be opt for SL for crossover system ? what is CS pattern?
I will be thankful for your prompt reply.
If you are looking at intraday, then you can initiate this based on a simple 9 and 21 day EMA crossover. You can initiate this as soon as the crossover is done.
Sir,
If I choose a 3 minute candle and select 2 EMAs first of period 5 and second of period 10 then will it be a 15 X 30 crossover pattern?
Please respond. Thank you.
It will be 5×10 EMA crossover on a 3-minute candle.
Hey karthik,
I am new here and it was almost a brain storming session for me to read continiously till this chapter from the first chapter of this module.. but it was totally worth it. I tried to find those single stick patterns and analyse them they were of great help. I Also observed multiple candlestick patterns in various stocks and then they were moving just as you said! And the way you explained these was totally simple as well as descriptive. So thankyou for that.. clearly you have written that with all your heart so it was sooo hard to stop reading it further..
Actually i had a query in moving averages as you said one should long when the faster moving average cuts from below the slower moving average.. so can i do the opposite as when Slower moving average cuts faster moving average from below can i enter into a short position? I tried to observe it and in infosys i observed this two times in current month between 1 dec to 5 dec that if i had entered in a short position i would have incurred a loss.. eventhough the loss is quite less in both cases i.e. almost a rupee difference per share.. to be noted that i have used 9*21 chart in 15 mins timeframe… so i wanted to know your opinion about taking a short position in the exact opposite situation when you suggested to go long.. also please tell me what is EOD time period.. as i cant recall it..
Again Thank a ton for your efforts!! 🙂
Also if i entered in a long position and the faster moving average is way too high than the slower moving average hence i am in reasonably higher unrealised profits.. and then i saw some dojis or spinning tops or a hanging man or any other bearish pattern or even i see selling from the smart money and we know we should trade in the flow where smart money is moving.. but on the other side the slower moving average has not given any signal to settle the trade yet, should i wait for the moving averages to cut and provide me a signal to sell..or settle it at the time i see bearish patterns as if i wait for the faster moving average to come closer or even to cut slower moving average and when it cuts i will realise relatively lower profits than what i could have booked if i had sold at the time of getting a comfirmation from those bearish patterns. Also what will be the stoploss trigger in cross systems.. i think that should be the point where we entered in trade but that can be hit multiple times in some situations where market is not in complete upwsrd or downward trend. Please Correct me if i am wrong here.
In a sense true, Yash. In such a situation you can even trail your profits to lock in your profits and ride the wave.
Thanks for the kind words, Yash. Such encouragement keeps us motivated 🙂
Yes, you can short the stock by all means. However, I hope you are aware that you cannot short and hold the position in the equity market (Spot market). You will have to do this in either the futures market or the options (buy puts).
Yes i am aware of the same. Actually i was thinking about going short in intraday Trades.
I am going to start getting in-depth knowledge of f&o soon with CA final SFM so that i can get exam oriented as well as practical knowledge side by side. Will surely apply these techniques in that segment. Also i tried to apply supertrend 7,3 along with EMA crossovers and i found that supertrend was avoiding the trades that EMA crossovers would have suggested in sideways market. So in such a case i want to know your opinion on which one is better.. supertrend or EMA crossovers.. i thought why choosing one when you can apply both simultaneously.. will there be any limitations that i am not aware of if using these two simultaneously. Also i am having a track on volumes before entering a trade.
Supertrend uses MAs as a core concept. Traders sware by supertrend, but I\’d prefer good old EMA for its simplicity.
Sir to take nism certification varsity modules syllabus is enough for it.
I think this should help.
Sir 9*21 for ema which is period and offset is it 9period 21offset or vice-versa
You can use this at any time period. I personally prefer the EOD time period, even for intraday trading.
Hi Kartik.. I try to follow simple strategy.. Since I am new to Intraday trading, so I have set a target of profit per day around Rs.2500/- per day and maximum loss of Rs.3000/- per trade and Rs.6000/- max loss for a day. This means I stop trading for the day if I gain around Rs.2500/- or lose around Rs.6000/-.
I trade Equity Futures and only in 2-3 stocks because I have been tracking those stocks for a long time and now I am familiar with them.
Its been a week and I have gained around Rs.16,000/- on a capital of 1 Lakh. Its too early to comment if I can make this consistently or not. I would like to have your opinion….
Do you think my money management is fine considering the fact that I am a newbie?
Also it would be great if you can suggest what should I do to move ahead from here?
The risk to reward is not proportionate…in effect, you are risking 6K for a gain of 2.5K. Lets assume you are have been lucky so far…what if you hit 10 straight loss-making trades in a row?
Yes. I understand that now.. Also I think it\’s just my luck till now. I don\’t have a robust strategy which is backtested.
Can you suggest how can a beginner develop his own strategy..? And will you suggest any book for that..?
Its just that there are too many strategies and trying and testing each one might not be possible.
I understand, Anitesh. Why don\’t you start with the time testest ones? Like the MA crossover or the MACD+Candlestick pattern? You can also check https://streak.tech/ for backtesting your strategies.
Hi Karthik,
Moving Average crossovers are mostly lagging indicators. They often cause stop loss to be hit.
What else do you think will give better gauge of the market before moving average.
Gourav, I personally find MA to be the most veratile system/indicator. The lag is emphasised when the stock is trending, but then when there is momentum in play, it lets you ride and book healthy profits.
Hi Karthik,
What time frame we should keep while plotting the graph for the 9X21 EMA / 25×50 EMA for doing positional trading (time frame of 10 to 15 days).
Thanks,
Manish
I personally prefer the end of day charts for this, Manish.
Thanks Karthik for your reply
End of chart means i need to keep the time frame of 1 D in the chart.
Thanks
Manish
Yes, Sir.
Thanks sir.
Hi Karthik,
Greetings! How to do the set up of MAs in Zerodha? I mean how do i select number of days for shorter and longer MAs for the particular stock ? will the system automatically trigger the \’Buy\’ and \’Sell\’ signals once appropriate conditions are met? Many thanks
The settings for long/short MA has to come from your own experimentation. I generally prefer 9 and 21 day EMA. If you are looking for automatic triggers, I\’d suggest you look at Streak (available for free this month) – https://www.streak.tech/
Hi karthik,
can you suggest best cross over points for BANK NIFTY OPTIONS TRADING?
Im not sure about this, Siva.
Can u help me with displaced moving averages and how to put in kites chart
Sir, can you please tell me more about 15*30mins and 5*10mins for intraday I\’m confused what is exactly 15 or 5. And also can you tell me the best crossovers to consider while intraday trading?
It is a 15 min moving average over a 30-minute average. There is nothing like the best crossover for intraday. You will have to figure out what works for you by trial and error.
Hi karthi,
Can you let me know how we can keep moving average of 15min and 30min in KITE? I can see only days i.e. from 1,2, 3, etc.,
All you need to do is change the frequency to the desired time frame, like 15 or 30 mins. When you load the chart, the first dropdown starting from the left gives you these options.
How to find Hull Moving avarage in Zerodha?
Yes, in Kite, load the chart and select Moving average. Now under the dropdown option, select Hull.
Sir,
Is there any Module for Mutual Funds? I mean how to choose best performing funds?
Not yet, Gaurav. We will include one.
Dear sir,
I just started learning TA, INDICATORs.in our Zerodha Kite, I didn’t find MA CROSS OVER indicator in the studies menu. Where it’s available and at what name?
Thanks sir
You can observe the crossover when you load 2 or more moving averages on the chart.
Thanks sir… clear now…
Good luck, Dhinesh.
Hi, When you said do 15 Minutes X 30 Minutes EMA for intraday. You meant period of 15 X 30 and 1 Minute candlesticks?
I\’d suggest you use 5 or 10 mins chart instead of 1-minute candlesticks.
Hello Karthik,
From INTRADAY perspective for Plotting EMA on 5 min chart I have queries below
1.what are the periods needs to be selected for both the charts so that I could see a crossover happening.
2. What options needs to be selected for \”Field and Type and Offset\”
3. Should EMA be used only if there is any trend observed(Up trend or Down Trend) like today as of 04/12/2018 SUNPHARMA was in downtrend . Please explain this elaborately.
4. What is the difference between Trend and Momentum . Aren\’t both the same
Thank you In Advance.
1) You can start with 9 and 21 EMA on the 5 mins chart, check if this works for you
2) The field is the price. You can ignore the offset
3) EMA is a lagging indicator, it is used to identify the trend after it has gained some momentum.
4) Yes, both are used interchangeably.
Thank-you for the responses above .
I tried the way you had mentioned but i couldn\’t see any crossovers happening either in 5 min or 3 min period . Multiple Crossovers happen only in 1 Min time frame.
Also how do we know if any Trend has already formed without these indicators letting us know . Do we have to look out for any other Indicator in conjunction with this which shows a clear indication that a trend has already been formed and which could allow us to take a stance accordingly.
Anuragh, I\’d suggest you change the settings to see which one works for you. You can always check the rate of at which the returns vary i.e momentum to figure out if a trend is in place or not.
Reg. EMA crossover, it looks nice but one hitch. STOPLOSS. You haven\’t spoken anything regarding it. If it is tight, probably one would get stopped out on a potentially profitable trade. If it is generous, risk/reward ration is not attractive. What is your view on \”what should be the stop loss\”?
EMA (or even SMA), is not the best indicator to identify SL, simply because it gets choppy when the stock is moving sideways . You should opt for CS patterns instead.
Hi Karthik
It seems you love moving averages,me too it rarely fails i will regret why in the early times i did not realized this.These days kite is slightly not giving precise information in its candle bars,and not properly works in first 2 minuts .Anyways it works fine.
Zerodha is the only brokerage firm giving such nice free classes on technical analysis Big thanks for it.
I would like to know if i combine mov.avg with ADX and DI indicator the momentum indicator
sunil k minz
Yes, Sunil, I like it for its simplicity 🙂
You can combine it, with ADX or DI to gain insights into the strength of momentum.
I could not find out the EMA in the studies in Zerodha…. Can you please let me know if it goes by other names
Open the chart in Kite, under the studies dropdown, look for the EMA option.
Hi Karthik!
Can I get to know whats the MACD – MA Convergence and Divergence and how it is beneficial? I understand Crossover is one of the key point of MACD. Can you explain this and why MACD isn\’t included in this topic?
MACD is explained here – https://zerodha.com/varsity/chapter/indicators-part-2/
great sir thanks.
Googe luck 🙂
Sorry, There is no option to edit.
3)SMA,EMA or WMA ?
Hello Karthik,
I am adding 3 rd question,
3) Which moving average would you prefer for swing trading,
SMA,EMA,or EMA ?
I know these depends on us.
I just needed your opinion.
I prefer the EMA i.e Exponential Moving Average.
Thanks Karthik for wonderful blog.
Could you please tell me,
1)Which EMA cross over do you prefer for swing trading,trade which remains approax. for 2 to 7 days ?
2) Which one would you use for swing trading,
SMA cross over , or EMA cross over ?
Thanks.
1) I\’d suggest you look for 9 and 21 or 20 over 50 EMA
2) EMA
where can i get inrtaday charts like for 5mn?
bty. You are doing a very good job
Ram, its available on Kite itself.
Thannks
Thanks
Hi Sir,
1. What is an Offset in a moving Average? What is it used for ? What is the ideal value for this parameter? ( I could see this parameter in Kite).
2.What is displaced moving average?Is it used to forecast the trend?Kindly explain in details.
Offset helps you move (displace) the moving average into the future. There is no ideal value but I see people use 5 days as default offset value. Both are similar.
Hi Sir,
What is the use of offsetting a moving average.In what way it helps in technical Analysis? How to use it ? Can u explain in detail !!
I personally don\’t find it useful either 🙂
whats the line \” Market discount everything means\”? pls explain
It means that price you see on the screen is reflective of all the known and unknow information related to the stock.
You have written-
\”Buy (fresh long) when the short term moving averages turns greater than the long term moving average.\”
Here when the short term EMA turns lesser than long term, can I buy an ITM PE Call, since I know that the price will fall as the smaller has crossed the longer downwards?
The thing with MA is that it can crisscross the signal line a couple of times before the trend emerges…by which time the option may lose its value.
I am thinking of using EMA strategy only when the trend emerges in a 15min chart. Ofcourse what I earn will be very less if the trend reverses immediately but as you\’ve also said, I will make big during rallies.
I am a risk averse trader and have found moving averages will suit me for Option Trading but the only problem is selection of strike price at that moment and the expiry.
1. Should I buy the next weekly BNF (not coming) expiry to reap gains of MA? (But premiums are too high)
2. Currently I take a Long position if available on Thursday or Friday for the coming Thursday expiry and square off in a day or two when the trend reverses, should I not do 1. and continue with 2.?
Chirag, if the strike selection confuses you, I\’d suggest you stick to ATM options.
1) Since you are buying, I\’d suggest you stick to monthly options
2) Buyers need more time to expiry, so better to stick to monthly options.
Ok then I\’ll stick to Nifty 50 stocks and keep scanning them for buying opportunities of either CE or PE with strict stop loss. Thanks! Will keep you posted by August end.
Good luck, Chirag!
Hi karthik,
In the kite chart, the moving average is Simple Moving Average or Exponential Moving Average?
You can choose either of the two. I\’d prefer EMA.
In crossover system, should we wait for both averages to cross each other either buy or sell side? Because sometimes till the averages crosses each other, the profit gets converted into losses.
Its better to wait for the actual crossover before initiating the trade, Archit.
As said regarding taking trades based on moving averages, that we should take all the trades which are signalled , but does the technical analysis check list applies for trading with 50 ema?
While reading your options module regarding choosing the right strike price, the first step was to decide my prediction of the underlying.
In case of EMA, we don\’t predict but go with the flow and make profits as long as the condition of sell does not hit.
How to select a strike price in case I want to trade options using EMA Crossover system Intraday?
If the signal triggers at a point where there is ample time to expiry (like 15-20 days), go for slightly OTM options…else stick to ATM. Remember, the chances of going wrong with ATM options is low. This is assuming your analysis is right in the first place.
W.r.t. Bank Nifty, I\’d consider ample time to expiry as 3days or higher, right?
\’Cos on 9th Morning (Monday) 9AMA crossed 21AMA at around 26500 and if I had purchased slight OTM 26700 if not 26800, then too would have made great money.
Yes, that would make sesnse, as long as you are talking about Bank Nifty weekly expiry.
EMA is working like a charm for me. Today almost at the end of the day, I saw on a 5 min 9*21EMA chart of Nifty Bank creating a long position. Immediately I bought a nearest ITM strike (26800) at 84 and within 6 minutes the same chart of Nifty Bank gave sell signal, made 10 points in no time.
Good luck, Chirag! Hope you have more success in your way.
What is the best time frame to trade positional, say on Friday or Monday in Bank NIfty?
How many days should I consider for both moving average?
Also please suggest a good script that I can chose from Zerodha Expert Advisors page for my above query. Thanks in advance
Try Infosys.
There is no best time as such, Viraj 🙂
For short term, look at 21/9 day average.
In the last chart, after first arrow, if we entered long, we would have lost as the price went down in spite of SMA being above LMA. What do we do in such cases??
Hence the need for a SL 🙂
could u suggest me some recommended and free technical analysis software (reputed) for performing ema and sma, bollinger analysis etc
I cant think of any apart from Kite 🙂
Apart from Kite, I also like chartink.com
Karthik, how about waiting for 5 minutes to confirm if the Short MA is staying above Long MA or reversing and avoid stop loss as the last chart?
5 mins can be a bit too short-term for establishing the trend, Chirag.
For short term trading we can use candlestick data of past 3-6 months with 50 x 100 day EMA?
But which candlestick chart to use as in EOD or 1 week charts for last 3-6 months?
And for long term ie 100 x 200 day EMA we have to use 1 month candlestick charts and data period past 1-3 years?
I\’d suggest EOD chart for this. For long term too, I\’d suggest EOD charts.
Pl tell how to get the 5 x 10 minutes moving average crossover to identify intraday opportunities. Thnx.
Please plot these averages on the price movement and look for crossovers. This should help you with signals.
Zerodha Team, Need your help. I went through the videos, varsity docs, but not confident yet on EMA period setting. I would like to learn about EMA period usage in Kite. Using Kite Suppose I am viewing 15 minute candlestick chart and I have applied two EMA as
EMA with period value 15
EMA with period value 30
1. Can you please tell me what is exactly happening here?
2. Does it mean I am comparing EMA (15min into 15) vs EMA (15min into 30)? i.e., 225 min EMA vs 450 min EMA?
3. How do I apply 15 x 30 minutes EMA on a 15 minute candle?
4. How do I apply 15 x 30 minutes EMA both on a 3 minute candle and on a 5 minute candle on the same chart itself ?
5. How should we calculate the period in kite for days, hours, minute on different candles say 3min,5min,1hr candle. I would like to know how the calculation works.
6. Does the calculation differs for commodity, stock options trading since the trading hours is different for mcx, nse.
7. On a single chart of say crude oil
a. 3min candle: Apply 3 day Exponential moving average and 15 minute Exponential moving average
b. 5min candle: Apply 20 day ema
How to calculate the period in Kite and also does kite support the same with both 3min and 5min candle ?
Thanks in Advance Zerodha Team.
1. You are choosing an EMA for 15 candles of 15 mins vs 15 candles of 30 mins
2. Yes
3. You apply a 15(15 minute period= 225 mins) EMA and a 30(30 minute period= 450 mins) EMA, that will perform the same task
4. You cannot apply EMAs for 2 candles of 2 different timeframes in a single chart. You can, however, use the multiple charts option on Kite and use 2 different timeframes separately
5. Equities trade for 6 hours 15 minutes, Currencies trade for 8 hours, agri commodities for 7 hours and non- Agri for 13 hours and 30 minutes. So you can calculate by dividing the timeframe with the same
6. EMA is calculated on the last \’x\’ number of candles. Non- Agri commodities will have more 15 min candles in a day compared to equity.
7. 810 EMA vs 5 EMA? Can\’t really understand what you meant there
To use the exponential moving average crossover between 9 day EMA with 21 day EMA ( upto few trading session) and 25 day EMA with 50 day EMA (upto few weeks) what should be the duration of candlesticks ? Should it be 15min or 30min or 1hr or 1 day ?
If you are using intraday, I\’d suggest you use 15 or 30 mins. Else EOD for swing trades.
Excellent module and response karthik. Does trend matter in crossover MA system. If sort is placed where slower MA crossed faster MA , at that point trend needs to consider or not?
In fact, MA is an indicator of trend. So if there is a trend, the MA will let you know.
Sir,
What is the difference b/w linear weighted moving average and exponential moving average,, And i cannot find linear weighted moving average on kite.
Ah, I\’m not sour linear weighted MA. I need to figure this out myself. EMA gives more weight to the recent data points as opposed to the older ones. So in a 10 day EMA, data points of 7,8,9, and 10th day is given more significance as opposed to 1,2,3,5, and 6th day.
On studies box which one should be taken for the moving cross over system?
You need to select the moving averages.
Hi Karthik
Few doubts —–
1) Does intraday trades have slightest of an impact on the stock prices or they are purely governed by delivery based trades ?
2) If I place an intraday order and convert it to delivery by the end of the session, will it highlight in the overall volume for the day?
3) Was shorting banned during the 2008 global crisis ? If yes then was trading in F&O banned too ? (Little out of the topic I Know)
1) It does have an impact and contributes significantly to the daily volatility
2) Yup
3) No, it was not.
How do I make a EMA crossover system in android kite app? Is there any way I can set targets using this mechanism while doing intraday trading? I wish to use 50 and 100 EMA crossover with 1min points?
Himanshu, you simply have to overlay the two averages on the price chart. Alternatively, check out https://www.streak.tech/
Is there any was to set positive moving average and negative moving average with different colors in Pi. (By positive moving average i mean suppose we are on daily chart if 20d moving average for today is more than the 20d moving average of yeserday.)
Ankur, isn\’t it easier to read the movement by looking at the moving average line itself? If it has moved up or down from yesterday\’s candle
Hey, Greetings of the day!!
In all the above mentioned trading systems (especially crossover EMA), considering a stock whose prices fluctuate frequently, by the time the shorter EMA rises above the other, the prices would already have risen considerably. Aren\’t we missing out on chances of booking higher profits already.
In most of the cases in the above graphs, the prices have been hesitated while the shorter EMA is above longer EMA.
Yes, that\’s the reason this is called a lagging indicator. The reason one would trade using these systems is to capture a part of the larger move…and not the entire move.
Hi, Can anyone explain weighted moving average (WMA) ?
Will try an include a supplementary note on this. Thanks.
I am using 3 min chart, so please tell me which one is best setting for crossover moving average and which setting neet to be require like simple, exponential or etc..
Amit, 3 mins is too short according to me. Please try 15 min at least.
Hi Karthik
First of all let me thank Zerodha Team for providing excellent technical information & thank you also for giving replies on all queries patiently, just now I have gone through MA chapters based on which trade can be initiated at crossovers at different time frames,say 15 – 30 mnts time frame with 9EMA X 21EMA for intraday then what should be target & stop loss points based on different MA cross overs? because a full time employee may not find time to watch position continuously !! after trade is initiated stock/index price may rise and come to back to same price where trade was initiated or even it can go below that also in that case that there may be huge loss if trade is in futures ,just for time being let us ignore profit /target but what about losses then how to avoid /arrest such big losses which can happen within minutes due to any unforeseen market conditions?
I hope you will reply me with best solution for the same.
Thanks for the kind words, Bhoopal.
The moving average system you are talking about comes with its own sent of stoploss and target. YOu just have to follow the crossover on the two lines and follow through, and the system will guide you when to enter and exit. In fact, all trading systems come with their own SL and target.
The stoploss and target is applicable when you trade based on candlestick patterns or any other price charts.
Hi Karthik,
Thanks for your reply ,but still I have some doubt for example \”x\” stock opened @ Rs.500 whose high & low prices were Rs. 520 &Rs. 510 respectively on 15 mnts candle time frame and later crossover was happened at Rs.515 at which I have initiated the trade, now should I fix SL as Rs.510/- based on previous candle low & target as per EMA next crossover ?
Pls clarify & I will be grateful to you if you can cite an example in your reply based on MA crossovers.
It is best that you follow the MA trend and accordingly exit the position(either Stoploss or Target) when there is a reverse crossover.
If your having issue with actively following the positions, you need to develop a trading system with a different indicator that gives you a fixed stoploss that you could set while setting up the trade (possibly Fibonacci retracement lines)
Hi karthik, I have a little doubt, I would like you to clear it please.
My Question is – It is mentioned that faster moving average i.e with shorter time period is more susceptible to the new data than the slower moving average or with larger time interval but I am not able to find the mathematical proof behind this, I even tried to to proof by myself but no luck. Would you give me the reason behind the assumption ?
Pankaj….do this. Take a random data array of 30 data points, plot 9 and 21 day moving average. Include a large data as 31st data point and see how both the averages react.
Hi Karthik
First of all, heartfelt thanks to you and Zerodha for introducing us to stock trading fundamentals in such an informative and lucid manner. I had a query on MA – volume charts on kite are in blue and red unlike the all blue charts shown in demonstration. Now as you told volumes correspond to the number of shares bought not sold in a time period so how do we track in dual coloured charts -what does the large red coloured bars reflect – high volumes of selling and thus smart money exiting … is it? If not, can we switch to single coloured volume charts on zerodha.
Please guide. Thanks in advance.
The colour of the volume denotes the price action on the stock (if the close is higher than previous day\’s close, it is a blue bar, otherwise red) for that timeframe.
How to plot 15 by 30 min crossover?
In a Kite chart, click on Studies, search for Moving Average and enter the period as 30.
Repeat the same process and enter the period as 15. You can choose different colours to recognise the crossover
How to plot 15 by 30 minu
Hi Karthik,
I have a question regarding the trade setup while only relying on the cross-over MA trading system. Suppose, I\’m interested in a short-term trade, thus using a 9 x 21 EMA. I take a long position when the 9-EMA breaches the 21-EMA. What would be the trade set-up at this point as the market would be higher than the intersection point of the EMAs?
Suppose, the market is trading at ₹107 and the intersection points of the two EMAs is ₹102. Would the following trade-setup make sense?
Buy at ₹107 (the market) and the stop-loss at ₹102 (the intersection point).
Yes, buying at 107 with 102 as SL is perfectly valid. Also remember, MA is a lagging indicator, hence the signal to buy or sell is always delayed.
Thanks Karthik.
I backtested this particular algo on Streak and didn\’t get good results.
Scrips – SUNPHARMA NSE, ICICIBANK NSE, ITC NSE, INFY NSE, RELIANCE NSE
Initial Capital -10000000
Quantity – 100
Stop Loss – 1%
Target Profit – 0.5%
Order Type – MIS
Candle Interval – 1 Hour
Algo – Buy when 9EMA crosses over 21EMA and exit when 9EMA crosses down 21EMA.
I don\’t see good results for the period – 27/2/2017 to 26/2/2018
All of them results in losses. Any way I can improve this or can you shed more light on this algorithm and how to use it correctly. Thanks.
Firstly, a SL of 1% against a target of 0.5% is not a great idea. The risk-reward just does not match. It should be the other way round.
Although I admire MA for its simplicity, I\’d also suggest you overlay this with candlestick pattern.
Hello sir, in one of the discussions you have mentioned to set trailing stoploss based on smaller moving average, Can you relate the same for crossover of 9 x 21?
Sorry, not really sure what you mean by this.
in a discussion you suggested to use short term moving average to trail the stoploss to lock profits. So in a 9 x 21 crossover system what could be the short term moving average that could be used to trail stop loss Sir?
The 9×21 EMA is quite a short term already, not sure if deploying another MA on this system is justified.
I am very new to share market Sir, varsity inspired me to trade Sir. While backtesting I found that it is difficult to test a strategy with stoploss and trailing stoploss, so my question is \’Is there any quantitative way to fix stoploss and trailing stoploss for MA crossover strategy?\’
Check this – https://zerodha.com/varsity/chapter/volatility-applications/ , volatility based stop loss.
dear sir
how do i draw emacrossover on kite
Hi Karthik,
Can we use this system for only going long or can we also do shorting as well using EMA\’s
You can use this for shorting as well, Satish. But works best with futures.
Dear SIr,
Presently i am using kite version 3 for trading but I am unable to set time frame of 15 min (EMA) in as it has least count of 1 day.
Plz help.
Not really, Nitish. Load the chart for 15 mins and overlay with MA, set the period as 15, and you will be good to go.
Lets say my trading rule is to exit if the price traces back to 30 EMA. Now next day split is announced say 6:35. so the price opens below 30 EMA, but i know that this is not a retracement but due to the split. So how should i discount this factor and adjust my exit strategy? If you can give any new idea?
For this, you need to look at the split-adjusted (or bonus adjusted) charts.
where can i find bonus adjusted chart for split adjusted chart?
Your charts will be adjusted for it.
The plain vanilla single MA seems to be more profitable than the cross-overs.
The crossover lags too much and the sell signal in the above charts is more or less near the buying level or even lower sometimes.
If we look at the price level when those cross-overs took place we don\’t really see cross-over making any sense.
Is it just the above examples or this is the inherent issue with crossover strategy?
Agreed, especially if you have the stomach for sideways movement.
Hi Karthik – it is said that MA system works in trending market. Does it matter whether trend is up or down with respect to trade signal? I mean suppose stock is in UP trend but stock price cross EMA from +ve to -ve(may happen once stock made top), should we go for shorting?
Not really, MA system just confirms the trend – and the trend itself can be an uptrend or a downtrend. You can short provided you have the staying power – cause the trend can last for few weeks.
Dear Sir,
How to apply the 5 X 10 Minutes cross over in KITE platform?
All you need to do is to load two moving averages on the same chart i.e the 5 and 10 mins chart. Once you have these on the charts you will know when the crossover happens.
sir can i use ma 5 or 10 or in 1min chart?
Yes, you can.
Hi sir I just wanted to know can we do intraday trading for new issued IPO in the market i.e the same day on which it was listed.Could you help with that? Do we need to subscribe the IPO beforing listing?
Yes, you can trade intraday once the stock is listed on the exchange. Just make sure that the stock doesn\’t belong to Trade to Trade category
Hi Karthik, Thanks for educating us.
I have one query. I trade in crude using 30 minutes mostly for intraday (Sometimes 1 to 2 days). is it ok to use 9 * 21 EMA and what difference does it make between using 15 minutes chart v/s 30 minutes chart. please explain
Yes, 9*21 EMA works, however, I\’d suggest you do your backtesting once. Generally, higher the time frame better is the quality of signal…hence I\’d prefer to use the 30 mins versus the 15 mins chart.
Hi Karthick
can i use this MA cross over for Crypto currency also? What is your advice as cryptos are very volatile?
The basic premise of TA is that it can be used on any asset which has time series data, so given this, you can apply TA on Crypto, in fact, I\’ve seen people using TA on Crypto. But the swings are wild and your stoplosses / target needs to be deep.
Sir Which is the Golden Cross Over?
I Have Asked Many People and Each One has a Different Answer For the it.
A golden Crossover is when a 50 day moving average crosses over a 200-day moving average.
karthik build some strategy upload page so that traders can benefit from it..
I\’m using 9 day EMA with 21 day EMA for intraday. I need your suggestion what is the time frame along with this should be used.
Thanks for the material and this helps me a lot.
Try the intraday chart of 10 or 15 mins for the last 5 trading sessions.
Can you elaborate what does trading sessions refer in above context
The times when markets are open is referred to as a trading session. For example, we have 5 trading session, Monday to Friday between 9:15 AM to 3:30PM.
karthik for crudeoil trading what ema crossoverwould you prefer for 15 min,1 hour,daily timeframe
15mins would be good for intraday.
karthik i am asking ema crossover values for above question
Got it. I think the 9 and 21 over 15M EMA will be good, at least for a start.
Hi Karthik,
We have interacted on another forum as well.
Would appreciate if you could furnish me with the tradescript code for calculating DEMA and TEMA. I have the formula but I am unable to compile EMA of EMA i.e. EMA(CLOSE,EMA(CLOSE,50)) in Pi. The argument required is \’periods\’ but I guess the EMA(CLOSE,50) returns a vector. Is there any math function to convert the vector into integer (or period)? I went through the tradescript guide but in vain. Or is there a direct DEMA/TEMA function that we can access? Any help would be highly appreciated. Thanks.
~Abudhar al Hassan.
I\’d suggest you email my colleague Srini for this – [email protected] . Thanks.
Did that. Thank you very much.
~ Abudhar al Hassan.
Good luck!
Hi Karthik
Back with another query, Please correct me. The below details for EMA cross-over
1. Intraday – 9x 21 day EMA on 10 or 15 Min Chart look back of 3 to 6 months
2. Swing Trader – 25 x50 day EMA on 1 hour chart with look back of 3 to 6 months
3. Short term – 50×100 Day EMA on 1 day chart with look back 1 year
4. Long term – 100×200 day EMA on 1 week Chart look back 3years+
Also is it possible to add MA on Volume chart in pi.
Thanks & Regards
1) Intraday – 5-8 trading sessions is fine
2) Swing trading – EOD is good, at least 3-6 months charts
3) Yes
4) Yes
Thanks Karthik 🙂
Cheers!
Hi Sir,
for intraday what is best settings for MA, EMA, Supertrend? Which indicator is better to use for intraday?
I\’d suggest you stick to EMA. My personal preference is 9 over 21-minute candles.
EMA CROSSOVER WHICH IS BETTER FOR SWING TREAD.
I\’d prefer EMA crossover for overnight position panning across multiple days.
Congratulations zerodha team and many many thanks.
You guys are so prompt in updating the e kyc parameters amazing really fantastic .I updated my aadhar updation today it hardly took 5 minuts to complete it ,you guys know how to do things .Though this not the right place to write such words,but z connect is not updated since 17th aug,17.
Thanks again.
sunil kumar minz.
Sunil, thanks for the kind words, I\’ll pass that compliment to our beautiful technology team 🙂
Lots of work getting done in the background, Z-Connect will be updated with all that info soon.
Hi There Mr rangappa
In my viewpoint larger time frame MA crossover works fine for investments and especially for stocks e.g. 50 day and 100 day or 20 day&50 day.while for trading purpose 20 hourly and 50 hourly for trading . your opinion,please.
Yup, I agree with you.
Thanks
This type of support gives moral booster that i am not totally on wrong side,as i am doing fine with my trade and investments,losses are inevitable but small losses and big gains should be, our motto.
True! Good luck, Sunil.
Hi, Suppose I have gone long when the faster EMA crosses and is above the slower EMA
How does one determine the target price using the \”Moving average crossover system\” for example \”9 day EMA with 21 day EMA\” or \”50 day EMA with 100 Day EMA\”. Thanks.
If its purely a MA crossover system, then you will have to wait for the reverse to happen i.e wait for the faster to move below the slower MA.
Thanks. Really appreciate the effort you and your team are putting in. Please keep up the good work.
Cheers!
Hi Karthik,
This chapter has been quite an eye-opener for me. At least, now I am confident that we can create good trading systems. I have been backtesting MA crossover system and it seems to give good results for many stocks on NIFTY. Yes, whipsaws are there but then it also lets one ride on rallies. Thank so much.
My question, how does one set a stoploss and target while placing orders, say on a Zerodha platform like Kite?
Unlike candlestick patterns used with Support/Resistance, the MA crossover system in advance doesn\’t really give us any target or stoploss. How do we approach this situation then?
Does Bracket order make more sense to be used in this trading system because it has the option to add a trailing stoploss? Even, with trailing stoploss what should be the approach to set a target in advance if we aren\’t able to monitor the chart minute by minute?
Nishanth, you can always use S&R for identifying target and stoploss. Also, the idea with MA is to follow the trend, given this, there is no way you can identify a target or stoploss. You just ride the wave, as long as it lasts.
BO makes sense if you doing intraday.
Hi, What if 50, 100, 200 EMA never intersect for almost a year. what does that signify.(example Dilip Buildcon)
Well, that means the stock is trending and there are no signals to trade. The only option is to reduce the frequency and look for shorter term signals.
Hi, how do I add EMA (say 50,100 or 200) and volumes info. in the Charts in the Kite. Thanks.
Load the moving average, select the \’Volume\’ in the field section instead of the default which is \’open\’.
Hi, I have Query.
so for the \”50 day EMA with 100 Day EMA\” (Few months) and \”100 day EMA with 200 Day EMA\”(long term) in these scenarios we can only go long, Right? Thanks
You can always change the time period!
I have a question on the EMA cross over strategy. When the faster moving EMA has crossed above the slower moving average we will create a long position. When the faster average moves below slower we square of the position.
After squaring off do we create a fresh short position at that point ?
You can, in fact, many active traders do – it really depends on your capital and risk appetite.
Mr Rangappa
Your observations are very good a person will never make loss if he follow this system in trading ,i am using this 30 to 50 hourly time frame even he will have losses it will be recovered very soon but one support he must take is of fractals ,and ADX and DI crossings .
Thanks for what you have written here .In my opinion this is one of the best methods of trading .
Your opinion on fractals and ADX DI indicators in Kite zerodha it is doing fine.
Thanks
sunil kumar minz
Happy learning Sunil. Remember, there is no foolproof trading technique – always watch out for risks 🙂
Stop loss is there to cover risk,here fractals comes to play and ADX indicator ,that,s my question for you i just wanted your opinion in using these indicators as your total article on moving averages is very very help full and superb.Because i want to enhance my lots with 10 to 15 lots of nifty and bank nifty futures,i wanted your opinion.
Thanks again
I\’ve heard about fractals, but have no experience trading based on that. So I\’m not sure if I can give you any meaningful inputs.
Thanks
Cheers!
for the intra day study the 9×21 , so here 9 and 21 in the day only? right? EMA unit is only in days right? hope i unestand it right
If you load 9 x 21 on an EOD chart, then 9 and 21 will represent days….however, if you plot this on a 5 min chart, then 9 and 21 will represent 9, 5 mins chart and 21, 5 mins chart.
thanks for the reply. but can u please explain what is it.and what is offset or and field. and why i set to EMS then it is automatially set to SMA only? thanks in advance.
Ah, I\’ll try and put up a note on this shortly, Himanshu.
One should prefer SMA crossover system or EMA crossover system?
And for exiting signal while using EMA crossover system when should one check the chart like end of the day depending on the closing price or should check from time to time during the trading day and exit the trade depending where the current price is??
I personally prefer EMA crossover on an EOD basis. However, if you have a trade live, then tracking it during market hours helps in better management.
Hi karthik,
5 days EMA is calculated as by taking closing price of 1st,6th,11th,16th,21st/ 5 (assuming there is no holidays in between ). Am i right????
It\’s calculated taking the latest 5 days closing average.
I have shifted to Zerodha recently, as it was recommended by one of my friend. Main reason was the flexibility it allows and this study material, which is simple to understand for a novice trader like me. Thank you for this study material.
I have one question on EMA. This tool seems to be a effective way to decide on trades. However, is it available in Zerodha account or it needs to be purchased separately. I mean unless I have the chart, I will be unable to decide on trade. OR is it that I will have to manually calculate and plot graphs in Excel. Please guide.
Thanks for the kind words, JD Thakar!
EMA is an integral part of the charting engine in Kite. No need to pay for it. I\’d suggest you look at videos on Kite here – https://www.youtube.com/watch?v=1Jy23XfKwG8&list=PLkxTRam6E2V-okv6gwQlt6dLTsn0v6CD1
EMA lines when viewed through charts on KITE on desktop , are very thin and almost not visible . Why don`t you give us an option to increase the thickness of the line so that they are always visible boldly . When the same EMA line viewed on Android mobile, thickness of lines is OKAY but would like it to be bolder / thicker — Kindly give us the option of selecting line thickness on desktop & mobile
The lines are quite thick already, anything thicker than this can get quite distracting. Don\’t you think?
Issue is when you choose multipe EMA and give multiple colours,
For single EMA , line becomes bold when you hoover mouse above it.
Difficulty is when having 2 or more EMA`s I cannot hoover my mouse, above all EMA`s simultaneously, to check crossovers
On desktop its not visible properly even when you enlarge the area
On Investing.com website , see how they allow you to increase line thickness as per your need. Its an excellent idea
Got it, will pass on the feedback to Kite team.
how to set multiple moving average like 50, 100, 200 in kite?
Check this – https://www.youtube.com/watch?v=5M232FaN5Ks&index=10&list=PLkxTRam6E2V-okv6gwQlt6dLTsn0v6CD1
Hello sir,
In 9×21 ma, if 9ma is already above the 21ma.. How to decide the entry then?
As the stock is in uptrend cause its 9ema is already 21 ema can u pls suggest when to enter
You will have to wait for the cross over to occur.
Hi Karthik
I understood that MAs are good indicators for going long on a stock. Does that same hold for shorting too? Is it a good option to short when short term moving average goes lower than the long term moving average?
Also, I am new to trading so I wanted to understand how exactly going short works. In a call, we have the actual possession of the stock, and we can sell later whenever we want. But in shorting, do we have to compulsorily close the trade the same day itself? Or is it possible to carry it for 2-3 more days/weeks?
Yes, it does. You can use MA to short stocks as well. I\’d suggest you look at the explanation on shorting here – https://zerodha.com/varsity/chapter/commonly-used-jargons/ and then here – https://zerodha.com/varsity/chapter/shorting/
Excellent explanation on SMA & EMA I read first time for average trading. It clears all my doubts
Glad to know that Jitu 🙂
Happy learning.
Dear sir,
in this chapter you say 15×30 minutes cross over for intraday. but in MA the minimum period is 1 day how can we fix 15×30 minutes crossover or 5×10 minutes cross over.
You can select 15 and 30 MA frequency from the drop down.
Hi Sir,
The moving average study given in zerodha is simple moving average or exponential moving average?
Thanks,
S
Both.
excellent writing and explanation for beginners in trading. of all the material I read its the best!
Thanks, Gautham!
Thank you very much sir. I read very carefully those information you gave me.. I exactly did same as poker game.. Now I understand thank you for that information..
Good luck, Sourav!
Sir I want to ask you a question personally that sir I made a lot of loss in this day trading I\’m not good at it but I learned all technical analysis indicators and all by help of zerodha varsity but still I\’m in loss, sir I\’m very beginner in this market most probably 6 months.i\’m 22 years guy . But my capital Is all about to end I\’m struggling sir from 150000 lakh rupess now I have only 30000 rupess.. Sir can you tell me that how can i recover my capital any strategies.. Please sir please help me to find a right way.. My email Is [email protected] sir if you want then you can pm me or you can tell me here.. Please sir
Sourav, I\’m really sorry this happened. My guess is that you have over traded without a proper thesis. Recovering 1.5L from 30K is a huge task and I\’ve explained why here – https://zerodha.com/varsity/chapter/position-sizing/
I\’d suggest you take a break, get your act right and then approach the market with a fresh mind.
Sir, I trade in mcx metals mostly I use 15 minutes chart.. I want to ask that is it possible to trade in 1day candle basis.. Is it safe to enter a any intraday position
You can look at EOD data, in fact, if you ask me this is a better approach.
Sir how to write script for triple crossover 15,21,34, to get alerts or to backrest? Can u please guide..
*backtest
Sir What is EOD data?where I can find it?
End of day data is called EOD. You can see the EOD data on kite itself.
The content is great and way it is presented is impeccable. I thank you for creating such an enriching resource. Can you please tell me which tool do you use for plotting? I will be grateful.
Thanks for the kind words, Raghav. I use Zerodha\’s Kite platform for charting.
First of all thank you very much for all modules which is highly informative. However, I would like to know if there is Demo account for trading practice and video classes for this technical analysis.
Thank you Karthik for the support.
Thanks for the kind words, Nishitha. Unfortunately, there are no demo accounts. But we do have a ton of videos on our youtube channel. Check this out – https://www.youtube.com/user/zerodhaonline/playlists
YOU CAN TRY NSE PATHASALA FOR MOCK TRADING PRACTICE. I FIND IT A GREAT TOOL TO KNOW HOW WE ARE GOING TO PERFORM IN REAL LIFE TRADING. LINK IS THERE IN NSE SITE
I\’ve heard good thing about NSE pathasala too 🙂
Hello Karthik,
Is EMA is available on Kite ? Since i did not find anything like EMA on Kite there is just one thing available called Moving Average, if it exits on Kite can you please tell me from where to access it?
Of course its available. Load a chart, select Moving averages from studies and change the type to exponential, and you are good to go 🙂
Thank you .. now its perfect..! I have been doing some thing similiar.. Now more smooth with Expo
Good luck, Prashant!
Hi,
In Kite I can see Moving averages as a study but in Pi all I see is moving average envelope. Why is the difference?
They are two different charting engines, Ankit.
Hi Karthik,
Thanks for your response, but could you explain a bit more about the engines and does that mean Pi will not be able to show EMA?
Charting engines are programs which power charting on trading platforms. EMA does work on Pi.
Hello sir
I have a little confusion in moving average. When we analyse day chart and use 50 MA it means we are using 50 days MA. Now when we are using 5 min chart for intra day and using 50 MA, what does 50 stand for? Does 50 MA mean past 50 min data or 50 sticks each of 5 min?
Varsity student
Thank you 🙂
It means you are looking at the average of the last 50, five mins candle 🙂
So generally speaking, if you are looking at last n period moving average for x frequency, then essentially its the n period moving average of the last x candles. Hope I dint confuse you with that!
If the frequency is 5 min and i am looking for 20 MA it means 20 candle sticks having 5 min of frequency. Right? And if it is true then i am looking for past 5*20= 100 min data?
What i want to say is if i am using 75 MA for 5 min candle stick , i am looking for last one day data, for 150 MA i am looking for last 2 days. ( No of 5 min candle sticks in one day= 75)
No, as I said it is not a straight forward multipication. In this case the system will calculate the average closing of that last 75 data points and plot the value on 76th day.
Yes, you are looking at 20 period average 5 mins candles. No, 5*20 does not mean 100 min data. This is not a straight forward multiplication.
Hi, I have been following these modules and they are just great. The explanation and examples are simply amazing. I have a little doubt here and I guess I am totally confused with the below information…
Rule 1) – Buy (fresh long) when the short term moving averages turns greater than the long term moving average. Stay in the trade as long as this condition is satisfied
Rule 2) – Exit the long position (square off) when the short term moving average turns lesser than the longer term moving average
From the graphs it appears that it is profitable to go long when short term moving average is lesser than the long term (because share prices are low) and square off when short term goes higher than the long term (because current prices are higher). What am I missing?
Crossover of moving averages gives you more conviction for the ensuing trend. When the short term MA is lower, the chances of the trade going sour is higher. Hence its better to wait for the crossover.
Hello sir
How could we add moving average on volume chart in Kite or Pi?
Suggest you drop in email to [email protected] , he will be able to help you out. Thanks.
Instead Of Crossover Can Traders Use Only 50 Day EMA? Considering That The Price Closes Above 50 Day EMA And That Too Pretty Much In The Support Zone With Almost 50% Extra Volume Than It\’s 10 Days Average Volume?
Yup, that is possible.
i want to place 4 hour or 5 days moving average on 5 minute chart in kite ,how can i do this
To see an hourly moving average on a 5 minute chart, you need to multiply by 12 (60 min in hr divided by 5 min candle) so this will be around 252 and it will need to be entered into the moving average value box on the 5 min candle chart, Hope this helps.
252??? i think for 4 hour ema on 50 mi chart it should be 48 ema .(60 mi *4 hours=240 mi/5mi=48), & anything for 5 days eod ema on 5 mi chart in kite
Is it possible to plot 30 min and 15 min ema in zerodha kite?
Of course it is possible. You can watch this for now – https://www.youtube.com/watch?v=5M232FaN5Ks&list=PLkxTRam6E2V-okv6gwQlt6dLTsn0v6CD1&index=10&t=9s , we are soon replacing this with a new video.
Very clear and useful Sir.
Cheers!
I am looking a chart on Kite and have got a 50 SMA drawn. Please let me know, how can I see the value of SMA at any particular point.
Please enable the crossair and move along the curve, you should be able the see the value on the right.
Thank You Sir 🙂
Welcome!
firstly i thanks very much for your insightful modules. secondly, trading in crude oil is baffling me. it seems that there is no strategy trading in crude oil. whether 9×21 ema crossover works or any other strategy. pls help and post some strategy of trading in crude oil intraday
All TA patterns are applicable on Crude as well…so try resorting to good old charts 🙂
pls suggest whether 9×21 crossover works in crude oil trading
You can apply the moving averages, however you need to backtest to check if it works well. Good luck.
Hence, moving averages help better for those who mostly invests for a long term purpose and for a short term purpose we can use candlestick methods with volumes for better result.
Am i right?
Yup.
Sir ,
You mentioned 15 * 30 mins can be used for intraday and more aggressive trader 5 * 10 mins.
I am bit confused here…
you mean to say in 1 min chart ,we need to use 15 ema and 30 ema cross over or 5 ema and 10 ema cross over?
I prefer to use 5 mins,10 and 15 mins charts for intraday.
Please suggest what ema cross over we need to used for above time frames?
You can use any time frame and apply these averages. Shorter the time frame, more number of signals and higher is the noise component. Higher the time frame, then vice versa.
Dear sir, excuse me for asking further
I like to know settings in Ema cross over
Is it good to use ema9 and ema21 cross over in 5 min charts
For doing stocks and commodities
Let me know whether it can be done same 5 min commodities
Thank you very much
Yes, its applicable.
Thank you very much sir
I have a strategy which is shared by a trader in Fb
Ema 9 crosses above 21 , we have to check Candle high value of the buy arrow candle
That high has to be broken on the following any one candles before reverse signal
If rule satisfied enter a buy in next candle open price
Stop-loss 0.5 percent below buy price
Once stop-loss hit, wait for sell entry
No re entry in buy side again
Similar for reverse trades
Can you suggest me this strategy is profitable
I\’m not sure, Sreeram. You need to back test this extensively before using it in the market.
From the very beginning I read all chats on this moving averages forim
Lot of moving averages values time frames shared
As a filtered one can you please tell me which Ema values and which timeframe
Best for index, equity stocks and commodities
Kindly mention time frame for doing intraday as well one or two days holding
Also best settings to trade on moving averages
Thanks lot
Sreeram, as you may have realized there is no such thing as the best EMA/SMA. One has to calibrate it to suite the time frame and stock (index) that her or she is trading. Having said that, I think for intra-day 9 minute EMA works for me…and 21 day EMA for overnight positions.
Dear sir
How to set up smoothened moving average 3,8,13 ( allegator indicator settings ) in Zerodha PI or in kite ?
Select the indicator study and edit the settings.
Other moving averages are there. But smoothened moving averages are not there, I think. Please confirm. I think it is not possible to put the indicator of smoothened moving averages.
Are you taking about these indicators in Kite?
In above charts all the averages giving buy signal after the market is already up and giving sell signal after the market is already down, why?
Wouldn\’t it be difficult to take decision when to enter and when to exit?
Averages is a lagging indicator, Ayush. It confirms an existing trend.
hello Karthik Sir… I may be wrong but in my opinion single EMA is more beneficial than crossing over two EMAs because as per charts we are getting crossover(many times) in the end of the trend or at higher point. Your words on this will help. Thank u..
Using two EMAs will help you identify longer trends and reduces the number of false trades.
Will it be stupidity to trade in sideway market chart with crossover method?
You will have multiple crossovers, hence too many buy and sell signals.
Sir, Is it necessary to set up moving average on the basis of closing price?
It is better on closing prices, but is not mandatory.
What is the difference between trend strength and momentum of stock? Both basically mean the same.
Yup, both are the same.
Dear Karthik,
Amazing Modules..!!!!
I have one question –
What role does OFFSET plays while looking at MA charts?
Thanks Shubham.
Offset is used as a smoothing parameter. You can ignore this.
what period ema should one use for daily and weekly charts?
No set rule here, Hemant. For short term, I use 9 and 21 period EMAs.
Hi karthik
Got the problem solved
Can see the charts
Kindly ignore the above msg
Thanks
Great!
Or if u can suggest any good book to refer on TA where all the aspects are covered
thanks
Which aspects are you looking for Mehul?
Hi karthik
sorry to say u that i m really stuck in between the course I was so eagerly studying as at the crucial points I cant see any charts mentioned by u. I m refering to my mobile pho e. Kindly let me know if there is way out.
thanks
Mehul – some of the graphs in the comment section may not be visible (there was an update which messed up the images in the comments), but the graphs in the main chapter is.
hello karthik sir…i have another doubt pls dont get angry on me…this may be silly math doubt but my is not able to agree for this
YES BANK is trading at 1168 at 9:20 this morning and at 11:10 first EMA crossover too place and got sell signal at 1188 (im not using expert advisor sir…im observing the ema line move and when it crosses i sell)..for 1 lot of jan futures we get 14000 profit and after 1.5hr again we get the same buy and sell signal which gives profit of 23per share total profit will be 29400… sir do we get such huge profits on investment of 40000 using EMA lines…is it safe trading with EMA during trend…im not able accept the fact that we get such huge profts…pls help me
It really depends on how when you manage the trade. There is a big difference between paper trading and actual trading. Things appear to be in control when you paper trade…but with an actual trade its easy to lose control. However, a good trade aims to be indifferent to the two. Its hard to achieve this state…but one can.
sir can you be ore specific about the difference…i am a client of zerodha form 2013..im somewhat used to trading on live platform but i used to trade without using any technicals…so i ran into losses so i thought i should learn and then trade…so i stopped a year ago and i found varsity in last december it helped me a lot…ive gone through all the chapters..im able to understand and visualize while reading…even though i have a little experience trading on live platform still will i find difference… l will try to achieve the difference and thanks for your support sir.. i bow to you
When you paper trade, you are emotionless. Even if you make a big loss, deep down you know its not real. But when you trade in real markets, a small loss to give you big pain. This make a big difference, as it can influence you to take irrational decisions.
Good luck Chaitanya. I hope you find success soon.
good morning karthik sir, i have a doubt regarding MA crossovers..
1. first of all is period in intraday 1min chart while applying crossover means 15mins only?
2.im using 1min chart for intraday with 15mins x 30mins crossover…i checked for different stocks after the markets are closed and found out that the indicator is generating good profits for the 1st 1 to 1.5 hrs after the markets are opened..as you said it is not giving good results in sideways markets. now my doubt is when i checked on the live market im not able to plot the graph till 10 \’o\’ clock or more than that showing an error msg on pi which is causing loss of profit in the uptrend market. At 10 \’o\’ clock im able to plot the graph with 15mins EMA and at 10:10 im able to plot 30mins EMA. how to overcome this problem. if i use lesser time frame im not able to get accurate signals… pls give me solution for this
3. yesterdays with INFRATEL stock im able to get a profit of 12000 on paper 🙁 for 1 lot of JAN futures. the profit can be increased to 18000 if i able to get in the market at 9:30 to 9:40 but im only able to get into the market between 10 to 10:15 due to not able to plot the graph.
4. im able to plot the graph at 10:00 and the graph is showing EMA line from 9:30
hello karthik sir….i think i found a solution for my problem on my own…pls tell me whether it is right or wrong…if i take 1min chart from yesterday itself then i will get correct signal to enter into the trade in fact i can enter into the market at 9:15 or 9:20 itself…for eg for todays market i will take 1min chart for yesterday itself..am i right sir.. 🙂
Somewhat, I posted a reply to your earlier comment.
The periodicity can be anything – ranging from 1 mins to 1 day. If you opt for 15×30 mins…then you will have to wait for 30mins for the data to generate.
and another request increase the colours choices in kite of all indicators which is restricting a lot and confusion goes on with less colour choices. thanking you.
Sure, will pass on the feedback.
karthik please make some arrangements in kite so that we can increase the thickness of movingaverage lines as per our requirement right now it is very thin and we can not increase the thick ness what is happening is we can not see proper with such thin line with other indicators such as ichimoku trading system along with moving average.please do it its a request
Venkat – when you hover over the line, it automatically thickens. Have you tried this?
MA Crossover seems to indicate a trade very late. Please refer chart of DLF. It is moving up since 27th Dec 2016 when its price was INR 102. Today it have moved to INR125. DMI also says that it is in a trend. But still 9-days EMA hasn\’t cross 21-days EMA. Most probably it will cross tomorrow i.e. after price moving 20%!
Yes, you are right. In fact, for this exact reason the moving average is considered a lagging indicator.
Double Exponential Moving Average is there in kite or Pi?
I\’m afraid not. Also, I\’ve not really heard of a double MA. Is it a custom indicator?
The formula for DEMA is: DEMA = ( 2 * EMA(n)) – (EMA(EMA(n)) ), where n= period. Double Exponential Moving Average (DEMA) is a smoother and faster Moving average developed with the purpose of reducing the lag time found in traditional moving averages.
If Zerodha introduces Double/Trible EMA, it will be great for traders . Thanks in advance
Double Exponential MA Formula: D-EMA = 2*EMA – EMA(EMA)
Triple Exponential MA Formula:T-EMA = (3*EMA – 3*EMA(EMA)) + EMA(EMA(EMA))
Ok. I\’m not sure if we can have this in Kite. However, you can use the exper advisor feature in Pi and run your own custom indicator. Check this – https://zerodha.com/expert-advisors/
Is there any way to filter the stocks based on technical indicator?
Let\’s say, I need those stock of which 20 EMA has crossed 44 EMA. What would be the query for this strategy?
Yup, check this – https://www.youtube.com/watch?v=uZmZ51k3pPk
can u PLEASE add SCREENER IN \”KITE \” ?
Sure, will convey it to the team. Thanks.
Karthik, for intraday trading, if 9 period ema crosses 21 period ema on 5 min chart we can buy and be in trade till crossover changes direction and come out of that particular trade. my question in at that point can we consider of entering in new trade to sell and square off later when ema crossover changes direction again? and keep repeating it whenever we get signals? or is there something that we should go long only or short only based on some other signal or conditions?
Yes, you can trade the averages…works well as long as there is a trend in either directions. But when the markets consolidates, the whipsaws tends to give you many trades with none of them materializing.
Sir , Can you tell me which is the good ema crossover system for day trading by your experience?
Simple 9mins by 21 min EMA is good to begin with. Give it a try.
Sir, tell me what is period value to add 9 or 21 min ema.
You can plot this on the 10 min chart.
which are important and useful indicators for intraday trading ?
Many – MA, MACD, RSI, ADX etc. Check this – http://zerodha.com/varsity/chapter/supplementary-notes-1/
which timeframe chart should be used to find candlestick patterns in intraday trading ?
I\’d prefer either the 10mins or 15 mins candles for intra day trading.
sir how to find support and resistance in uptrend and in down trend?
Check this – http://zerodha.com/varsity/chapter/support-resistance/
Hi karthik,
can we initiate a buy(long) just after some time or half wau through when the faster EMA crossed over the slower moving EMA and will be still be able to book profits when the reverse cross over happens?
Well, its always good to have some confirmation and play it safe 🙂
Hey karthik,
Thanks for that .I have one more question. Is there a way where we can track if 50 day EMA of stock or for that matter any stocks under watchlist crossed over its 100 day EMA and create alerts for that so that we can take a look at trading decision.Thanks again for your time.
Of course you can, check this – http://zerodha.com/z-connect/tradezerodha/pi-tradezerodha/eas-for-auto-buysell-signals-pi
Thanks karthik
Welcome!
Pls clarify.
There was a hammer formation in L&T two days back with good volume and traded near the strong support in EOD chart.
But the price has broken the 50 & 100 Day SMA.
Is it good in going long?
Hammer by requires a downtrend as prior trend, do you see that happening in L&T?
When you say 9×21 crossover on a 5min chart for intraday is it 9×2 1min OR 9X21day.Excuse me if that Is a dumb question
No question is dumb! We are all in the process of learning 🙂
9 min over 21 minute on a 5/10 minute chart.
In 5 min chart, each candle is 5 min duratuon ( u can call it period). so 9×21 ema crossover on 5 min chart means 9 period and 21 period ema crossover.
karthik sir, pls correct me if i m wrong.
Yes, you are correct. No problem with it.
When on the chart when i move my cursor over previous candle charts, I can see OHLC values change for the instrument. in this case bank nifty however the values for the moving average indicator can\’t be seen.
1. What can I do to get these values on display as well and
2. Where are the settings to change the line width of my MA. its too thin for my linking.
Thanks in advance.
Ah, not sure. It seems to be working for me. Can you contact our support for this? Thanks.
What is \’offset\’ variable that Is available when plotting the moving average indicator?
You can ignore that Arjun. It helps you displace the data, although does not really improve the predictability of the indicator.
It would be great if these contents were in video format because, the contents are good but are too lengthy and time consuming, i usually prefer to learn from youtube.
Agreed, but we do not have the resource and bandwidth to make video content 🙁
Hi Sir, in the \”SMOOTHING\” method for intraday, can I use 5 minute chart and on top of it use 15 minute EMA and 30 minute EMA for crossing method? what time chart would you advice for intraday? 5 minute is ok or should I use any other? Thank you.
Shorter the time frame, higher is the noise component. I\’d suggest you use a slightly long term chart. I personally 10 or 15 mins charts for intraday.
Hello Karthick, First of all thanks for the clear explanation of the concept
How can I set MA crossover of 5min x10min for Intraday trading in zerodha kite platform? is it possible?
Welcome.
Yes, you can. Here is the link to Kite User manual which will explain everything about charts and other aspects of Kite – https://kite.trade/docs/kite/ and for charts in particular – https://kite.trade/docs/kite/#indicators-studies
Sir,do you provide pdf of zerodha varsity (chapters).plz mail me.
You can download it from the module home page.
I use 5 and 15 minutes candlesticks.
Which Moving Average crossover is best for intraday trading? (Please answer in hours:Minutes)
15 mins is good.
Ok. I will use 15 mins candle sticks. Which moving average cross over should I use? Ex: 11 mins ,20 mins and 60 mins
10 mins should work ok – this is purely for intraday trading.
Hello Sir! I am a great fan of your work towards educating us with immense knowledge about markets. The only query which I have is whether should we consider volumes during intraday trading using EMA\’s? Also, what other parameters should we consider while trading with EMA technique in order to improve our accuracy? Should we use different indicators like RSI,MACD,etc with EMA\’s. Also should we consider S&R while using EMA\’s. Once again thankyou Sir.
Yup, it makes sense to keep volumes in perspective. From my experience EMA + S&R helps much better than overlaying other indicators.
Dear zeordha.
Do u ppl block \”reply\” option if post is more than 3?, I dint seen reply option for my above post. 🙂
As I said I used to trade blindly before. Last year I joined zerodha and learnt many things here. Thanks again for ur knowledge sharing.
U said reference point keep moving. I didn\’t got it. Its moving to how many points behind. In Google finance der is no option for assigning points behind ( don\’t know abt pi),
Oh no, there is no blocking of that sort. Maybe this is a bug, let me request our tech team to look into this.
Regarding ref point – today is 18th May, if I need one year SMA I\’d look back from 16th May 2015 to 17th May 2016, tomorrow would be 19th may..so my look back would shift to 18th May 2015 to 17th May. So on and so forth.
Thank u sir.
If I want 20 days EMA for 19_05_16, then how PI or Google finance calculating ? Is it last 20 readings from 19_05_16 back side?,, as per ur answer if I want macd(26,12,9)for 19/05/16 then readings from 23/04/16 ( 19th -26) is enough ?
For 20 day EMA, look back is 21 days. For MACD (26,12,9) look back period would be 27.
Hi,
When i apply 1min, 3min and 5 mins charts, which EMA and Which SMA and EMA cross over should i take in to consideration?
Regards,
SaikiranGarapati
This depends on your risk appetite. Lower the frequency of the EMAs then more number of signals and more noise. Higher the frequency, lesser number of signals but also the quality of signals improve.
Dear Zerodha.
I was trading from last two years blindly after coming yo zerodha I didn\’t traded but learnt many things here. Thank u for providing not only technology but also amazing knowledge.
I have one question
I have a data history of last one year .if I want to calculate MACD how many data points has to be considered. I.e MACd value for today EOD is from last 30 readings ? Or from last one year i have to calculate. Same question is applied to other indicators too.
Usually for short term trading, 1-2 year look back period is good enough.
Omg. U replying to me question at 5am???
Thank u for replyin . What I understood from ur answer is, my calculation for macd will start from 17/05 /15 to get value for 17/05/16. ( for short term), I.e My first set of EMA will start from 17/05/15, get EMA from 17/05/15 to next 12 and 26 days.
Yes, for 1 year EMA, you go back year ago…for 2 years you go back 2 years…so on and so forth!
Ok thanks. Now question is how Google finance or PI finding da values. ? If im looking for chart of one month den how many reading its taking. If same chart I change into 3 months den again software ll do calculation? Again how many readings its taking. As I saw MACD value for today is X value on one month chart and MACD value is Z on 3 months charts for da same day. I don\’t knw I asked in proper way or no . Hope u understood my question
These are calculated on a rolling average basis. The reference point keeps moving as and when you keep moving the reference time period.
my client id is rb1210. i dont know how to plot Simple moving average for differnet time horizons like 20 days, 50 days and 200 days on pi could you please help me out.
Please contact our support line – 080 40402020 for this.
Dear Sir,
I\’m a newbie. Awesome material. I\’m reading the Moving Avg Chapter and couldn\’t understand the following(apologies if its dumb)
Under section 13.3, in the example for Ambuja Cements, you have said the first buy signal is B1@165 when price is above 50 EMA. But isn\’t the price 165 below the EMA line? (it should be higher isnt it?) I felt the same for S1@187 where the price seems higher(rather than below) than EMA line. Where am I going wrong? Pls clarify
rgds
Oh, the markings maybe confusing you, sorry about that. Please check the close of the candle to get more clarity.
which one is better stochastic or MACD ? & why ?
Depends on the situation. They are two different indicators with their own merits and disadvantages. Cant compare them.
ok but can you give details on them seperately ?
their own merits & disadvantages seperately ?
which indicator to use under which situation ?
if you don\’t mind , can you share what tech.indicators you use for your personal trading ?
thank you
MACD is discussed in detail here – http://zerodha.com/varsity/chapter/indicators-part-2/
Will be putting up another chapter on indicators shortly.
I personally prefer MA for active trading.
both of them have whipsaws / false alerts , how to minimize those ?
when is the commodity module coming up ?
You can minimize them by increasing time frame. For example 21 day MA produces more whipsaws than 50 day ema.
Commodities is after Option Strategies…maybe by mid March.
hi karthik. how do futures position influences the equity price? theoretically underlying price should influence fno? here iis it happening other way around? how futures short covering influence equity price?
Spot always influences the derivatives market. Both short covering and long unwinding are transient and does not dictate long term outlook. This is exactly why you need to be quick while trading short covering and long unwinding.
Which time frame and ema time frame suitable for intraday trading to generate accurate signal
Depends on your risk appetite. I prefer 9 x 21 minute EMA crossover.
This Saturday afternoon is turning out be great benefit to me as I\’m reading these modules Karthik and reading all the comment sections that many people have posted. Can you also start writing blog please.
Would my below assumptions correct when I read this statement \’ Depends on your risk appetite. I prefer 9 x 21 minute EMA
crossover\’
1. For trading about 3 hours in the India commodites segment(let\’s say from 8.30 PM to 11.30 PM Singapore time), it is good to choose a 5 minute chart(I\’m fine with the risk:reward and have done the position sizing as well) and no overnight risk(I mean I don\’t keep positions open for the next day)
2. On this 5 minute chart of ONLY one day(do you want me to choose multiple days(?)), select 9*21 minutes EMA to get some reliable accurate signals
3. write/print the rules in a piece of paper that you have highlighted and stick in the wall right in front of the trading PC and start trading!
Yup, you can certainly choose 5 mins chart and overlay the 9 x 21 Minute EMA but then you need to be sure about the risk reward ratio and other things.
Good luck Joe, stay profitable 🙂
9*21 minutes? It is 9*21 days right? Confused confused confused.
It can be days or minutes, based on what you select!
What is short covering? Intra day due square off obligations required to go for buy but how it is happening in futures and equity market?long unwinding is just the opposit of short covering…
Short Covering = the act of traders covering their short positions (preferably with a profit). Short covering requires you to buy back futures, hence leads to a mini rally.
Long unwinding is just the opposite.
Hi karthik,on August 24th our market has crashed one of the biggest single day fall since 2008 recession anticipated further fall but very next day market rebounded more than 100 points and stocks like Hdfc recouped the loss,how can we predict after a great fall like I mentioned that a bounce can happen,or it was domestic play…
Honestly its very difficult to predict such short term moves. However years of solid market experience will help you to some extent.
I\’ve been reading the text book for last few days but nothing came that close to understand MA the way you have articulated Karthik. Indeed very simple and anyone can understand this. Now apologise for my lack of knowledge. Can you help me to know how do I draw these MA in the chart when I open a chart for a commodity?
Thanks for the kind words and encouragement Joe 🙂 I\’ve posted the answer in your other comment.
Sir, I am 24 year old. I don\’t have any economic, finance or commerce background. But, I am good at Mathmatics since. I enjoyed your tutorials a lot and understood market from scratch.
I have Rs.20,000 to invest in and start trading alongside a job. Is it possible to start trading with such a low investment ?? Could you please help. Thank you.
My sincerer advice – don\’t use that money for trading. I\’d suggest you invest that money and learn the how long term investment works before getting into trading.
Thanks sir. Could you please suggest me what are sources to learn about long term investment. I started an SIP of Rs2000. Would be grateful if you suggest what all should I study before start trading. Thanks.
I\’d suggest you read our module on FA, you will get a good idea on long term investing – http://zerodha.com/varsity/module/fundamental-analysis/
ok, sir thank u, will check option strategies
but 9*21 generates lots of false signals and how to identify false signals? is there any other indicator which can be clubbed with 9*21 to avoid false signals? if s please suggest me how to use it.
or else out of your experience if u have any trading strategy either long term or short term please share with us.
Harish try and increase the MA timeframe for fewer false signals. Something like 21 x 50 should also be ok. I\’ve been discussing a lot of strategies in the Option strategies module (Module 6).
Hello Karthik,
What would be entry point and stop loss for 9 cross 21 or may be strategy for that matter .
I understand that Entry point would be the cross over point but what if cross over has already happened few hours back and in that case what would be my entry point and Stop loss for the same .
Please suggest .
The best thing to do is to wait for a retracement till the moving average.
Yes Karthik That\’s fine . But you know the cross over for 9*21 doesn\’t happen that often as 9*21 ON A 15 MIN Chart happens once or twice In a day and that too rarely and waiting for it to happen again is like am not going to trade at all for that day . What be your suggestion on this . Do you say that I should start looking for an different opportunity on a different stock if the crossover has happened couple of Hours before .
Thank you in advance
Yes, you should expand the watchlist, Anuragh. It is best if the trade originates on its own rather than we trying to forcibly look for one.
if at all using a short term moving average is beneficial which short term average to use? can u please suggest any one?
For day trading I prefer 9×21 crossover on a 5 min chart.
thank u for responding to my problem.
s we can use short term moving average to lock in profits it will work fine when there is a short term trend like i have posted a picture.
but what if there is a big trend like below picture,
in that we will get out of trade at some point according to short term moving average and book good amount of profits, but when to re enter into trade when rally continues?
Well, if you are following a moving average system (any system actually) then the only way to ensure success is by taking all the trades that the system suggests. You cannot be subjective here. So you will be required to reenter when the MA suggest a crossover a generates a buy signal.
hi karthik
i really liked the way u refer to all the doubts.
even i have a doubt actually and i hope i will get something from u.
my doubt:
is yes definitely all the trading system with moving averages works upto 70% accuracy and our entry points will be accurate but am not able to book profit am unable to decide how much profit to take. when price reaches certain level am unable to decide whether i have to book my profits and get out of the trade or have to continue so that price will go further. for example i use 200 ema with 15 min time frame few days back in nifty i took long position around 7450 and price reached 7600 and i thought price may go further but it started declining now today it reached 7507 and i couldn\’t encash maximum profits. can u please suggest me who to deal with this
Harish – this is a tricky problem. Why don\’t you try having a short term moving average to trail your stoploss?. This should help you lock in your profits as the stock moves in your favor.
Hello sir can u tell me in intraday trading for crude oil and nickle which technical indicator should be uaed like sma , stochastic, or RSI and which configuration should we taken
All indicators are applicable to commodities as well. I personally prefer the 9 and 21 day EMA for intraday trading.
Hi Karthik
Apologies for this silly question. Could you help me to know how do I draw this 9*21 EMA in the chart for any commodities in intraday?
This should be quite simple. Which s/w do you use? If you are using Pi or Kite our support executive should be able to help you, suggest you give them a call.
Thanks Karthik. The support executive did help me the other day when I called them. I\’m using PI.
Sure, by the way you should also try Kite – https://kite.zerodha.com/
Dear Karthik,
Please refer to the ACC chart, do you think its the time to take long position?
Well, the hammer looks enticing. Please make sure other items on the checklist align.
Karthik,
The ACC chart is of 10*21 EMA, but as i have learnt from theory in this chapter, Buy signal is generated when the short term MA turns greater than Long term MA. But according to the chart it should be a sell signal… Am i going wrong somewhere?Plz help
Not really Arun, the stock is trending up and MA\’s are suggesting a buy.
But the shorter Ema (10) is less than 21 ema at the hammer formation.So how it can b a buy?
I personally like to make the decision to buy or sell based on candlesticks. Indicators including MAs only give me that 2nd opinion.
Hi Karthik,
Can you please refer to the Adani Ports chart?
Is the bullishness to be continued based on the MA Crossover and last candle being a Bullish Maribozu?
Regards,
Somnath.
It certainly looks bullish, but do watch out for the low volume on the Bullish Marubuzo.
1) basic calculus seems like something i did during my 12th boards , i think i should be workable for me .
i downloaded the sample pages it just had problems & solutions ….. how exactly should i use this book , like a workbook to practice problem solving ?
2) is it a good idea to trade options based \”ONLY\” on MACD signals of underlying ? (my idea is buy only OTM / far OTM CE-PE , as per the signal , without considering/calculating any of the greeks )
1) The idea is to first get comfortable with basic mathematics. Once you do that you can look for a structured program on financial mathematics – I guess Coursera has few.
2) No.
thanks merry christmas & happy newyear 🙂
in PI MACD is plotted below the chart i wish to plot the MACD on live chart . shall i do it manually ?
i understood the long cycle= 26, short cycle = 13 , but what exactly does the signal cycle = 9 mean ?
which should be given more importance, MACD or MACD histogram ?
should RSI be used only as a supportive indicator to our buying & shorting desicions or we can trade using RSI indicator alone?
Regarding how to plot, I would suggest you reach out to my colleague Srini – [email protected]
I would suggest you pay attention to the MACD line as such.
Also, your main thesis to trade should stem from candlestick/fundamentals/quants. Indicators alone should not be your main criteria to set up trade.
yes i do take candlesticks into consideration .
1) what exactly do u mean by fundamentals & quants ( strictly w.r.t commodities ) ?
2) \”pay attention to MACD \” you mean simple MACD or MACD HISTOGRAM ?
3)should RSI be used only as a supportive indicator to our buying & shorting desicions or we can trade using RSI indicator alone?
4) once a good strategy is finalized then is automatic trading a good option for retail traders ?
5) what are the most common auto-trading strategies used in markets by retail / institutional traders ?
Answers as below –
1) Fundamentals such as demand and supply situation, production data etc. Quant is more of statistical data.
2) MACD Line
3) Supporting indicator
4) Yes
5) Moving average system perhaps?
i would like to know /learn more about \” quants \” . what can be an ideal source for this ?
with regars to supply & demand , production data … shall we consider CME to be relevant ? what other sources for the same ?
You will have to start with understanding basic calculus to deal with Quants for Finance. If you are not familiar with calculus, then here is a good book to start with – http://www.mhprofessional.com/product.php?isbn=0071795537&cat=145
CME is good.
Dear Sir, I am trading in Copper and Crude using 10 min sma crossing 50sma . also watch 200ema. all on 3 min and 5 mins chart. but some times the chart line takes a u turn on touching the slow one. this makes a lot of trouble. can you suggest a better format for trading in copper and crude? i would like to learn some better ideas from you. how it can be organised. please suggest
Pradeep – very shortly we would be covering commodities. Suggest you kindly wait for a little more time.
Hi,
I am using 9-21 EMA and 9 RSI (80%-20%) is it right setting for intra-day trading?
Yes, as long as it works 🙂
I have just gone through EMA cross over chart pattern and want to experiment 15*30 minutes on day trading. Is 15*30 ok or anyother else to be tried?
Kindly inform if the same chart is available in Kite or PI software and if yes, in which drop down box or how to create? I request to guide step by step.
I ll be highly grateful to you.
Regards,
Yes, the same is available in Kite and Pi. You just need to overalay the moving averages on the prices. Suggest you call our support and they will explain this better to you.
15 * 30 is good to go with! All the best.
1) is it true that moving averages do not generate false / loss making calls ?
2) i use PI and i am not aware which indicators to use for intraday trading ?
3) what should be ideal timeframe for candlestick chart for intraday & ideal MA gap between short & long MA for MA signal generation ?
4) anyway to combine other indicators with MA to generate better signals ? which combination would u suggest ?
5) if you can be kind enough to share which indicator / combination you use for your trading ?
thank you
I got that : One can decide to make fresh buy position as soon as stock prices goes above the 50 Day SMA butif Day SMA ? then he will not be able to maximize profit ? How can he decide to sell at highest or near High price b/w those 2 points? If he waits for stock to come down the 50 Day SMA, he would be missing the oppurtunity to sell at high b/w those 2 points.
You cant really time the markets to perfection. Even if you capture 40% of the rally, its job well done.
1) is it true that moving averages do not generate false / loss making calls ?
2) i use PI and i am not aware which indicators to use for intraday trading ?
3) what should be ideal timeframe for candlestick chart for intraday & ideal MA gap between short & long MA for MA signal generation ?
4) anyway to combine other indicators with MA to generate better signals ? which combination would u suggest ?
5) if you can be kind enough to share which indicator / combination you use for your trading ?
thank you
1) MA do tend to give out false signals especially during sideways markets
2) Start with simple MA indicators, this should be good
3) Higher the frequency, lesser the noise component. Suggest you use 15 mins data for intraday
4) MA + Candlesticks + Support Resistance should be a good start
5) Many, depends on the situation. More often than not i look at MAs.
Say I want trade with TATA MOTORS futures contract 1 lot. Lot size I will know. My question is will I be able to buy this futures contract of TATA MOTORS of 29 Oct 2015 @ current market price. Or it\’s price is special and different from current market price of TATA MOTORS?
You could look up futures price directly on Kite or Pi.
Suppose I want to do intraday trading with my capital x 10 or 20 ( brokers capital or margin money or leverage etc. in say TATA MOTORS cash equity segment. Hence my capacity now is to buy 1000 shares at one go or sell the same. Can you tell me exactly as to I have to look to which indicator so that I can buy shares or take entry? Same for selling or exit? Or say first sell then buy at low? From the candles I am sure even God can earn profit. Some other tools like PSAR, AVERAGE, SUPER TREND must be used. What is this 20 days EMA and 50 days EMA? Where can I get it? Where exactly MCAD is used?
For margins – https://zerodha.com/margin-calculator/SPAN/
MACD – http://zerodha.com/varsity/chapter/indicators-part-2/
EMA is discussed the same chapter.
Sir,
I trade intraday in Nifty. I have to pick only 5 points with 50 qty. Because I want to make 20-30 trades daily so I can get huge profit by end of day.
Kindly tell me these parameters :
1. Periodicity, interval & days in chart
2. EMA Crossover Slow & Fast interval
3. How to draw a moving average line on the volume bars
4. Which indicators should I use? ( MACD, RSI, BB )
I\’m afraid I may not be the right person to answer this, for I don\’t know how to generate these kinds of trades on a daily basis. However I can answer your 3rd question –
To plot the MA over volumes – it depends on the software you use. Usually this can be done by dragging and dropping the volume indicator from the tool bar on the volume data.
karthik,
How can i draw MA on volume chart in kite?Which variable to select in studies list??
Yes, this is possible.
But which variable to select in study list?
In studies select moving avg
In field select volume in place of close
Done
Cheers!
i attempted to create EMA with 9X21, 21X50, 50X100 for 1 day intraday, 1 week and 6 months (tried all three EMA’s for each time frame for same frame in differnet charts) but could not find any crossover. I did it for Lupin Shares from 17-July-2015 to 24-July-2015. Also plotted all three in 3 different charts at same time on 24-July-2015 intraday there was not cross over happening at all.
I suspect you could inadvertently missing something here Varun. Can you please mail [email protected] and check with him once?
Karthik thanks a lot for your efforts in this module. My learning has been tremendous and loving it. I have a specific query.
On PI i attempted to create EMA with 9X21, 21X50, 50X50 for 1 day intraday, 1 week and 6 months (tried all three EMA\’s for each time frame) but could not find any crossover. I did it for Lupin Shares from 17-July-2015 to 24-July-2015. Also plotted all three in 3 different charts at same time on 24-July-2015 intraday there was not cross over happening at all. This particular share had beautiful price movement (a prerequiste for EMA). Can you help me where i am going wrong ?
CORRECTION TO ABOVE:
create EMA with 9X21, 21X50, 50X100 for 1 day
Thanks Varun. I would suggest you email [email protected] regaring Pi, he will help you with it.
This is not regarding PI but regarding Moving Averages. i understand it conceptually but not able to use it effectively.
Ah, got it. Sorry moment I saw I though it was a query on Pi 🙂
What periodicity have you selected?
Specially in crude oil, gold, silver,copper
Like I said – you can apply no problem at all.
do we use a combination of candlestick pattern, s & r and volume in commodity trading and second question is can we use ema crossover with rsi in commodity pls do reply
thank u
Absolutely – all techniques of TA is applicable to Commodities and Forex markets.
dear sir, pls suggest me which is the best EMA that can b used in nifty future trading? AND what is the best MACD?
Ok Sir, thanx a lot
🙂
Sir, for intraday charts, MACD is better or EMA is better can we use 12*25 EMA for 5, 10 & 15 min Intraday Charts?
Certainly. Although I should tell you my views are biased as I always like to use the EMA for its simplicity and matter of fact approach.
sir,how to plot EMA CROOSOVERS IN PI &when we plot s&r the graph gets smurged(iday)should we plot s&r cloe&open a new chart of same for better visbility(cstics)r is there any other way explian both question detailly as iam not so good at basics,bcoz of ur knowledge sharing we r trying
Can you please email sreenivasulu.m at zerodha dot com for this?
which is the best stochastic intraday set up
thank u sir looking forward to other modules which are coming soon
We are working on it sir. We will put it up as soon as we can.
WHICH COMBINATIONS OF INDICATORS WE CAN USE FOR INTRADAY TRADING ON NIFTY SPOT WHICH CAN SUIT INTRADAY
KINDLY REQUEST U TO PLS SUGGEST
If you ask me – simple candlestick patterns with S&R levels should be just fine 🙂
IN SECOND CHART OF THIS NOTES HOW MANY DAYS HAVE U SELECTED OF BPCL STOCK SIR
AND THIS ALL FEATURES ARE AVAILABLE ON PI TRADING TERMINAL
AND WHAT IS DIFFERENCE BETWEEN 10 MIN EMA AND 10 DAYS EMA
AND AGAIN THE SAME Q IS THIS ALL INDICATORS AVAILABLE IN PI SOFTWARE
BPCL is EOD chart here. All these indicators and more are available on Pi. Please do visit http://www.zerodha.com/pi to know more.
10 mins EMA considers 10 min candles as look back period…likewise the 10 day EMA considers a lookback period of 10 End of day periods.
superb ananlysis sir thank u so much
sir elborate about pi trading terminal pls
Thanks for your interest. We are thinking of putting up some stuff related to Pi soon.
Hi karthik,
If i had missed a to go long during a short term ema crosses up over long term ema, Can i buy that stock after that? so that i can sell when the ema reverses?
You can as long as the run up in the stock (after the crossover) is not much.
Sir,, where to get technical analysis software
Check out http://www.zerodha.com/pi
Dear Sir,
In the above Girsh Chart on Gravita India I would like to go long as the prior trend is downward and a marabozu formed at the bottom of the trend and RSI is rising from 30-50 range. But as stated by Girish C/O of EMA`S are not suggesting. Pl. correct me. Regards
Marubuzo is the only pattern which does not require a prior trend. As long as you think the trade is good to go, you should take it.
hello Sir ,
. EMA would more whipsaws in sideways market.? if yes , is it good to prefer SMA ?
. MA gives us \’late entry\’ into a trend, how can we use PSAR along with MA system ? for right timing into trade.
thnx,
Rajesh
EMA is always more desirable as it takes into account the latest information from markets. Will probably include an additional topic on MA & PSAR sometime soon.
dear karthik ji..
I\’m very happy because of I started own researching stocks, all indicators working & zerodha technical analyst module is super, it\’s helped for a lot…must read patiently everybody who is in market and keep practising……i\’m interesting to search own indicators is\’t possible to imagine karthik ji…?
thank you
Glad to know this Girish. Yes, you can develop your one indicators…its just a matter of getting the thought process right.
karthik sir..
25-50 ema day bearish indicator, gravita stock.
thank you sir
Yes, this is a bearish cross over…but there is a picture perfect bullish Marubuzo as well 🙂
hmmm thank you sir…
karthik sir..
25-50 ema day bearish indicator.
thank you sir
Hi Karthik, thanks for presenting all this useful technical info in an excellent manner…hats off to you and your team. well my understanding is that trading based on MA crossover will not result into losses though sometimes it may be marginal profit or large profits and also at lower time frame with lesser period MA combination may result into higher whipsaws….is my observation correct?
You are absolutely correct on this one.
thanks Karthik. well I have a doubt. many a times candlestick pattern gets formed around S&R levels to confirm long or short but after sometime trend changes i.e. it breaks the S&R level and trade goes against us. against this pattern strategy, MA crossover strategy ensures that either trade is in our favour or marginally against unless strong gap up or gap down opening. so why have you kept the candlestick pattern on top in the checklist when MA crossover strategy gives better results? though it is good to have all the checklist items but its not possible in the intra-day trade. also how safe is to do intra day trade based on flat MA crossover strategy? thanks in advance for your time and advise.
Well, the problem with MA strategy is that they work very well in a trending market. But market can remain range bound for more time than anyone can imagine. In fact the whole of 2012 was range bound with virtually no movement in the market. In such circumstances MA based strategies just wont work, hence you will have to rely on candlesticks to identify opportunities. Like with anything else, relying on just 1 technique may be not a great idea in markets.
Even i tried triple combination cross over MA of 9X15X21, once 9 crosses 15, alert signal & after 21 taking position. Sometimes it\’s not working well which results in loss.
Vasanth – to begin with try increasing your time frame. Maybe 5 mins is too short. Explore (paper trade) 15 mins time frame and on that try 3 x 5 or 9 x 21 combination. Also stick to indices to begin with.
Try 13 / 21 /34 in 5 min works 80% strike rate with momuntem indicator
Hi can we write in script to get alerts?. If you know, can I please guide me
Check this – https://zerodha.com/expert-advisors/
What does the below code mentioned in above link means?
BUY SCript:
REF(OPEN,1)>REF(CLOSE,1) AND
REF(OPEN,2)>REF(CLOSE,2) AND
REF(CLOSE,1)=REF(CLOSE,2) AND
REF(LOW,1)= REF(LOW,2)
Sell Script:
REF(OPEN,1)>REF(CLOSE,1) AND
REF(OPEN,2)>REF(CLOSE,2)
Looks like a script where buy and sell signals are generated based on comparing OHLC data.
Consistently I tried 9X21 MA cross over in 5 Mins Intraday chart but sometimes it get failed. Can you suggest Crossover MA strategy with any combination for best results? Like candlesticks with R&S and Volume…
How to be cautious & avoid trading in whipsaws while using MA cross over strategy?
This really depends on your time frame. As a rule of thumb, the longer the MA combination the lesser the whipsaws. For example a 20 x 9 MA crossover system will generate lesser whipsaws when compared to 3 x 5 MA crossover.
Pls refer above comments . my resech on how to avoid whipsaws in moving avarages
Sure. I\’ve not really worked with these MA combinations, hence cant really comment.
want trading in bank nifty future.I request any experience trader who can advice about MA, Indicators , Time frames etc .Thanks
The underlying does not make any difference. Whether you are trading Nifty futures, Bank Nifty Futures, or Crude Oil futures the principle of trading remains the same.
If i am looking after 5 Mins intraday chart which time frame can give better result while using Cross over MA alone?
Try 21 x 9 average. I\’m not saying this is the best combination…but you may want to just give it a shot.
When u say 5 minute intra day chart and 21*9 AMA, it means the candlestick will form every 5 minute and the two AMA will be 21 DAYS average and 9 DAYS average right?
Somewhere you had said 50*100 means number of candles you want and I\’m getting more and more confused 🙁
How to interpret this whenever you say something about x * y
Virender, 5 * 21 day SMA means that a moving average will be formed using 5-day closing price and another moving average will be formed over 21-day closing price. Replace the day with minute, the interpretation remains the same.
Hi Karthik,
If i want to use 15*30min then 100ma and 200ma converts into 1500 and 6000 mins or what please confirm I am having a confusion in it.
I\’m not sure what you mean by 15*30 mins. You will have to stick to one time frame, for example, 15mins. Once you do that, 100 MA will correspond to the last the average of the last 100, 15 minutes candle. Likewise with 200MA.
Can i use Moving average cross over system alone to take the trading decision? If so what\’s the probability of success rate?
I have checked alone also it\’s giving good result even if low voume. Requesting your suggestion please.
Can i use Moving average cross over system alone to take the trading decision? If so what\’s the probability of success rate?
I have checked alone also it\’s giving good result even if low volume. Requesting your suggestion please.
Can i use Moving average cross over system alone to take the trading decision? If so what\’s the probability of success rate?
I have checked alone also it\’s giving good result. Requesting your suggestion please.
Of course you can. But do remember a solid MA system with high success ratio requires you have a long term averages …something like 50 day x 100 day or 100 day x 200 day…but when you do so the number of trading signals reduces. In essence higher the time frame, better the accuracy and lower the number of signals.
SIR CAN YOU INCLUDE ONE TOPIC ON HOW TO CUT DOWN WHIPSAWS . IN EVERY INDICATOR . IF THIS IS IN RESPONSES HERE ,THIS WILL NOT BE SEEN BY ALL .
Yes, one of the best ways to deal with this is keeping a \’trailing stoploss\’. Will talk about it sometime soon. Thanks.
if we r using MA system , i think Long/Short Entry into whipsaw is unavoidable (i.e. whipsaw is visible only in hindsight)
breakouts often happen after lengthy whipsaw.
what really matters is \’exit\’ condition.
if exit point is well defined , one can profit from whipsaws too.. or in some cases , whipsaws are very desirable. ( : scalping ? )
(e.g. , CLOSE > (REF(CLOSE,3) + 10))
You are right on this…also, whipsaws are very desirable for scalping…even here exit matters.
Hi Karthik,
I did not understand the code mentioned by DR1184 in the end of his comment. What does that mean?..
Also is there a chapter which takes us through the codes and formulas?..
The code is just an exit condition for the trade wherein it specifies \”I would like to exit the trade when the closing price of the current candle exceeds the close value of the last 3 candles plus 10 more points\”.
We are in the process of structuring the content for \”AFL for traders\” which is all about coding the formulas in the AFL (Amibroker formula language), will keep you posted on that. Meanwhile please do follow us on twitter for instant updates — http://www.twitter.com/ZVarsity
Sir,
First of all, many many congratulations for your effort, I\’ve not seen such an effort to educate & support traders. God bless.
I\’ve a doubt regarding the MA crossover system (last figure of this chapter – 25&50 MA crossover). The first two trades are in loss, as we entered @ high and exit @ low, please clarify.
With best of my regards,
Arunava BHattacharya.
Thank you 🙂
Yes, the first 2 trades are loss making. This is because the stock was in a sideways movement. MA crossover works best when we have a trending market and fails when we are in sideways market. This is what is being highlighted in the chart.
sir if you observe care fully the candle in which crossover has happened in all the cases , there is one thing common .
Bullish Candle?
candle { crossover} high or low has to be broken and CLOSE above or below , THAN TAKE IN THE NEXT CANDLE . IT IS SIMPLE . STOPLOSS PREVIOUS CANDLE LOW OR HIGH , TECHNICALLY SPEAKING THERE HAS TO BE STRENGTH AFTER THE CROSSOVER TO MOVE . YOU COULD HAVE INSIDE BAR IF THERE IS NO STRENGTH , WHICH WILL GIVE THE DIRECTION OF THE TRADE .
Interesting perspective there. Hope readers benefit from the insight.
Dear Rajesh and Karthik
I hope you don\’t mind my ignorance as I am totally new to this sort of analysis. It has been a commendable effort from Zerodha team to come with such an effort for novices like us.
Could you please explain in detail the perspective in the last reply of yours… I am not sure I got you.
Thanks in advance.
Hopefully Rajesh should pitch in 🙂
Hi Karthik,
In the below chart even though the Price is Retracing Upwards the EMA cross over has hapend , how trade can be avoided in this type of situation , also what other indicator i can mix with this to filter the same .
Nithesh, few things I notice from this chart –
1) I see a very nice double bottom formation ard 4345 suggesting a long
2) I see a hammer being formed at the end of the 2nd double bottom suggesting a long
3) Volumes are great
4) MACD crossover suggests a long
If both S&R also are supportive, then I guess this is a clear case of being long on this stock. Also, for it is best if you overlay the moving averages on the price chart and not on a separate plane.
Can you tell me what MACD, RSI, FSTO (in the given chart) stand for?
They are all technical indicators. I would suggest you go through Chapters 14 & 15 for more details.
Dear karthik,
Is it ok to use 3×13 EMA Crossover for short term trading?, also, if yes what other parameters to be considered in this case for better profit opportunity?
Yeah, you can use 3 x 13 EMA. In fact you can backtest this on Pi to figure out the profitability. Check this http://zerodha.com/z-connect/tradezerodha/pi-tradezerodha/eas-for-auto-buysell-signals-pi
Karthik could you please share this chart with us so that we can have idea about the formation?
Thanks.
Which chart, Swapnil?
bro see my jan 5 th comment on how whipsaws can be avoided , if you go on including indicators you can never trade totally confused ,in above situation ,even macd is telling it will go up .( flat macd method ).
Hi Karthik
How to Trade the Below Situation when no cross overs happening and the RSI and Stoacstics not in Favor of short trade
From what I can see from the chart, clearly the trade is in favor of a long position. This is because the MA cross over has already happened and it seems like a trend is being formed. I would wait for a retracement on low volumes to enter a position. Ofcoure, the other checklist items should also comply.
Karthik Can you Please explain something about divergence
Hi nitesh,
A stock is said to be in divergence when the momentum forms lower peaks while the stock is forming higher peaks….
Reverse is true for bear markets.. Hav a look at the following picture for a better understanding..
Thanks JAGADEESH
Jagadeesh has posted a quick background information. I will try and elaborate on it sometime soon…but I personally don\’t like to look at divergence and convergence, hence have not covered it in Varsity.
Which crossover system and candle chart are preferable for intra day trading in MCX bullion market. Thank you.
Irrespective of the asset class for intra day trading I would advice 10 or 15 mins charts..as longer the time duration is longer, the more reliable is the trading signal. Going by the same logic, I would advice you to use slightly longer term MA cross over for better accuracy.
Thanks Sir,
Thanks for your valuable guidance pl tell me in 10/15 mint chart or in intra day trading which indicator are best to do technical analysis,
I am new here in this field and using Zerodha as my preferred broker ☺
Thanks in advance!
I personally prefer the moving averages, they are simple and helps in most cases.
how to avoid whip saws in the cross over systems
You can avoid whip saws to some extent by using a higher value moving average.
how to avoid whipsaw of higher value cross over , if you continue this there won\’t
be any trade to take , can you elaborate on your answer. if you go on choosing higher value where is the end .
Agreed. The thing is, if you choose a higher MA cross over, whipsaws are reduced to a great extent. However avoiding whipsaws while using MA system is not possible…especially when the markets are moving sideways. So between the two i.e lower MA and higher MA, I would suggest a higher value MA crossover as it tends to reduces the whipsaws.
Karthik, Can you enlighten me on whipsaws. I\’m new to that word
Whipsaw is a term used when the market fluctuates between two price points for a prolonged period. For example if a stock is trading between 950 and 975 for the longest period then both bulls and bears will find it difficult to make meaningful money. This is because the stock is fluctuating between two price levels (which are close to each other)…and usually the fluctuations are rapid. This is called \”Whipsaws\”.
Thanks Karthik for the explanation of whipsaw, I knew what it meant, but was not sure why this happens. One idea that i had was whipsaw was a result of some negative news in the market at that time.
Cheers, happy to clear that doubt for you 🙂
🙂
If there are whipsaws, then doesn\’t it mean that there is no trend and we shouldn\’t use MA Crossover in no-trend market.
Yes, MAs does not really give you great results when the markets whipsaws.
average is average whats higher and lower in it??
Moving average – changes as new data flows in.
but suppose if i wanna take average of last 5 sessions (1st day, 2nd day, 3rd day, 4th day, 5th day)and its 1000 then whats the higher value in this . the only value we have is 1000.whats the high average and low average we have only 1 average and ie 1000
i hope i made my que clear to u
What if the data on the 5th day is skewed and your average jumps to 1000 from the usual 650?
Hello Sir,
First of all thank you so much for what you guys are doing . 🙂
I have a doubt.Can i select 9×21 crossover system on 5min. chart for intraday opportunities?
Thanks 🙂
Yes, you can use a 9 x 21 on a 5 minute candle.
I have a one question regarding use MA crossover system how its work and how we can find call . in both line.. for intraday.
Sure, please do ask the same.
Can you explain how to draw 15 * 30 mins crossover ? I am not clear
You will first need to decide on the number of candles for which you want the MA. Then, you can open a 15 min chart and add 2 moving averages with the period \’X\’ and \’X*2\’
Say you want to plot for 100 candles. Choose 100 for 1st MA and 200 for 2nd MA. That will give you a 15 min * 30 min crossover
The period you have mentioned is in days. How can we select no of candles in 15*30 minutes chart and how to plot chat for 15*30minutes. Please tell clearly as I am new to using the tools.
Sir, as you rightly mentioned, I\’ve also noticed that MA\’s perform whenever the market\’s in a trend. However, I\’ve observed this quite often and feel that the duration of the EMA crossovers need to be backtested on a scrip across its historical data points to arrive at the best possible trade entry/exit positions. For ex: I\’ve found that a 5×20 EMA crossover on 5-min Heikin Ashi candlestick pattern works pretty well for HINDALCO.
Agree, Rajiv. It is always good to trade with deeper insights.
Does it work for Intraday trade?
Yup, it does.
Sir can you tell me in last chart there are two moving averages .my ques. Is
Why those lines are getting up and down with each other.?
I\’d suggest you read the chapter again, Sahil. Its explained well there.