
2.1– Overview
In the previous chapter, we briefly understood technical analysis and the main difference between technical and fundamental analysis. In this chapter, we will dig a bit deeper and explore the assumptions technical analysis is based upon.
2.2 – Application on asset types
One of the greatest advantages of technical analysis is that you can apply TA on any asset class as long as the asset type has historical time series data. Time series data in technical analysis is the price information, namely – open high, low, close, volume, etc.
Here is an analogy that may help. Think about learning how to drive a car. Once you learn how to drive a car, you can drive any car, whether a Mahindra XUV or a Maruti Swift. Likewise, you only need to learn technical analysis once. Once you do so, you can apply TA on any asset class – equities, commodities, foreign exchange, fixed income, etc.
The fact that TA can be applied to multiple assets is probably one of the biggest advantages of TA compared to the other stock market research techniques. For example, one has to study the profit and loss, balance sheet, and cash flow statements when it comes to the fundamental analysis of equity. However, the fundamental analysis of commodities is completely different.
When dealing with an agricultural commodity like Coffee or Pepper, the fundamental analysis includes analyzing rainfall, harvest, demand, supply, inventory etc. However, the fundamentals of metal commodities are different, so it is for energy commodities. So every time you choose a commodity, the fundamentals change.
On the other hand, the concept of technical analysis will remain the same irrespective of the asset you are studying. For example, an indicator such as ‘Moving average convergence divergence (MACD) or ‘Relative strength index (RSI) is used the same way on equity, commodity, or currency.
2.3 – Assumption in Technical Analysis
Unlike fundamental analysts, technical analysts don’t worry about the company’s valuation. The only thing that matters is the stock’s historical trading data (price and volume) and the insights the past data provides about the future movement in stock price.
Technical Analysis is based on a few key assumptions. You need to know these assumptions to ensure you use technical analysis effectively.
1) Markets discount everything – This assumption tells us that all known and unknown information in the public domain is reflected in the latest stock price. For example, an insider could buy the company’s stock in large quantities in anticipation of a good quarterly earnings announcement. While the insider does this secretively, the price reacts, revealing to the technical analyst that something is about to happen in the stock price.
2) The ‘how’ is more important than the ‘why’ – This is an extension of the first assumption. Going with the same example discussed above – the technical analyst would not be interested in questioning why the insider bought the stock as long as the technical analyst knows how the price reacted to the insider’s action.
3) Price moves in trend – All major moves in the market are an outcome of a trend. The concept of trend is the foundation of technical analysis. For example, the recent upward movement in the NIFTY 50 Index to 18500 from 14750 did not happen overnight. This move happened in a phased manner in over 11 months. Another way to look at it is that once the trend is established, the price moves in the direction of the trend.
4) History tends to repeat itself – In the technical analysis context, the price trend tends to repeat itself. This happens because the market participants consistently react to price movements in remarkably similar ways every time the price moves in a certain direction. For example, in an uptrend, market participants get greedy and want to buy irrespective of the high price. Likewise, market participants want to sell in a downtrend irrespective of the low and unattractive prices. This human reaction has been the same towards stock prices over time, ensuring that history repeats itself.
2.4 – The Trade Summary
The Indian stock market is open from 9:15 AM to 03:30 PM. During the 6 hours 15-minute market session, millions of trades occur. Think about an individual stock – every minute, a trade gets executed on the exchange. As market participants do we need to keep track of all the different price points at which a trade is executed?
To illustrate this further, let us consider this imaginary stock in which many trades exist. Look at the picture below. Each point refers to a trade being executed at a particular time. If one manages to plot a graph that includes every second from 9:15 AM to 3:30 PM, the graph will be cluttered with many points. I’ve tried to represent this in the chart below –
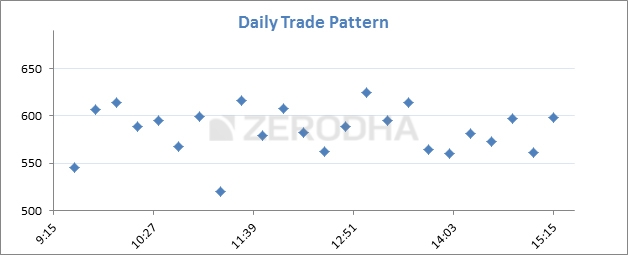
The market opened at 9:15 AM and closed at 3:30 PM, during which there were many trades. It will be practically impossible to track all these different price points. One needs a summary of the trading action and not the details on all the different price points.
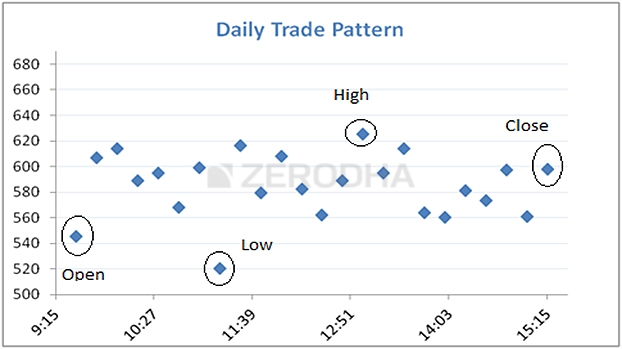
We can summarise the price action by tracking the Open, high, low, and close.
Open Price – When the markets open for trading, the first price a trade executes is called the opening price.
The High Price – This represents the highest price at which a trade occurred for the given day.
The Low Price – This represents the lowest price at which a trade occurred for the given day.
The Close Price – This is the most important price because it is the final price at which the market closes for the day. The close indicates the intraday strength and a reference price for the next day. If the close is higher than the open, it is considered a positive day; otherwise negative. Of course, we will deal with this in greater detail as we progress through the module.
The closing price also shows the market sentiment and serves as a reference point for the next day’s trading. For these reasons, closing is more important than the opening, high or low prices.
The main data points from the technical analysis perspective are open, high, low, and close prices. Each of these prices has to be plotted on the chart and analyzed.
Key takeaways from this chapter
- Its scope does not bind to technical Analysis. The TA concepts can be applied across asset classes as long as it has time-series data.
- TA is based on a few core assumptions.
- Markets discount everything
- The how is more important than the why
- Price moves in trends
- History tends to repeat itself.
- A good way to summarize the daily trading action is by marking the open, high, low, and close prices, usually abbreviated as OHLC
is the previous day closing price becomes today\’s opening price ?
No, there is no connection to closing price of today to opening price of t\’row.
I am using zeroda for trading but i am not still familiar with tools provided in kite, can you conduct a video to maximise the utilization of tools in zeroda
You can join one of Zerodha Varsity Live sessions, you will get to know a few things about the terminal.
sir can you add filter in comments like which can differentiate the question comment with the appreciation one
Hmm, that may not be possible, Sujal. But let me check with tech team once.
Hi sir, can we also watch these live sessions later on the Varsity YouTube channel if we want to revisit them for better understanding?
Unfortunately we dont record these sessions. But we conduct multiple sessions, so please join at your convenience – https://varsitylive.zerodha.com/home
Hi, Im Sanjay, currently working in Saudi Arabia.I started studying the market and trading recently;say for 3 months. I wish to enhance my skills and replace my job with trading so i can move to India completly over time with proper planning as i do have commitments. Exactly what should I do in this situation? Hope your advice might help!
Also do you provide practicle sessions?
Sanjay, firstly please be fully cognizant of what it takes to do trading full time. Its not easy and I really don\’t advice you to quit your job to do trading full time.
Thanks for the reply Mr.Karthik. As of now I don\’t want to quit my job but I really want to shift my income source gradually towards trading at some point. I need to speed up my learning process too. Do you give any practical sessions?
Now Im just learning few things whenever i get time and doing some trail and error. Im aware that there\’s a lot to learn but im desperate.
Do check the Live programs where you can interact with the mentors – https://varsitylive.zerodha.com/home
Do check this Sanjay – https://varsitylive.zerodha.com/home
Thank you
Welcome!
Sir as i remember from Zirodha site the closing price in India is the weighted average price of last 30 mins of trading session i.e. 3PM to 3.30 PM
Its not really a Zerodha thing, but thats how its done by the exchanges.
Hi,
I want to know which stock to be invested and how to analysis the stock .
Well, you\’ve come to the right place. Do give read up our content 🙂
But I want to start trading as well sir isn\’t it possible to trade with job. Isn\’t there a way out where I can trade as well as keep my job
Only option is to take swing trading positions.
Sir I am in a job working 9-5.I am working from Mon-Friday.I get free time on sat and sunday but the market is closed on these days . So how do I manage trading with my job as I\’m working in my job when the markets are open and get no time to analyse/trade the markets
It depends on what you intend to do. If you want to actively trade, then that is not possible. I\’d suggest you look at making long term investments, MFs etc.
The chart you mentioned above shows the one-day chart. If you zoom in a little by 5 sec or 1 sec, I agree that it will be difficult to interpret the data (i.e. last traded price), but don\’t you think similarly if plot those OHLC in 1-sec time frame still the interpretation will be difficult.
It will be, thats the reason I prefer EOD charts 🙂
Are videos and written content the same
They could vary slightly, but the messaging is the same.
My question is related to closing price. How do we know that the price close during going up or coming down? Explain me with both candles red and green.
You cant, hence you need to look at the price action by around 3PM and make an assessment on how likely the day is likely to end.
DOES ZERODHA TEACHES ABOUT HOW TO USE CHARTS ANY CLASS AVAILABLE THANKS
You can check this – https://varsitylive.zerodha.com/home
Thanks Karthik, Regards.
Happy learning 🙂
Hi Karthik, I came across discussions on Quora, Reddit etc, where theories abound why Technical Analysis doesn\’t work anymore, especially with the advent of High Frequency Trading/Scalping, Algos/BOTS and AI. Especially AI, which can recognize a pattern amongst millions of profitable historical patterns in its database and go long or short and close its position, even before someone has the time to form a point of view on the direction of the trade. Is the future all gloom and doom and there\’s no room for retailers?
This is true to some extent when you look at short intrday (high frequency) setups. But for positional trades (swing trades), there is still hope in life 🙂
Hey there,
Could there be an option to highlight?
Not on the website, but it is on the app.
Hi Karthik,
Can you please write a detailed chapter on Ichimoku cloud, in the context of Zerodha ichimoku charting and clearly explain the \”how\” for trend, momentum, buy and sell signals?
Thanks,
Ram
Ah, will try and do that sometime.
Hi, Consider adding a next chapter button at the end of every chapter for quick navigation.
We are working on this, hopefully soon.
what is signal line?
The line which crosses the average and gives you a signal to either go long or short.
Sir, what shall I learn first, Intraday or Investing? Currently I am a 1st Year student and have no source of stable income.
Please help , I am very confused.
You should look at investing first 🙂
The app version of Zerodha Varsity and desktop version are very different.
Certification model of Quiz / test / learning isn\’t available in desktop version???
We do have, please check this – https://zerodha.com/varsity/certified/
Hi,
With each chapter, learning about Stock market is getting interesting. But I have one suggestion, If you could consider it, Please add next and previous chapter button/link so that I could save my time from returning to chapters index and then moving on to the next chapter.
Thanks.
Thanks Kunal, we will add that soon.
Hi,
With each chapter, learning about Stock market is getting interesting. But I have one suggestion, If you could consider it, Please add next and previous chapter button/link so that I could save my time from returning to chapters index and then moving on the next chapter.
Thanks.
Hi Karthick/ Team, I came across few doubts while trying to identify a trade opportunity. If you could clarify anyone of it, it would be great. Thanks in advance.
First, Incase the current market price isn\’t matured enough as in there is no resistance level developed for that price zone, can we assume that a bear market can be anticipated in foreseeable future.
Second, if I assume that bear market is eminent and proceed to setup a trade by setting up a support level using 12-18 month data points & EMA indicators (50 days & 100 days), then the candle stick pattern which I need to identify for entry point should that be a single day candle or a weekly candle. Considering I am entering for a swing trade not intraday.
Third, Is identifying candle stick pattern necessarily the first step for establishing a trade or can we do it after seeing the EMA and S&R. Just curious.
Great content & really appreciate it.
1) No, it could also be a phase where there is price accumulation happening and the bull markets could resume. It is very hard to conclude, hence you need to evaluate the market action continuously.
2) You can work with end of day candle, that is perfectly fine.
3) Depends, if you want faster trades, then candles help, else for swing trades EMAs are also good enough.
First of all, I thank you Mr. Karthik for this excellent wtite up.
My question is about OHLC. When we talk about a candle stick for a day i can understand the concept of OHLC.
But when we talk about 1 minute or 5 minute or 15 minute candlestick pattern i am not able to understand the significance. How can there be an OHLC gor every duch small duration. Please explain
The idea is that TA can be applied to any time frame. So you can use TA for 15 mins charts. But personally I like to apply TA to 5mins and lesser time frames.
1. I trade in Nifty 50. I am a beginner. As Nifty has 50 stocks, suppose a buyer has a few stocks of Nifty 50. How does if Nifty opens at High/low affects a traders. There may be a possibility that the stock held with a trader has traded at very high level on that day while Nifty as a whole has performed low on the same day. Can anyone through some light please
Possible, hence the need to track the trend is very important 🙂
Please Add Dark Mode.
Noted, thanks for the feedback.
Karthik sir, I felt shocked to see Zerodha discontinued the bracket order and trailing stop loss due to volatility after learning about order types and technical analysis from varsity. 🙂
I need to remove these that section from Varsity 🙂
the chapter is beautifully explained with relevant diagrams.
Happy learning, Sagar 🙂
man!!! Rangappa sir has perfectly explained all this in 2018…..and im amused that all this still feels fresh in 2023….
he is suerly the most underrated teacher…..hats off to him
Thanks for the kind words, Prashanth. Happy learning 🙂
article is great
Glad you liked it. Happy learning 🙂
Kartik sir,
Please correct me if I am wrong.
Technical analysis is just the study of the actions of the market participants (so called smart money like FIIs, DIIs) who trades based on their fundamental analysis of the company and also of the whole economy. Every movement of prices in stocks are all because of the action of the big players like FIIs, DIIs.
1. Am I right sir?
2. One more question sir. Do big players like FIIs, DIIs also trade based on technical analysis or do they trade based on only fundamentals and thier sentiment?
1) TA is the study of price action Rahul. Price action is created by all sorts of participants, including the institutional folks
2) They will have a mix of studies 🙂
Kartik sir
I am providing you the link here https://www.nepalstock.com/floor-sheet
Please refer the link. This link will take you to the Nepal\’s Stock market platform which is called Nepal Stock Exchange. Here the link is the floorsheet of today\’s trading day on Nepal Stock Exchange. The liquidity and daily turnover is very low here, but we get every detail of at what price, what quantity and through which broker the trade was executed
Ah, this is called the Bhav Copy in India. Goto NSE or BSE site and look for Bhav copy, you will get similar information 🙂
Kartik sir
Can we get floorsheet of NSE and BSE if yes? Pls share the link
Floor sheet? What do you mean by this? Can you share more context?
I guess you are aware of the recent incident that happened due to momentary disconnection with exchange. Order books were updated after some delay due to errors and some had lost money due to this. In your long trading journey you might have come across similar instances of trading system/ exchange glitches. I would like to know how would you personally mitigate such type of risks and stay protected.(It looks scary looking at some of the negative experiences shared by users, so if you could give your opinion, it would be really helpful for someone like me who is just starting out.) Thanks!
Sathish, yes, I\’ve faced this too. We had a VSAT connecting 12 yrs ago, and the connectivity was lost due to torrential rains in Bangalore. I was left with positions hanging.
You work with the assumption that such incidents are few. Apart from that, whenever you take a large position, ensuring its hedged via a spread helps.
Nice and simple lecture …..
Happy learning, Dipin 🙂
Sir
If data signal and the vwap signal are not same what can be inferred.
Sorry, not sure I get what you mean by data signal. Can you share more info?
Very Simple Explanation. Thanks Zerodha Team
Happy learning!
Is online trading education provided by zerodha?
Varsity is the online initiative we have, Rituraj.
in the above graphs the price points are the LTPs of a particular point of time, right ?
Yes, its intrday.
Good day
Great content to start with. Thanks for your efforts. Its helping me learn TA in a step by step manner
Happy learning, Venkatesh!
The close serves as an indicator for the intraday strength. If the close is higher than the open, then it is considered a positive day otherwise negative. I got this line from above module. I don\’t understand one thing that closing price is refer to previous day closing or EOD. Suppose On 15 April, Closing price is 510 and on next day open price is 505. So, here we conclude that current day is going to be bullish. Is this we are referring on above line.
It depends, usually ist wrt to the previous day. But there are days when the stocks drop at open…maybe like a 5-8% drop….but through the day it recovers. One should consider such days as bullish as well.
Hi sir
Can you please Explain breifly about Buy strength and Sell Weakness ?
My understanding is Buying at low price and selling at high price.
But In the book mentioned reverse. I am confuse on this. Highly Appreciated if anyone clarify my doubt.
In the book 👇
Buy strength and sell weakness – Strength is represented by a bullish (blue)
candle and weakness by a bearish (red) candle. Hence whenever you are buying
ensure it is a blue candle day and whenever you are selling, ensure it’s a red candle
day.
Naveen, the idea here is to buy when the stock is trending so that you can catch at least some part of the trend and profit out of it. Do note, it is nearly impossible to time the market to catch the bottom and top, so we don\’t try to do that. Instead, we will try and capture parts of the trend. The same goes with shorting the stock.
Hi Karthik Sir,
As you have mentioned about insider trading and the price reacts to his actions . Can we identify that bulk deal in TA chart before it takes place . For example pattern is showing a downward trend and all sudden insider trading has placed and price jump or it reverse the trend cause of stocks has bought in bulk .
This is a place where debacle of TA and trader faced the looses either TA get a sense of bulk deal before 5-10 mins .
I hope, you get my query .
You will have to track the volume, it will show up there. But of course, you won\’t know if it is an explicit bulk deal.
Hello Karthik ,
nice blogs , thanks for all the efforts 🙂
I did not understand what does the phrase means -> \”market discounts everything \” can you please explain ?
Thanks, Manoj. It just means that the markets know everything 🙂
Even things that you think are unknown to all, will be known to the market participants.
Hi Kartik
Firstly i would like to thank you and your company for providing this literature on stock market on varsity. Its a huge contribution from your side. Thank you for that.
I am new trader and i had a query.
On Kite platform while buying shares there is option provided by Zerodha as more. Under that there is technical. How reliable is it? Is it calculated by zerodha or is it done by other companies and displayed by zerodha under the kite platform. Thank you
Regards
Allen
Allen, glad you liked the content on Varsity. Charts on Kite are servedd by two separate companies – ChartIQ and Tradingview. Both are super popular and used by millions across the globe. So I guess its quite reliable 🙂
Very nicely answered.
Actually it is difficult to factor in all factors in TA
Sir, What do u prefer for mid term trading from investor perspective?
Yeah, depends on the opportunity.
Karthik sir, Is Technical Analysis also work in cryptocurrency also?
Its supposed to, although I\’ve never really tried.
Hello,
First of all, thank you! I am 38 and this is the first time and I am learning finance in an uncluttered way. I can imagine the amount of background work and experience required to present this. I cannot believe I am getting this for free!
My question is: What does the word \”discount\” mean in the statement \”Markets discount everything\”? \”Discount\” usually mean a deduction in the price, so what exactly does that mean here? I understand that you are saying that current price reflects everything (supporting the efficient market hypothesis) BUT why the word \”discount\” have been used here?
Thanks.
Regards…Pulkit
Thanks, Pulkit. I\’m glad you liked the content on Varsity. Discount in this context means, \’knowing all information and factoring in that information to the price\’.
Hi Kartik/ all Pros.
Is it safe to invest into smallcase?
I want to invest n leave for sme years?
I\’d suggest you look up reviews online and take a call.
I need an analyst for stocks.
Insider trading is illegal right??
Thats right.
I don\’t have my phone number linked with Aadhar. I live in Patna. How can I open a demat account in Zerodha (preferably online).
Thanks!
I\’d suggest you get your phone number linked with AADHAR, you can do that by visiting the UIDAI website (aadhar services).
Hi Sir…You are sharing gold with free of cost…..Just one general doubt ..Nowdays i have been seeing that many professional trader taking trading courses with heavy charges …They say they are earning very good through trading then still why they start earning through courses ..why they just don\’t trade and make hell lot of money….why they teach …is there any secrets?
I am just curious to know after looking at these profession traders …will i really going to make decent money (not being greedy) through trading? What you say by your experience in trading? is it worth giving a time to learn and trade?
Being newbie and hype around trading just wanted to know this…sir please guide me.
Sagar, if someone is selling something then it means that they need that revenue from the sale 🙂
Making money via trading is really tough, I could not make it after all the years of experiments. Trading is tough. However, I\’ve had decent success with investing. But I don\’t know what\’s in store for you, maybe you have the trader mentality, you should experiment before deciding which path to take, just ensure you don\’t lose a ton of money while making this experiment.
sir, i am having difficulty in analysing trends, how prior we have to look for finding right trend?
Look at least 2-3 months data for slightly longish trades like swing trades. At least 30-15 days get get a perspective on shorter time frame trades.
pls send me subscription if any of daily news / discussion.
Very Nice
SIr,
mobile version of varsity is not updated as desktop, desktop vesrion is in more detail where as mobile version is not in detail.
pl update varsity mobile version as desktop
Its the same content, Ishant.
I have problem in reading . I have sinus disease which causes headache in front of mobile and desktop can I get a pdf so I can read hardcopy of it.
Please if u can help.
Mohit, scroll to the bottom of the page to download the PDF – https://zerodha.com/varsity/module/technical-analysis/
Pl do sending correct trading tips.
Copper at what rate buy at what rate sell.
Natural gas selling range buying range.with stop loss.
If u give free service I am along with my friends will join in your account.
Unfortunately, we don\’t provide this service.
1) Markets discount everything …… Perhaps it means markets count everything sir? The context makes me think so. Market reacts to data and information. Thanks.
In general yes, all information gets factored in the price.
sorry ,this might seem a little rude but i had this doubt since many days like
if someone is a expert and has all needed knowledge about trading then, why do many want to start academies to earn money even when they can (assumption) can make millions via stock markets?
If you are referring to me, well, then I\’m an average trader. Maybe a decent investor. That\’s about it.
I love to teach and help people, and hence I do what I do….and whatever I teach if for free, and don\’t charge money for it. I don\’t know about others 🙂
I want to know your views in trading (intraday and swing trading) vs investing. I read about traders who trade daily based on PRICE ACTION and earn decent money, what are your views on them?
These are all different ways to trade, Prince. All I can say is that it takes a great deal to stay consistent at intrday trading.
Dear sir,
I am a student studying in grade 10 I have read the first 2 modules of varsity and have also done external research on the stock market. Your module helped me a lot to understand the basics of the stock market. I have made a report on the stock market 10 pages long based on the first 2 modules of Varsity and external research. If you have time, you could read it and give me feedback. If you are interested to read it and give me feedback, you can give me your email address in the reply so I can email the report to you. Could you also please suggest me about where should I publish the report?
Sure, let me send you an email.
How close is different from low?
CLose is the closing price for the day, low is the lowest traded price for the day.
Does technical analysis discount short selling in the market?
Can you share more context?
What would be the best stocks for intra-day trading..
It does not matter as long as there is liquidity in the stock.
Hi Zerodha,
I am a very old client of Zerodha and trying to learn intraday trading, can you please help me with price action learning.
Thanks,
Mahesh
Entire candlestick pattern is based on price action, Mahesh.
How I can trail stop loss in zerodha account?
You can use BO orders for this.
Hi, I am the beginner and I want to learn the trading from scratch. Kindly suggest me tools or learning path. Currently I am reading your sessions on varsity and they are very well explained.
I\’d suggest you complete this module and see how you feel at the end of it. In my opinion, this should be perfectly good place to start.
Good evening Sir,
It seems like you missed on my comment, hence I am posting my query here again,
If market moves on the basis of “Demand and Supply”, then what causes the market to have gap openings? Similarly there are no trades taking place during the market pre opening, then what causes the market fluctuations?
Excess demand or excess supply causes gaps. The fluctuations are wild, does not really indicate anything meaningful, so don\’t read too much into it.
Hi Karthik, Newbie here, first assumption of TA – \”Market discount everything\”. what does this exactly mean?
It just means, the market knows everything and there is no free lunch for anyone 🙂
Sir,
If market moves on the basis of \”Demand and Supply\”, then what causes the market to have gap openings? Similarly there are no trades taking place during the market pre opening, then I would like to know what causes the market fluctuations?
Hi Karthik Sir,
The Technical analysis module is very good. I just want to know how can we leverage this Technical analysis for Options Trading, considering that Option premium decays every passing day?
Thanks.
You will have to connect all the dots and build your own trading strategy for this, Maruthi 🙂
kaya pala dito ma apply yong EOD,,
In the first core assumption of the TA assumptions,
Is that MARKET DISCOUNT EVERYTHING or MARKET DISCLOSE EVERYTHING….??
From the given example it seems, even though an insider purchased the shares secretly, the market trend has revealed that more shares of the company are being bought and letting the traders know that its a good buy.
Means markets will reveal through their price trend, even if someone purchases lots of shares secretly.
Am I correct….??
Correct me if I\’m wrong.
Its \’Market discounts everything\’. Yes, via price trend and volumes.
Thank you so much for such a valuable Content. As I\’m a fresher for this market, your words are really very helpful for me . Currently I\’m working in NISM Certification related training institute.
so i am trading on 14th then for the stock to be high the previous close of 14th should be higher than the open of 14th is it correct now sir
sir,
i am having a confusion if i am right what i am saying is correct or not clarify me
sir if the close price of 11-10-19 is 100 it will be mention on 14-10-19 as previous close and the open i should take of 11-10-19 if it is 90 then previous close shown on 14-10-19 is greater than open of 11-10-19 so on 14-10-19 mostly the share will go high am i correct sir. i am confused by which open i should take is it of 11th or 14th. please correct me
Since you are trading on 14th, consider the opening on the 14th.
Hi,
Everybody has a different time on their watch/clock even though it may vary by few seconds to 1-2 minutes. So if you are referring to 9.15 or 15.30 which standard/website is a reference by which i can assume market has started its operations.
PS: Please note it is not necessary to write 15.30 PM as 15.30 itself can give full meaning.
Adithya, it is as per IST. Pointed noted wrt 15:30 PM 🙂
Hello Karthik, thank you for replying back and also would like to thank you for creating a such great content. It\’s very valuable.
I would really like to take online training. Can I please ask do you provide online training?
Much appreciated,
Jass
Glad to know that, Jass. All our education offering is via Varsity, no separate offering as such 🙂
Hi, I am trying to average line(10days) in On Balance Volume indicator similar to that option we have in RSI .Please let whether it is feasible in Zerodha
I\’d suggest you right-click on load the parameters to check if this option is available.
Hi I would like to ask that how relevant this material is in regards to the international markets? Or is it just relevant to indian stock market?
I\’m pretty new to stock market and trying to gain knowledge and I can tell you that all these modules are hidden treasures, I have not come across this type of awesome stuff. It is really a top stuff.
Technical Analysis can be applied to any asset which has a time series data (OHLC). It does not matter which market 🙂
Happy Teacher\’s Day Karthik sir. Celebrate it with a glass of teachers in the evening perhaps 🙂 Great learning tool you\’ve built here
Thanks, Madhavi, I\’ll reserve the teachers for the weekend I guess 🙂
Good morning Karthikji
Wishing you a very Happy Teachers Day 🌹.
But for you we wouldn\’t have been here today successfully in unforgiving Stock Market . God bless you to healthy & wealthy life 🙂 ❤
Harsh, thank you so much for your kind wishes! I hope you continue to enjoy reading and learning from this platform 🙂
How do you come up with a target for all time breakout stock?
You can look for S&R for this, Milind.
sir
there are few paid online lecture ( of technical analysis) .
can we claim this kind of business educational expense in itr.
thanking you
I\’m not really sure about that, Ashwani. I think you need to check with your CA.
Hi Sir,
I am new to the market, after reading the article I wish to have bit more clarity on why how is important than why. It will be of great help if you explain it using another example. I am unable to grasp it.
Thanks in advance
Sir No need to reply I understood the concept
Happy to note that, Akshay!
Hi Karthik,
I am new stock market and this perfectly written modules/chapters helps me a lot in learning about the market. Glad I found this at an early stage.
I couldn\’t resist myself from writing this comment as I advance through the topics. Am wondering how did you get time to reply to each one of these comments?
Thanks to everyone who were part of creating this wonderful content.
Sankar, I\’m glad you like the content here. Replying to queries here is now ingrained as a daily routine 🙂
If it is true that \”Markets discount everything\”, then why the stock price reacts after results of the company?
Rahul, that statement is true with most of the cases. There could be instances where the markets too can get surprised by the outcome of events.
>>The high – This represents the highest price at which the market participants were willing to transact for the given day.
Is this not the the price at which a trade actually occurred and not the price at which market participants were willing to transact.
Yes, this was the highest price traders paid, willing or unwillingly 🙂
Hi Karthik,
Most of the examples given here are based on day chart.. e.g. Risk taker can take the trade on the same day and risk averse buyer can take trade on next day provided all mentioned conditions are met. I have a question here.. If all these patterns are valid for intraday trading based on 15 min candles chart. i.e. Everything (like Entry, Stop loss etc) will remain same but it will be based on 15 min candle instead of day candle. So as a risk averse trader, I will wait for the confirmation in the next 15 min candle instead of waiting for the next day.. Thanks.
Sandeep, in my experience, you are better off being a risk taker for intraday trading. No point waiting for long confirmations.
Thanks for the reply..
So if all these patterns are valid for intraday trading as well (based on 15 min candles chart)?
Say if there is a bullish Marubozu in 15 min candle, can I go long on that with low of Marubozu as SL. Similarly if there is a hammer formation, can I go long with low of hammer as SL. Can I trail the stop loss as the bottom of next candle in long trade.
Also what is the best candle structure for intraday? 15 min/5 min/3 min? Kindly confirm. And Thanks as always for your reply.
Yes, Sandeep. You certainly can do that. Trailing SL is always a good idea. I personally prefer 15 mins candle. Good luck.
Thanks for your reply. Have a nice day.
Happy learning, Sandeep!
\”context is information pertaining to the price variables namely – open high, low, close, volume etc.\”
\”,\” missing after open
Ah, I\’ll get that fixed 🙂
If I buy shares on CNC, can I sell them before actually receiving them on Demat account?
I can see the exit option so if I assume I can sell them without actually receiving, are there any extra charges or anything which are applied?
I read this query many times but couldn\’t understand the respond properly.
You can exit the next day, but this will involve BTST risk. Check this – https://zerodha.com/z-connect/queries/stock-and-fo-queries/btstatst-buyacquire-today-sell-tomorrow
Thank you for the wonderful content Kathik. I have a question regarding the open and close price of a stock . Shouldn\’t the open price be same as the close price of the stock on the previous day ? I mean after market closes , the price of the stock should remain same .Am I right ?
Not really, Abhishek. There could be multiple things which could happen overnight (after the market close), which can influence the price of the stock. This can alter the potential demand and supply at the opening, therefore different price at open.
Hello Kartik,
I have read all the modules in versity.Thanks for it.I was knowing nothing about share market before 2 months.
My question is,
If I want to see market,charts,indicators; all live for free just to understand it, where can I see it ?
Dipak, if you have a trading account, login to the platform and you can see it all happening right in front of you.
Hi Karthik,
I think it makes sense identify the Stock price based on the technical analysis, but how this is applicable to Index like NIFTY as NIFTY movement is based on all 50 stocks. Without considering the 50 stocks, how is it possible to identify NIFTY movement. That too each stock has different weight in index movement. Please clarify me.
Thanks
Satya
YOu consider the 50 stocks as 1 basket and apply TA on it.
Hi Karthik,
Thanks for your response. I am thinking the accuracy is more in Stocks that Index in TA as 50 stocks traders in INDEX may not react in the same way like earlier.
Please correct me know if I am wrong.
Regards
Satya.
Hmmm, this will be a tricky argument. I see it another way – it is safer because no one stock can influence the movement. For example, if Vakrangee was in the Index, then the movement in Vakrangee would not have a major impact since there are other 49 stocks in the index.
Hi Karthik,
I am planning to become a professional trader, in the interim I have started learning Technical analysis to do intraday trading. What else do I need to read or refer to or learn before starting intraday trading. I could not find any one who could answer this for me, hence consulting you
Jeevan, here is a very sincere advice – do not quite your full-time job with a hope to become a full-time trader. This can become too stressful for you and your family. Good knowledge on FA, TA, Futures, and options will help.
Could you please explain how following price decided by exchanges like NSE/BSE for specific scrip
1. Days low price
2. Days high price
The exchanges have no role in deciding the prices, they are purely a function of demand and supply.
Hi Kartik,
Thanks for your prompt response, but I have a doubt when stock open price decide by supply and demand equilibrium logic, who and how this high and low prices are decided? please throw me some light to understand this logic..
This is based on the prevailing sentiment – bullish sentiment takes the prices higher and likewise bearish sentiment drags it down and with that, the highs and lows are created. Remember, the market is meant for price discovery, which is a natural process.
Hi Karthik,
Once again thanks, but my doubt is all about Lower price band and upper price band calculation logic, as I couldn\’t find information of these two prices calculations in respective day.
The price band or circuit is usually 5%, 10 %, or 20%.
sir ji
i read all of you research, and it is very interesting ,healpfull, and motivated. I want to this material pdf in my laptop. please tell me about this.
thanks and regards.
Amit, the PDF is already available. Please scroll to the end of the chapter – https://zerodha.com/varsity/module/technical-analysis/ and click on download PDF link.
Happy learning!
I like the simplicity with which you have explained the concepts, sir. But I have a doubt. What should be done if the stoploss hasn\’t been breached but there is some negative news and we are sure that the trade will go haywire (e.g the recent case of PNB) Should we exit the trade as early as possible or wait for the prices to recover? Anyways, thank you for creating these modules:)
In that case you will have to take the decision and close the position, Purvil. Even if you have a system in place, some amount of gut based trading is good to have 🙂
Usually, people are afraid of learning technical analysis because of so called complex jargons.The way it is illustrated here is really superb.Hats off to zerodha.I hope zerodha team gets all the success they desire.Also, financial knowledge should be added in the school curriculum to make everyone aware of the financial markets finally it\’s the money which is being played a major role.
once again kudos to team zerodha…
Happy to note that liked the content, Sandeep. Happy learning 🙂
Hi, I have been using kite3 for making equity trades. Kite provides tool for viewing market depth of a stock which shows OHLC, volume etc. I would like to confirm if OHLC is for previous day, or open high and low are for current day (updated as time progress) and close for previous day ?
For the previous day, you can look at previous close. OHLC is for the current trading day.
So in that case Close should be indeterminate but I see a value for it during trading hours. What does close represent in here ?
That close refers to the close of the time frame you are looking at. For example, if you are looking at 10 mins chart, the close here is the close of the 10th minute. The close we were talking about earlier refers to the end of the day close, which is determined at the end of the day (as reported in the Bhav copy).
Does that mean OHLC we see in \”market depth\” of a scrip is different from the OHLC of the same scrip in chart?
Because when we see at OHLC in market depth, we do not have a time frame selected, we just look at the values!
What does the close price of a scrip in market depth represent then?
Is this value from the previous day\’s closing price?
OHLC in market depth gives you the OHLC price points up until the point. So if you look at the market dept at 12:15, you will get the OHLC up until 12:15. Close is previous day\’s close.
In section 2.3 point no 4 in 2nd last line shouldn\’t it be attractive instead of unattractive. If i am understanding it right.
Unattractive is the right word – signifies the desperation to sell.
Sir please versity ka hindi version banaya.
Will try.
Sir please varsity hindi me lao ?
Will try our best to do that. Good luck.
Hi
It seems to be that assumption 1 is in direct contradiction to assumptions 3 and 4 –
Why does the market not discount trends and historical patterns?
In fact weak form EMH, in my understanding, does not allow for 3&4 to be true while it allows for 1 to be false. According to strong EMH 1 is true while 3&4 are false. So TA philosophy seems to me to be contrary to EMH.
Is the discount only applicable on a \’macro\’ level(i.e. public information decides 95% of the price leaving 5% fluctuation to be decided by trader psychology)?
Also, can it be said that with higher number of institutional investors and even HFT firms(which have a direct effect of reducing weak market inefficiencies), the impact of trader psychology and individual irrationality will diminish?
Well, the first assumption is sort of applicable to the fundamental data. Stuff like quarterly earnings, change in product demographic, change in management, new verticals, changes in sector etc.
No, I really don\’t think institutional investors or HFTs impact the retail trader\’s psychology, however, they do bridge the price discrepancies, if any.
If you will assume market will discount trends and historical data you will fall in a loop of assumption and will never be able to determine. In my opinion Trends and Historical data also gets discounted over a period of time which again depends on case to case.
Not sure what you mean by this, Shashank. The assumption is that the Markets discounts information (like insider info) and not really trends.
Hi sir,
1. Is that since most of the people who are in market know TA and try to follow it, the history repeats?(which mean the rules of TA intact make people to repeat the history ),if so what would happen if no one tend to obey TA rule.Will the history won\’t repeat?
2.what will happen ,If everyone in the market know TA , and try to go long/short at the same time ? what i mean to ask is if everyone know TA and if TA point for a buying opportunity ,there wont be a seller at all?(since the person who was willing to sell ,also get know that this is a buy time and expect the price to go even more higher)
1) People tend to behave the same way when a certain stock makes a certain kind of move (like 5% up, 5% down etc). TA captures this and displays this in the form of a chart.
2) Trust me, people don\’t really take the kind of effort required to learn new stuff 🙂
Hi Karthik,
Just drop by to check if you have any news about the updates of Kites. Not sure if you remember me but i did ask you sometime last month about the availability of trading from the chart. if you remember i did send you a link to show you how we can trade from the chart by dragging the buy/ sell line. Let me remind you, it\’s like when we place a buy order in the chart we will see a line in the chart itself. And we can drag this line up or down to change/modify our order. it\’s really helpfull when we are day trading as we don\’t have to put the figures manually. I will really appreciate if you can update me when can we expect these kind of features in kites.
Thank you in advance.
Have you checked this thread? – https://tradingqna.com/t/kite-3-0-beta/25605
Thank you !! Do you have any plans to have the feature i\’m refering to i.e. trading from the chart itself wherein it form\’s a order line ( based on buy/sell ) and we simple have to drag the line up and down to change/modify our orders. I guess this is the only thing missing in kite, the rest is simple great. I just hope and pray that you guys do something about it so we all and enjoying trading via kite.
This may be a difficult ask, Ron :). However, let me pass on the feedback.
Hi Karthik. You r doing great favor by clarifying our queries. I am not clear about gap up or down opening which is caused by overnight news and other factors before the opening of market. However it is said that no or little trading happens in pre market trade. Without trading of shares how come the stocks move up or down when market opens? Hope u enlighten on this basic aspect. Amit DUBEY
Amit, assume the price of SBI is 315 on today\’s close. Aftermarket close, FM announces that he will recapitalize the PSU banks. Clearly, this is a great news for SBIN and the market is likely to go up. Under such a circumstance, if you were holding SBI, would you be ready to sell SBI at 315 the next day morning? No right, you\’d want a higher price – maybe 330 or 350. This is when the stock gaps up. Similarly for gap down.
Hey Karthik,
This is really good stuff, man. So well articulated and easy to understand.
I was wondering if you can suggest me some good texts on TA in addition to these modules.
Looking forward to hear from you. Keep up the awesome work.
Check out the book on Dow Theory, Edward Magee I guess.
Thanks.
Miraculously
Hello Mr Karthik Rangappa,
Request to you, please provide the PDF link of all varsity modules, so that we can read it offline also.
Thank you.
We have put it up for few modules, we are working on the rest.
Thank you So much.
Welcome!
Don\’t know if I am missing something. But I am not able to find \’Next\’ button here after each chapter.
As it used to be there earlier.
While the next button is not there, you can see a table with all the chapters, easy to navigate to other chapters. Spot this below the key takeaways.
sir i didn\’t get the point \”markets discounts everything\”. I have read the point quite a few times still could not make out a clear understanding out of it.
All known information worth knowing is already known to the market, thats what this really means.
Thanks Karthik! Good stuff.
Cheers!
i want to know about the classes or any kind of guidence is avaiable at zerodha preferably at westrn side of Mumbai
We conduct webinars on a regular basis, check our youtube channel for past programs – https://www.youtube.com/playlist?list=PLkxTRam6E2V_Kq5l-H4Xihh-nWgO6Z4d9
Hello sir,
My question is, is intraday trading over a long run a profitable business? Or one should stick with swings n long term ?
It really depends on your trading temperament. Have a look at these successful people – http://zerodha.com/z-connect/category/zerodha-60-day-challenge/winners
Hi sir,
I am learning Elliot Wave theory course, it\’s little difficult to count waves. can you suggest which author\’s book can help to count and indentify waves easily us.
All global market run on Elliot waves?
I\’m not too familiar with the subject myself.
Thank you Sir.
Welcome!
Dear Karthik,
i am new with this stock marker , i was under impression that today\’s closing Price will be tomorrows opening price.
but it is not ,can you please tell me how it works , i mean how to get opening price.
thanks for educating us.
Vishal – closing price is the weighted average of the last 30 mins, check this post for a detailed answer – http://tradingqna.com/2512/how-to-determine-closing-price-in-f%26o?show=2513#a2513
Sir
I am a Zerodha client.
Clicking on the link gives the message: \”Oops! That page doesn\’t exist or is private.\” Why is it so? And where can we then find and read it?
Thank you!
Which link are you referring to?
Clicking on the link (http://tradingqna.com/2512/how-to-determine-closing-price-in-f%26o?show=2513#a2513) gives the message : “Oops! That page doesn’t exist or is private.” Why is it so?
Thanx
We upgraded tradingqna, guess we must have lost this page around that time. Let me check this up.
Still it shows “Oops! That page doesn’t exist or is private.” Could you please help us here ?
Will take a look at this.
Hi Karthik,
if i bought a share through NSE. can i sell that share through BSE.(if there is any arbitrage opportunity).
Thanks&Regards
You cannot do this one a intraday basis, but you can buy in one exchange, take the stock for delivery and sell it in another exchange at a later point.
Why are we not able to trade of the charts if we are using heiken ashi ?trading of the charts is limited to candle sticks.
As of now we have this for candles as 95% traders use only candlesticks…hopefully we will add this in the future.
Hi Team, —
Is trading in Zerodha Equity is FIFO(First In First Out) Basis or what ?? —
For Example – If on Day 01 i bought 50shares@100 and Day02 50@90 and Day03 50@75 and if on Day04 if i sell 100shares@120 will the first 50@100 and second 50@90 will be sold and remainig 50@75 will be on Hold Right ?? —
Will the same happen in Zerodha or any thing different.
Thank you.
Yes, FIFO order is followed.
Sir, my question are as follow, please explain in brief.
Q1: If I buy as CNC in BSE then how can I sell it on the same day(as MIS) without the same getting reflected in my Demat account as it takes T+2 day for the shares to get credited?
Q2: Is it possible to buy as MIS(First day) and at the end of the day if I am in loss so seeing the market can I change it to CNC before the market gets closed so that I can carry the stocks forward and stop the loss. And sell them the next working day(Day 2) if the stock price had shot high.(Please note the stocks has not been credited in my Demat account).
I have opened my account recently and I don\’t have much idea about what strategy to follow.
Thanks
Roshan – if you intend to do intraday then its better to execute in MIS. MIS order get auto squared off by 3:20 and you also get higher leverage. Yes you can convert MIS to CNC by end of day. But do make sure you have enough funds in the account to take delivery.
Sir thank you for your prompt reply, But please brief about the scenario also.
Question no 1 is not answered about the delivery as if I go from mis to cnc at the end of the day, so can i sell the stock the next day without the stocks getting credited in my account.
Roshan – Both CNC and MIS can be used as intraday orders. However MIS gives you more leverage. You can buy it as CNC on BSE but just make sure you square off your position by 3:20 PM. If you do so than you wont have to take delivery of the stock.
And in case if I take the delivery, then can I sell it the other day without the stocks getting credited in my Demat account. Or do i have to wait for T+2 day to get the stock actually credited in my account and then I will be able to sell off them.
You can choose to do a BTST trade and not take delivey in your DEMAT account….however you will have to bear the risk of a Short Delivery – you can read more about BTST here – http://zerodha.com/z-connect/queries/stock-and-fo-queries/btstatst-buyacquire-today-sell-tomorrow and about consequences of short delivery here – http://zerodha.com/z-connect/queries/stock-and-fo-queries/consequences-of-short-delivery-nse-bse
Hi Karthik,
In the above explanation , You mentioned higher leverage what exactly it means? Please explain with example
Check this for understanding leverage – http://zerodha.com/varsity/chapter/leverage-payoff/
When will your new modules get uploaded? I am eagerly waiting for trading psychology and strategies modules.
Soon Arvind, we are working on Options modules for now.
Hi,
Can you please tell me what happens during the pre-opening session i.e. between 9AM to 9.15AM. Can we place orders at that time? Who decides the opening price? Also what are after market orders?
Check this – http://zerodha.com/z-connect/queries/stock-and-fo-queries/pre-marketpost-marketafter-market-orders
Dear Karthik
U have not answered my question straight way abt Hedging in commodity.Again let me know, For example,how crude can be hedged .
You can always initiate a calendar spread where in you buy current month futures contract and sell the next month\’s futures contract…in this way your position is completely hedge. You can develop similar ideas from here – http://zerodha.com/varsity/chapter/hedging-futures/
I trade in mcx crude only. Can hedgging is possible in commodity trading.If possible let me know
Certainly…you can hedge commodities. We will talk more about it in the Commodities module.
Dear Karthik Sir,
It\’s really amazing to get these wonderful insights. I have become your fan by your simple and profound style of making things simpler. I have started learning the basics of Technical Analysis. And I want to learn properly before I delve into real market. I am reading, \”Japanese Candlestick Charting Techniques by Steve Nison\”; Can you please refer some more books for Technical Analysis, which will help me gain expertise.
Thanks,
Gaurav Maskara
Glad to know you are liking the stuff put up on Zerodha Varsity 🙂
Steve Nison\’s book on Candlesticks is really good. I would suggest you to go through the same. I\’m sure Steve Nison\’s book along with Zerodha Varsity will give you all that you need to start trading the markets 🙂
Ones you are comfortable with this you can read the TA classic \”TA of Stock Trends\” by Edwards & Magee.
Its been a privilege to be associated with zerodha. I recently read about taxation regarding trades. Sir, I have one doubt.
1. If I buy a stock in CNC and sell it the same day it will be considered in MIS. What if I sell it the next day? Will it be still considered in MIS or in CNC? The doubt arises becuase I get delivery in demat on 3rd or fourth day. Whether CNC applies only for the same day?
2. I have dealt in CNC product only. But now I want to do some MIS. How different is MIS from CNC? Any special procedures to be followed?
Privilege is in fact ours 🙂
1) Buy in CNC – Sell the same day in CNC it will be considered as an intraday trade. While CNC is for delivery you can do intraday as well, there is no problem with that.
2) Next time you initiate an intraday trade just select MIS instead of CNC. With this you can get higher leverage and therefore you can trade with higher quantities for the capital that you have.
Thank you Sir for your reply.
Suppose I buy a share today in CNC and sell it tomorrow then will it be considered in CNC or in MIS? The confusion arises because even tomorrow i haven\’t got delivery of shares.
When the order goes through as MIS – it strictly means that the order is an intraday order. For overnight spot market positions it has to be a CNC order. So yes, you can buy as CNC today and sell it t\’row if required.
Is it possible without delivery buy today sell tomorrow . I think that option not there
No, you will have to choose CNC to carry out BTST trades.
Good articles all . You are doing a Yeoman job. Good spirit-keep up the Good work-an element of awakening in your articles.
Most welcome, thank you for the kind words 🙂
dear karthik sir…
I am very happy thank\’s to share valueble true technical anylysis study report…oh my god it\’s working my own researched stocks….i\’m only referring weekly chart karthik sir..because i\’m long term investor… Once again thank you very much, if any i didn\’t understand i\’ll send you query please reply me sir….
Good luck Girish. Please post your queries and we would be happy to share our views.
TA is good for Investors and FA is good for Traders. Is this statement right ?
No, in fact it is the other way round. Use TA for active trading and FA for long term investments.
Sir, Excellent chapters on FA and TA, simple and understable for investing and trading. I have a doubt on MACD and signal line cross overs. in some article/books it is stated that bullish signal occurs when MACD LINE CROSSES UPWARDS SIGNAL LINE. Where as it reverse in the above chapter. Thanks/Regards
Signal line is a 9 day average line whereas the MACD takes the difference between 12 & 26 day average. Hence the signal line is more reactive to the daily price moves and therefore generates the trigger to either buy or sell.
Hi,
My question is regarding close price. how exactly is close price determined. I have been observing the closing price of few stocks. few days it will be less than the last traded price of the day, few instances it was higher and few instances it was same as that of last traded price for the day. I googled on this and found that the closing price will be the average price for the last half an hour in the trading session.
is it true?
Thanks,
Janardhan Reddy
Yes indeed. You can find a detailed explaintion to this here.
Hi Karthik Wanted to Know the limitations or exclusions of Technical analysis in brief as an example wanted to ask are the bad news imbibed or taken care by the TA like recently the Supreme court Ruling on Coal Block and JSPL falling heavily or the Ruling on DLF and the share falling Hugely in the nest trading sessions are this taken care BY TA
By and large most of the news such as – new product launch, new geographic expansion, M&A, management change, quarterly numbers etc is taken care by TA. The reason why I say this is such news (which is predetermined) somehow gets leaked and people (insiders) start taking positions and therefore the price and volume reacts.
However things like court ruling may not be captured as its highly speculative in nature and till the last minute no one would know what would happen.
Hi Karthik, My question is related to the assumption – Market discounts every news. Reading in one of your replies, I understand that the term \”every news\” means mostly the news related to the company as you mentioned. So do you agree that we should add another checklist item in the FINALE for news like election results, RBI or US Fed rate cut policy etc. I think such news can really have a great impact on the trend of a stock and might not go as we have calculated based on other checklist items. OR the other option would be to avoid trading on such a day or few following few days. Any other thought on how we should trade on such news driven days.
You are right Manish, most of the news that is factored in is related to company news. Macros are not easy to factor in. It is best to avoid taking directional bets on such days..maybe you can explore delta neutral strategies.
Dear sir,
For analysing the movement of market , basically we need to know about the trend.
I always do have confusions in knowing whether market is moving in uptrend or downtrend.
For example, say Nifty previous closing is 8300, next day it had a gap up opening at 8374. Then it closed at 8310.
So, if v compare it with previous closing, it is uptrend (8300-8310). if v compare it from open of the day to closing, it is down trend (8374-8310). So what is ur answer sir?. Pls explain.
You need to see this movement in conjunction to the prior trend, that is when you will be in a position to form an opinion. Suggest you to go through the lesson on multiple candlestick patterns to get more clarity.
Thanks for the information sir. Will do as directed.
I have an account with Zerodha and have started trading Nifty options. But I do not have any technical analysis tool. Currently I am using technical analysis on finance.yahoo.com, the problem with this is it is about 5 minutes behind market. I mean it does not show current price of Nifty but shows value which is 5 minutes before. Sometime back there was a pop-up in Zerodha about technical analysis software available for Zerodha members. I think around Deepavali there was a pop up mentioning that there is a discount for Zerodha traders if they want to use technical analysis software. I need information on which softwares to use for technical analysis which are display accurate values and up-to-date with market. If it is affordable, I am ready to pay for the services.
Probably this chapter will help you get started – http://zerodha.com/varsity/chapter/finale-helping-get-started/
Hi Karthik, is zerodha pi avbl for iPhones. My Client id is ZT8862
Not as of now, Narayanan.
Thanks very nice
you can see the charts on zerodha – kite when you click on chart button provided beside the security on main page .
alternately, you can see on bseindia.com or subscribe to charts from :::
icharts.in
tradingview, etc