
If you look at a stock chart displayed on a trader’s trading terminal, you are most likely to see lines running all over the chart. These lines are called the ‘Technical Indicators’. A technical indicator helps a trader analyze the price movement of a security.
Indicators are independent trading systems introduced to the world by successful traders. Indicators are built on preset logic using which traders can supplement their technical study (candlesticks, volumes, S&R) to arrive at a trading decision. Indicators help in buying, selling, confirming trends, and sometimes predicting trends.
Indicators are of two types, namely leading and lagging. A leading indicator leads the price, meaning it usually signals the occurrence of a reversal or a new trend in advance. While this sounds interesting, you should note, not all leading indicators are accurate. Leading indicators are notorious for giving false signals. Therefore, the trader should be highly alert while using leading indicators. In fact, the efficiency of using leading indicators increases with trading experience.
A majority of leading indicators are called oscillators as they oscillate within a bounded range. Typically an oscillator oscillates between two extreme values – for example, 0 to 100. Based on the oscillator’s reading (for example 55, 70 etc.) the trading interpretation varies.
On the other hand, a lagging indicator lags the price; meaning it usually signals the occurrence of a reversal or a new trend after it has occurred. You may think, what would be the use of getting a signal after the event has occurred? Well, it is better late than never. One of the most popular lagging indicators is the moving averages.
You might be wondering if the moving average is an indicator in itself, why we discussed it even before we discussed the indicators formally. The reason is that moving averages is a core concept on its own. It finds its application within several indicators such as RSI, MACD, Stochastic etc. Hence, for this reason, we discussed moving average as a standalone topic.
Before we further understand individual indicators, I think it is a good idea to understand what momentum means. Momentum is the rate at which the price changes. For example, if the stock price is Rs.100 today and it moves to Rs.105 the next day, and Rs.115, the day after, we say the momentum is high as the stock price has changed by 15% in just 3 days. However, if the same 15% change happened over to let us say 3 months, we can conclude the momentum is low. So the more rapidly the price changes, the higher the momentum.
14.1 – Relative Strength Index
Relative strength Index or just RSI, is a prevalent indicator developed by J.Welles Wilder. RSI is a leading momentum indicator which helps in identifying a trend reversal. RSI indicator oscillates between 0 and 100 and based on the latest indicator reading, the expectations on the markets are set.
The term “Relative Strength Index” can be a bit misleading as it does not compare the relative strength of two securities, but instead shows the internal strength of the security. RSI is the most popular leading indicator, which gives out the strongest signals during the periods of sideways and non-trending ranges.
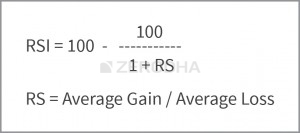
The formula to calculate the RSI is as follows:
Let us understand this indicator with the help of the following example:
Assume the stock is trading at 99 on day 0, with this in perspective; consider the following data points:
| Sl No | Closing Price | Points Gain | Points Lost |
|---|---|---|---|
| 01 | 100 | 1 | 0 |
| 02 | 102 | 2 | 0 |
| 03 | 105 | 3 | 0 |
| 04 | 107 | 2 | 0 |
| 05 | 103 | 0 | 4 |
| 06 | 100 | 0 | 3 |
| 07 | 99 | 0 | 1 |
| 08 | 97 | 0 | 2 |
| 09 | 100 | 3 | 0 |
| 10 | 105 | 5 | 0 |
| 11 | 107 | 2 | 0 |
| 12 | 110 | 3 | 0 |
| 13 | 114 | 4 | 0 |
| 14 | 118 | 4 | 0 |
| Total | 29 | 10 | |
In the above table, points gained/lost denote the number of points gained/lost concerning the previous day close. For example, if today’s close is 104 and yesterday’s close was 100, points gained would be 4 and points lost would be 0. Similarly, if today’s close was 104 and the previous day’s close was 107, the points gained would be 0 and points lost would be 3. Please note that the loses are computed as positive values.
We have used 14 data points for the calculation, the default period setting in the charting software. This is also called the ‘look-back period’. If you are analyzing hourly charts, the default period is 14 hours, and if you are analyzing daily charts, the default period is 14 days.
The first step is to calculate ‘RS’ also called the RSI factor. As you can see in the formula, RS is the ratio of average points gained by the average points lost.
Average Points Gained = 29/14
= 2.07
Average Points Lost = 10/14
= 0.714
RS = 2.07/0.714
= 2.8991
Plugging in the value of RS in RSI formula,
= 100 – [100/ (1+2.8991)]
= 100 – [100/3.8991]
= 100 – 25.6469
RSI = 74.3531
As you can see, the RSI calculation is fairly simple. The objective of using RSI is to help the trader identify oversold and overbought price areas. Overbought implies that the stock’s positive momentum is so high that it may not be sustainable for long, and hence there could be a correction. Likewise, an oversold position indicates that the negative momentum is high, leading to a possible reversal.
Take a look at the chart of Cipla Ltd; you will find a lot of interesting developments:
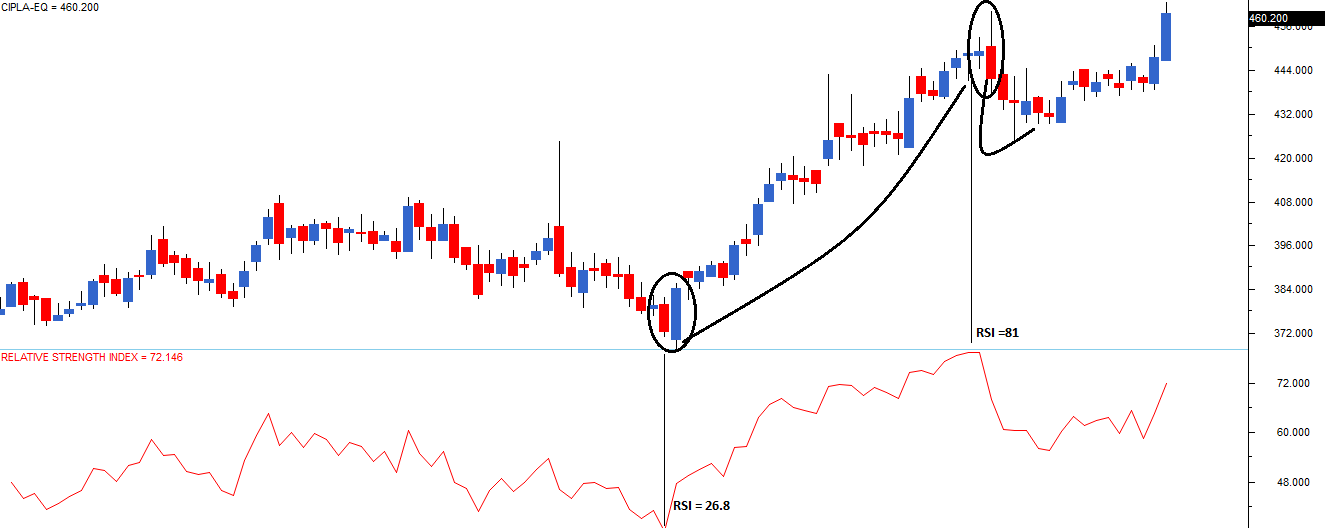
To begin with, the red line below the price chart indicates the 14 periods RSI. If you notice the RSI’s scale, you will realize it’s upper bound to 100, and lower bound to 0. However, 100 and 0 are not visible in the chart.
When the RSI reading is between 30 and 0, the security is supposed to be oversold and ready for an upward correction. When the security reading is between 70 and 100, the security is supposed to be heavily bought and is ready for a downward correction.
The first vertical line marked from left shows a level where RSI is below 30; in fact, RSI is 26.8. Hence RSI suggests that the stock is oversold. In this particular example, the RSI value of 26.8, also coincides with a bullish engulfing pattern. This gives the trader a double confirmation to go long! Needless to say, both volumes and S&R should also conform to this.
The second vertical line points to a level where the RSI turns 81, a value which is considered overbought. Hence, if not for looking at shorting opportunities, the trader should be careful in his decision to buy the stock. Again, if you notice the candles, they form a bearish engulfing pattern. A bearish engulfing pattern, backed by an RSI of 81 is a sign to short the stock. What follows this is a quick and a short correction in the stock.
The example that I have shown here is quite nice, meaning both the candlestick pattern and RSI perfectly align to confirm the same event’s occurrence. This may not always be true. This leads us to another interesting way to interpret RSI. Imagine the following two scenarios:
Scenario 1) A stock which is in a continuous uptrend (remember the uptrend can last from few days to few years) the RSI will remain stuck in the overbought region for a long time, and this is because the RSI is upper bound to 100. It cannot go beyond 100. Invariably the trader would be looking at shorting opportunities, but the stock, on the other hand, will be in a different orbit. Example – Eicher Motors Limited, the stock has generated a return of close to 100% year on year.
Scenario 2) A stock that is in a continuous downtrend, the RSI will be stuck in the oversold region since it is lower bound to 0. It cannot go beyond 0. In this case, the trader will be looking at buying opportunities, but the stock will be going down lower. Example – Suzlon Energy, the stock has generated a return of negative 34% year on year.
This leads us to interpret RSI in many different ways besides the classical interpretation (which we discussed earlier)
- If the RSI is fixed in an overbought region for a prolonged period, look for buying opportunities instead of shorting. The RSI stays in the overbought region for a prolonged period because of an excess positive momentum.
- If the RSI is fixed in an oversold region for a prolonged period, look for selling opportunities rather than buying. RSI stays in the oversold region for a prolonged period because of an excess negative momentum
- If the RSI value starts moving away from the oversold value after a prolonged period, look for buying opportunities. For example, the RSI moves above 30 after a long time may mean that the stock may have bottomed out, hence a case of going long.
- If the RSI value starts moving away from the overbought value after a prolonged period, look for selling opportunities. For example, RSI moving below 70 after a long time. This means the stock may have topped out, hence a case for shorting.
14.2 – One last note
None of the parameters used while analyzing RSI should be treated with rigidity. For example, J.Welles Wilder opted to use a lookback period of 14 days simply because that was the value which gave the best results considering the market conditions in 1978 (which is when RSI was introduced to the world). You may choose to use 5,10,20, or even 100 days look back period if you wish too. In fact, this is how you develop your edge as a trader. You need to analyze what works for you and adopt the same. Please note, the fewer the days you use to calculate the RSI, the more volatile the indicator would be.
Also, J.Welles Wilder decided to use 0-30 to indicate oversold regions and 70-100 level to indicate the overbought region. Again this is not set in stone; you can arrive at your own combination.
I personally prefer to use 0-20 level and 80-100 to identify oversold and overbought regions respectively. I use this along with the classical 14 days look back period.
Of course, I urge you to explore the parameters that work for you. In fact, this is how you would eventually develop as a successful trader.
Finally, do remember RSI is not used often as a standalone indicator by traders; it is used along with other candlestick patterns and indicators to study the market.
Key takeaways from this chapter
- Indicators are independent trading systems developed and introduced by successful traders.
- Indicators are leading or lagging. Leading indicators signal the possible occurrence of an event. Lagging indicators, on the other hand, confirms an ongoing trend.
- RSI is a momentum oscillator which oscillates between 0 and 100 level
- A value between 0 and 30 is considered oversold. Hence the trader should look at buying opportunities.
- A value between 70 and 100 is considered overbought. Hence the trader should look at selling opportunities.
- If the RSI value is fixed in a region for a prolonged period, it indicates excess momentum. Hence, instead of taking a reversed position, the trader can consider initiating a trade in the same direction.
Hi Karthik-Two Questions,
a. Do you prefer 80-100 & 0-20 because it gives you less trading signals than 70-100 & 0-30? As this is the only difference I was able to figure it out when I changed the values.
b. Also, Do you instantly trade when your value crosses the upper & lower limit from point a or you wait for a few days for the value to remain in oversold/overbought area? You said \”If the RSI is fixed in an oversold region for a prolonged period\”, The only way to determine Prolonged period is to wait for a few days, correct(for EOD Chart)? What\’s your thought process when you trade with RSI?
Thanks
a. Yes, the idea is lesser trading frequency (also helps in keeping costs low) and better quality of signal.
b. Idea is to take the trade when signals hit. Of course, I\’m assuming you are tracking other things as well for the trade and not just RSI.
For Point a- How does it help to keep the cost low?
If we get lesser signals to trade, then lesser the brokerage and other trading associated costs.
You trade less, you pay less brokerage. This way you keep the costs lower 🙂
Are you using simple averages to get the average gains and losses, or are you using wilder averages i.e., (13Gt-1 + Gt)/14)? Your example shows simple averages.
Simple moving averages.
What is the prolonged period in the following paragraph?
This leads us to interpret RSI in many different ways besides the classical interpretation (which we discussed earlier)
If the RSI is fixed in an overbought region for a prolonged period, look for buying opportunities instead of shorting. The RSI stays in the overbought region for a prolonged period because of an excess positive momentum.
Prolonged period could be a few weeks of trading in the same price zone.
Sir, what to do if Rsi is between 31 to 69 as i see in many chart rsi is 55,62 ,39 ?
In between the price bands, RSI has not much use.
Hi,
How do I fix my indicators in all new charts?
Like my indicators should come in all new charts when I open it.
Thanking you.
Hi,
I found the option in chart.
Thank you
Hmm, maybe you can talk to the support desk for this. They will help you.
RSI indicates momentum so how does it give strongest signals during the sideways moving market and non trending market as mentioned in the module heading – RSI – 2nd paragraph- page 108. Is it a misprint?
It does not, RSI should only be used for momentum.
hello kartik sir aditya here, sir i wanted to ask you that ,in the RSI segment you said that, when RSI stays in the lower range for a prolonged period of time it is better to sort for selling oppurtunities and if it is in the higher range for a prolonged period of time we have to look for buying oppurtnities , so sir what is the timespan of this prolonged period does this comes with experience or is there any specified time
Maybe 2-3 trading weeks?
sir so anything below thi time frame if we see a higher (70-100) RSI value or a lower (0-30) RSI value we can directly buy or look for shorting respectively right ,this if i consider trading only based on RSI values
Yeah, thats when RSI is considered relevant for trading.
Hello Karthik sir,
First off, great course and explanations. Thank You
I wanted to check the following:
1. There are a lot of types of moving averages – cross, deviation, envelope, etc – which one to select? I am guessing it is cross
2. MA1,MA2, etc is mentioned – what is the unit of measurement here? Days, hours, how do I set it? Nothing is indicated in the function tab
3. Is there a way I can set the target or I need to keep monitoring when the slow MA takes over fast MA and exit the trade?
When the RSI value is running between 40-60 for like 7-8 days. What can we determine from there? Whether its gonna fall or it can go sideways?
It just means there is a lot of trading with with very little trend to it. But yes, this view is only when you look at RSI in isolation. You need to look at RSI + candle pattern.
That no one can say, right?
If the RSI is fixed in an overbought region for a prolonged period, look for buying opportunities instead of shorting. The RSI stays in the overbought region for a prolonged period because of an excess positive momentum.
If the RSI is fixed in an oversold region for a prolonged period, look for selling opportunities rather than buying. RSI stays in the oversold region for a prolonged period because of an excess negative momentum.
Sir can u give a example to each of the above scenario so I could understand better.
It just means, if RSI is stuck in one zone, then look at it as a signal to continue instead of a reversal. I\’ll also try and look for examples.
Please give an example Sir for the RSI for the above scenario
Have shared a few examples, Soma. Please check the chapter.
Thanks for getting back! But if Relative Strength (RS) = Average Gain / Average Loss = 0 / 477.15 = 0, which can happen if there are no Gains and only Losses, then RSI is coming to be 0. Maybe there is some Mistake in the Math, but I did check.. Thanks…
Sure, good luck!
Hi, Calculating the 2-month Relative Strength Index (RSI) for the NIFTY 50 as of February 22, 2025, involves analyzing the index\’s performance over the preceding two months:
Based on available data, the monthly closing values for the NIFTY 50 are:
December 2024: 23,750.20
January 2025: 23,508.40
February 21, 2025: 22,795.90
Monthly Price Changes:
January 2025 Change: 23,508.40 (January close) – 23,750.20 (December close) = -241.80
February 2025 Change: 22,795.90 (February 21 close) – 23,508.40 (January close) = -712.50
Total Losses: 241.80 (January) + 712.50 (February) = 954.30
Average Loss: 954.30 / 2 = 477.15
Average Gain: Since there were no gains, the average gain is 0.
Relative Strength (RS) = Average Gain / Average Loss = 0 / 477.15 = 0 and
RSI = 100 – [100 / (1 + RS)] = 100 – [100 / (1 + 0)] = 100 – 100 = 0
My Question is:
RSI of 0 not making any sense!
In Kite Software one can see 2 Month RSI updating, depending on the price action in the market as the Monthly candle for February is not closed yet. Kite (TradingView) shows 3.45 as 2 month RSI on 21Feb 2025.
Please help me understand this!
RSI cannot be 0, I think there is some error in your math. Also, you can directly use the RSI values reported on Kite or whatever other charting platform right?
I apologise, there is an offer to go on other way.
Thanks again for a wonderful chapter! You mentioned \”If the RSI is fixed in an overbought region for a prolonged period, look for buying opportunities instead of shorting.\” What can be considered a rational \”prolonged\” period? Does it depend on the lookback period parameter?
Yeah, there is no standard definition for what can be considered as \’prolonged\’, I\’d suggest you consider this from a case to case basis.
Hi karthik
i saw the charts on zerodha kite , how the rsi keeps updated even after 3:30 pm(ie: after the market is closed). I am a bit confused here.
Was it for currency or commodities?
Difference between momemtum and volatility??? both means change in prices . When prices change quickly and at high rate volatility is high , also momemtum.Both means SPEED.???? Pl. clarify.
Momentum = Consistency in change in prices.
Volatility = The rate at which prices vary from the average price.
can you tell me what trading session means ?does it means particular trading day?
Yes, trading session refers to a particular trading session.
How can i change colour of rsi indicator in kite
Check preferences, you should be able to do that.
what is RscD technical indicator?
No idea 🙂
WHY EXCEL CALCULATION IS NOT ACCURATE AS SAME CHART CALCULATION(RSI VALUE)
Which calculation you are talking about?
How to apply UT BOT ALERT INDICATOR IN ZERODHA
Hello sir,
Can we say that when the stock hits its lowest level in RSI, it can be said to be an oversold region, and when it hits its highest point, it can be said to be an overbought region? This is how we can determine it.
Thank you.
Yup, thats the idea with overbought and oversold levels.
In CHART IQ, facility of merging One indicator over other is available like in Trading View charts?
Not sure if this was there in the latest update. Request you to please call the support desk for this.
In CHART IQ charts, is there any COMPARE Option avilable .For. e.g. comparing stock price with related Index like NIFTY50 etc….
Ah, I think you can view multiple charts in one go. Please do call the support desk and they will guide you on this.
Hi Karthik,
What are your views on Money flow index?
MFI = Volume Adjusted RSI.
due to the above, can MFI be considered as a more reliable indicator than RSI?
or is MFI & RSI to be applied in different scenarios?
Best,
Achuthan.
Never really used it actively, so cant comment on it 🙂
Hi Sir,
I was trying to calculate the RSI value for TATACOMM in an Excel sheet.
From the period 24/11/2023 to 15/12/2023
ID SYMBOL OPEN HIGH LOW CLOSE LAST TIMESTAMP Gain Loss Avg Gain Avg Loss RS RSI
450883 TATACOMM 1763 1820 1753.05 1813.35 1818 15/12/2023
448259 TATACOMM 1730 1757.55 1721.1 1749.65 1750 14/12/2023 0 63.7
445627 TATACOMM 1752 1752 1715.75 1719.8 1721.55 13/12/2023 0 29.85
443031 TATACOMM 1709.9 1744.95 1701.05 1738.3 1740 12/12/2023 18.5 0
440418 TATACOMM 1695 1710.4 1695 1707.05 1705 11/12/2023 0 31.25
437755 TATACOMM 1715 1720 1677 1694.85 1692.65 08/12/2023 0 12.2
435145 TATACOMM 1674.65 1715.55 1665.2 1706.65 1708 07/12/2023 11.8 0
432542 TATACOMM 1682.75 1684.9 1659.1 1668.95 1668 06/12/2023 0 37.7
429932 TATACOMM 1678.8 1681.65 1652.3 1678.75 1678 05/12/2023 9.8 0
427297 TATACOMM 1700 1700 1656.9 1662.85 1665 04/12/2023 0 15.9
424637 TATACOMM 1733.9 1733.95 1649.05 1659.85 1654.9 01/12/2023 0 3
422012 TATACOMM 1725 1736.7 1685.95 1705.55 1696.65 30/11/2023 45.7 0
419406 TATACOMM 1692 1719.6 1683.1 1713.2 1716 29/11/2023 7.65 0
416792 TATACOMM 1728 1728 1680.3 1683.5 1684.7 28/11/2023 0 29.7
414174 TATACOMM 1722.95 1769.3 1715.1 1723.75 1723 24/11/2023 40.25 0 9.55 15.95 0.598746082 37.45098039
I got the final RSI value
RSI -> 37.45098039
But at the same time the chart show different value -> 65.96
Could you please advise why the difference in RSI value I calculated and on the chart?
But why are you calculating? These values are easily available on any charting engine right?
Hi,
I would like to know how relative volatility index is calculated in Zerodha kite. I am doing some analysis based on this indicator.
—
Regards,
Mohit
These are calculated by the charting engines – Tradingview or ChartIQ. Maybe its best if you dig up their support document, they usually upload their formulas in that document.
Sir, what is the difference between rsi and Tsi? Which is best to use ? And what are the best settings to take trade confidently.
TSI? Not sure about that, need to research myself.
Two statements mentioned in this section:
RSI is a leading momentum indicator which helps in identifying a trend reversal.
RSI is the most popular leading indicator, which gives out the strongest signals during the periods of sideways and non-trending ranges.
Ques: If RSI helps identify trend \’reversal\’, then it means there is a trend. But we are also suggesting that RSI helps more in non-trending ranges. What is it that I am missing in my understanding.
Yeah, it helps in both trend reversal and in identifying opportunities in sideway markets.
I had posted my earlier reply after seeing your video. Just to make sure that I have done the correct things,I took the data from NSE Historical data for ABB for the required period. There were some slight differences in the closing price compared to what appears in Bhav. But the results are same as I had computed. Hence the discrepancy seems to exist.
The reason why results can vary despite the correct formula is data only. So please double check.
Thanks Karthik for your response. 01. I have taken the data from NSE Bhav copy. 02. The column I considered is \”CLOSE\”. 03. There are no corporate actions in ABB which I took as an example. 04. As regards the formula and brackets, I have given the computation of each and every step in my earlier post. I have also double checked the same. Your assistance on where I have gone wrong would be very useful.
Hmm, if these things are correct, and assuming you\’ve implemented the formula correctly, then its hard to figure out where you\’ve gone wrong. Especially since the formulas match in both Varsity and ChartIQ.
I verified the documentation. Here are the details.
I use ChartIQ8.
My formula and steps for computation of RSI is as follows:
—————————————–
Total Period Bhav taken – 14 days
DOWNAverage is computed as Sum of (DOWNChange / 14)
UPAverage is computed as Sum of (UPChange / 14)
Formula Used 100 – (100 / (1 + (UPAverage / DOWNAverage)))
——————————————–
The above matches with the calculation given in
https://documentation.chartiq.com/tutorial-Using%20and%20Customizing%20Studies%20-%20Definitions.html#rsi
If it is possible to guide me it would be great. Thanks for your patience and understanding.
Alright, if both formulas match, then it likely you\’ve made one of the following errors –
1) Ensure you have taken clean data, here is what I mean by clean data – https://www.youtube.com/watch?v=MX-6rdHDPbE&list=PLX2SHiKfualEyD05J9JsklEq1JFGbG6qJ&index=10
2) Ensure you are dealing with closing prices only
3) Check the placement of brackets/parentheses once.
4) Double-check the formula for average once.
Hopefully one of this will fix the issue.
Thank you. Will do and revert.
Sure.
This is not a reply but an update to my earlier query on RSI computation with more detailed working. Hope this helps.
SYMBOL SERIES OPEN HIGH LOW CLOSE LAST PREVCLOSE TIMESTAMP CHANGE
ABB EQ 2921.6 2923.1 2883.95 2899.95 2908.25 2914.15 13-01-2023 00:00 -14.2
ABB EQ 2908 2935 2881.9 2914.15 2915 2900.2 12-01-2023 00:00 13.95
ABB EQ 2848 2909 2825 2900.2 2903 2841.65 11-01-2023 00:00 58.55
ABB EQ 2860 2865 2801.55 2841.65 2847.3 2862.1 10-01-2023 00:00 -20.45
ABB EQ 2861.05 2882.35 2830.65 2862.1 2856.85 2843.6 09-01-2023 00:00 18.5
ABB EQ 2821 2858 2810.3 2843.6 2848 2806 06-01-2023 00:00 37.6
ABB EQ 2725.55 2814.1 2720.15 2806 2811 2705.2 05-01-2023 00:00 100.8
ABB EQ 2690 2736 2690 2705.2 2704 2689.4 04-01-2023 00:00 15.8
ABB EQ 2693.35 2694.1 2676 2689.4 2688 2679.95 03-01-2023 00:00 9.45
ABB EQ 2685 2713 2662.5 2679.95 2680.95 2683 02-01-2023 00:00 -3.05
ABB EQ 2694.5 2727.95 2676.8 2683 2677 2684.2 30-12-2022 00:00 -1.2
ABB EQ 2725 2737 2678.95 2684.2 2684 2724.35 29-12-2022 00:00 -40.15
ABB EQ 2735.05 2762.75 2708 2724.35 2715 2742.65 28-12-2022 00:00 -18.3
ABB EQ 2750.15 2757.55 2708.6 2742.65 2740 2724.65 27-12-2022 00:00 18
Sum of UP values 272.65
Sum of DOWN Values 97.35
Average of UP Values 19.475
Average of DOWN Values 6.953571429
RS 2.800719055
Adding 1 3.800719055
100 divided by 26.31081081
RSI 73.68918919
Sure, but as I mentioned, please check the chart engine\’s documentation once for clarity.
Good Evening, My question is a little bit different. I was doing the computation of RSI as per the formula suggested above. For example the RSI for ABB as per the formula and method above comes to 73.68 whereas in the Zerodha chart it shows 55.33 on 13-01-23 closing. The chart was for a period of 1 month duration with the time in 1 day. Would it be possible to check this out and clarify why there is a difference.
I am giving below the values for ABB from NSE Bhav file.
SYMBOL SERIES OPEN HIGH LOW CLOSE LAST PREVCLOSE TIMESTAMP CHANGE CHANGE_PERC
ABB EQ 2921.6 2923.1 2883.95 2899.95 2908.25 2914.15 13-01-2023 00:00 -14.2 -0.49
ABB EQ 2908 2935 2881.9 2914.15 2915 2900.2 12-01-2023 00:00 13.95 0.48
ABB EQ 2848 2909 2825 2900.2 2903 2841.65 11-01-2023 00:00 58.55 2.06
ABB EQ 2860 2865 2801.55 2841.65 2847.3 2862.1 10-01-2023 00:00 -20.45 -0.71
ABB EQ 2861.05 2882.35 2830.65 2862.1 2856.85 2843.6 09-01-2023 00:00 18.5 0.65
ABB EQ 2821 2858 2810.3 2843.6 2848 2806 06-01-2023 00:00 37.6 1.34
ABB EQ 2725.55 2814.1 2720.15 2806 2811 2705.2 05-01-2023 00:00 100.8 3.73
ABB EQ 2690 2736 2690 2705.2 2704 2689.4 04-01-2023 00:00 15.8 0.59
ABB EQ 2693.35 2694.1 2676 2689.4 2688 2679.95 03-01-2023 00:00 9.45 0.35
ABB EQ 2685 2713 2662.5 2679.95 2680.95 2683 02-01-2023 00:00 -3.05 -0.11
ABB EQ 2694.5 2727.95 2676.8 2683 2677 2684.2 30-12-2022 00:00 -1.2 -0.04
ABB EQ 2725 2737 2678.95 2684.2 2684 2724.35 29-12-2022 00:00 -40.15 -1.47
ABB EQ 2735.05 2762.75 2708 2724.35 2715 2742.65 28-12-2022 00:00 -18.3 -0.67
ABB EQ 2750.15 2757.55 2708.6 2742.65 2740 2724.65 27-12-2022 00:00 18 0.66
Thank you in advance.
Not such which charting engine you use. Lets say, ChartIQ then please check their documentation for how ChartIQ compute RSI, that will give you a clear picture and why the difference.
Sir, Could you plz suggest me that, When i am using EMA in Day frame ( 9, 21. or 25 , 50 and 50 & 100 ) what should my MACD Figures.
Existing MACD 9,26.
1. Should we see both indicters to take trade
2. Or should we stick to one MACD or EMA ( 9, 21. or 25 , 50 and 50 & 100 )
3. To get more confirmation EMA varies with existing MACD
Kindly advise.
Rohit, there is no one answer to this. You can experiment with different values and see what works for you.
I’d suggest you practice TA first, then slowly graduate to F&O after reading through the module. But don’t rush through, opportunities always exist. Sir you said in previous comment
but how should i practice TA means can you tell me procedure ,way of doing that should i take paper trade or just only read charts, because only read chart will not make improvisation if i dnt take trade,
and if i have to do paper trade then what segment to do that trade except F&O and how?
Read charts, identify opportunities, define your trade, and then observe how the market behaves. YOu can track both spot and futures for better understanding.
Also one more query- Can we apply all concept of TA module in futures and option also.?
Yes.
thanks sir got it, i want to ask one thing sir I have complete only TA module, but i didnot start option and futures module, but i want to do virtual trade based on TA because it will be in mind if i practice with theory and i will not forget theory then, so which category type of trade i can do? means I dont know F&O then how to do trade by applying TA, should i do buy/sell an individual stock in some quantity or something else, please tell me the perfect daily routine for practice everyday if i did not get enter into F&O yet. and i want to apply TA on chart, i have to analyze charts as max i can , but if i want to trade virtual by analysing charts so what to buy/sell in which segment if i dont know F&O,
Or else should i read F&O module first then only do trade for practice.
I\’d suggest you practice TA first, then slowly graduate to F&O after reading through the module. But don\’t rush through, opportunities always exist.
it will be pleasure and grateful sir if you will clear my queries pointwise so that i could understand. again again soryy for so long queries may be i asked again and again, i understand it will be some painful for you ,but thankyou so much i am getting too much learning from you , content is virtual but i made you my mentor , your contents and query response made my day everyday exciting by gaining all these knowledge. every words are less to appreciate you and your team, thanks a lot, by heart i want to become successfull/professional trader and i feel with your contents that i will be successfull trader one day sir , below are the queries
1- ok so in F&O ,hold till expiry is called as swing trade and when i exit same day then it will be intraday and also i can exit before expiry any time right may be same first day or within 1-2-3….day is that right?
2- leverage /margin will be provide only when exit position on same day means in intraday?
3- but in futures trading broker gives leverage when hold till expiry is it? what is it? is it same for option?
4- If we do future and option trading and hold them till expiry or hold some days before expiry then it will be swing trade ,called it swing and when we do F&O trade and exit on same day /first day then this will be intraday in F&O right?
5- can we do intraday and swing both in cash means without leverage?
6- can we do both intraday and swing trade in individual stock? except F&O
7- if we can do intraday and swing in indidual single stock except F&O ,then can we do that in both cash as well as leverage/margin?
Thanks for the kind words, Neeraj. Dont worry about the length of the post. As long as you clearly post your query, I can post a response, happily 🙂
1) That\’s correct. Swing trade is also called as a positional trade
2) Leverage/Margin rules have changed over the recent past. Its maximum of 5 times leverage regardless of intrday or swing/positional
3) There is leverage for Futures long, futures short, options short position. YOu need to read more on this to figure out
4) Yes
5) Yes
6) Yes
7) Leverage is only for cash intrday and Futures, and option selling. No leverage for overnight/swing EQ position and options buying.
1- yes sir my doubt was this i.e. both- individual stock and derivatives can be traded either on intraday as well as swing basis,now understood and if we do swing in F&O then we can hold it till expiry right?
2- And another query is – Can we do both intraday and swing trading in cash as well as in leverage segment.??
1) Yes, you can hold maximum to expiry.
2) There is no leverage in the cash segment for overnight positions.
hi sir,sorry for long query please try to understand my query, i know the basic meaning of intraday that(transaction happens in day start and end with day end ),swing(for more than a day like days,weeks, months etc) and F&O. but confusion is in category, like in swing trading, F&O is comes under swing trade or not or it will come under intraday, query is what trade comes under swing and intraday category. IF i trade in futures then it will be swing trade or intraday and same for options also will option trade comes in intraday or swing.
If i take swing and somehow exit at same day then what will happen, and if i have taken intraday and want to change for delivery then how to convert, and it will charge for that while convert trade and how much.
Can i do intraday in all cash or it will be in leverage only. In Intraday actually what types of trade i can take and swing what type of trade can i take , i hope you will understand what i want to say, actually i know the basic of types of trade but there are different types in their category, like F&O, like in cash , in leverage, how to recognize the trades are of what types and how to consider to take.I mean what to do in intraday and swing. Please could you explain me pointwise
Think about a car – You can drive it fast or drive it slow. Now, in the same way think about a stock. You can either do an intraday trade or a swing trade with it. Same with derivatives.
Intrday trade = Any trade which is initiated and closed within the day. Example – I can buy 100 shares of Infosys at 9:30 AM and sell 100 shares at 9:32 AM. So I held the shares for 2 minutes, hence its an intrday trade.
Swing trade = Any trade that is held overnight at least for 1 night. Example – I buy 100 shares of Infosys on Monday and sell the same on Friday.
Both stock and derivatives can be traded on either intrday or swing basis.
For converting and intrday trade to swing trade (or overnight trade), check this – https://support.zerodha.com/category/trading-and-markets/margin-leverage-and-product-and-order-types/articles/how-to-convert-mis-to-cnc-nrml-and-vice-versa
Does Zerodha allow users to be able to plot 20 bar EMA of a 60 min chart on a 5 min chart?
Yeah, why not?
in above comment i mean to say what is the importance of calculating yearly returns while doing intraday, is there any relation? or is calculation of returns is useful in trading? please explain
in above comment i mean to say what is the importance of calculating yearly returns while doing intraday, is there any relation? or is calculation of returns is useful in trading?
Sorry, can you please share more context?
is that CAGR which you are talking about that yearly returns for any stock,
Yes, CAGR is what you can consider.
Also is there make any value to watch yearly basis returns while doing trading , does this calculation need for trading neccesary,means is there any use of returns calculation for trading for intraday or swing.
Sorry, dint fully get that query. Can you elaborate?
And how to calculate year to year profit and loss percentage calculated, and year to year calculation is from 1 january or from another month
Year on year is 1st Jan to 31st Dec or you can simply take the CAGR for year on year growth.
now understood sir thanks .
hi sir,in above comments you mention that to earn 2-3% in week and 10 %in month and 120% in year is not possible ,i understand, but i notice many times that some stocks or there are many which move 3-4% in a day also from nifty 50 stocks also that they moves 3-4% in a day so cant we earn that 3-4% sometimes or may be 2-3% that is, just asking to clear my doubts . please suggest
Neeraj, so instead of daily returns, why don\’t you see how the returns have been on year on year basis. That will give you a better perspective.
Learned a lot from the valuable information with its simplicity of writeup.
Thanks.
Happy learning 🙂
Hi,
A basic question: Is RSI same as Relative Price strength?
I think there is a slight difference. I\’ve not used RPS.
I trade always against market trend for which i always loose my capital.What is the best way to analyse the market trend for Nifty intraday.
You can trade any market indicator for this. Something like a simple moving average also helps in identifying trends.
Some queries
1)In the case of look back period does the momentum of latest 14 days is considered just as we discussed in moving averages??
2)Can the look back period also be considered in minutes in case of 5/15/30 mins time frames?
3)Is the 0-100 oscillator fixed for RSI?
4)If we minimize the look back period and increase the rage for overbought and oversold regions for intraday trading then will it be beneficial?
As momentum will be captured by considered minimum data points which will lead to indicating higher momentum or lower momentum even if there is a small change in stock price+ combining it with increase in overbought or oversold regions range will favor in case of Intraday.
Guide for the same.
Thanks in advance!!
1) Yes, the calculation method does not change
2) Yes
3) Yes
4) No, I\’m not sure about this. Needs backtesting
i am sorry ,i have typed zerotha ,my mistake have typed zeotha,i have tried change my command i am unable to change so i am sorry to tell this.if you hurt i am sorry
Hey, that\’s absolutely ok. Don\’t worry about it 🙂
Please add fractal indicator in the function in the graph.
I\’ve not used it much, Yash. So don\’t think I can write about it.
How to apply nrtr on nifty chart ?
I cant see nrtr in zerodha indicators…kindly support
NRTR? Can you please give a context, thanks.
Sir
How to plot RSI Divergence & EMA.
No need to plot, the charting software will do it for you.
Hi sir, what is the best time frame to use a Fibonacci retracement?
I\’d suggest end-of-day candles.
How can get a Central Pivot range indicator in trading view
Available only in ChartIQ for now.
Hello, I am not able to set RSI on moving average in Zerodha chart, whenever I go to setting of weighted moving average in source, there is no option of RSI. Please help someone.
Deepika, I\’d suggest you call our support line, they will help you with this.
Such nice reading…so lucidly and simple way to explain….too good…
Happy learning 🙂
I am very sorry 2 say Karthik, I don\’t have any zerodha a/c, now I want 2 open a new a/c in zerodha (1st time) but my bank a/c is 3 months old nd with this bank a/c (3months old) , can I open a zerodha d-mat a/c right now?
Pari, like I said, 2 accounts with one PAN won\’t be possible. Bank statements is at least 6 months, there are other alternatives here – https://support.zerodha.com/category/your-zerodha-account/your-profile/articles/financial-proof-console
Hi! Kartik, 1st of all I hv 2 give a lots of thnx 2 u for their dis type of module, nd telling u from my soul, u r da best teacher from my point of view.i spent a lot of tym to read your mutual fund and technical analysis modules very deeply for last six months , and u know what , I hv no words 2 explain u, the way u r teaching other, just in one word \”UNIQUE\”.So , plz don\’t think that , these words are kind enough, it is true.
And lastly I need an information that I want 2 open zerodha a/c, but I hv opened a new bank a/c ,3 months old, so can I open zerodha a/c with this 3 months old bank a/c?
Lastly, which is last but not the least, I need your help about stock market whenever I face any difficulties.
Thanks for the kind words and appreciation, Pari. Means a lot to me and the team. Also, you can open only 1 Zerodha account with one PAN card, you cannot open two accounts.
Sir
But problem with myself is is I have only 5000 in my capital. And the prices of nifty 50 stocks are very high if I do money management and in one time I invest only 500 to 800 rupees. So how can I trade with much high prices stocks.
Think of your current capital as the capital for learning, make your mistakes now. Hopefully when you have a much bigger capital at a later stage, you commit less mistakes 🙂
Sir
Please solve this last issue sir
Sorry, can you add more context to this?
Sir
I read again reading technical analysis book then I found for trading stocks pick up Nifty 50. But problem with myself is is I have only 5000 in my capital. And the prices of nifty 50 stocks are very high if I do money management and in one time I invest only 500 to 800 rupees. So how can I trade with much high prices stocks.
Thank you sir
Sir,
I do daily practices sir but till I have not enough knowledge to take stocks. For that one my most probably question is how to pick up stock for intraday trading or trading is I see 52 week high low and anything else . Can maybe I select some stocks and the do trading. Solve my problem sir
Vishal, you can start by applying the same candlestick charts on the intraday timeframe. Observe patterns and try and apply these to the stocks. I think this will be a good starting point.
Thank you sir
Good luck!
Sir
Last time when I was in market. Sir I know my grandchecklist and game of probability,but I don\’t find any opportunities. Whenever any candle form I compare which one, then market goes on other stock.How and which stocks I select. I also trade in currency and other 30 -35 stocks, but I confused sir. What I can do sir
You just have to continue practising, Vishal. No other way around this.
Sir,
Thank you
Last query
You have any social media accounts sir
Yes, look for Zerodha Varsity on Twitter. I\’m available as myself on twitter.
Sir,
I telling you that I think moving average is good or trend line sir
Many people saying is trend line.
But my trust on my guru.So explain why moving average it is my query
Because moving average is simple, Vishal. Its easy to understand and implement. There is nothing complicated about it. If used well, it is also effective. I guess that all a trader needs – effective and simplicity.
Sir
I know your explanation is best and it is combineds of many books knowledge. But I have some yes or no like feeling for moving average or RSI . Please skip my feeling with some lighting words .
Can you be more specific with the query, I can help you perhaps 🙂
Hello sir
Good morning
You give me simple indicators moving average or RSI. Can it is best to apply for intraday and it is. So which indicator you use for intraday RSI or moving average. And please provide me best source and books for that indicator to learn.
Yes, you can try that. Ensure you use these indicators on an intraday basis. You can refer to the working of this on Varsity itself. The maths remains the same no matter where you read this from.
Hello sir,
First of all thank you for all education, given by you.
I become really trader after your education.
Sir,
My problem is which indicator I use for fifth strategy point in grand checklist indicator?
Which Indicator you use for intraday trading and why?
I use ichimoku for intraday please explain it is best indicator for intraday or any other is best.
You have experience please give your experiences. And suggest best indicator for your student.
Your student
Vishal vishwas Yadav
I\’d suggest you stick to simple indicators, Vishal. The trick with indicators is that you should understand the mechanics of the indicators well. For example, a moving average or RSI is a simple and easy indicator to us.
Sir, What type of Technical analysis done by SMART MONEY? is they analyse using price action or use something secret?
They too do something similar.
I completely understood RSI, but when I did more research on this topic I came across RSI divergence. I wanted to know about this from you. If you can plz explain it.
And also when should a trader use a particular timeframe chart. Like what will be the best situation to use different timeframes of charts. I will like to know this in the way you talked about using different EMAs crossover system.
like 9 day EMA with 21 days EMA – use this for short term trades ( upto few trading session)
25 day EMA with 50 days EMA – use this to identify medium-term trade (upto few weeks)
50 day EMA with 100 Day EMA – use this to identify trades that lasts upto few months
100 day EMA with 200 days EMA – use this to identify long term trades (investment opportunities)
If you could represent it like above it will be beautiful.
Thankyou for all your efforts and this is a great help.
Divergence is a slightly more complex topic and it does not have much incremental value add over a regular RSI. Hence I\’ve not discussed this. General rule of thumb – longer the time average, the better it suits the long term holding period/trades and vice versa.
Hello Karthik,
I have read all your chapters on TA but still to explore further I was reading a book by Ashwani Gujral and there was a para about trading with stochastic indicator:
“When you identify an up trend on a weekly chart, wait for the daily stochastic lines to rally above their upper reference line. Then without waiting either for their crossover or a downturn, place an order to sell short below the low of the latest price bar. Once you are short, place a protective stop above the high of the trade day, or the previous day, whichever is higher.”
Please can you explain me this and what is being referred to as UPPER REFERENCE LINES?
Thank you.
Not really sure, perhaps he is referring to the envelope lines of the stochastic indicator. Maybe you should check.
How do I get the RELATIVE STRENGTH that David Ryan and mark minervini and O’Neil talk about ?
Not RSI, RS LINE
Not sure, Sashidhar. Is there a link for this?
Hi Karthik, I was creating a reverse RSI(5) calculator for my setup to get target BANKNIFTY value for my required RSI and values are way off if used SMA, I think it really is EMA as Simon has pointed. Is there anyway
– it can get checked
– if a reverse plot line for target RSI can be plotted
I\’m not sure myself, Durgesh. I\’ve never used reverse RSI.
Does RSI 5 minutes charting in Zerodha Kite use Simple Average of Gains and Losses, or is it Exponential Moving Average? RSI value computed using a toy program is way off, so the ask. If it\’s EMA, what is the recommended data size for a span of 14.
Its usually the simple average.
Hi in indicators especially in RSI and StochasticRSI there is a setting called price line what is the significance of this ?
Samn, I need to check this. But I guess it is to ensure you plot this on the prices, not volumes.
Sir I am a beginner..could u pls tell me how to pick a stock from a thousand of available stocks…any software for tis?? How to do it ??
…pls guide me sir
I\’d suggest you start with Nifty 50 stocks.
Sir , in previous comments you told me to prefer end of the chart period for intraday and other shortterms trade ,my doubt is if I am going to trade today EOD means I have to look at close chart of yesterday just like the risk averse to verify the trend. and which time frame to start to check can I check from 12.30pm in yesterdays chart ? if I am wrong can you please explain sir.
my question is ;
If i am going to trade today which timeframe from end of the day chart to choose ?
The idea is, today my intrday trade today, I look the charts up to y\’day\’s close and make a broad plan. The lookback period can be say 3 months. So you look at the chart today, get a sense of how the next day is likely to pan out and set up the day at opening.
Hi karthik. thank you so much for writing these chapters so beautifully. expecting you to atleast publish a book of short stories :).
coming to my doubt. My understanding is that if i keep a 1 day candle then the rsi will calculate the previous 14 days . therefore by this logic ,a 1 minute candle will look back at the last 14 mins so a 5 minute candle calculates the previous 14 5 minute candles?
If you keep 1 day time frame, then the lookback period will be the daily candle, and that right, the lookback will always be the time frame you select.
How to search for high volatile stocks which are in squeeze and with relative volume is above the avg volume in the zerodha app
YOu can try streak.tech for this, Akanksha.
Sir,
In TA there are many Indicators like Candlestick, S&R, RSI, fabonachi etc is it important to go thru all of these.
or can we stick to 2 3 indicators and go deep into them and leave the rest.
Thanks in advance
You can pick two or 3 that you understand and most comfortable with and trade using that. I\’d prefer to do this rather than keep hunting for indicators.
In zerodha kite chart , Stochastic Rsi indicator is not visible to me. How can I add this indiacator in kite ???
Did you try searching for it under studies? Studies is the drop down list of indicators in chartIQ.
I calculated RSI using the methodology described here. It does not match the RSI(7) value that shows up in kite. Is the formula different over there?
Please see the comments, someone else had a similar query and it was resolved.
Hii
IS RSI available in zerodha based app
Kindly guide me regarding that.
Yes, it is available.
how to select rsi period in minute instead of days for intraday trading?
Click on the first drop-down option in the chart, it may be selected to 1D by default, but when you click on the down arrow you will get intraday options.
I am unable to share it here as the feature to attach file is not available.
No issues, I\’ll check with Siva and update the post 🙂
@ Karthik Rangappa,
Problem :
I have used the RSI Calculation given in this book (technical Analysis) to calculate RSI value however, the value is widely differ from the Zerodha Kite.
I posted this query in Zerodha forum (Trading Q&A) . I have got the response from (Siva and a person called @algo Greek. (Thank a lot to them).
Solution :
The calculation given in this book is to calculate first day Average gain and loss Value. the second day calculation is slightly different, which is missing in book. We need to take pervious day Average Gain and multiply with 13 and then add current day gain to calculate Average Gain for 2 days. The same apply to Average loss as well….I request you to update the book to give the complete knowledge, if anyone want to replicate the calculation in excel or using some other tool.
Algo Greek shared me a excel sheet with formula for better understand. i am able to share it here as the feature to attach file is not available.
Thanks, I\’ll speak to him and get update it here 🙂
I have done the calculation based on the above given method. however, this result is widely differ with Zerodha Kite RSI Value. I have used close price and 14 day look period in my calculation as well as in Kite setting. I request you to help me to get output as like as Zerodha Kite one.
Hmm, not sure. There could be subtle difference, Srinivasan, this happens due to the small changes in the formula to accomodate for improvisation.
In the above article, how to proceed with the computations if average points lost comes to zero? I mean how should the formula be corrected to handle the obvious divide by zero error?
Averages won\’t come to zero right?
what is the meaning of S&R… i know its a basic question. But still have a doubt
Thanks
S = Support, R = Resistance.
What if the RSI is between 35-60. Should we wait for it to go down or up respectively.
Has no real value.
Hi,
Firstly, thank you for this amazing content.
My doubt is:
When we select RSI from the studies drop down, there is an option in the pop up which allows us to choose the field:
1. Close
2. Volume, etc.
What is the field we should choose? And why?
1) CLose – for plotting the RSI on close prices.
2) RSI on volumes, not required.
Sir Stochastic give more signals than RSI when observed more stochastic is one which oscilates more often,RSI gives confirmation when there is only deep correction
Can we use this as a alternate to RSI to confirm
Yes, but you need to be aware that these are two different indicators and functions differently.
Hi Karthik,
can you tell, appox. how much period of time is considered to be prolonged in RSI
thankyou
Say over 2 months or so.
Sir RSI is pointing upwards I thought it is bullish and when it is at 50 or 60 I used to think there is strong momentum,then I am wrong
Yeah, RSI above 80 is bullish.
RSI is the most popular leading indicator, which gives out the strongest signals during the periods of sideways
Sir how RSI can be used in sideways market
If RSI is between 20-80 it is normally due to sideway market and how it gives out strongest signals during RSI
It indicates that the market is sideways, so this helps you avoid taking strong directional bets.
hi
do you have comparitive strength index the ratio chart in Kite application
regards
Pras
Not sure, there are close to 100+ indicators, need to check.
Oscillators n macd showing flat line means the trend is sideways?
Thank you.
Yup, thats right.
Many thanks.
Good luck, Rishi.
How to identify if its just a retracement or is it really bearish?
That wont be possible 🙂
My whole purpose is to sync zarodha\’s article where they are explaining RSI calculation, to know whether article is correct or not.
Is there any issue from their end to share the SRI calculation ? i
IF YES: then you can modify your article where you are showing RSI calculation and mention there that this is basic stuff but actual RSI calculation may be different charting engine providers.
IF NO: then you can get the information from their end end sync the your article.
Because based on the information we read on Zarodha, we try to create our system and than our system works wrong due to this wrong information.
I agree on sir, I\’ll add a disclaimer saying this is an indicative calculation and may differ from vendor to vendor.
From your US team, you were supposed to get the information about how charting engine provider calculates RSI !.
Did you get any feedback from them. ?
Please tell them that this is very important because either they are wrong or Zarodha is wrong on article about RSI calculation. !
No Rishi. We use what the charting engine provides, and not really calculate our own values.
Kite should provide for Relative Strength Indicator (Not RS Index)
say INFOSYS VS NIFTY X-Axis : Time and
Y-Axis Ratio Price(Infosys)/Price(NIFTY) for -1 to +1
Thanks.
Please keep reminding them to answer.
From your US team, you were supposed to get the information about how charting engine provider calculates RSI !.
Did you get any feedback from them. ?
No Sir. There is no response for that.
I am an aspiring intraday trader and i\’ve read first two modules ,as I am more interested in equity trading in intraday, which further modules would you suggest to me ?
And if any other suggestions on where can I get more knowledge to get better at intraday would also help a lot.
I\’d suggest you check out the module on Technical Analysis and maybe the module on Futures and Options.
Thanks, I am waiting.
I tried to calculate RSI using above formula in excel for past one month, the value in Zerodha and calculation that comes in the excel are entirely different. Is there any adjustments to be made in the formula?
I can post values if required.
I\’m not sure Vignesh. There could be a modified version of RSI they are using. What I\’ve discussed here is the classical formula.
TradingView
Let me check, this will take time though. The team sits in US, and they will all be off for 15 days.
Yes, it seems that the calculation shown on article above is different than what Zarodha chart is showing.
Could your team ask them(charting engine provider) what calculation they are using and update the same calculation in this article. !
Just for information who is charting engine provider here ?
We have two charting providers – ChartIQ and Tradingview. Which one were you looking at?
Why do we need open, high, and low ! because the calculation in your article says to use closing price only ?
Hey Rishi, apologies, I was thinking something else. If the closing prices match, then the final values should match. Unless you are looking at a different time period i.e 14 days versus something else. If the time frame matches, then I suspect the calculation method is slightly different from the charting engine provider.
I had checked the closing price of NSE and what Zarodha is showing for given period and these are exactly same.
I think the best way to resolve this is, as I had shared my analysis with you i.e., \”DATE CLOSE CHANGE GAIN LOSS AVG_GAIN AVG_LOSS RS RSI\”,
you also please get this data and then share with me what RSI you are getting and I am sure that you will find the difference between what you will get and what Zarodha is showing on Kite. !
What about the open, high, and low prices?
Thank you so much, sir😊.
Good luck, Nikhil!
Sir, in the above graph, exactly 8th red candle from the marked red candle(at RSI 81), this candle doesn\’t have a lot of price variation, only a little, can we still consider it a spinning top?
Thank you so much.
Yeah, sort of.
Sir, very thorough explanation. Is 0- 100 just an indication method of RSI or a price measurement?
Yes, it is to limit the upper and lower bound.
We want to solve this, may be that Zarodha is showing wrong information !, which must be corrected because all the Zarodha clients rely on them.
No Sir, that\’s not possible. PLease check OHLC prices once.
There is no difference in closing price between what NSE and Zarodha.
So I want to know why this difference is occuring.
Please do check all the price points – OHLC.
Stock name: PHILIPCARB
I was calculating the daily RSI(14) of this stock starting from 27-NOV-2020 TO 17-DEC-2020.
Based on information which Zarodha has published in this article about how to calculate RSI, my RSI is 47.02 but when I check it on Zarodha Kite then it is showing 53.27.
Could Zarodha expert suggest why your software is showing RSI as 53.27.
———-
MY DATA:
———-
DATE CLOSE CHANGE GAIN LOSS AVG_GAIN AVG_LOSS RS RSI
26-Nov-20 165.65
27-Nov-20 166.85 1.2 1.2 0
01-Dec-20 170.1 3.25 3.25 0
02-Dec-20 174.25 4.15 4.15 0
03-Dec-20 173.5 -0.75 0 0.75
04-Dec-20 173.5 0 0 0
07-Dec-20 173.65 0.15 0.15 0
08-Dec-20 168.25 -5.4 0 5.4
09-Dec-20 168.7 0.45 0.45 0
10-Dec-20 166.95 -1.75 0 1.75
11-Dec-20 167.65 0.7 0.7 0
14-Dec-20 167.9 0.25 0.25 0
15-Dec-20 165.4 -2.5 0 2.5
16-Dec-20 163.8 -1.6 0 1.6
17-Dec-20 164.3 0.5 0.5 0 0.76(AVG_GAIN) 0.86(AVG_LOSS) 0.89(RS) 47.02(RSI)
There could be a minor difference in the closing price, hence this difference.
hey kartik, can we use money zone indiactor in zerodha chart
Hi, How can we be sure of look back period selected by us actually works, should we try it on historical data and test it ? can you pls provide an example by taking 2 different look back periods and comparing RSI for both the cases and validate the same with the pattern. Thanks in advance 🙂
Yes, this is largely a function of trial and error over the initial few days and then you\’ll know how to scale on the lookback period. For example, if I\’m looking at say a swing trading opportunity, my look back period will be around 6-8 months.
Dear Sir,
What is its meaning – 1)Leading indicators signals the possible occurrence of an event. ?
2) Lagging indicators on the other hand confirms an ongoing trend.?
Leading indicators – attempts to foresee the future and predict events
Lagging indicators – tells you that an event is panning out
Event = price behaviours.
Hi Karthik,
I am starting my journey in trading from zerodha only. I have few questions :-
(1) Reading Technical Analysis chapter is enough ? or i should finish other modules too before i start real trading.
(2) While reading in comment section i found zerodha offers many Apps apart from kite like Pi, streak, sentinel etc. I want to know in which order i should access these tools ? I already attended a demo about streax and it seems like one needs experience to use it efficiently.
Many Thanks Karthik Sir,
Regards
Ishwar
1) TA helps you get started, you can always improvise on this and pick up other things as well.
2) These serve different purposes, so you need to understand these purposes and use them accordingly.
Good luck, Ishwar!
Hello Sir,
I am a beginner in trading. What is the best way to find out the S&R, MA and SMA while doing in Intraday trading.
Please help me on this.
Thanks
You\’ll need to pick a time frame that suits your style if you are beginner, I\’d suggest you pick something like a 15 or 30-minute time frame. Once you do, load the indicators that you think makes sense.
Hello Karthik Sir,
This is in reference to answer you have suggested regarding my Question no. 3 of 23 september. You have suggested 9 day EMA line (Signal line) should crossover MACD line for buying opportunity but in chapter you have mentioned MACD line should crossover signal line for same.
As you suggested I have gone through entire comment section but could not clear my confusion.
So, request you for your clarification. My apology if I am missing something here.
Regards
Sorry about that, the signal line is the one which should give you the cues, since the signal line is the average of the MACD line.
I learned a lot from this chapter. Thanks!☺️
Happy learning!
Hi Sir,
Thanks you for your revert. However I am bit confused with answer you have suggested regarding my Question no. 3 of 23 september. You have suggested 9 day EMA line (Signal line) should crossover MACD line for buying opportunity but in chapter you have mentioned following :
The sentiment is bullish when the MACD line crosses the 9 day EMA wherein MACD line is greater than the 9 day EMA. When this happens, the trader should look at buying opportunities.
Both these statements are opposite to each other.
So, request you for your clarification.
Regards
Hmm, We have discussed this across many queries Rajjnish. Can you please read through the same? Thanks.
Sir, when you mentioned that \”if RSI is in the overbought stage for a long time, then we have to look for selling opportunities.\” How long did you mean? Is there any specific time frame?
I mean, the idea is to look at it as a contrarian indicator. No timeframe as such, you need to look at it from a case to case basis and take a call.
Hi Karthik Sir,
I tried to post above queries in relevant chapter but could not do the same as error message was popping up. My apology for this.
Regards
Not an issue.
Hello Karthik Sir,
Request you to clear my following doubts :
1. As there are so many indicators, which are the best and sufficient indicators for Swing trading?
2. I do swing trade in Nifty 50, next 50 and midcap 100 stocks. When Nifty index is in sideways market I use indicators RSI & BB both whereas in trending market I use either EMA crossover or MACD crossover. Hope this is correct as per your own experience? As you advised, I use indicators only as supplementary.
3. In Kite chart, for MACD crossover if black line (MACD) is above red line(9 day EMA) it is buying opportunity. Am I correct ?
Thanks in advance !
1) Moving averages if you ask me 🙂
2) Yup, this should be a good starting point. But do remember, the primary indicator of trade comes from the candlestick patterns
3) Redline (the signal line) should crossover the MACD line.
HI Team , i wanted to know how we can calculate the rsi value at 9.15 (1 min chart ) when the market opens , if i take the last 14 close values from pervious day and start calculating using the above formula , it does not give me the different rsi value than what comes in zerodha rsi chart , kindly suggest .
It comes calculated by the charting engine that you are using.
Hi,
If the RSI shows between 30 to 70 what we have to do?
No trades within that range.
Hi Sir,
The period in RSI setting is in Days or Minutes?
Depends on the time frame you load. If its EOD then its days, else its minutes for intraday.
When can we get RS Indicator in Kite. RS – Relative Strength not RSI
If its not already there, then I guess our chart team look at this.
Hello Sir,
Looks like you have used the closing price for calculating RS thereby RSI, but in practice do software use moving averages to calc RS?
Probably, but I\’ve used closing prices.
Hi Karthik Sir,
1. How we can do backtesting? Please guide.
2. I am applying EMA crossover period as 25×50 for swing trades. What RSI value I should apply for such trades, RSI 14 or something else ?
Thanks in advance!
1) Check streak.tech for backtesting
2) 14 is good enough, its the default value.
Thanks a lot sir,
So to summarise
For sideway market / when in range
Bollinger bands
For trending / momentum market
Moving average, MACD, RSI
Yes, you can say that.
Thanks, just want to clear few things,
Volatility means price of stocks changes from low to high and again high to low within few days span.
Momentum means trend , either up or down, prices moves higher high / lower low (I am not sure)
Thats right 🙂
Hello sir, sometimes prices are at top upper band of bollinger bands but rsi between 30 to 40, how to interpret?
Roshan, it is not a great idea to combine two different indicators. It will just complicate things. Bollinger band deals with volatility and RSI deals with momentum, so they are two different things.
Can you Add only RS indicator which available in the Trading view Platform?
RS Indicator?
What will happen if average loss becomes 0? Because RS = average gain / average loss and when average loss = 0 this fraction will become \’not defined\’ or illegal… And the entire equation will collapse… Someone please help…
When you have a time series data, average won\’t be 0 right?
Hello Karthik,
If I do intraday for 15 minutes timeframe, I want to ask you if RSI is greater than 60 (if I choose 60 instead of 70), then should I take for a long entry (Buy)? And if RSI is less than 40 (if I choose 40 instead of 30), then should I take for a Short Sell? Is that correct?
If I use EMA crossovers with RSI, then what will be the parameters for EMA?
Thanks,
Since its intraday, you can shift to shorter RSI values. However, please make sure that you have backtested or paper traded the RSI band of 60 and 40 before placing a real trade. Good luck!
HI,
Can you please give us some information about the divergence on RSI and how to use it while trading?
I personally don\’t find the RSI and MACD divergence of any use, hence I\’ve not written about it 🙂
Hi Karthik,
\”August 12, 2020 at 10:47 am
No, I’d suggest you practise few traded with what you’ve learnt before you venture into more reading.\”
Thanks on above reply.
In TA, How do i figure out why a chart pattern/Indicator fails? Where do i start looking for information?
For every trade few factors work in your favour and few dont…but there is always at least 1 dominating factor in a trade. Unfortunately, its very hard to identify the and rationally explain why these factors work/don\’t work.
Hi Karthik,
Myself new to Stock Market. Finished TA module.I would like to know, if i have to read more on TA, if yes, please suggest the options. Thanks
No, I\’d suggest you practise few traded with what you\’ve learnt before you venture into more reading.
Dear Sir,
I had gone through the new indicators provided in Kite, please let me know how indicator named Central Pivot Range can be used in trading?
Neena Trehan
Yes, will put a chapter on that in the coming week.
Dear Sir,
In trading view chart in MACD indicator we can see volume bars are showing indication with light and dark green and red bar where in zerodha MACD indicator we don\’t find bar color shado color change based on volume. Is there option available we can change setting and get same indications. Thanks.
Ah, I\’m not sure Sameer. Can you please check the settings once?
Sir
How to use RAVI indicator in zerodha?
Looks like we\’ve not covered that in the module. Also, I have not used the indicator, so won\’t be able to help you with it.
How can you set the indicator value from chart properties as default. (I wanted to see all indicator values on the right end by default)
Rehna, it is easier to explain on call. Can you please call the support for this? Thanks.
Hi Kartik,
\”If the RSI value starts moving away from the oversold value after a prolonged period\”
If I may ask, in your personal opinion (strictly acc to you, as I understood the need for flexibility and choosing our own parameters as stated above by you), how many days do you consider a prolonged period ?
Maybe around 15 days or more, Mrinal.
Hi,
I am not able to get the \”Stochastic Momentum Index\” in my account. Is there any problem / it\’s removed from it ?
Thanks
Mahendra
Have you checked in both TV and ChartIQ?
Where can we find these indicators ?
It\’s available on both Trading View and ChartIQ.
Can you explain the logic behind exponential moving averages?
It is explained in the MA chapter, Akshay.
hellokarthik…
what is AD ratio?can we understand the market trends using this ratio?
what is adx?i dont get it fully…the formula are so complicated to me .can you tell it in simple words…
Check this – https://zerodha.com/varsity/chapter/supplementary-notes-1/
Hi Karthik,
I am using EOD chart.
It should match on EOD basis, although few mismatches with intraday is expected. Is this like a very large difference?
Hi,
The formula given for RSI don\’t give exact same result of RSI as what is shown in kite platform. I have used EMA for calculation of average for Points gain and lost. Kindly help me to know the formula used in kite for calculating RSI.
Formula for average calculation: (Previous day average*13 +Today\’s Point gain/loss) divided by 14
Are you doing this on intraday chart or EOD chart?
Hi,
I\’m not able to get the Trend Intensity Index please help me.
Trend intensity?
1) how many day EMA to use for btst trades?
2) lookback period for RSI to use for btst on daily charts?
3)bollinger bands how many days moving average for daily charts?
1) At least 15-20 trading session
2) At least 30-45 days
3) No MA as such, use the BB as is.
you added some great indicators on the 29th of May but removed on 1st june. please add them back.
We will get it back soon Rocky 🙂
Hi Karthik,
Thank you for the wonderful content on Zerodha Varsity. As a novice investor, I found it extremely useful and interesting. I have three questions:
1. Is it possible to calculate the percentage of time a stock is in Oversold, Overbought and in between the two zones? I guess this could be done by calculating the area under the curve in the RSI indicator in the respective regions. Is this feature available in KITE? I think this will be useful in judging the relative strengths of various stocks.
2. Is it possible to plot multiple indicators in the same window? For example, I would like to track both RSI and MFI using the same y-axis. At present KITE gives me another sub-plot which is not efficient since both indicators have the same y-axis range.
3. Is it possible to export data and run some custom scripting operations? I ask because the feature I asked in 1st question is pretty simple if I have access to RSI series data.
Thanks once again!
1) No, this feature is not available in Kite, not sure about other platforms either. I\’m not sure about the use as well 🙂
2) Ues, you can. However, these will show up on different panes. In my opinion, tracking multiple indicators may very useful
3) Yup, you can use Kite connect APIs for this – https://kite.trade/docs/connect/v3/
Hi Karthik,
Firstly I would like to thank you for building such amazing content for the newbies. I did studied your Fundamental Analysis & now also about to complete Technical Analysis & I\’m really enjoying it. The content is quite impressive, simple & logical to understand.
Can you help me with the middle range i.e. what if the RSI range between 30-70? What does it depict?
I\’m glad to note that, Kapindar. The middle range for RSI means a lack of trend/momentum in the stock/index.
what if the rsi is neither moving above the range nor moving below the range. it is in center of your range
Then there is no trade 🙂
how to draw average volume line on volume chart?
Select the field as prices from the MA settings.
Sir, This question is because I am just beginner on Zerodha Kite. When I am choosing 1 day period on BOTTOM, RSI is different for today\’s date than on selecting 5 days; Similarly, It changes when I select different time period at the BOTTOM. Which RSI value is correct to decide to buy the stock.
When you select different timelines, you get different RSI values Mahinder. So you need to ensure you work with a timeline you are comfortable with.
Thanks for the info Karthik.
However, im confused on what time frame that I need to look at this on the chart, Is it gonna be 1 day or 1 hour chart?
Look for day chart, Suresh.
Hello Karthik,
Had gone through other stuff but the way you put this ahead was very easy to understand, Kudos!!
However, need your help in understanding the time frame that we need to choose on the chart for 9 day EMA with 21 day EMA or 25 day EMA with 50 day EMA for swing trading to get the desired results.
Thanks in advance!!
Regards,
Suresh.
Suresh, swing trade implies you intend to hold the position for a few trading sessions. Which means you need to based your decision on an EOD data. The general rule of thumb is higher the data frequency, better the quality of the signal. However, you need to strike a balance…from my experience, a 21 x 50 probably helps.
Hi Karthik,
Could you please add a chapter about price action based analysis.
The entire module is about that if you realise 🙂
Hi Kartik,
Great Content, thank you for sharing your knowledge with us.
In a market which has shot up heavily or beaten down heavily in few sessions (these covid days), would these indicators work ? mving average for 20, 30 days will be skewed ? or should we change days accordingly ?
I\’m of the opinion that when the markets move for fundamental reasons, TA does not hold up.
sir, in some of the charts RSI is range of 30 but the super trend is showing buy .. then how to read the situation.. kindly explain
Hmm, never a good idea to follow two different indicators at the same time. This may lead to conflicting opinions. Please stick to 1 system and follow that.
Hi Kartik,
I would like to see a chart wherein I can see the RSI of Stock vs Nifty or Stock Vs Stock. Please advise how can I check that on zerodha kite. Also how can I see a chart of Nifty 50 as the options I can see is only Niftybees and niftyees.
Thanks
Supriya
You can set up a multi-chart view, please do refer to the last chapter of this module.
How can I download pdf file of the notes?
You have the option to download the PDF at the end of the module page.
What should be our interpretation when the RSI is between 30 to 70. And what should be a trader ready for ? Long or short or just watch ?
It does not imply anything meaningful. RSI is useful only at the extreme ends.
I want to mark the opening range of 15 min chart, the high and low. I could not find any indicator to do so. please guide. Second is that thereafter I want to change my candles to 5 min chart with the high and low mark of first 15 min candle to continue. Please do help.
Ah, I\’m not sure how this can be done.
Sir,
If I calculate 2 period RSI.If there continuously gain or loss two consecutive days .RSI should be 100 or 0 only right as per formula.
But in real scenario this not same
Eg Take SBI from 13.01.2020-16.01.2020 stock if falling for continuously falling for 4 day.
RSI should be zero on third day as per formula .All charts showing RSI around 17 in Zerodha charts as well as in other charts too.
Here how RSI is calculated
RSI measures the momentum, the rate of change matters here and not just the change (i.e. up day/dawn day).
Hello Sir,
What happens if stock continuously gaining or losing in 14 consecutive days. Average of loss or gain will became zero.
How to calculate RSI in this scenario.
Hmm, the technique to calculate RSI remains the same. It\’s just that the results will display extreme values.
hi karthik,
it is a very good resource from zerodha to get started with trading for begginers
i have below queries
1. i would like to trade using Bullish engulfing pattern, as per my understanding necessary conditions to be satisfied for it to be profitalbe would be
2 red candlesticks before formation of the blue candle with large body which can engulf the previous red candle.,and RSI should be <30 and volume should be greater than 10 day average volume ,
is there anything that i need to check before trading other than these conditions?
please let me know so that i can learn.
As long as the candle on P2 engulfs the candle on P1, the pattern can be considered as bullish engulfing. The RSI criterion is not really required.
Hi,
How will you combine S&R and RSI calculations? For example, if a stock is going upward for a considerable amount of time, meaning RSI would be above 70 at least. And bullish candlesticks are in majority, so it is advisable to go long then? Then how would you consider Resistance here? Because the stock would not have seen any sudden decline in a very long time period? Hope I have put the concepts in a correct manner here. I am new to the trading concepts so 🙂
Dhaval, if a stock is trending up or down, then you will have to consider a trendline.
Hi,
Now that kite zerodha offers trading view charts for analysis, is it possible for us to add custom indicators?
If I login to trading view directly I can see many custom indicators created by others under the public library which can be used.
But if access trading view charts from kite login, I can\’t find any custom indicators. can we overcome this? or allow the user to create a custom indicator, please?
Regards,
Sri
We don\’t have this yet, let me check this with the team.
Hi karthik,
Which is the nearest substitute for DEMARKER INDICATOR. As I didn\’t find this indicator in kite & trading view.
I need to do some research on this, Mehul. But I do remember someone mentioning that ADX, +DM, -DM are the closest approximation. You may want to double check that.
Sir how to analyse market from bigger time frame to lower time frame for primary trend in intraday …and sir do it really workout….sir suggest with small example ….
Satish, I\’d suggest you look at the EOD charts to get a larger perspective and maybe load 15 mins intraday data to get a shorter term (secondary) perspective. How this works really depends on the way you the system. If you scalp, then the probability of success is lower, if you increase the time frame, you do get a better perspective. So eventually it all boils down your risk and reward temperament.
Friends, I am planning to buy a course on RSI from a renowned RSI practitioner. Its price is $4500 ( roughly 315000+). I am looking for partners to buy the course so that cost can be shared. If interested do text me on 9892233731… sandip
Sandip, apologies for the unsolicited advice. But seriously, why do you want to blow up Rs.315,000 on a course about RSI? There is plenty of free knowledge available on the internet, and I can assure you that what\’s available for free is more than sufficient.
Hope you take a well-informed decision. Good luck.
When should RSI and MACD used,
Range bound or trending?
Well, these indicators help you figure if the stock/index is range bound or trending.
Sir, to practice scalping on an intraday basis which indicators/combination of indicators are best to use? I am using 15 minutes and 5 minutes candles. Please provide some insight. I am entirely new to this but scalping on intraday is most interesting for me. I know scalping needs quick action that i can take care, planning to write code for executing the order.
Padma, if you are keen on scalping, then I\’d suggest you look at order flow data along with price volume breakouts. However, since you are new and you are interested in this, I\’d suggest you start with 1-2 trade setups for the day using 10/15 mins candle. Once you get used to this, maybe you can think of scalping.
Good luck!
Thank you Karthik, i heard of price volume break outs but never heard a term order flow data . Please elaborate. Also pls share any reference material that can be of help for the best indicator selection for scalping on indian share market. Yes i also planned to try daily 1 to 2 indicators or combinations of indicators in my program..thank you…
Order flow data is nothing but the way the people buy and sell, which reflects in the market depth (top 5 bids and asks). The higher the flow, the higher the liquidity of the stock, hence easier it to buy and sell larger quantities. I\’m saying larger quantities because scalpers transact large quantities for a relatively smaller movement in the stock.
Can you suggest best trading software in the market which auto signals buy/sell intraday/Swing/Positional and user friendly.
The best according to me is Kite. If you know to programme, you can always check out – https://kite.trade/ and create your own logic for positions.
Hi,
Can you tell me what is the difference between RSI and stochastic? Which one is better applicable for swing trading?
Have explained the difference in the chapter. I\’d suggest RSI. Stochastic does not work well for swing positions.
I have my own stock screen in Google sheets, I wish to add RSI also in a colum. Do you have a code for Google sheets which pull out RSI values of a script. Thanks in advance.
You can probably check here – https://support.google.com/docs/answer/3093281?hl=en , Nove.
I\’m a beginner and trade only in cash market still not started with f&o and I trade only nifty 50 selected stocks and some next 50 and midcap stocks I basically prefer swing trades and rsi I buy when rsi enters 30levels and even if it falls then also I buy and keep on averaging and I hold the positions for multiple days and when I enter into profit zones I book my profits this strategy has given me some good profits and has a good accuracy upto 80% wat do u say about this strategy is it good to average a lossing trade as in some TV channels they say don\’t average Ur losing trades waiting for Ur precious opinion on this.
The problem with averaging on a losing stock is that you are buying more of a losing stock. So your net exposure increases and if the stock continues to fall, you will end up losing a lot more money.
I\’m not a big fan of RSI, but then if its working for you then you should continue to use it 🙂
Thanks.Which are the TA check list you follow to execute a trade.
I have explained this towards the end of the module. Check this – https://zerodha.com/varsity/chapter/dow-theory-part-2/
Dear Karthik Sir,
If a dumb newbie has started understanding all the TA contents nicely then how much time and money will it take to make 2k frequently usually on daily basis??
Thank you.
This is one of the toughest questions to answer, Gaurav. Highly dependent on your capital and strategy.
Still Sir from your experience can you say??
I once read somewhere that it takes 20K hours of rigorous learning and trading to reach some sort of consistency in trading.
Can you please help in \” How to check the values of the indicators placed on a chart at a particular pointer\” in Kite
???
You can always look at the cross air for data point.
Mr Karthik R
I very much like your postings
let you be the torch bearer to may people like us
Dr.R.Ponraj (M.Tech. NIT surathkal, Ph.D. IIT Madras)
Coimbatore 13.10.18
Sir, its an honor to hear such kind words from well-read man such as yourself. Thank you!
Hey Karthik ! Is RSI of any use if it is between 20 and 80 ? What does this range tell ?
Not really, its most useful outside that range. Between 20-80 is just waiting time 🙂
What if the RSI moves in the range of 20 and 80 ? lets say 55 ? What does it indicate ?
Hey Karthik ! Could you please take a look at this chart and tell me what all it checks ? (According to the checklist until now)
https://drive.google.com/open?id=1Oe9xlW1uP5LE_WDwnbvgzmeDnvavusCn
I\’d be hesitant to trade this stock with so many gaps and circuits. Technical Analysis is of very little help here 🙂
How to perform \”Relative Strength Analysis\” with some benchmark like nifty 50 on kite?
The relative strength of momentum? If yes, you can simply look at the indicators for this.
No, Relative strength analysis. Ratio of a stock 1 and benchmark (like nifty) [stock1/nifty] , and comparing it with the ratio of stock 2 and benchmark. [stock2/nifty] and Identifying the outperformance/underperformace with benchmark.
If I have set the period for my chart as 1 minute then does the period in the studies like moving average mean 1 minute or would it be 1 day?
It would imply 1 minute.
Thanks for your response. On a 1 minute chart what are the ideal values for RSI and moving averages which I should use for intraday trading?
Ideally, in my opinion, you should not look at 1-minute charts because I think its noise heavy. But if you feel compelled to use, I\’d suggest you look at the default values.
Sir In kite could you add swing indicator which shows HH,LL,HL,LH. on charts.
Onkar, this indicator is currently not available with us. However, you can use Fractal chaos bands which calculates higher-highs and lower-lows
Ok sir, Thank you very much for your reply.
Good luck, Onkar.
sir rsi is not same which i calculated in excel sheet of any company compare to your rsi.
Are you sure about the formula used?
Karthik sir,I am waiting for your invaluable reply agaist my above post regarding confusion in deciding the faith of scrips waterbase,Fresh fruits n Aimco pastycides.Hope your write up helps in deciding this confusion
Thanks
Arvind
Sir,I am impressed in going through your TA analysis in depth. But unfortunately, even after repeated study of your write ups,I failed to decide following.please help.
please refer the following stocks on BSE , waterbase, fresh fruits,and aimco pesticide .And please tell me as to whether these stocks are in accumulation phase or distribution phase..or it falls in different category otherwise,Please explain whatever is your logic.
Thanks
regards
Arvind Modi
Arvind, I can do that…but I\’d like to understand what exactly is the problem you face. Maybe I can help you with this
Sir,my confusion ,rather ,not able to understand the chart \’s characteristic..As per your ,accumulation n distribution attributes,after rise with high volumes till it peak,I take this as mark up 1 phase.ok.Subsequently,stock started falling with reduction in volume unabatedly till almost higher low status at swing bottom.The volume is not enough to buy even with bullish candle pattern developes.My question is this formation does not specify any where in your brillint full article.So is this accumulation again? as distribution phase is almost over awaiting suitable candle pattern with volume ,Time n price consolidation .?what should be traders approach in such scenario????
Arvind, volumes should confirm your action. In case the volumes don\’t support, then usually there is scope for a contrarian view. I would suggest you look at this from this perspective.
sir,With all respect, you have yet not specified as to whether these scrips are in which phase?accumulation or distribution end? Nothingvsaid so far in your article regarding contrarian approach.Please highlight on this.Are you in favour of contrarion approach?In case If I donot want to be contrarian,when can I take position in such type of stocks?
Overall,I am very happy with your article.and helped me a lot to clarify my wrong concepts so far.I heartily thank you very much for that.
Arvind, I\’ve clearly explained here that identifying accumulation and distribution is a bit tricky. Check this article – https://zerodha.com/varsity/chapter/dow-theory-part-1/, section 17.2.
Of course, contrarian approach is great, but for this, you need to have a great amount of conviction. You will develop this with experience.
sir,With all respect, you have yet not specified as to whether these scrips are in which phase?accumulation or distribution end? Nothingvsaid so far in your article regarding contrarian approach.Please highlight on this.Are you in favour of contrarion approach?In case If I donot want to be contrarian,when can I take position in such type of stocks?
Overall,I am very happy with your article.and helped me a lot to clarify my wrong concepts so far.I heartily thank you very much for that.
p.s.in case if I go as contrarion ,what factors apart from volumes,I should look in to for a justified selection of the stocks
Volumes matter, apart from that identifying accumulation and distribution trends matter, which like I explained can be developed over experience.
Hi,
I am attaching image of banknifty as on 25th jun. Is that a bearish divergence?
How do i send attachment?
You can upload on G drive and share the link, that is the easiest way.
please see below link for bn chart. Is that a bearish divergence
https://drive.google.com/file/d/1NYH9F35o0-X2qDDVBLy2OnpLjMDigb-4/view?usp=sharing
Should we see peaks or troughs?
Yes, you need to see the peaks and troughs keeping the price in perspective.
Not on EOD basis, remember there is no prior trend here.
Sir, Any good books you think would be a good read on different technical indicators?
I cant think of a book which is dedicated only to indicators. You may want to check Steve Nison\’s book on Candlestick Patterns. The 2nd half of the book discusses few indicators.
What is standard values to be put for RSI Chart?
What is standard indicators for RSI Chart?
14 days look back is the standard setting for RSI.
Thanks for reply.
I want to know what should be the value for over brought & over sold?
70 is considered overbought and 30 as oversold.
Thanks
Sir
kindly tell me how i can add ztrend indicator to my chart.
Open the chart and select the indicator you need under \”studies\”. This will plot the indicator on the price chart.
Nithin,
is there any plan in near future to add \”squeeze momentum indicator\” as its now only available with trading view but one of the best indicator so for.
Kindly update.
We will check this and let you know Mani.
Hi Karthik,
I m using Kite since last 1 year, i do activly trading in FnO. To get an early entry/exits signal , i required Average RSI indicator. How can I add it in kite?
RSI is available but I don\’t think Avg RSI is not available. Maybe you can add the moving average over RSI.
Is there any way to plot first 15 min high-low point automatically with horizontal lines for current and past dates in the Kite ?
Ah, no Tarun. This is not possible.
Calculating based on simple average.
Hmm, I really can\’t understand this. RSI is a fairly straightforward formula.
You can just review once on this part
Thanks
Will try and do this sometime soon. Thanks.
What values are considered for RSI ? is it closing price, average price ? Since the values are not matching between kite software and manual calculation. Also there is difference with other software like screener pro
Closing prices as default, but you can give it any input – Open, high, low, or avg prices. You just need to ensure that the input is same across all software, as long as that is in place, the RSI values will match.
It\’s not matching with my manual calculation considering closing price and also with screener pro. Could you please share me the formula you use for RSI
The formula is explained in the chapter itself.
Consider RSI of Jubilant Foodworks for latest 14 days which comes to 77.6 as per the formula, whereas it\’s showing 68.03 in kite now. You can cross check
Will do. Btw, you are calculating this on which average – simple avg, exponential avg, weight avg?
Hello Karthik,
I am trying to use the programmable alerts on the PI trading platform using TradeScript language. One basic question that arises when I go through the TradeScript manual is , for every function that TradeScript provides ,f or example
LAST – which fetches the LAST TRADED price
OPEN – which fetches the OPEN price of a scrip.
the manual says it will be the OPEN price of the the current CANDLE , LAST PRICE will be the most recent price of the current CANDLE, but it does not say whether these are DAILY CANDLES, HOURLY CANDLES or MINUTE CANDLES.
If I would want to compare the Closing price of the previous day to the OPEN price of the current day as soon as the market opens , how would I do that ?
Are all these functions based on the CHART that one is using ?
Ali, I\’d suggest you reach out to my colleague Srini for this – [email protected]. Thanks.
Thank you Karthik. I will connect with Srini.
Good luck!
Also if we can have 75 min charts on our charting software…
Hi! Sir, Can we have Chande Vidya Indicator in Zerodha Charts?
I\’m not sure about this. Request you to look under \’studies\’ in Kite.
No it\’s not there in charts
Just awsome Article Nithin Sir, Nimage koti Namana 🙂
Sir in rsi indicator, which time frame is best?
Chart candle time 5 min, 10min,or 15min which is accurate for intraday?
The longer the time frame, the better it is. Given this, I\’d opt for the 15 or 10 mins candle.
Hi Karthik,
What I understand if RSI stuck in overbought region for prolonged period and if I am believing to go long from here so it would be easy for me if I received any supporting signal to go long at this juncture. Having said this what all parameters one can look for to support this overbought region and hence go long? Few things I can consider if supports are being respected, Avg volume is justifiable and getting strong candlesticks patterns with S&R and volume.
Kindly throw your opinion here.
Yes, all these are valid support points justifying your long position.
Firstly happy republic day to all
Karthik sir I m new in your trading platform. I m reading your articles and they are fruitful for me as beginner.
I would like to know which strategy is best for option trading as I have lost so much money in option.
Thnx
Happy Republic day to you too, Ram!
Check this – https://zerodha.com/varsity/module/trading-systems/
My doubt not related to this topic, although please answer
Suppose i initiated a trade kept stoploss and take profit … Will trade get executed even if i am not in online due to powerloss, internet problem etc.. (as these are most common )? i am hearing a lot of negative about zerodha in this case..
kindly reply me
Its quite natural, people who dont put in the efforts to learn and understand how products work seek pleasure in making small talk and spreading silly rumors.
Anyway, yes, this is possible by employing a bracket order. Check this to learn more – https://www.youtube.com/watch?v=2TrYyOHA7P4&index=8&list=PLkxTRam6E2V-okv6gwQlt6dLTsn0v6CD1
Thank you
Cheers!
Where I can find relative strength comparative tool on pi or Kite?
Check under studies.
It\’s not there. Is there some other name for this tool?
Anish, this indicator is not available in Kite/Pi right now.
Will ask the Product Development team to look into it
Hi sir…when we say “prolonged period” what range we ahould consider …is it for 1 month or more?
It really depends, if you are looking at a 6-month-old chart, something like 1-2 months can be considered prolonged.
Thank u sir….just for confirma. tion…if i look at adani power chart (6 month)….the RSI has crossed 85….and in the past it has shown down trend when RSI crosses above 80( see 2 yr chart) ….should i wait for other indicator( like candle pattern ) , to initiate the short position in this scrip.
Like I\’ve mentioned earlier, the decision to buy or sell has to come from Candlestick, indicators only act as a secondary confirmation to the trade.
Thank u sir….just for confirmation…if i look at adani power chart (6 month)….the RSI has crossed 85….and in the past it has shown down trend when RSI crosses above 80( see 2 yr chart) ….should i wait for other indicator( like candle pattern ) , to initiate the short position in this scrip.
Hi Karthik,
As a beginner I loved articles here on Varsity, Thanks for sharing your knowledge with such great examples.
What I am failing to understand is how these indicators can help in long term investments, I understand FA is good for long term but how do we chose an entry point where prices are low which in turn helps in more profit. If we make an entry at uptrend market and eventually lose money due to down trend.
Could you please help with some pointers which can help in understanding entry point and exit point.
Thanks.
Vishal, TA and FA are two different schools of thoughts. You use TA for short-term trades and FA for long-term investments. Mixing the two can be a little tricky. I\’d suggest you dont do this, at least when you are starting off. Long-term investment should be made based on fundamental factors.
Thanks for the reply.
So does it mean just look at the fundamentals of the company and if they are good buy the stocks whatever the market price and let fundamentals handle it on the long run?
Thanks.
Absolutely, that is how I invest for the long term and it has worked for me over these years.
Hello Karthik,
Does the Zerodha trading platform has a feature wherein I can continuously get the values of the EMA\’s that are plotted on my graph ?. For example as the graph builds along during a trading session and the EMA\’s get plotted for a particular scrip/stock/security, there should be an API that I can use to extract the EMA values for this particular scrip/stock/security. I can then use these values within a customised program to arrive at the decisions I need to make an entry or exit.
Please advice.
Regards,
Ali.
No, we don\’t have this feature. However, if you are familiar with coding, then maybe you should check out the Kite Connect APIs – https://kite.trade/docs/connect/v1/. I\’m sure you can build this quite easily.
Hello Karthik,
Thank you for the prompt response. I have one more query on the Stock Futures (Derivatives) market. Do you know why after market hours are not allowed for the derivatives (Stock Futures) segment ?. What is the logic behind restricting this when one can place a after market hours order on the equity segment ?.
Regards,
Ali Asghar.
I\’ll get back to you with an answer for this, Ali. Thanks.
Hey Karthik,
Did you get a chance to think over the query of Derivatives not being allowed for pre and post market hour orders ?
Regards,
Ali Asghar.
Hey, sorry I guess I missed your query earlier – anyway, even in after market hours trading price discovery won\’t happen for eq, one has to trade only market orders at closing prices of 3.30.
Hello Karthik,
Going back to the query I posted on 7th december and you responded with the possibility of using Kite connect API\’s. I really want to give this a try. Would you be able to provide technical assistance in case I hit some roadblocks during the development ?.
Regards,
Ali Asghar.
For API tech support, I;d suggest you look at this – https://kite.trade/forum/
Thank you Karthik. This helps.
Cheers!
Hi Sir,
If the RSI is in a overbought or oversold region for a prolonged period (say more than 20 days) and so if we are entering the trade ( long/short) respectively and once we have entered ,if the momentum losses and RSI and price are moving in opposite direction, what to be done? How to identify these scenarios and get rid of it?
YOu cannot get rid of it, you can trade along with it 🙂
Its best if you use it as a contrarian indicator when the RSI values are stuck in the overbought/sold value for a prolonged period of time.
Hi Sir,
What if we have entered the trade based on RSI touching overbought or oversold, in a hope that it would retrace back ,but if the trend prolong to continue in the same direction??In this case what could be the SL?
You will have to cut the position.
Hi Karthik, Excellent materials on technicals! I have a querry 1. Should RSI value analysis fixed(20-30 for buy & 80-100 for sell) for all stocks. Or can we choose different RSI for different stocks?
Not really, you can choose to customize your RSI levels.
I am trying to calculate the RSI of Suzlon for an interval of 14 days. These are the date and close e prices –
Thu Nov 02 09:15:00 IST 2017 — 16.4
Fri Nov 03 09:15:00 IST 2017 — 16.5
Mon Nov 06 09:15:00 IST 2017 — 16.1
Tue Nov 07 09:15:00 IST 2017 — 15.55
Wed Nov 08 09:15:00 IST 2017 — 15.5
Thu Nov 09 09:15:00 IST 2017 — 15.5
Fri Nov 10 09:15:00 IST 2017 — 15.55
Mon Nov 13 09:15:00 IST 2017 — 14.65
Tue Nov 14 09:15:00 IST 2017 — 14.5
Wed Nov 15 09:15:00 IST 2017 — 13.65
Thu Nov 16 09:15:00 IST 2017 — 13.45
Fri Nov 17 09:15:00 IST 2017 — 13.7
Mon Nov 20 09:15:00 IST 2017 — 13.6
Tue Nov 21 09:15:00 IST 2017 — 13.85
Wed Nov 22 09:40:34 IST 2017 — 13.75
My RS is coming out to be 0.197 and RSI is 16.45
But in Kite the value is showing something around 31.6?? Can you please explain how come you are getting that value?
Are you applying this to closing value?
Yes these are the closing values. You can cross check one or two dates if you want. Also, please let me know what is the answer that you are getting.
Sure. Will let you know if I do this.
I got it know. Although in the article you have mentioned to divide the (total_profit/14) and divide the (total_loss/14) to find the average loss and gain, but what you actually doing is dividing the (total_profit/no_of_positive_days) for finding the average gain and dividing the (total_loss/no_of_negative_days) for finding the average loss. I was doing the prior one once so their was a mismatch of the RSI value, from your value. Please confirm.
I guess you found your answer 🙂
I am new in stock trading. I am interest in short term trading one to two week.
My question is what kind of technical indicator I need to set.
1. 5 20 sma crossover
2. RSI (14) above 80
your views pls.
Yes, you can use any of these indicators. However, I find candlestick charts a bit more powerful in terms of its predictive power.
Hello Mr. Karthik 🙂 Sir can you please tell me which technical indicators/strategy is good to use for intraday trading according to you? and the parameter settings for them according to you.. Also for intraday trades especially, is Profit:StopLoss ratio of 2:1, 3:1 good one?
Awaiting your kind reply! Thanks.
That would be really tough to answer because no two indicators work alike and no indicator works the same way on two stocks. You will have to backtest each indicator on different stocks and figure out which one works on what.
Thanks Mr. Karthik. I have done a certification course in which i learnt about Technical Analysis, Indicators like MA, MACD, RSI, Bollinger Bands & Dow Theory. Candlestick chart patterns: Bullish/Bearish Engulfing, Piercing/DarkCloud, Bullish/Bearish Harami, Morning/Evening Star.. According to you, is there anything else which i should learn about/add to my list of indicators and chart patterns which is definitely worth it.. Thanks and regards.
If you are comfortable with these patterns, then I\’d suggest you practice these in real markets. Once you get confident, try other patterns. Perhaps, you can backtest them to get greater insights. Thanks.
Okay sure thanks 🙂 I have been suggested to use SMA(80), MACD(12,26,9) RSI(14) with oversold level 30 and overbought level 70 and BB(20,2) for the daily chart trades.. Is this fine ?
Its fine, as long as you backtest it 🙂
karthik your view about advantages and disadvantages of ichimoku indicator whether it is a reliable indicator
I\’ve not traded enough using Ichimoku, Esan. So I guess, I can\’t really comment on it.
Hi Karthik,
I recently joined Zerodha and its the least when i say that you are doing outstanding work with it. Keep up the great work.
I have one question. Which indicators when combined work best for intraday trading? I really find stochastics fast % line very useful in predicting. However, what will your suggestion be?
Thanks.
Ritu – Welcome to the Zerodha Family 🙂
One shoe does not fit all.
No candlestick pattern or indicator works on the same 2 stocks. For example, bullish engulfing along with RSI may work on SBI but may not on HDFC. The trick is to backtest and be aware of which pattern/indicator (has a better probability) works on which stock.
Hi Sir,
I am looking for StochasticRsi Oscillator and Vortex Indicator in pi, where can i find it ?
Regards
Santosh Panda
Guess both are not available Santosh. Let me check with the team to see if we can do something about it.
Hi Sir,
Please let me know when these two indicators will be available in Zerodha Pi
Regards
Santosh Panda
Sure, will do.
Hi sir
When you say the word \”Trend\” , be it upward or downward , does its definition changes on the type of trading.
Like If I am a day trader then \”trend \” can be defines by a lookback period of 7-10 days and for the short term trader it my be several weeks or months for the same stock.
Please tell me if I am getting it right
The trend just refers to the direction in which the stock is gaining momentum, based on which you can set up your trades. YOu are right on the look-back period – trend refers to the look back period you are taking into consideration.
Sir ,
Is there notes on VAH ,VAL,POC etc??
Not on Varsity. Will try and cover this sometime soon.
OK Thank u
Cheers!
Sir, Where will i get information about VAH,VAL,POC,IB,WAP ? Is there available in zerodha varsity??
Can you please expand these abbreviations for me, please? Thanks 🙂
Point of Control , Value of area , value of high , value of low
Initial Balance , Weighted Average Percentage
OHLC data is available which is basically the value of high, low etc. Volume is also available. But not the IB.
kk but what does floor price and face value mean and can u plz elaborate no. 4
The floor price is the lowest value of the share price, bidders cannot bid lower than that. Face value is just the notional value.
thankyou brother
Cheers!
karthik ji can u plz answer to my questions
i have read it somewhere in newspaper that
1. priceband=685 to 700 per equity share of face value of rs. 10 each
if price is 685 to 700 then what is face value? whats the difference?
and what does these means:–
2. discount to eligible employees : rs 68 per equity share on offer price
3. floor price is 68 times the face value and the cap price is 70 times the
face value
4. bids can be made for a minimum of 21 equity share and in multiples
of 21 equity share thereafter.
1) Face value is the notional value of the share, whereas the share price is the actual value on a per share basis as assigned by the market
2) Yes, this is the discount for employees
3) Assuming FV as 10, floor is 680 and upper band is 700
4) You have to apply for 21 shares or in mutiples – not numbers like 22, 25, 15 etc..
I have set 20/80 indicator , what does it mean if it between 40 to 60
60 to 80 what does this indicatate???
Inching towards the overbought territory.
Sir , I have confusion that the events of overbuying and overselling had occurred in past hours or periods .How can we take desicion based on event occurred some days ago.as technical analysis shows the past trend.
TA is best when you take action based on what has transpired in the market on an immediate basis barring some theories of Dow and Support/Resistance.
Hi. It\’s been a year at Zerodha for me and in my humble opinion, it\’s all one can ask for in a trading platform and so much more. I recently started experimenting with intraday trading and got mixed results. I have a couple questions regarding the same.
1. In your opinion, what are the best technical indicators for intraday trading?
2. What time frame (i\’ve been working with 5/10 min charts) is the most suitable for such trades?
Thanks!
Glad to hear that, Udit!
1) Bollinger Bands and EMA, are some of my favorites
2) I\’d prefer 9 x 21
How do we use EMA, do you have an article on that yet?
Yup, check the chapter on moving average.
Thanks for the prompt reply. I can\’t seem to find EMA indicator in Kite. Is it present there by some other name?
You will find that under studies.
Udit – You can\’t find it because it is not named EMA. The name in kite under Studies is \”Moving Average\”, once you select that, you can choose the Option as \”Exponential\”, then it becomes EMA! 🙂
The kite platform have only 1,3,5,10,15 minute options. Kindly explain what you mean by \”I’d prefer 9 x 21\”
If you are looking at minute charts then it means – 9 minute versus 21. If its EOD charts, then its 9 days versus 21 days.
\”fewer the days you use to calculate the RSI, the more volatile the indicator would be\”.
What does this mean sir?
Also, since nowadays nifty is pretty rangebound would you suggest using RSI indicator on it? Would 14 days be apt or should I increase the time?
Looking forward for your valuable inputs. ☺️
Whenever you reduce the time frame in technical analysis, the noise component increases, and hence more volatile.
I find simple moving averages more effective in present day circumstance.
Sir, market is not trending nowadays so how can you justify using SMA? You said it works best when market is trending
No, what I ment was that a simple SMA should help in identifying a trending situation. For sideways markets, I also like Bollinger Bands.
Dear sir. Can you clarify my whether RSI value can become exactly 100 if there is any point of loss with in the 14 days.
I think as per the formula RSI could never become exactly 100 unless RS value become infinite and RS value will become infinite only if the average loss is zero and it is possible only when there is no point of loss in look back period ie.14 days. It may be 99.9999 but it could not become 100. Please clarify whether I\’m right or not.
Thanks for your valuable time spending on my comment.
I don\’t remember seeing it at 100 either 🙂
To be more precise:
These are the closing prices for DLF August Future starting from 09:19:00 AM to 09:34 AM.
Since RSi is based on closing price of the period, For the 14 period (1 min chart) RSI should be 82.98
09:19:00 194.8
195.2
195.45
195.55
195.75
195.5
195.5
195.35
195.4
195.5
195.65
195.7
196.1
196.3
09:34:00 196.35
But on the 1 min chart it shows the RSI as 58.69
Like I suggested, first check if the formula works on EOD data. Also, when you are dealing with the minute chart, you are dealing with a lot of noise.
Hi Karthik,
The formula works well on EOD data. I am writing some code which depends on intraday RSI on a 1 min period.
If you can elaborate on how the value is in coming out to be around 58 @09:34-:09:35 AM for DLFAUG17FUT it will be very helpful. The closing price for every minute is as mentioned by me.
What formula is kite app using? why is it not using the formula mentioned above?
Fotgot to mention the date. it is 28th July morning.
Cool, posted a reply to your earlier query.
Kite uses Chartiq as the underlying charting engine. I\’m really not sure about the formula they use. Can you did into Chartiq support doc and look for this, please? Thanks.
I get the following ticks from zerodha through kite connect:
The columns are: Timestamp, LTP, volume
But when I calculate the RSI using the standard formula, I see that the values differ from what shows up in the kite website -> studies ->RSI graph. Can someone please elaborate on how the RSI is calculated using the intraday ticks?
2017-07-28 09:20:14.366 194.9 1030000
2017-07-28 09:20:17.297 194.85 1040000
2017-07-28 09:20:19.607 194.85 1040000
2017-07-28 09:20:20.183 194.85 1040000
2017-07-28 09:20:24.372 195 1055000
2017-07-28 09:20:25.540 195 1055000
2017-07-28 09:20:26.190 195 1070000
2017-07-28 09:20:28.626 195 1085000
2017-07-28 09:20:31.159 195.05 1135000
2017-07-28 09:20:34.225 195.05 1135000
2017-07-28 09:20:36.436 195.05 1135000
2017-07-28 09:20:37.434 195.15 1140000
2017-07-28 09:20:39.281 195.15 1140000
2017-07-28 09:20:40.264 195.15 1140000
2017-07-28 09:20:43.119 195.15 1155000
2017-07-28 09:20:46.216 195.15 1155000
2017-07-28 09:20:49.240 195.15 1160000
2017-07-28 09:20:52.452 195.15 1160000
2017-07-28 09:20:56.403 195.15 1160000
2017-07-28 09:20:58.356 195.2 1180000
2017-07-28 09:21:01.405 195.2 1190000
2017-07-28 09:21:04.158 195.2 1190000
2017-07-28 09:21:07.375 195.15 1205000
2017-07-28 09:21:09.500 195.05 1215000
2017-07-28 09:21:10.403 195.15 1220000
2017-07-28 09:21:12.522 195.2 1225000
2017-07-28 09:21:13.192 195.15 1230000
2017-07-28 09:21:16.239 195.15 1250000
2017-07-28 09:21:19.284 195.1 1255000
2017-07-28 09:21:22.347 195.1 1260000
2017-07-28 09:21:25.195 195.15 1270000
2017-07-28 09:21:27.121 195.15 1270000
2017-07-28 09:21:28.602 195.15 1270000
2017-07-28 09:21:30.266 195 1300000
2017-07-28 09:21:31.440 195 1300000
2017-07-28 09:21:34.287 195.15 1305000
2017-07-28 09:21:37.250 195.2 1310000
2017-07-28 09:21:40.241 195.2 1310000
2017-07-28 09:21:45.603 195.25 1325000
2017-07-28 09:21:50.173 195.3 1330000
2017-07-28 09:21:51.308 195.3 1330000
2017-07-28 09:21:52.452 195.45 1355000
2017-07-28 09:21:54.210 195.45 1355000
2017-07-28 09:21:55.283 195.45 1355000
2017-07-28 09:21:59.306 195.45 1355000
2017-07-28 09:22:00.196 195.45 1355000
2017-07-28 09:22:02.377 195.45 1355000
2017-07-28 09:22:04.493 195.45 1355000
2017-07-28 09:22:05.399 195.55 1375000
2017-07-28 09:22:07.519 195.55 1380000
2017-07-28 09:22:09.213 195.65 1390000
2017-07-28 09:22:10.286 195.65 1390000
2017-07-28 09:22:14.129 195.7 1400000
2017-07-28 09:22:15.205 195.7 1400000
2017-07-28 09:22:17.257 195.7 1400000
2017-07-28 09:22:19.168 195.85 1410000
2017-07-28 09:22:23.382 195.3 1515000
2017-07-28 09:22:25.163 195.3 1515000
2017-07-28 09:22:28.631 195.3 1515000
2017-07-28 09:22:32.256 195.3 1515000
2017-07-28 09:22:35.312 195.05 1525000
2017-07-28 09:22:36.793 195.05 1525000
2017-07-28 09:22:38.631 195.05 1525000
2017-07-28 09:22:41.276 195.45 1600000
2017-07-28 09:22:42.333 195.45 1600000
2017-07-28 09:22:43.152 195.45 1600000
2017-07-28 09:22:44.393 195.45 1600000
2017-07-28 09:22:45.434 195.4 1605000
2017-07-28 09:22:50.243 195.4 1605000
2017-07-28 09:22:52.176 195.4 1605000
2017-07-28 09:22:55.442 195.55 1610000
2017-07-28 09:23:02.249 195.55 1610000
2017-07-28 09:23:04.297 195.55 1610000
2017-07-28 09:23:05.243 195.55 1620000
2017-07-28 09:23:06.397 195.55 1620000
2017-07-28 09:23:07.273 195.55 1620000
2017-07-28 09:23:09.349 195.6 1625000
2017-07-28 09:23:13.179 195.55 1650000
2017-07-28 09:23:14.411 195.55 1650000
2017-07-28 09:23:26.231 195.65 1680000
2017-07-28 09:23:31.406 195.7 1690000
2017-07-28 09:23:32.523 195.7 1690000
2017-07-28 09:23:35.256 195.7 1690000
2017-07-28 09:23:38.878 195.7 1690000
I\’d suggest you validate the formula over EOD data before venturing into intraday.
I want to use comparative Relative Strength Indicator in PI . It shows this but the definition of Comparative RSI is to compare one security with the other security or base security , which is not showing .
Let me check this Sameer.
DEAR SIR,
How one should look at movement of nifty index while evaluating a stock. Say, can we add trend of nifty index to the grand checklist??
Especially during intraday trading??
The over all direction of the market should ideally be in the same direction of the trade. This enhances the probability of success.
Dear sir,
say I have evaluated a stock and most of the points are tallying with checklist and it suggest to go short, but when the market opens next mornig the market trend is upward, then
1. Should I continue with my evaluation , drop the call or change the direction i.e. long instead of short (especially when it is an intraday call), please suggest…..
2. Sir, Can I mail you as I have some doubts( regarding trading only) which I do not want to publish in public, as it may disturb other participants,??
Regards
1) As long as the SL has not breached you execute the trade
2) Request you to post it here only.
hello,
I need to know about super trend indicator? and on what basis period and multiplier value has to be selected for intraday trading and for long term?
We have discussed super trend here – https://zerodha.com/varsity/chapter/supplementary-notes-1/
two questions :
1.) can we take different level for different sahres, for eg for infy we can use range 0-30 and 70-100 whereas for cipla we can use 0-20 and 80-100.
i ask this because if i apply 0-20 and 80-100 on infy then very hardly i can see the RSI getting less than 20 or greater than 80 historically, instead when i use 0-30 and 70-100 there are many instances where the RSI displays oversold by crossing 30 and overbought by crossing 70 historically.
2.)what is the the RSI is continuously between 31-69 (for range 0-30 and 70-100)? does that mean the RSI is not useful then ?
thanks in advance
1) Yes, of course. In fact, its best when done this way.
2) Its usually considered the \’no action\’ zone.
Sir, why to use indicator if we can indentify trend through candelsticks, is indicators only for confirmation?
Yes, thats how I look at it, Ayush. I use indicators as a side confirmation.
Sir, I have some doubts,
1. RSI is just a approximation of future occurance(uptrend or downtrend) based on lookback period, am i right?
2. What lookback period will intraday trader will use?
3. Suppose, If a intraday trader uses lookback period of 14 hours as you have mentioned, will it be helpfull because there will be small changes in price??
4. Do we have to use MA,RSI,MA of volumes and S&R together for best possible result, am i right?
1) Entire TA is an approximation based on historical occurrences
2) I\’d look at last 3 days data but focus more on current day\’s price action
3) Yes, it should
4) Keep it simple, use one indicator (one which you understand best) along with CS pattern and S&R.
Good luck.
Thank you?
If i am using ema of 25 and 50 lookback period then should the value of rsi lookback period be also between 25 &50 or is it independent of ema period?
No, they both are pretty mutually exclusive.
Due to varsity, i am able to know about TA in stock market….
i have que.– what was your thought behind indicator? means, there are plenty but you choose some of here. so we believe these are the best !?
Stick to the basics. I personally don\’t like to depend much on indicators.
Hello sir, first a heartfelt thanks for all the hard work you people have put in, to educate us. I want to know from where can i learn about momentum trading in detail sir. Would be very grateful if you could give us a chapter on momentum trading. Thank you.
Thanks for the kind words, Deepala.
You can apply the same TA principles to trade momentum. In fact, all the patterns I\’ve discussed help you identify momentum and you could use the same to set up trades.
hi,
Looking for an indicator to see the price difference ratio or say spread between two stocks with mean line in between along with 2 standard deviation lines
what I looking for is basically – a price ratio (blue curve) that appears to oscillate around a mean (purple line). And then 1-, 2-, standard deviation lines just to get a feel for how far away from the mean the oscillations might go.
can some one please please code this indicator, I am sure there might be so many other people who are doing pair trading and are trying to find the same kind of indicator but it is not there, so it will help thousands of other zerodha users also
REFERENCES:
http://luminouslogic.com/a-pairs-trading-example.htm
https://www.equityfriend.com/traders-tool/pair-trade-opportunity-and-analysis.html
Regards,
Mukesh
Hi Mukesh, I guess you posted the same query on tradingqna…I\’ve posted a reply there itself – https://tradingqna.com/t/indicator-that-shows-price-difference-price-difference-ratio-between-two-pairs-stocs-for-zerodha-pi-please-help/9620/4
hi, I was looking for StochasticRsi oscillator in pi, where can i find it ?
Its available, please write to [email protected] for queries related to Pi.
Hi sir,
Can we use rsi indicator in individual stocks??
Yes, you can.
Thanks
Plz clear my next query on next chapter15th
Thanks for kind details
How will I know RSI value fixed for a prolonged period?
Thanks
You will have to look for the daily change in value. You will know when RSI is sticking around the same value over few days/weeks.
which indicators is best for intra day and swing trading please guide me i am not able to decide?
Simple Moving averages helps. Give it a try.
Sir how to use esi for intra day trading
ESI? Not sure, Pravesh.
sir what is the difference between RSI and SMOOTH RSI please provide one example please so i can understand easily thanking you
Smooth RSI is something I\’ve not heard off. Will try and research and put my learning notes sometime soon.
Please provide smoothed RSI. It\’s not available in zerodha chart too.
HELLO KARTHIK SIR,
PLEASE SUGGEST ME FEW BOOKS FOR TECHNICAL ANALYSIS AND CAN I AM ABLE TO LEARN TRADING WITH TECHNICAL AT HOME
OR I SHOULD JOIN ANY COURSE.. PLEASE GUIDE ME
I\’d suggest you please read through the contents on Varsity. Its good material that we have here and should be more than sufficient to get you started.
thanks
hello karthik sir
when module 9 and 10 available for us?
Soon hopefully. I have been caught up in few other things and its taking away some time and focus. Will get back on track very soon and complete these modules.
BEST OF LUCK
Hello Karthik,
As mentioned in the tutorial that if the RSI starts moving away from oversold/overbought value from prolonged period of time, look for buying/selling opportunities respectively.
My doubt is what if it continues to stay between the value 30-70 over a prolonged period of time. in both cases, it satisfies the above condition.
Thanks
In RSI we look for values below 30 or above 70. In between period we ignore.
Karthik sir,
Wanted to ask you regarding market indicators.
Is price relative/relative strength tool which compares the underlying security against the merger market average available in most technical Softwares? And why do they range between negative and positive territory
Sorry to disappoint but I\’m Not sure about this \’merger market average\’, I myself have to dig deeper into this topic. If in case you have any material then please do share it with the community here. Thanks.
Hi Karthik,
If the RSI is fixed in an overbought/oversold region for a prolonged period, we need to look for Buying/Selling opportunities. However, can you suggest the definition of prolonged period? Example: The RSI for a stock is in the overbought region for the past 15 days. So can 15 days be considered as a Prolonged period? Bottom-line – How many number of days can be considered as Prolonged Period? If the definition is subjective, what factors of the stock should be considered for evaluating the period?
It certainly is subjective, hence I can only speak for myself. I consider 15-25 days as prolonged period.
Hello Karthik, I need some help with one of the indicators – Stochastic Momentum Index, listed in KITE. That indicator works for me very well. I want to use it for 4 Hr time frame to confirm the trend, unfortunately 4Hr timeframe is not there in the KITE. So, is it possible to let me know which parameters are to be used to model that formula in AMIBROKER, please? I would really appreciate and thank you
I\’ve not used Amibroker much, so cannot comment. But why don\’t you try this in Pi?
Hello Karthik: What is the formula used for calculating Stochastic Momentum Index in Pi? The one I tried in Excel does not match for simple average smoothing. Could you please guide?
I\’m not sure, Sebastine. It is a 3rd party charting engine and the formulas are hard coded.
Can you please tell me how to find an undervalued and overvalued companies stock.
A simple 2 stage DCF will help you identify this from a fundamental perspective. You can also use indicators such as RSI and MACD to get a technical perspective (for short term trading).
Hi, somewhere you mentioned the name of a particular book which can help us i forgot the name of the book and author.
Not Sure which book you are referring to 🙂
Karthik the book that you have written about is it intelligent investor or ultimate investor and please help me with the name of the author aswell.
It could be Intelligent Investor, have not read the Ultimate Investor 🙂
Hello Karthik sir,
Am not able to see any charts/screenshots uploaded by the readers in comment section. I tried a couple of browsers but still the problem remains. Please suggest…
I guess in one of the recent updates, the media images got a little mixed up. Let me see what best can be done. Thanks.
Hi Karthik,
Here are two charts of nifty spot both are 30 min. But why there are difference in RSI value
of both charts at SAME time. In GF charts it showing 91 and kite showing around 70.
Sorry Karthik not able to attach chart file , This is on 27/06/2016, time 1 pm
No problem.
This is because of the ticks – not all of them are captured at the same time. There is a detailed explanation for this on tradingqna, trying to dig it up for you. Will repost the link soon.
Sir can u please suggest some syrategy for intraday commodity.? Which indicator is best suited for this suggest with a lookback period ?? And how much time grame chart is most benefecial to make profit?? Pls guide as i m new in trading
These are generic questions Anurag, difficult to give you an exact answer. Also, please note there is no 1 good answer for this…you will have to experiment and arrive at what really works for you.
What is logic behind interpretation of RSI?
Have explained that in the chapter Hitesh.
Karthik my target is to earn 2-3% on weekly basis. Please suggest me a strategy.
My TA always goes wrong. 🙁
Thanks in advance. 🙂
2-3 % a week is about 10% a month or 120% a year!! Not possible my friend. Please read section 1.3 here – http://zerodha.com/varsity/chapter/background/
What is the relevance of vix,open interest in options and how can we understand the positions of fii\’s in option whether they are long or short….generally we call them fii\’s but how many institutions registered under fii\’s tag do they take separate views and trade or any kind of understanding between them?
Theoretically option price derived from equities but nowadays due to high volumes in Fno and huge time and monetary implications equities price is derived by the options price esp.shorting data,is it correct?
Suggest you read through chapters 15 to 20 in options module, its completely dedicated to understanding Volatility. It is very difficult to estimate FIIs are long or short in the market as they usually do arbitrage trade (which requires them to be both long and short at the same time). There are many FIIs registered in India, I guess SEBI has the entire list put up on their website.
Also remember, spot dictates the derivative market and not the other way round.
what type of skills required to be a trader and how to know i become a good trader?
Patience, attention to details, discipline, and a constant quest to learn and improvise.
there is any difference b/w out technical analysis and united states?
exchanges issue daily highest gainers & losers .
can this data be used as an indicator of some sort ? if yes , how ?
for example , is it good strategy to long on stocks that gained the most the previous ( expectation being being uptrend will continue ) & similar for the stocks that lost the most the previous day ?
or should be do completed opposite expecting a retracement or a correction ?
It would be difficult to judge the strategy without validating it. Hence the best way to validate this would be to backtest the thesis. Download the daily closing data and run a query to fish out highest gainers/losers and check how they performed the following day.
which is the best indicator / combination of indicator
1) for pure intraday trading ?
2) for short term (1 or 2 week ) holding ?
3) for medium term ( 1 month to 1 year ) holding ?
4) for long-term more than 1 year ( fundamental will be best for this , i assume ) but any technical indicator to re-affirm our selection ?
Clearly mapping indicator to a given time frame is quite a challenge. But if you insist – for intraday something like a stochastic/MACD should help. For longer periods I would suggest you use moving averages.
Sir,
Which indicator according to you is better between EMA crossover and Bollinger bands
EMA is momentum and BB is volatility based, cant compare both.
Dear Sir,
What is the difference between volatility and momentum?
Very loosely put, Volatility is the daily movement of the scrips. Momentum is the rate of change of stock\’s return. If the stock is trending high meaning it makes higher high, then its said to have a positive momentum. If it makes lower low on a daily basis, then its said to have a -ve momentum.
Sir,
If we have two scenario, pls suggest which one should we prefer for buying the stock
scenario 1- Stochastic/RSI both are around 25 and then one bullish candle like marbouzo/hammer/bullish engulfing
scenario 2- Stochastic/RSI bot are about 50 but EMA crossover of 3 days is above 8 days and it is going upwards which suggests positive trend
Scenario 1 seems like a better setup.
Sir,
Could you pls let me know which indicator is better to look between RSI and stochastic
Both are used under different circumstances..so cant really compare.
dear kartik sir,
u have mentioned about the rsi in 0-20 and 80-100 as oversold and overbought regions resp.but what abt the rsi that is in a prolonged period of say in the range of 40-60.how to read these stocks.
As per RSI, such stocks do not really head anywhere. So its best to look for candlestick patterns.
Dear Karthik,
I am posting here a chart of nifty ,In that there are two lines in RSI indicator.
Of which, one is RSI14 but other line I don\’t understand. Please guide. & can we add it in
chart on our Pi and how ?.
Regards.
Haridas.
RSI(C,14,S,9) indicates a RSI plotted on 14 day closing prices (C). S,9 indicates that a simple 9 day moving average is being plotted on the 14 day RSI. For queries related to Pi, I would suggest you get in touch with Srini – [email protected] .
Thanks Karthik
Have a good day!
i cannot expand indicators row.(RSI MACD ETC.). earlier it was possible so that i could draw trendlines. now it is a problem.please clarify
Expand where? as in which software?
earlier i was able to expand RSI, MACD rows in intraday chart available in nest chart. now i cannot do it.now it is too small row almost impossible to draw lines on them. i can draw lines on chart but not on rows as mentioned.
Ashok, this seems to be a software issue, can you please contact your broker regarding this? If you are with Zerodha then you can call +91 80 40402020 and get this sorted. Thanks.
\”If the RSI is fixed in an overbought region for a prolonged period, look for buying opportunities instead of shorting\”
How long exactly will be that prolonged period if I am using a 14 day RSI(like 4 days, 5 days or more than a week)?
There are times when the RSI is stuck in a range for over 3-4 weeks. This according to me is a prolonged period.
Dear sir,
Can you please advice techniques which are useful for Indtraday.
Please start by buying 1 or stocks and holding it till close…also to begin with don\’t get into multiple buys and sells in the same day.
In the evaluation process i read as— if s and r is more than 4 percent away from stop loss, stop evaluating in the chart. this i am unable to understand. kindly brief me.
Meaning if the stock price is at 100 and the support for the stock is at 96 or more then it maybe touch to trade the stock as the placement of SL (based on support) will be quite far.
Hi Karthick,
What percentage is good for support & resistance based stop loss?
Thanks in advance.
There is no % as such, the support itself acts as a SL.
Hi Karthik,
Where can we find the historical quarterly earnings of a company and can the stock price vs earnings be plotted on PI. Or is there any other place where I can find the same data?
Generally speaking: Where can I find old data related to fundamentals?
There are few sites that give out this information, try – Morningstar India, Moneycontrol, screener.in, economic times website etc. As far as I know you cannot plot the stockprice vs earnings on any software. However google finance has a nice feature which marks all the important dates (along with a quick 1 line explanation) on the the chart, suggest you give it a try.
i want to know about fixing the for long or short , using resistance and support.
The same have been explained in detail here – http://zerodha.com/varsity/chapter/support-resistance/
I WANT TO KNOW ABOUT DIVERGENCE . CAN YOU PLS EXPLAIN THE CHART . THEORETICALLY PERFECT DIVERGENCE HAPPENED . AS I AM NOT ABEL TO UP LOAD THE CHART , PRESENT SITUATION IN NIFTY DAILY . WITH RSI INDICATOR .
Sure, I will write about divergence sometime soon. Thanks.
Hey,
Material is quite lucid.. Thanks a lot for such an effort for Investor Education… I would like you to put up some explanation on Divergences in RSI and how to use them as trading opportunity… It will be really good and great opportunity one can get if we identify the divergence right… I am attaching one chart of current correction which if userd along with Trendline provided good shorting opportunity in Nifty.. See the impact of divergence…
Thanks. I understand lot of people like using divergence techniques. Will probably include this in the subsequent sections.
Can u plz add diversion in current topic or RSI
Thanks for the suggestion Pavaneet, will look into this.
+1 for Coverage on Divergence
i feel indicator + stock pattern together will show future direction better
Yes, thats the reason why I also have indicators on the check list 🙂
Hi Karthik,
Could you have a look at the TVS Motors charts especially the last 5-6 trading sessions. The stock is trading near its all time high, which was 266.7 achieved a couple of trading sessions ago and so a sort of resistance exists around these levels, there is a dark cloud formation if we look at the last two trading sessions,looks like there is a double top pattern formation in place, the selling on Friday is not accompanied by increasing volumes(I believe it was profit booking before the weekend/expiry with doubts on NIfty\’s movements) , indicators (RSI,MACD) doesn\’t say much other than showing good strength. How do we approach this scenario, given that there is a possibility of making a new high accompanied with a breakout or a possible move towards the downside?
Almost all the things you have mentioned is true –
1) Double top formation
2) Resistance
3) Dark Cloud formation
4) Low Volumes
Except for the volumes part, the stock is suggesting a short trade (it click most of the checklist items). I would be happy to short and be quick to book profits as well. The only reason I\’d be quick to book profits is the absence of impressive volumes.
Thank you Karthik, for the validation. I have another question for you. Could you have a look into the charts of Small Cap\’s like Aimco Pesticides, Waterbase, Freshtrop fruits etc. Here a peak was formed where volumes where high at those levels and over a period of time the volumes are decreasing and the chart shows a fall which is flat like a consolidation. Could you tell us what stage is the stock in (ie, accumulation, distribution or other)?
Kirthan ,thanks for presenting brilliant question.I am also waiting for some experts reply.
Lets go the materials in versity, only then I can comment.222
Sorry, dint quite get that Subhadeep. Can you kindly elaborate?
Hi Karthik,
Can you please throw some more light on the look back period?
Lookback period is simply the number of days data you wish to include in your calculation. For example a standard RSI indicator has a 14 day lookback period. You could change it to 21 if you wish.
A 5 day SMA has a 5 day look back period…so on and so forth.
Sir,
Please let me know good Technical analysis software in which i can draw all the things that u have mentioned in your Techinal Analysis module
Hi Raman,
You can use amibroker which is a paid one. The price ranges between 18000 to 25000 depending on the edition you want.
If you want to have a free software, you can use Fibotrader. Obviously the paid one is more user friendly than the free softwares. I don\’t have any idea on our upcoming software \’PI\’. So even i request Karthik sir to comment on this. Hope it helps.. 🙂
Here is a sneak peak into Pi. It is in beta stage, there are close to about 1000 people using it. Hopefully the finial release should be around the corner.
The same is discussed here in this chapter Raman.
Nitin, I was looking at Infy charts after Friday (7.11.14) closing. The stock hit 52 wk as well as all time high on 7th November. The last six candles on daily chart showed gap up opening and higher closing. Bollinger band suggests envelope expansion indicating trending stock. I think that they are indicators of strong bullishness in the stock. However, I also found that the RSI is near 76 and MACD is higher than signal. These indicate bearishness. I could not find any definite single or multiple candlestick pattern to trade. How should one interprete such chart for position trade?
Rule of thumb – when in doubt, avoid 🙂
Also, I would wait for Infosys to retrace a bit especially with low volumes to go long.
Hello karthik,
What is it with volumes? Quite new to trading.
Here is a chapter dedicated to Volumes – http://zerodha.com/varsity/chapter/volumes/
Dear sir,
You use a term \”retracement\” frequently, like volume retracement, price retracement. I did not get it, could you please explain it in trading context.
Regards
If a stock moves from 75 to 100 – then this leg is called the upmove. Invariably, stocks make a strong upmove, give up little gains – maybe drop from 100 to 90 and then move up again…to say 120. This drop from 100 to 90 is referred to as retracement.
what is the rsi period for intraday trades
You can use the default parameters (14 and 21) and check if they match your risk appetite. Do note, when you use RSI on intraday charts, the default parameters change to match intraday frequency….meaning 14 & 21 would be 14 mins and 21 mins…and not 14 and 21 days.
sir charts dont get updated automatically we have to keep pressing the refresh button
Gets updated automatically on Kite.
IS IT NECESSARY VOLUME SHOULD BE LOW OR WHAT IS LOGIC OF BEING VOLUME LOW?
Volume should be higher than the 10-day average. Have explained in the volume chapter.