
The topic of Fibonacci retracements is quite intriguing. To fully understand and appreciate the concept of Fibonacci retracements, one must understand the Fibonacci series. The origins of the Fibonacci series can be traced back to the ancient Indian mathematic scripts, with some claims dating back to 200 BC. However, in the 12th century, Leonardo Pisano Bogollo, an Italian mathematician from Pisa, known to his friends as Fibonacci discovered Fibonacci numbers.
The Fibonacci series is a sequence of numbers starting from zero arranged so that the value of any number in the series is the sum of the previous two numbers.
The Fibonacci sequence is as follows:
0 , 1, 1, 2, 3, 5, 8, 13, 21, 34, 55, 89, 144, 233, 377, 610…
Notice the following:
233 = 144 + 89
144 = 89 + 55
89 = 55 +34
Needless to say, the series extends to infinity. There are few interesting properties of the Fibonacci series.
Divide any number in the series by the previous number; the ratio is always approximately 1.618.
For example:
610/377 = 1.618
377/233 = 1.618
233/144 = 1.618
The ratio of 1.618 is considered as the Golden Ratio, also referred to as the Phi. Fibonacci numbers have their connection to nature. The ratio can be found in the human face, flower petals, animal bodies, fruits, vegetables, rock formation, galaxy formations etc. Of course, let us not get into this discussion as we would be digressing from the main topic. For those interested, I would suggest you search on the internet for golden ratio examples, and you will be pleasantly surprised. Further into the ratio properties, one can find remarkable consistency when a number is in the Fibonacci series is divided by its immediate succeeding number.
For example:
89/144 = 0.618
144/233 = 0.618
377/610 = 0.618
At this stage, do bear in mind that 0.618, when expressed in percentage is 61.8%.
Similar consistency can be found when any number in the Fibonacci series is divided by a number two places higher.
For example:
13/34 = 0.382
21/55 = 0.382
34/89 = 0.382
0.382, when expressed in percentage terms, is 38.2%
Also, consistency is when a number in the Fibonacci series is divided by a number 3 place higher.
For example:
13/55 = 0.236
21/89 = 0.236
34/144 = 0.236
55/233 = 0.236
0.236, when expressed in percentage terms, is 23.6%.
16.1 – Relevance to stocks markets
It is believed that the Fibonacci ratios, i.e. 61.8%, 38.2%, and 23.6%, finds its application in stock charts. Fibonacci analysis can be applied when there is a noticeable up-move or down-move in prices. Whenever the stock moves either upwards or downwards sharply, it usually tends to retrace back before its next move. For example, if the stock has run up from Rs.50 to Rs.100, it is likely to retrace back to probably Rs.70 before moving Rs.120.
‘The retracement level forecast’ is a technique that can identify upto which level retracement can happen. These retracement levels provide a good opportunity for the traders to enter new positions in the trend direction. The Fibonacci ratios, i.e. 61.8%, 38.2%, and 23.6%, help the trader identify the retracement’s possible extent. The trader can use these levels to position himself for trade.
Have a look at the chart below:
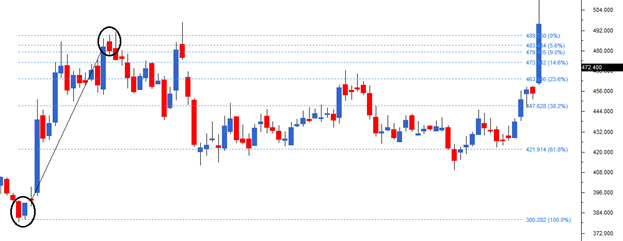
I’ve encircled two points on the chart, at Rs.380 where the stock started its rally and at Rs.489, where the stock prices peaked.
I would now define the move of 109 (380 – 489) as the Fibonacci upmove. As per the Fibonacci retracement theory, after the upmove one can anticipate a correction in the stock to last up to the Fibonacci ratios. For example, the first level up to which the stock can correct could be 23.6%. If this stock continues to correct further, the trader can watch out for the 38.2% and 61.8% levels.
Notice in the example shown below, the stock had retraced up to 61.8%, which coincides with 421.9, before it resumed the rally.
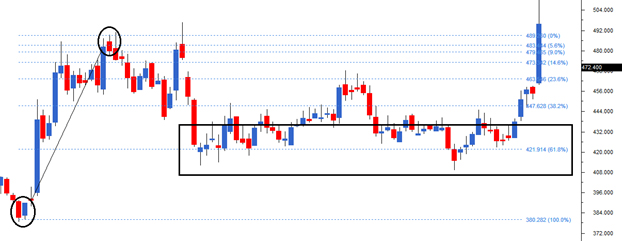
We can arrive at 421 by using simple math as well –
Total Fibonacci up move = 109
61.8% of Fibonacci up move = 61.8% * 109 = 67.36
Retracement @ 61.8% = 489- 67.36 = 421.6
Likewise, we can calculate for 38.2% and the other ratios. However one need not manually do this as the software will do this for us.
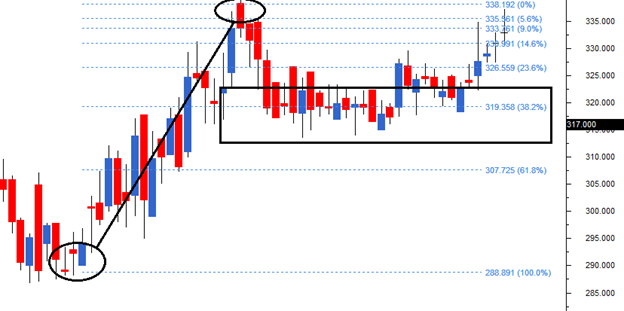
Here is another example where the chart has rallied from Rs.288 to Rs.338. Therefore 50 points move makes up for the Fibonacci upmove. The stock retraced back 38.2% to Rs.319 before resuming its up move.
The Fibonacci retracements can also be applied to falling stocks to identify levels upto which the stock can bounce back. In the chart below (DLF Limited), the stock started to decline from Rs.187 to Rs. 120.6 thus making 67 points as the Fibonacci down move.
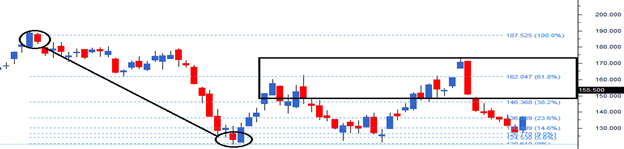
After the down move, the stock attempted to bounce back retracing back to Rs.162, which is the 61.8% Fibonacci retracement level.
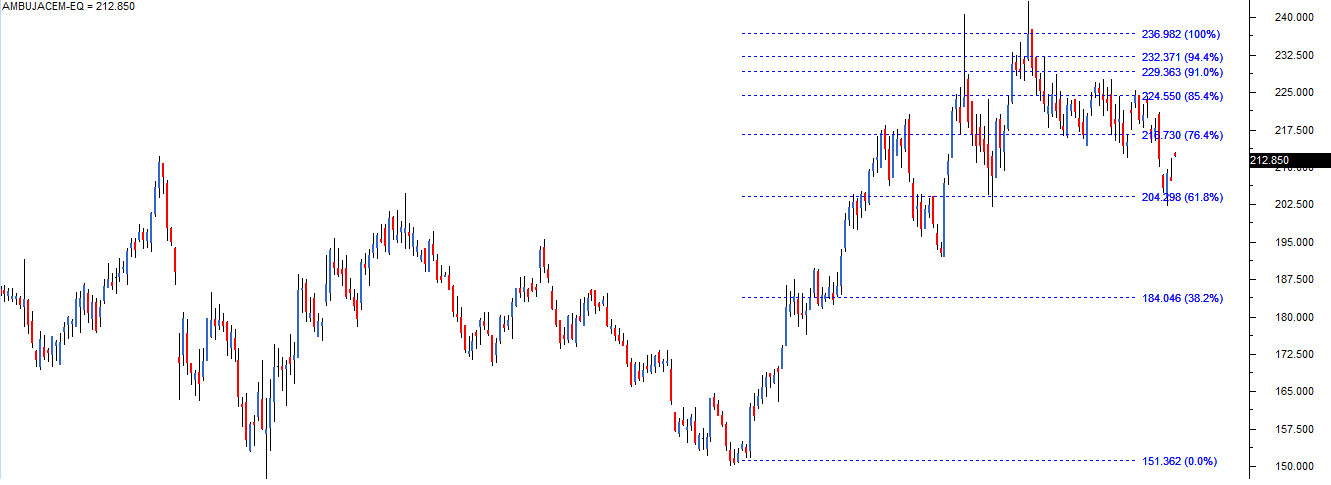
16.2 – Fibonacci Retracement construction
As we now know, Fibonacci retracements are movements in the chart that go against the trend. To use the Fibonacci retracements, we should first identify the 100% Fibonacci move. The 100% move can be an upward rally or a downward rally. To mark the 100% move, we need to pick the most recent peak and trough on the chart. Once this is identified, we connect them using a Fibonacci retracement tool. This is available in most of the technical analysis software packages including Zerodha’s Pi 🙂
Here is a step by step guide:
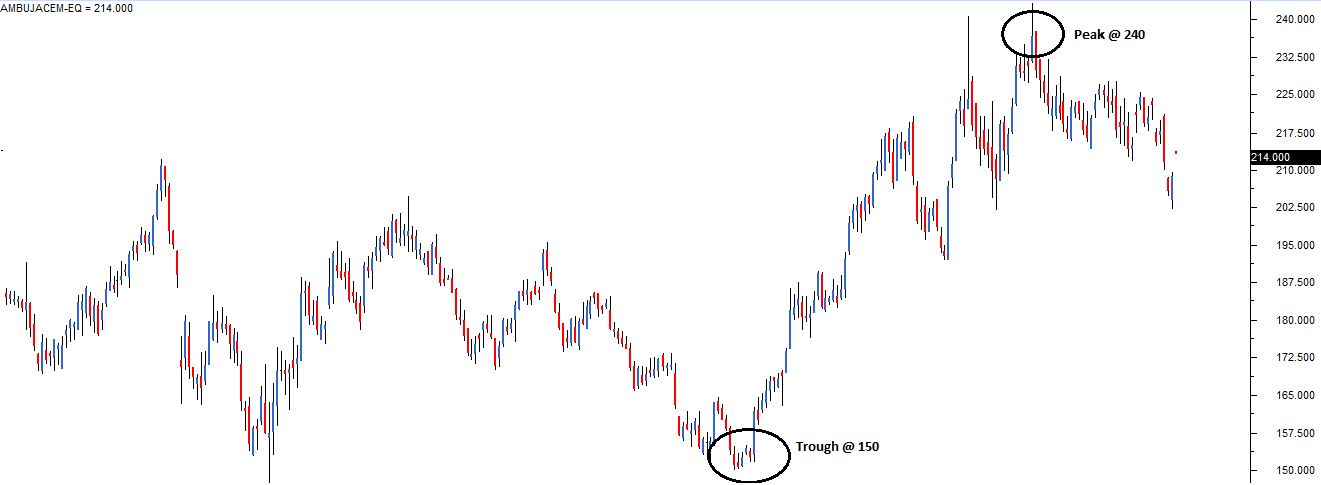
Step 1) Identify immediate peak and trough. In this case, the trough is at 150, and the peak is at 240. The 90 point moves make it 100%.
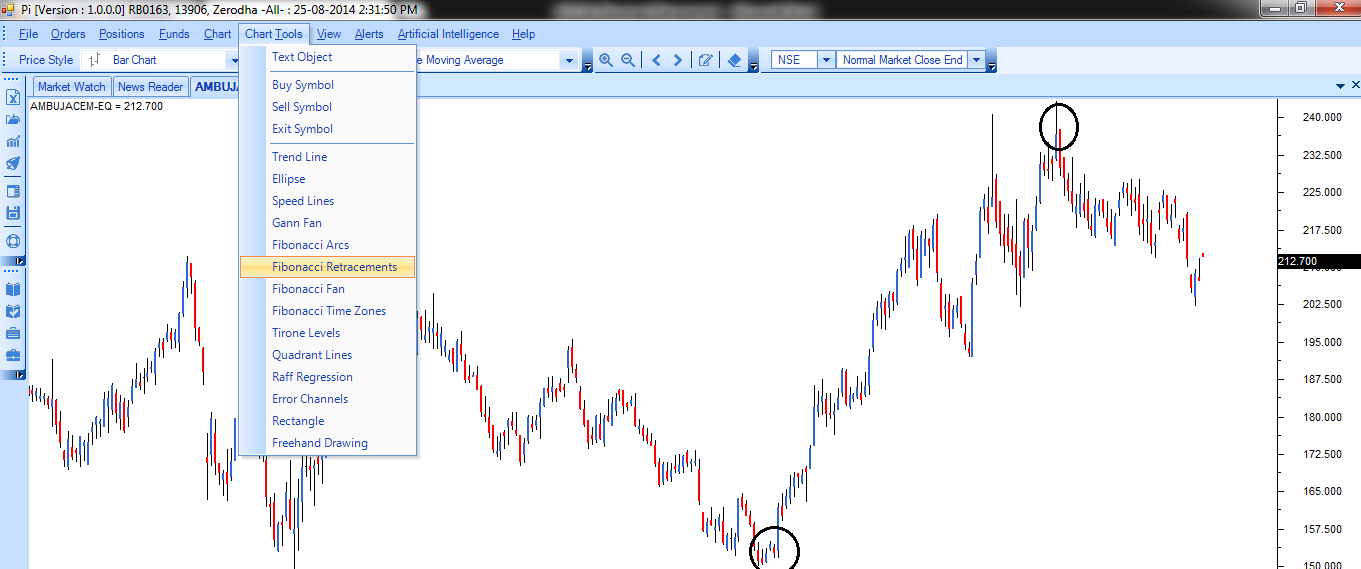
Step 2) Select the Fibonacci retracement tool from the chart tools
Step 3) Use the Fibonacci retracement tool to connect the trough and the peak.
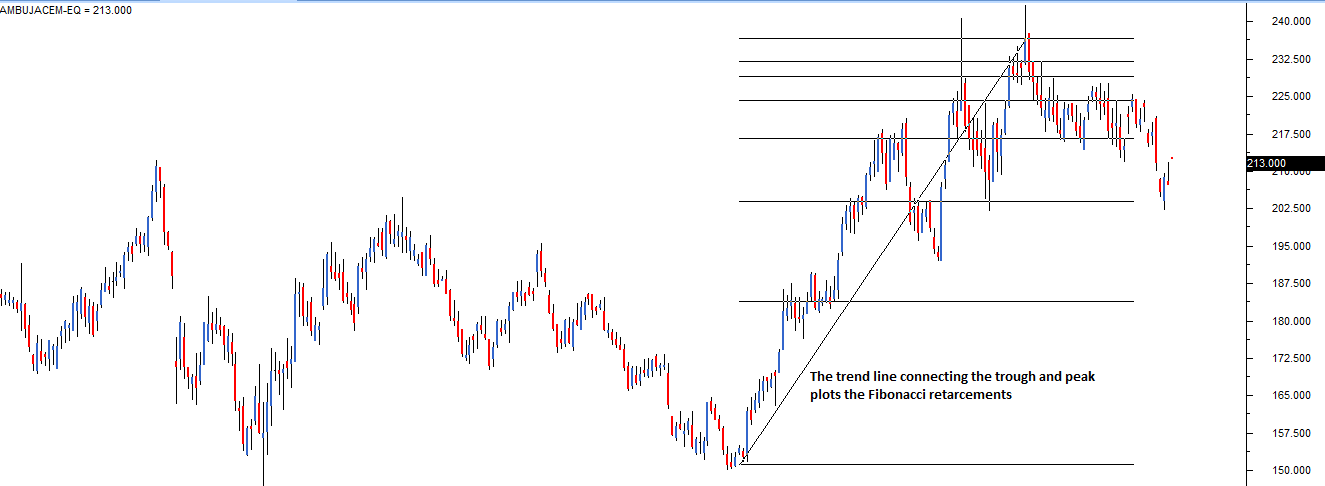
After selecting the Fibonacci retracement tool from the charts tool, the trader has to click on trough first, and without un-clicking, he has to drag the line till the peak. While doing this, simultaneously, the Fibonacci retracements levels start getting plotted on the chart. However, the software completes the retracement identification process only after selecting both the trough and the peak. This is how the chart looks after selecting both points.
You can now see the Fibonacci retracement levels are calculated and loaded on the chart. Use this information to position yourself in the market.
16.3 – How should you use the Fibonacci retracement levels?
Think of a situation where you wanted to buy a particular stock, but you have not been able to do so because of a sharp run-up in the stock. The most prudent action to take would be to wait for a retracement in the stock in such a situation. Fibonacci retracement levels such as 61.8%, 38.2%, and 23.6% act as a potential level upto which a stock can correct.
By plotting the Fibonacci retracement levels, the trader can identify these retracement levels, and therefore position himself for an opportunity to enter the trade. However please note like any indicator, use the Fibonacci retracement as a confirmation tool.
I would buy a stock only after it has passed the other checklist items. In other words, my conviction to buy would be higher if the stock has:
- Formed a recognizable candlestick pattern
- The stoploss coincides with the S&R level.
- Volumes are above average.
Along with the above points, if the stoploss also coincides with the Fibonacci level, I know the trade setup is well aligned to all the variables, and hence I would go in for a strong buy. The word ‘strong’ usage indicates the level of conviction in the trade set up. The more confirming factors we use to study the trend and reversal, more robust is the signal. The same logic can also be applied for the short trade.
Key takeaways from this chapter
- The Fibonacci series forms the basis for Fibonacci retracement
- A Fibonacci series has many mathematical properties. These mathematical properties are prevalent in many aspects of nature.
- Traders believe the Fibonacci series has its application in stock charts as it identified potential retracement levels.
- Fibonacci retracements are levels (61.8%, 38.2%, and 23.6% ) upto which a stock can retrace before it resumes the original directional move.
- At the Fibonacci retracement level, the trader can look at initiating a new trade. However, before initiating the trade, other points in the checklist should also confirm.
Hello,
Along with Fibonacci which other indicator can use for trend confirmation and how?
My personal preference is the classic moving average 🙂
Team,
Can you help share what are the values for fib retracement and fib extension along with the time frame best used.
You can use EOD chart to begin with, that should help.
Hi Karthik,
For your last chart- Your 0% should be at the top and 100% should be at the bottom right? As this is an upward rally and our assumption is that stock is going to retrace until x%(23, 38, 61 or 100%)?
Is it fair to say- For upward rally-(0% should be at the top and 100% Bottom) and for downward rally, it should be vice-versa.
Yeah, for upward rally a 100% retracement is back to where the rally started, which is at the bottom.
Aah, Perfect- This explanation makes more sense. Thank you
Sure, happy learning 🙂
Hi Karthik,
Thank you for taking out time to publish the content for free. I really appreciate the time & effort that you have put behind this. I have just started out in this world and currently I am on Module 2(TA)-Chapter 16. Shall I complete all the modules first before diving into trading/investing? What should be the approach here? Please advise
Regards,
Rohan
Thanks for the kind words, Rohan.
If trading is what you have in mind, then you can build this slowly. Start with Module 1, 2 and start evaluating. If you are inclined towards F&O, then do check out the module on Futures and options as well. This should be a good start.
Hello karthik sir, I want to check Fibonacci retractment but zerodha have discontinued pi software as it was handled by third party. So how to check above indicator now?
Why not try it on Kite?
Not able to find fibo indicator
Do call the support center for this, Aniket.
Hello karthik sir,
Sir is it possible to use this indicator for intraday trading for accurate confirmation or should i use this for only for few days or weeks. And also, what should be the ideal timeframe for the candles if im using the indicator on intraday and swing trading?
By the way sir love the way you have curated the modules which is easy to understand even for a begineer like me.
Thanks for the kind words Nikhil. Glad you found the modules useful.
I personally prefer to use these indicators on an EOD basis.
I want to appreciate in that your illustration it teaches me yo draw the fibonacci retracement and l know to follow the trend and to understand the price action of the chart.
Sorry, can you please elaborate on this?
I am unable to see this indicator in Zerodha. please help.
I\’d suggest you call the support desk for this, they will help you with this.
How much will the stock go up once it bounces from particular level? It would go up to resistance.
Correct me if I am wrong
That no one really knows, but yes, the expectation is that it will go back to recover all the way till resistance.
Sir my Question is, How do we know whether the price reverse in 61.8 or 38.2
Ah, that nobody can say, we can only draw inferences, thats it 🙂
sir,how can i identify whether it is a 100% fibbonaci move? And for what time in each time frame it must see a sharp trend?
Its not possible Prashant, its all based on your observation and reading of the markets. The indicator only gives you hint, but there is no guarantee.
fibonacci indicator is not available on zerodha, what to do?
Have you checked the ChartIQ version? Else, please call the support desk, they will help you with it.
hello kartik sir , sir but when the stock prices come back to the Fibonacci retracement levels how do we know whether the prices are gonna go up or down ,
That no one will know, Aditya. Your guess is as good as mine. But the indicator suggests that there is a chance of reversal from these levels.
Hey Kartik,
What should be the 3 targets, after stock is retraced back to 23.6%.
Based on the immediate resistance will work.
Okay, thnx alot
Happy learning!
sir please help me understand what should be the S&R for intraday trading and swing trading. I specifically want to know what should be the timeframe for these tradings and how many previous candles I want to consider?
You can look at 15 mins or even 30 mins candle for plotting intraday S&R. The minimum look back period for this should be 15 days.
Hi karthik,
In one of your comments you suggested to read all the modules first then start trading
but can start with paper trading now. I have reached reading till here.
Can you please suggest how do i start doing paper trading?
Harshit, paper trading is just about identifying a real trade with real SL, target, position sizing, etc., but not actually taking a trade but only tracking it virtually. This way, you will know if your thinking is right about a trade.
1. What is the importance of the 61.8 % ratio in an uptrend?
2.What is the importance of the 61.8 % ration in a downtrend?
3.What is the importance of the 38.2 % ratio in an uptrend?
4. What is the importance of the 38.2 % ration in a downtrend?
5. What is the relation between.618 and 1.618?
6. What is the relation between.886 and 1.13?
7. What is the relationship between.786 and 1.272?
All these numbers stems from the theory backing the retracement theories 🙂
Unable to see the Fibonacci tool on Kite
It is on the Draw/pen tool
Hello kartik sir how I can find kite app ? Pls help
Look for Zerodha Kite on play store or the app store 🙂
Can u explain the significance of fib ext and how the price reaches 1.618level after making a swing high and swing low and when we connect those points with fib ext in future the price is extending towards 1.618 level can you tell me why
We explain this and more in Varsity Live. Please do consider joining the session, its free anyway – https://varsitylive.zerodha.com/programmes/f4747acb-e1f7-458a-94bb-1a154d256795
Hii Karthik!
While studying the chapter, I noticed that in most Fibonacci Retracement images, the 0% level is positioned at the top. However, there are a few instances where 100% is at the top. Additionally, the Construction section states that the top should be marked as 100%.
From my Observation:
– When drawing a retracement from Low to High on the graph, the 0% level appears at the top.
– When drawing a retracement from High to Low on the graph, the 100% level appears at the top.
Does this mean:
1. If a stock is in an uptrend and we want to determine the levels it might retrace to before resuming its upward movement, we should draw the retracement from Low to High, placing 0% at the top.
2. If a stock is in a downtrend and we want to identify potential pullback levels before it continues downward, we should draw the retracement from High to Low, placing 100% at the top.
Additionally, can we consider these Fibonacci retracement levels as potential support or resistance zones, depending on the trend of the stock?
Thank you in advance.
So if a stock is in an uptrend and then it starts to decline, then our objective is to find out (via fib retracement) to what extent it can retrace. So the top will be 0% and 100% and the bottom. Exact opposite when the stock is in a downtrend.
Btw, you can check this – https://varsitylive.zerodha.com/programmes/f4747acb-e1f7-458a-94bb-1a154d256795 we run a live demo of this during class.
I am unable to find fibonacci extension to ol in kite, with which name I have search in kite?
Please call the support desk, they will help you with it.
The problem is where to identify and plot the fibonacci diagram when there are many peaks and troughs. You said \”immediate peak and trough\”, but how to identify that whether we are choosing the right peak and trough ?
Yup, in a typical chart there are many peaks and troughs. However, what you can do is look at only the recent one. The older ones wont matter anyway.
as the trough is 150 and the peak is 240 how a 90 points is 100 % ?
From the peak of 240, if the stock declines to 150, then it is a 100% decline.
For fobbonacci retrace ment which time frame should be used please guide me
You can use any timeframe that you are comfortable with. My personal preference is EOD.
Due to my personal experience of huge losses just following Fibonacci only, I would say that Fibonacci indicator is only useful up to a certain levels,like 38% 61% 161% and upto 261% level . And if you trying think more deeper about it, no-one worst as worst as Fibonacci. I would say that the Fibonacci trader is always confused and desperate to make a confirmed decision. In my opinion, it is better to make trading decisions by predicting moving average and RSI indicator along with Fibonacci indicator.
Sure, thanks for sharing your perspective.
This article is outdated. As per https://support.zerodha.com/category/trading-and-markets/corporate-actions/general/articles/where-can-i-download-pi Zerodha has discontinued Pi and no longer provides support for it.
In Kite i can\’t find any indicator for fibonacci .
Where can i find it ?
The indicator remains the same, Asha. No change in that 🙂
Hey Karthik!
What if the retracement breaks down? i.e. what should be the strategy after it breaks the 61.8 ratio too? what to expect after this point?
You should position your trade in such a way that you are prepared to deal with a situation where there is a break. No pattern or indicator gives your guarantee, they are all just odds. Some odds are better than others.
I think it was posted in 2014 but am reading it in 2024. Someone will also read it in 2140. If the world still exists .
I hope so too!
I must commend the team behind Zerodha Varsity for their exceptional work in imparting invaluable knowledge on stock market fundamentals, technical analysis, and broader financial concepts. The effort and dedication put into creating such a comprehensive learning platform are truly commendable.
As someone who spends significant time studying indoors, I find myself constantly engaging with your content. However, I believe incorporating a dark mode feature would significantly enhance the user experience. A darker interface not only reduces eye strain but also aligns with the preferences of many users who work in low-light environments.
I look forward to seeing how Zerodha Varsity continues to innovate and cater to the needs of its users. Keep up the great work!
Thanks so much for the kind words, Erik. Your feedback on dark mode is noted. I\’ll share this with the team.
Isn\’t the 4th pic in Fibonacci Retracement construction section wrong. As per my understanding if there is an uptrend move, the levels should from the bottom of the uptrend with 100% and move till the top to 0%
Hmm, open for interpretation. There is no perfect way of doing this 🙂
I think all methods are unable to predict 100% . But all the methods work upto a certain limit.
Only experience gives good result
That is perfectly correct 🙂
nice
hey hii all can any one tell me there is a setting in fibonachi retracement of reverse for what purpose that option are there????
you can aslo check on trading view by draw fibonachi tool then click on seeting icon then click on STYLE tab scroll down then the option will appear……
Its for figuring shorting opportunities, Devansh.
http://zerodha.com/varsity/wp-content/uploads/2014/10/M2Ch16-chart6.jpg
In this image here, I agree with the circle you have placed on the peak, but I find the positioning of the trough slightly confusing. Why haven\’t we considered the local minimum at 202.5 as the trough. What is the correct selection criteria for peaks and troughs.
I believe this depends on the trader. If you are an intraday trader, you see last few sessions\’ or last few days\’ data. Whereas if you are a swing trader, you would look back at a greater amount of time in the past.
I prefer to see the data for last few days, Eshaan and prefer to pick the trough which is the lowest within my viewing period.
good reading and info
Thanks. Happy learning!
Hello Sir! I want to clarify something if my current trend is at highest price and I am planning to buy stock then which level should I wait for the current price to fall?
Ah, this really depends on the stock price and the trend in the stock price. One answer wont fit all situations.
Hi , Karthik in kite if i select through first it shows 100% so i have to select peak first then drag it to through in uptrend so that peak will be in 100%
Thats right, basically you have to connect the peak and trough in the direction of the stock movement.
The level from where it has been retraced till 23.6 it would be the next target if share bounce back towards original direction after retracement is my interpretation is correct regarding target
What should be the stop loss sir in this case?
Lets say the staock cracks from 100 to 76, now you expect the stock to go back to 100, so one thing that you can do is keep, 76 as a your initial SL and keep trailing it as and when the stocks inches towards 100.
Hello Karthik Sir,
I have a question for you, let\’s say the particular stock retraced by 23.6% and we are lucky enough to identify it at the right time and accumulate it.
What should be my price target in this particular trade for exit? And What should be my stop loss?
Could you please answer this? I will be looking forward for your reply.
Thank you and Wish you a very happy new year🎊
One easy set up is that the min target could be the price from which it retracted with the 23.6% retracement price point as your SL.
Hi how to we plot the next retracement in case the peak breaks.
By using a trend line, Mahesh.
0.5 is also an important Fibonacci level.
Correct me if I am wrong.
Yes, since its 50% retracement.
What period should be selected on x-axis – day or moths or 3 months
You could look at maybe 6 months data as a starting point.
sir..
1) Fibonacci retracements previous trend on applied otherwise going on trend apply ?
2) Going on trend in how to find peak point? through resistance?
3) trough meaning?
4) AND sir i am new in market learn through varsity…now i want to pratcies all i leant …suggest any paper trading app/website to apply TA
1) Not sure about this query, can you share more context?
2) The point at which the price changes direction marks your peak and trough
3) The end point of the crash
4) YOu can look at markets and track any 2-3 stocks of your linking and get a sense of how the market is behaving.
Sir please suggest book for reading on fibonacci trading strategies. Thank you
Nothing specific for fibonacci itself, Gireesh. Its a small concept and is usually one chapter within any TA book.
Whether it is drawing Fibonacci or trend Line , Rectangular or any other mark/ high lightened mark is not able to use or see once refresh the chat. Once again we have to draw the line .
S it is my request to modify and make some arrangement just like fyer etc , where one we plotted the trend line , Fibonacci etc , it will be on the Chart even after refreshing the chart . But in Zerodha this facility is not available.
Suresh, I\’d suggest you speak to the support desk for this.
Thank you sir
Happy learning 🙂
If possible then please make a script or video on how can we draw fib retracement in different condition to get levels to trade
Noted. But meanwhile, you can also call our support desk to figure how you can use the tool.
I am unable to find Fibonacci retracement tool on kite .pl do the needful .
I\’d suggest you call the support team for this, they will help you with it.
can I use Fibonacci retracement in case when stock price breaks initial support/resistance
and now for knowing new target ?
Dont think you can use what we have discussed here. But I guess there is something called Fibonacci projections, which you can use. Please double-check this, as I\’ve never used this myself.
Sir , some people connect low to high & some High to low , what should be exactly in selling and buying ,low to High or High to low . And it is feasible in weekly chart too?
Sir , some people connect low to high or some high to low , please tell what we should do in buying or selling .is it feasible in weekly chart also?
If the stock has rallied a lot, then connect the low to high to see the extent of retracement. If the stock has declined, connect the high to low to see the extent of bounce.
The charts in 16.1 and 16.2 show opposite values of 0% and 100%. I\’m assuming 16.1 is the correct one. If so, please update the chart in section 16.2.
Sure, let me check this.
Serodh,
I like the way you handle queries with grace. Please what is the highest vertical distance [trend] a stock or a currency pair can make before retracing … Hear from you soon ✅
Thanks, but no one can really predict that 🙂
Hi Girish,
Is Gann still working for you?
What would be the most appropriate time period to consider for forming a trough and peak line?
There is no such thing as an appropriate time; it is dependent on how the market is moving.
Hi Karthik,
Regarding Fibonacci retracements, is there a reason as to why it works from a market participant point of view? For example, you had explained what each candlestick pattern meant in terms of what the bulls and bears are thinking. I was wondering if a similar explanation exists for Fibonacci retracements. It just feels a little hard to digest, that these Fibonacci ratios which have nothing to do with the market at all can end up explaining the markets so well(ofc not in all cases). Also a hearty thanks for designing these modules, really helpful 🙂
Regards,
Abhishek
I\’m also not sure, Abhishek 🙂
Great Sir. I used to plot Fib chart but did not know the meaning and sense. I can now plot the graph with knowledge and confidence. Thanks for the concept.
Happy learning, Swetha!
I AM NOT ABLE TO DRAW FIBONACCI RETRACEMENT IN ZERODHA KITE PLEASE GUIDE.
Please call the support desk, they will help you with it.
Hi, in the fib tool 23.2 % retracement is not visible on the chart despite ticking it in checkbox, can anyone help please by letting know how to get it on chart, thanks
Can you please speak to the support desk for this?
Can we use this theory in very short data of option trading to catch fast moves..??
I\’d avoid doing that, Bhaskar.
Hi,
Could you please show with example how from Kite platform we can use the Fibonacci retracement as now we don\’t have PI anymore supported by Zerodha.
Thanks and Regards
Dont have Fibonacci in particular, but you can find tons of other things related to TA here – https://www.youtube.com/watch?v=yzRP-mA2eiE&list=PLX2SHiKfualH_xMbGM-3zWC47s9gUjGR_
thanx a lot sir ji.
you responded this query sir but still not clear to me .
Please see my recent comment. Hopefully that will help.
sir my 3rd point was can we use (EOD) daily time frame for intraday because you said for intraday we should use 5min, 10 min,or 15 min timeframe, so is it good that we can use daily time frame (i.e EOD chart) for intraday, i think daily time frame is suitable for long swing… please clear my doubt and please tell me is it ok to use daily time frame for intraday trading.
Neeraj, you can use EOD chart for intraday as well. Check this – https://www.youtube.com/watch?v=z0Rwoz6PduM&list=PLX2SHiKfualEyD05J9JsklEq1JFGbG6qJ&index=3
The basic question being how do you know the stock has peaked and ready for retrace
You will know that only after the stock starts to correct. Not possible to identify the peak.
1- If i am trading F&O in bank nifty and i have to check volume and apply TA, So i have to apply TA on bank nifty original chart(spot chart) not the derivative and but for volume what should i do , should i check volume on future or option chart for this, is it right, but will this not be typical to go through both different chart.
2- another query is you said most of the time that EOD is preferable according to you most of the time because larger the time frame less will be noise and quality signal will occur, but EOD chart analysis can be apply for futures and options both. OR it is just for swing, \’
3- we cannot use EOD chart for intraday right? it should be 5,10,15 min . please elaborate all point sir ji thank you
1) Yes, you can do that. But for stock, you can only look at stock chart (spot)
2) You can apply for F&O also
3) You can, no problem with it. Its just that most people find it comfortable to use intrday chart for intraday trading.
🙏 Thanks.
Got it, thanks 🙂
Hi Karthik, I know it\’s been a while since you posted this, but hoping that you still answer queries for the same.
Q: WHY exactly does the Fibonacci retracement work? I read online that it\’s mostly just self-fulfilling, is that the only reason?
Shankar, I really dont why. Maybe its self fulfilling 🙂
Sir, I have read all the concepts prior this fibonacci theory and dow theory, based on those concepts can I start the trading journey or should I learn all of it first? please let me know.
I\’d suggest you complete the module to the end. But do start off with paper trading now itself.
What is S&R?
Can we take the trough and peak during the first two hours of trade and plot Fibonacci drag graph for the rest of the day
Yes, you can. But not very effective, I think. Please back-test it once.
You have suggested to
1 stop loss, S & R levels
2 volume be above average
My query is
1 what is S & R levels?
2 how to check volume?
1) S&R = Support, and Resistance
2) You can check volume on charts, usually present below the price chart.
I\’ve explained both these concepts in this module.
Is there any book to learn about Fibonacci or specific video collection, please refer that to me.
No, I\’m not sure if there is one on this specific topic.
What are the key rules to become a giant in stock market?
No idea.
What is that method about?? If you can…put some light on it..
Thank you…
Which method, Jignesh?
The logic is purely psychological. Right
Because most of the traders expect these level are of some reversal stage so it bounces back
Is this correct
Thanks
Yup, these are psychological levels which seems to have caught the fancy of traders many years ago 🙂
Why Volume Bars below Charts are not showing in Bank Nifty Chart?
Check Bank Nifty futures.
Hi Karthik,
Is there any video that can help understand how to draw & use the fib retracement and fib extension tools in Zerodha environment ?
Thanks
G
Ah, no video on this Gunjan.
sir,
what is the actual meaning of 100% fibonacci move.
It means that the stock price has cracked to the point it started its upward movement. For example, if a stock rallied from 100 to 140, and then falls back to 100, then it\’s a 100% decline.
Hey kartik \”I would now define the move of 109 (380 – 489) as the Fibonacci upmove.\”
How can u decided that it is a 100% upmove? I mean what should be the value or persentage to confirm a Fibonacci upmove or down move..
Pari, so a stock falls from 140 to 100, then the 100% fall is 40 here. Out of this, if the stock recovers to 120, then its 50% recovery from the fall.
sir please tell me which levels are important in fibonacci retracement?
All the levels, Subhankar.
Why does Fibonacci retracement work practically? I\’m really interested in knowing the mathematical concept behind stock prices always tracing back to such levels. It would be very helpful if someone can clarify it or share any resources on it.
Thank you.
Ayan, this is an empirical observation. I don\’t think it is backed by maths.
Atleast how many candlestick we should take in consideration while drawing Fibonacci retrancment
If you are looking at EOD charts, then maybe at least 2-3 months of data will be good.
If we believe what is being taught, you will never success , as its manipulation.
Now go back to any stock , commodity, crypto, and check 0,25,50,75,100. u will b amazed.
If we believe what is being taught, you will never success , as its manipulation.
Now go back to any stock , commodity, crypto, and check 0,25,50,75,100. u will b amazed.
Can anyone help me to calculate Standard Pivot ( support & resistnce ) levels that we see in Kite app on any Time frame chart ?
Fibonacci tool not available in zerodha .
Sir, after drawings fib level. please provide fib extension for both direction. (ie 1.6 and -1.6 level ) in zerodha tv chart.
Hello Karthik,
Could you please guide me how to draw fib tool correctly?
Like from Open/Close to another Open/Close of candle OR H/L to another High/Low of candle?
Means whether the wick to be considered or not?
Thanks!
You can ignore the wicks, just connect the open and close accordingly.
Fib retracement is available.
1. Select icon below trend line icone on left hand side.
2. select last option there, *fib channel*.
There u go, apply n enjoy retracement.
Should we include the peak and trough\’s wicks as well as. During plotting the retracement levels
Not necessary, real body is good enough.
Dear Sir
I am a ZERODHA Customer.
My friend was telling me that 23.6 has no value.
If the price closed above 38.2%, It will definitely move to 61.8%,
If the price closed above 61.8% It will definitely move to 1.618 Or 161.8%
How far this is valid.
Please clarify if possible in details.
There are no guarantees in markets, these are just probabilities 🙂
What is by perfect Fibonacci move means
Perfect is when the price bounces from the expected fib levels or retraces from the expected fib level.
JI
i couldn\’t find the Fib retrace from the new system. could you guide me to where it was located in the new window.
Ranjit, there are no changes as such. Not sure what you are referring to.
in intraday, u said that we should 5 to 15 mins timeframe to analyze the chart but what if I use a daily timeframe to analyze which candle will be a form bearish or bullish use multi candlestick pattern is that okay do like that
It\’s absolutely ok to do that, Jabastin.
Fibonacci extention is not available in kite app
I find difference in contents between app and website. which one should I follow and which is the latest one?
Mano, both places have the same content. No difference as such.
Hi Karthik,
Fibonacci Retracement regarding: Are the Retracement levels to differentiate between pullback and reversal different for different stocks? In any case they should be 23.6% or 38.2% or 61.8% right?
If I am conservative, I would keep the levels smaller right?
Second question is for Intraday traders, does one keep updating the Fibonacci retracement as new price levels are formed?
Yes, you can Sathya. Fib is not a great indicator for intraday if you ask my opinion 🙂
Hmm guys it\’s available that indicator is not available on indication options
There is option in insert drowning and below trend line that option is available 👍
How do I apply this tool in a live trading?
YOu can plot this on a 10 or 15mins chart intrday, Arif.
Can we use Fibonacci retracement tool as a long term trade? Or it is only for intraday?
You can use it for short term trades, not long term 🙂
can i apply fibonacci in intraday
Yes, you can.
WHAT IS THE TIME FRAME BETTER FOR Fibonacci
End of day if you ask me.
Hi,
In the below statement you said \”Step 1) Identify immediate peak and trough. In this case, the trough is at 150, and the peak is at 240. The 90 point moves make it 100%.\”, whereas we can see few troughs in between the two points you selected. For the highest point(240) you have chosen, the immediate trough would be around 202. Could you please clarify?
BR
Idea is to select the highest peak and lowest trough.
Sir can we use fib extension to keep stoploss when stock is trading at ATH
Yup, you can.
I really like the way you used the trade setup method to help us understand when to buy and sell in candlestick topics. Can you add something like that in Fibonacci retracement or just reply to my comment?
I know it\’s an indicator and it should only be used to scale up but still, it will help.
I;ve tried to explain the same in the chapter, do let me know if you get stuck with specifics.
I didn\’t find anything regarding Harmonic pattern in zerodha e.g. what\’s significance, how to draw etc ?
Yup, we don\’t have any articles about it on Varsity.
Conviction of buy/ sell decision 3 checklist points were intimated.
1) CandleStick pattern – ok
2) Stop Loss co-inside with S&R Level… ? S& R Level , where to check?
3) Volume is above average? Average Volume & current volume, where it\’s available?
Pls clarify. Thanks, Kumaran
You need to calculate the volume by plotting the 10-day simple average. Have explained this in the volumes chapter.
Sir what you prefer using Candle or Heikin Aishi for all such indicators or candlestick pattern?
Candlesticks on any given day 🙂
Sir, Nice info. This tech. analysis course is awesome, well-explained. thanks. I have one doubt – while plotting fib retracement which exact points to be considered? for trough and peak – wick of the candle or body of the candle?
Thanks and regards.
YOu can connect the candle body, and ignore the wick Pallavi.
In the fibonacci tool, in settings please give an option \”Select All\” for selecting ratios. This will save a lot of time for the user.
Need to check if the charting engine supports this.
Hello Sir,
While choosing the trough in step 1, why you have taken 150 instead of a trough around 200. I am a bit confused. Please help me out.
Because I thought 150 represented a better trough.
Sir where to keep stoploss for range breakout should we keep near breakout line or one ATR below breakout line?
2) Sir my fib S&R and manually drawn S&R is not matching l,should I need to worry about this are go-ahead with manual S&R
Just below the breakout line. This is to ensure the stop does not get taken out due to a false retest of the range. Fib and S&R wont really match, these are drawn based on two different theories.
Sir it is better draw recent peak and trough or low and high which is visible in the screen for say 9 months
The recent peak and trough are better.
https://drive.google.com/file/d/1Es0IsIHb6zMVVcWX3LgBag6WfBySQcDY/view?usp=drivesdk
Sir am I plotted well,you can see my Fibonacci S&R and my S&R is not matching what\’s the mistake
Using Fibonacci really confuses me sir whether I\’m plotting crct or not. I not found single relevant video on internet on how to draw Fibonacci
I heard people saying that Fibonacci levels act as support and resistance
When I draw support and resistance the Fibonacci S&R does not match
I will share my pic
It supposed to act, although I\’m not a big fan of fib levels.
Good evening sir,
Sir how many months or range should one consider while drawing Fibonacci levels
You need to connect one trough and one peak in the chart, this can occur at any time duration.
Hi Sir,
Can you explain upper/lower circuits for stocks?
Why do some have a 5% circuit and why do some have 20%?
Also why do some stocks get stopped permanently for the day and why do some reopen?
Circuit limits are in place to ensure that there is no excessive speculation in stocks. Based on the size of the trading volume the limits are set. I\’ll probably add a chapter to explain this.
Hi Karthik,
Fibonacci ratios are based on natural numbers, what is the relation between those percentages and retracement levels? why the stock has to retrace at those percentages? I feel those are not related to each other. Am I missing something here?
Thanks in advance
Satya
This is an observation as such. Please do read the chapter for the rational.
Is there a way to lock the custom Fibonacci settings, so that the same custom settings appear on every chart? Really cumbersome to set them manually on every chart.
I think there is a way. Maybe you should check with the support for this.
How many days/weeks/years of data should be considered while applying Fibonacci?
Hmm, this depends on when the trough and peak are formed.
23.6% retrenchment level is not displayed on kite web.
Is it no longer important or I need to add it manually on chart?
You need to plot this by connecting the peak and trough on the chart.
https://drive.google.com/file/d/1-FuZiUYp5CZICkUQ2TLDHCm8d5U4TPqr/view?usp=drivesdk
Am I plotted correctly Sir
Ready to learn from mistakes 😊
Yeah.
Sir while drawing fib for upward rally first retracement level is 0.236,0.382,0.5,0.618 when I plooted without uncliking when I unclick it starts from 0.786
Am I plotting correctly
Can you please recheck this? I\’m not sure about this, Chandu.
I mean sir, what does market structure mean? Ex:look at the market structure before choosing moving areas
Aman, I\’m not sure, but this could perhaps refer to the generic chart patterns that this stock is making.
What does market structure mean, sirji? Appearance of candles n price structure?
Sorry, not sure what that means. Can you share more context? Thanks.
Thank you sirji. Besides can you plz help me understand what an area of value is in simplest ways? I am not really getting it.
Sorry, I didn\’t get that query. Can you share more context?
So alongside fibb retracements, we need other tools as well, correct sirji?
Thank you.
Thats right, Aman.
Sir, which ratio is more reliable for a trend reversal?
Thank you so much.
I have a special soft corner for moving averages 🙂
Exactly. But just by looking at a specifif ratio like 50% ,can we say the trend will reverse?
Nope, hard to justify.
Sirji, what\’s your take on fibb Retracement? I mean we r expecting the trend the reverse after it reaches some fibb ratios?
Thank you.
Its a good to know thing, won\’t base my trades entirely based on fib ratios.
Sirji, when you are at looking at the downtrend the lowest is 61.8 n in uptrend the highest is 61.8 , correct?
Seems like it 🙂
Sir
Sincere apologies, could not find Fib extension.
Read the comment, to which you replied to check the studies. Cursorily checked other articles in varsity, could not find. Googled, to no avail. Tried drawing Fib fan and Arc, they don\’t give extension.
So I am using Fib retracement twice: trough-peak connected, peak-retracement connected.
Can you please guide me to the article (which topic it is under).
Ah, I\’m sorry, I mean \’the studies\’ in Kite chart 🙂
We don\’t have notes for fib extension on Varsity. I\’ll try and include something on this, as soon as I can.
Sir for drawing SandR for intraday levels I\’m facing some issues, and sir can we draw support line touching body and what is look back for drawing intraday levels
What will you look while trading intraday and will you use any EMA or SMA for intraday sir
Yes, you can draw S&R with real bodies. Look back can be 5-8 days assuming you are looking at 10 or 15-minute chart. I\’d always prefer EMA.
I\’m not confidence using Fibonacci, shall I go ahead and use pivot point instead, and is there any module written by you sir for pivot points
Yes, you can. I\’d even prefer classic S&R.
I apply Fibonacci retracement but after that price in marketwatch & in chart show different why???
Sorry, dint get that.
sir fibonacci is not available in kite ?
It is.
Hi Karthik,
What is the difference between fibonacci retracement and fibonacci projection available in kite?
Sunil, retracement is used to identify stoploss and entry points, projections for targets.
Sir can fib or pivot point indicator used as support and resistance
I\’d like to plot the S&R points manually, but between the two, I\’d prefer pivot points.
Fibonacci Retracement is not available in indicator on Zerodha. Is there any change in indicator list.
Its available right?
Valuable lessons
Hi Karthik,
Would you be kind enough to help me how do i plot the Fibonacci for intraday trading as I use 3 mins candlesticks? Do you need to wait for the chart to make the lows and highs for the particular day or do we use the previous days high and low or is it a combination of two or three days candles highs and lows. Also if Bank Nifty makes retracement what levels of Fibonacci retracement are considered most healthy for reversals, keeping in mind the volumes patterns.
I\’d suggest you load the last 2-3 days on intraday data and connect the trough and peak which is closest to the current market price. This will help you get the fib numbers for intraday trade.
Sir,
Could you please let me know ” WHAT IS THE MOST PRECISE POINT TO START FIBONACCI RULER FROM POINT ZERO GOING ALL THE WAY TO POINT 100″ ( Assume Uptrend). I am using HA Candle and 15 min chart.. whihc swing low should I consider while drow fibonacci? Is there any date period range should I consider.. please guide
Have posted a reply to this y\’day.
Respected Karthik Sir,
I have read and scanned the internet in search of answers. \” WHAT IS THE MOST PRECISE POINT TO START FIBONACCI RULER FROM POINT ZERO GOING ALL THE WAY TO POINT 100\” ( Assume Uptrend).
I\’ve understood if pick the wrong levels for starting and ending points, it will encourage buying or selling at prices that don\’t make sense, and I\’ll undermine profitability. But my question is \” What is the most precise point to start Fibonacci Ruler from point Zero going all the way to point 100\” ( Suppose Assume Uptrend). Say for example Nifty is on uptrend last 7 days and has a couple of Swing high & swing low which Swing Low to start from in creating the Fibonacci extension levels. while I want to enter in a trade on the day 8th..
Could you please suggest me best book on Fibonacci!
Thanks & Regards
Not sure if there is a book dedicated just for this, Soumen. Btw, in my opinion, this is not something you should be spending a lot of time on.
Hi, So we shouldn\’t invest in a stock while it is rallying up ? From what I understood is that let the stock reach a peak and when it falls down, we can calculate fibonacci percentages(23.6, 38.2, 61.8) and wait the stock to reach those points…..see the volumes and all that in the checklist and then buy …..Did I understand correctly ? If not what\’s the strategy to invest in a stock which is going up continuously from let\’s say 10 sessions and one more thing …..when we talk about volumes, we can\’t be sure about the volumes unless the day finishes right ?(may be some mutual fund or an institutional investor may invest a bulk amount just before the closing time)…so should we invest in the immediate session after that ….If yes…we can\’t be sure about how it opens the next day right(may be a gap close) and again same story ….pls clarify on this . Thanks in Advance 🙂
Thats correct. The fib ratio forms only when the peak and trough are connected, which means to say that you will have to wait for both these points to form.
on mobile app where is fibbonaci
Hi Sir,
When should i setup trade in fibonacci ? When candle will touch any of the fibonacci level ?
But there is a possibility that trend will continue till next fibonacci level or retracements is also possible.
So forget about practical even in theory also we can have multiple result.
Kindly have a look at maruti fibc. Can i Setup a long position with below values :-
Entry :- closing price of p1 i.e. 6891
Stoploss :- low of p1
Target :- 6960.45(61.8%)
Link :- https://drive.google.com/file/d/1pIL8iwOGeCd5JEXkYJJSaq42VjOlfGdw/view?usp=sharing
Unfortunately, you cannot time this. Yes, the retracement could exceed and fall further. YOu will have to evaluate and take the call 🙂
I am confused weather i should draw it from Top to Bottom or vice versa. Kindly confirm.
Depends on long or short positions.
Hi Sir,
(1) Can i simply match 52WHIGH TO 52WLOW ?. I mean to ask do we have to mind about particular time frame while selecting High and Low ?
(2)Kindly have a look at today\’s maruti chart or refer link :- https://drive.google.com/file/d/1O4x9JWOnbo9bGwpCAEGR6MAPs3qz4F6O/view?usp=sharing
Can i say maruti will rise from 6891 till 6960 (61.8%) ?
Regards
Ishwar
1) Yes, you cannot look at large time frames and connect the peak and trough. For better results (from personal experience) try and connect the peak and trough formed within say 3 months. Given this, you can connect 52W H and L if they occur within say 3 months.
2) Unable to open the link.
Hi Kartik,
Kindly have a look if my fibonacci chart is correct or not ?
Can i say that price retracted back at 50% and 38%
Link :- https://drive.google.com/file/d/1Ii6jakCXgwX2PrP2cyLgkttDsCoayv2J/view?usp=sharing
Regards
Ishwar
Unfortunately, the image is not loading.
Sir,
Thanks a lot for your quick reply.
Regarding my Question no. 2, I understand it needs to look on case basis. But What should be the percentage change in range on EOD basis to consider trending market or sideways market for index/stock. Being a new learner I need your valuable input on same.
Regards.
There is no fixed range as such, this needs to be looked up based on the recent volatility in the stock. Higher the volatility, higher the range and vice versa.
Hi Karthik Sir,
Hope you are going great. Please clarify my following doubts :
1. Is it advisable to apply Fib. retracement in Swing trade ? Or it is mainly for longer trade ?
2. What should be the percentage change on EOD basis to consider trending market or sideways market ? Please suggest in case of a particular stock as well as Index both.
3. In Kite chart, when I draw Fib.retracement, percentage retracement line (like 61.8%, 38.2%) are featuring but exact value are not featuring. Do we need to identify retracement value by our own from range ?
Regards
1) YOu can use it on a swing trade
2) You need to look at it from a case to basis
3) Release will provide this soo
this chapter is not in varsity app. many other also not there
Which other chapter is missing apart from this?
Karthik, please advise the study to judge and apply this tool in real live market scenario. Example, if I am trading in Bank Nifty Futures and chart is moving I am sitting in a live market so how can I use this tool to judge the next retracement where I don\’t have the highest peak so that I can go long in it. Also please tell that particularly on which time frame chart this works the best, I have seen it working in pre-formed charts at all time frames but in the live market which time would be the best to apply it and which one to take as the highest peak?
Works best on EOD charts. However, if you are using this on an intraday basis, I\’d suggest you connect the two most recent troughs and peaks to identify the retracement.
Thank you sir for sharing your knowledge..
I have a question:
If the nifty is negative for the day does it affect our positions and short term investments and should we be worried or just stay invested and wait for the market to correct..
Yes, usually the broader markets do tend to influence all stocks and take these stocks in the same direction.
1 How do you distribute total funds for the trading
for example if I have 100K and have shortlisted 4 stocks
so shall I distribute 25K per stock ?
2 what is your strategy on distributing the funds
3 are you more of a fundamental or technical guy or both ?
thank you for your time 🙂
1) Yes, you can do an equal weight, but this is not the only way. But I guess its the easiest way 🙂
2) Function of portfolio optimization
3) Mix of both 🙂
Good luck!
Hello Sir,
Is this theory still applicable ?
1 – indentify chart
2- check s&r
3- check volumes
check indicators…..
and how to distribute your funds to stocks (equally like SMA or like EMA 🙂
Yes, still applicable 🙂
The most recent peak and trough concept of choosing the points for plotting the Fibonacci retracement is not very convincing. I have tried it at multiple places however, results seem to not align with the general notion.
Is there any further filtered way of choosing the peak and trough?
Hmm, I\’m not sure. This is the standard process, Harsh.
when applying Fibonacci, what do you mean by troughs and peak?
Is it high and low of highest and lowest candles respectively in the chart
or
opening and closing are the trough and peak for an uptrend chart
I explained badly though, I hope you will get what I really questioned.
thank you
Assume you are looking at a 6 months chart, peak is the highest price point in the chart and trough is the lowest price point, as easy as that 🙂
Sir, i am looking at the charts of tata motors and preparing for a swing trade. The pattern is currently trending upwards and the MACD indicator confirms the trade. The RSI doesnt do so, should i look for buying opportunities if other factor also confirms as RSi works well in sideways and not in trending markets.
Mohit, don\’t mix up the indicators. Your trade signal should come from CS or the price action. The confirmation from indicators should be secondary. Also, no two indicator will give the same signal, so stick to one that you understand well. Good luck.
I request Zerodha to Please provide AUTO FIBONACCI RETRACEMENT indicator
Noted, will pass the feedback.
Thanks for the reply. And yes I bought this share since it was at low price from a long term perspective( atleast a year).
But Sir from long term perspective how to know at what point to exit? If not fib retracement then should I wait for only resistance to hit or there is some other indicators?
Hmm, you can keep trailing the SL and have a generic 25-30% return expectation. However, the right way to do this by looking at the business, tracking fundamentals, financials etc.
Hello sir, I have bought few shares of India hotels @85, which is close to the trough and the current ltp is 102. It is a uptrend and its been only few sesions.
So should I draw fibonacci retracement from 85 to 102?
and for only few trading sessions is it helpful or the uptrend has to continue for more sessions before I can use this tool??
How long is your holding period? If you intent to hold on to this for few years, then there is no point in drawing the fib levels. However, if you have a trading perspective, then maybe yes.
Hi ,
Please help me with drawing Fibonacci and If I were to do intraday in options then shall I chart Fibonacci on 1 day candle, Whats the ideal number of days to use to plot Fibonacci?
Yes, EOD is perfect for plotting Fib ratios.
On May 12, 2015 at 6:38 am you replied to a comment saying that \”Absolutely. Many people end up making the mistake of applying TA on Options, which is not really a good practice.\”
I do not understand. In many of your comments you have asked us to use various indicators of Technical Analysis for NFO. Then why do you say that it is not a good practice? I am asking as I specifically trade in Nifty 50 Options and whatever I have learnt from Varsity till now has helped me a lot. I do not understand why do you say so? Can you please explain?
So shorting in equity market is not possible for a period of days or weeks?
Nope, only in Futures.
Can we short for a period longer than a day? What I saw, was that if we short sell, our position would be squared off at the end of the day. (I must be wrong). How long can we hold a short position, and how do you hold a short position for longer than a day in Zerodha?
You can short and hold positions overnight in the futures market, Abel.
No. It is not there
Why don\’t you provide Fibonacci Projections in Pie
I\’m guessing its there. Need to double check on this.
Hi Karthik,
What exactly do you mean by below statement
\”If the stoploss also coincides with the Fibonacci level then I know the trade setup is well aligned to all the variables\”
Let\’s say after a sharp decline I want to buy the stock, in that I understand that the low of the pattern acts as Stop loss in this trade but I don\’t understand how my Stoploss will coincide with the Fibonacci level. I understand I can set the target as 23.6% if the stop indeed changes the direction. Please elaborate on this
Ah, it is just that the low will also coincide with fib ratio it adds more weightage to the trade you intend to take. For example, if 23.6% retracement coincides with say 89, and 89 also happens to be the pattern low and also support, then it just adds more weight to the long trade.
for example, On Sun Pharma chart there is a hammer formed on july 6. there is a green candle appeared on july 3. Can i consider june 24- july 3 as a decline or bearish trend ?
If the correction is at least around 8-10% from the peak extended over 10 days, then it would be a convincing decline and therefore a valid period trend. Everything else is a workaround 🙂
Hi Karthik, this is the last question for today from my side, so please bear with me. there is a bulli When looking for prior trend lets say there are there is a price decline from 10 days with 6-7 red candles and remaining green candles of different ranges(not green on the previous day of pattern formation). can i consider it as a decline? or there must be only red candles?
Yes, also ensure that there is a price decline of 8-10%. Btw, please don\’t restrict yourself from asking any amount of questions. Questions are what enriches this platform!
Hi karthik, SBI stock moves from 152 to 196 (May 26, 2020- June 8,2020), there is a increase of 44 rs. while selecting Fibonacci Retracements, when I point at 152 and drag up to 196, these are the lines i observed
line – price
0% – 196
38.2% – 179.23
50% – 174.5
61.8% – 169
100% – 152
what does it mean? if there is a price correction, chances are it may come to 179.23 (38.2%) or 174.5 (50%) or 169 (61.8%) and bounce back right, But my question is we need to calculate % from end or start of trend? and we should consider end price or start price of trend for calculating correction or do we need to consider trend range for correction?
Satish, what you\’ve done is correct. The price increase of 152 to 196 is considered as a trend (that you are interested in). So this is 100% of the trend. If there is no retracement, then the stock stays at 196, hence 0% correction. If the stock declines by 39.2% (fib ratio), then the correction takes the stock price to 179.23. If the stock corrects 100%, then all gains are gone and the stock goes back to 152. Fib ratios are the likely places from which the stock is expected to bounce back.
Hi Karthik, What does \”Fibonacci retracements are movements in the chart that go against the trend\” mean
Sometimes stocks retrace from their main trend, before going up further. Thinking about it as taking 10 steps forward and 4 steps backwards before taking another 8 steps forward. The 4 steps backwards you take is called retracement. Fibonnacci retracements help you identify how many steps you are likely to retraces. In trading terms, fin retracements help in understanding how many %points the stocks are likely to retrace before it jumps up higher.
Hi Karthik,
What are fibonacci retracement, extension, Projection?
These are different types of estimates which measures the likelihood of retracement, trend, and timeline. I\’m not a big fan of these estimates.
Sir, because the support and resistance move sideways and a straight line is drawn for support as well as resistance but in fibonacci retracement there is a sharp uprally and when there is correction in the market the price retraces in 23.6%, 32.8%, so how can we draw support and resistance levels here.
You can switch to trend lines Mohit.
Sir doesn\’t the fibonacci retracement theory contradicts the support and resistance level theory? How can we use both at the same time?
Nope, these are two different methods. I see no contradiction here. By the way, why do you think it contradicts?
Hi Karthik,
I am trying to use fibonacci retracement for NIFTY/BANKNIFTY options trading. Do you think i can use it on futures chart with hourly candles? Also, how many days i can look historically to identify the trough and peak to draw the trend line for fibonacci calculations?
Yup, you can use it, no problems with that. If you are using hourly charts, then I\’d suggest you look for at least 5 trading sessions.
Hey, I loved your way of explanation. Is the fibonacci retracement method useful for intraday as well? If not, which tool is the best for intraday trading?
Thanks 🙂
Yes, traders use this to identify points from which a bounce back is likely to happen.
Sir how can one get to know that at a particular point the price of a stock is going to retrace. Alzo lets say that that a stock price retraced by 23.6% furthermore it might retrace to 31.2% or 61.8% or it might move in its original direction so how are we going to know this. Because nobody knows what might happen in future.
Exactly, these are things that no one can guess. You just act based on probabilities.
Hi Karthik ,as you said above when the stock in uptrend for sometime and it should retraces back to some position w.r.t fibonacci percentages so my question is how do we know whether it is going to decrease by 23.6% or 32.8 or 61.8%, if i seen the position in RSI indicator the value is above 80(strong sell) and followed by a doji. how should I select the stop loss in that position.
That you can\’t say Vinay 🙂
Fib levels are probable levels at which bounce back will happen. You can always look at other indicators to evaluate if the scrip is likely to arrest its fall or not.
Why is fibonacci retacement not included in varsity app?
Are you sure? Let me check this.
Is Support & resistance tool and pivot points tool are same? else,what is the difference between them? please provide your answer.
thanks
They serve the same purpose but the means of calculation are different. S&R is a visual concept, you draw them on the chart based on how the stock moves, pivot on the other hand is calculated using a formula.
Please add Fibonacci retracements tool in kite applications for mobile users
The new chart update will have this, Pankaj.
Sir in the recent high and the low, do we need to account for only the candles body or also the candles shadow
Ignore the high/low candle shadows if they appear to be unusually long, Vignesh. Else do consider them.
Sir, kindly suggest some free as well as paid virtual trading platforms where one can get actual hands on experience cause I am new to the market and have never traded before.
Not sure about that, Surya.
Sir
How can I save my drawings as templates in kite charts on web?
Request you to kindly call the support desk for this. They will guide you through it.
Could you please tell me if ROC (Rate of Change) indicator and Pivot is present in Kite.
Thanks in advance.
Will be adding a chapter on CPR shortly, will include in that. Thanks.
Sir
My drawings in zerodha charts gets automatically removed after few days…..is there anyway to save my drawings in it?
Save them as templates.
Hi Kartik sir, I appreciate you explaining model.
Pl let me know about drawing fibonacci Retracements in TV as same couldn\’t be located in KITE.
Thank you
Please check the left panel, you will find the fib tools.
Is it necessary that retracement in this 61.8% ,38.2% ,23.6% ) particular order ? or reverse order (23.6%, 38.2%, 61.8%) can be possible ?
The market does not follow any order, so it can be any which way 🙂
Hi,
In Kite application in Fibonacci I don\’t see a 23.6% line once i draw it…..it is only showing 38.2, 50, 61.8, 100….
why is it so..??
Regards,
Hmm, not sure. Need to check.
Hi sir,
1. In the Fibonacci retracement construction, for identifying the 100% Fibonacci move, which recent trough should be considered. Recent refers to what time? As we go back in time, many troughs are seen.
2. For calculating 10 Day moving average of volumes for checking for higher volumes on the trade initiation day, which MA should be used? SMA or EMA?
1) Use EOD charts, and look at the most recent highest and lowest point. That is good enough.
2) SMA on volumes is good enough.
Hi Karthik! One doubt. You have mentioned that:
1. For average gain and average loss calculation for RSI, a look-back period of 14 days is used.
2. For MACD 12 day EMA and 26 day EMA is used. And for signal line, a 9 day EMA is used.
3. For the middle line in BB, a 20 day SMA of the closing price is used.
Are these constant for trading for any duration? Like would they be different if I want to complete a trade in a few days to 2 weeks, or for a few months, or even for a few years?
These values were set as default values by traders who invested these systems. Of course, you are free to play around with these and set them to what you think suits your risk and reward temperament.
Hello sir, there is a bit confusion !
In the section 16.1, in the first chart, while the stock is making new high, in Fibonacci level it is depicted as 0.00%
Whereas, in section 16.2, n the last chart, while the stock is making new high, in Fibonacci level it is depicted as 100.00%
Kindly clear this, thank you !
The % being referred to here is the quantum of retracement, Anup. Look at it from that context.
Hi Karthik,
Firstly, thanks a lot for the continued help and this excellent post. I can not locate the Fibonacci Retracements on the tradingview layout in kite. Is it avaiable on TV?
If you expand the left panel, you can see that in the studies.
Sir , you said stoploss should coincides with fibonacci level . But percentage level are so high in retracement that it probably hit stoplos s before making strong trade .
That is a general guideline. Please evaluate on a case by case basis.
Hi,
Do you plot starting with the trough or peak first? When i plot starting with the trough, the 0% mark features at the peak. (opposite to the diagram shard above)
Yes, you need to start from the peak to trough.
Fibonacci retrachement and extension chart not available on technical analysis
Request to make it (Fibonacci retracement tool) available for Zerodha Kite software users……
thanks,
I guess this is available on both chartIQ and Trading view.
where is FIBONACCI EXTENSION DRAWING TOOL .Please note i am not asking for FIBONACCI Retracemnet
HI Karthik,
Thanks for giving us such a wonderful topic.
I had a doubt though,
Trough @ 150
Peak @ 240
How does the above makes a 100% Fibonacci move? I failed to understand this, kindly reply
Once you identify the peak and trough, then that becomes your 100% move…for example in this case the 100% move is the 90 point move between 150 and 240.
Karthik sir. I can\’t able to use (not active) draw tool in kite pls help.
What is the issue? Maybe you should call support for this.
no, I checked today it is not available
Fibonacci Retracement was earlier available on Studies section in Zerodha, now i cannot find it. Can anyone please help?
Thanks.
It is still available, Kapil.
Hello Sir ,
I love Zerodha very much reason is ,it\’s very easy to use and understand .
What I am additionally looking is , Do you have any tool that can plot Fibonacci Extension like trading view or investing website has
That could very helpful to address the target including Fibonacci retracement.
Thanks
Suhas
The extensions aren\’t there, for now, Suhas. I will check with the team anyway.
how to put on fibinocci metric
Right-click > settings.
Hello Zerodha team,
many users are asking for Fibonacci Projection or Extension tool, what you have is only Fibonacci Retracement tool.
could you please reconfirm on Fibonacci projection or extension tool availability in Zerodha Kite, if yes can you please send us the link how to draw in Kite.
Thanks
Rajanish Mayanna
Rajanish, this is available on Kite, trading view. Request you to check the same. Thanks.
My question is: what constitutes a 100% Fibonacci up move- is there a percentage associated with increase from the trough to the high?
100% retracement implies that all the losses are erased and the stock is back to the point from which it started to crack.
why this chapter is not in varsity mobile app and please also add hindi language in mobile app
Let me check this.
Time scale to select: I want to integrate selection of time scale with price target of a stock. Zerodha enables a user to view monthly, weekly and daily chart. Presumably, higher time scale confirms more reliable price movement or trend. Thus, we restrict to monthly or weekly. Now, the question is how do we select a time scale? Because, retracement levels depend on the latest high and low based on \’time scale\’. What is your recommendation?
I\’m guessing this is for short term trading, if yes, I\’d suggest you look at the EOD charts and not really the monthly or weekly chart.
Karthik Sir,
How Is This Fibonacci Pivot Is Calculated?
Also,
Fib Projection & Fib Extension Tool.. When Its Going To Be Available On Pi?
Also,
Day Separator Line Disappears If Candle Chart Changes To Heineken ashi.
Need To Fix This Issue.
Also,
Chart Scroll Should Be Given. Because If You Look At Chart.
The Candle Bar Appears At Right Side Of The Screen Where Screen Almost Ends.
That\’s Its Default State.
Allow User To Scroll Chart To Left Side Of The Screen Like We Do On Kite.
Also,
If CrossHair Is Selected, Then Only Crosshair Works And Not Able To Move Chart To Right/Left And Also Not Able To Remove Horizontal/Vertical Line/Fibonacci. Needs To Disable It First And Then Able To Remove Lines From Chart.
But Not Happens This On Kite. We Can Move Chart Right Left Up Down Even The Cross Hair Is On.
Thank You.
Thank You.
I\’d suggest you look this – https://tradelab.in/pidoc.pdf
Hello,
Fibonacci retracement tool is suitable for bank nifty intraday? and How to use this for bank nifty and time frame?
You can use this is with any stock/index.
which is better moving average crossover system??
Depends on your risk and reward temperament 🙂
For me, 9×21 works for intraday. 100×200 for longer term trends.
which is the good moving average (periods) sir
I\’d suggest you look at EOD charts.
sir,
how to find out whether its trend up day and trend down day to calculate fibonacci retracement ?? wat are the criteria??
To identify the trend you can use a moving average crossover system.
Hello Karthik,
thanks for such wonderful material!
the question is related with Pivot points (Fibonaci) in the Kite chart;
the Pivot Point and the corresponding two Support and two Resistance levels that is drawn in the chart,
request please help with the formula for the same, thanks!!
Ah, I need to figure the formula myself Prasanna 🙂
Will try and do that.
Thanks Karthik,
My understanding is, the next day\’s SUP & RES levels [Fibo] are calculated post taking in to account the previous day\’s high, low and close price, as follows:
Resistance 2= Pivot + (PD high – PD low) * .5 or .618
Resistance 1= Pivot + (PD high – PD low) * .236 or .382
Pivot = [High+Low+Close] / 3
Support 1 = Pivot – (PD high – PD low) * . 236 or .382
Support 2 = Pivot – (PD high – PD low) * . 5 or .618
but these are NOT the values I see in the Kite Chart, hence I ask this question, if you folks are using a different formula, could you please elaborate, thanks!!
Best Regards
I guess you are talking about chartIQ. Let me see if I can get the formula used by them.
The explanation of how pivot points are calculated on our ChartIQ charts is explained here.
Thanks Faisal bhai,
but one clarification please, in the Kite Chart S&R levels there are two types provided one is Standard and other is Fibonacci, in the link you have provided only one type formula is provided which to me it looks like Standard, what about the optional Fibonacci formula?
could you help provide clarity, thanks!!
how to set chart if stock is downtrend
Set the chart as in? Can you kindly elaborate?
What is the difference between pivot points (standard) and pivots points (Fibonacci).??
Both are formula driven, Manish. Pivot points standard is a formula-driven method to calculate the support and resistance levels. Likewise for fibonnaci pivots (to identify retracements)…however, I\’ve not used the fibonnaci pivots, so cannot comment much.
Hi Karthik,
Is the Fibonacci extension option available on kite?
Thanks.
Hey Karthik ! Is it safe to say that the Fibonacci Retracements are an alternative to S&R levels ? I am getting pretty good results by using this tool. Tank you !
Not a convincing yes 🙂
hi, Im using kite and you dont have a Fibonacci retracement tool. Can you please include this in kite?
thanks
Ravi, its there. Click on \’draw\’ (in the chart) and the select the Fib retracement as the tool.
Hi Sir,
I hope you are doing well..!!!
I have a small Doubt regarding fib, You had told that need to draw Fib based on Most recent High and Low.
1.for intraday trading , for today\’s trading should i draw fib based on previous day\’s low and High?
2.after that, the same day after some time(consider 30 minutes or 1 hour whatever it is ) Forms Day\’s low and high again, in this case should i draw again Fib based on most recent High and low (OR) should i consider previous days low and high for entire day?
3.if 2nd point is true , should i repeat the process on latest Day\’s high and low?.
Thanks in advance for your Kind Reply.!!!
1) I\’d suggest you take the at least 5 trading session and draw the fib lines between the low and high
2) This depends on the range, if it in a small range, then stick to previous levels, else take the fresh high and low
3) This depends on the 2nd point
Good luck.
Hi sir,
Thanks for quick reply.
This depends on the range, if it in a small range, then stick to previous levels, else take the fresh high and low:: How much Range should be consider ??
Since its an intraday, I\’d suggest you keep around 1-2% as a range.
Will the Fibonacci levels, BB lower band, candlesticks patterns, etc will be considered as support or not?
Also there are many types of Fibonacci. So can you please help us understand about some of them like gann fan, Fibonacci trend, etc
Thanks
BB band lower and Fib levels can be considered as support. I\’d suggest you look for Fib reversal (explained in this chapter) to begin with.
What is fibonacci projection? How to plot this in metastock?
What is fibonacci projection? How to plot this in metastock?
Fib projections is same as fib retracements, except that they help you identify targets. I\’m afraid, I\’m not too familiar with MetaStock.
Sir I am not getting Fibonacci options after clicking on studies please help me
You are looking at the wrong place. You will find it under the Draw option.
Hi Karthik,
I understand that the retracement levels as percentages of the total fibonacci move are calculated from the immediate crest(move up), or the immediate trough(move down), which is confirmed by the examples provided in this material. However, in the example demonstrating the construction of fibonacci levels using charting tool on pi, the order of the levels seem upside down, i.e., shouldn\’t the 0% level be at the crest(236.982 price point) intead of the 100% level??
Since we are trying measure retracement, we need to start from the crest. Remember, we are interested in looking at what extent the stock may fall from the peak, so standing at the crest we look at the trough.
Exactly!! Therefore shouldn\’t the 0% level be at the crest itself as we are trying to find out the level till which prices will fall? In the example, the 100% level is shown to coincide with the crest, where we are trying to determine the price fall after an acute increase. Kindly pardon me if my questions seem shallow.
It like this – from the bottom to the top is considered a 100% move, we are interested in knowing how much of this 100% will get eaten away when the correction starts.
What is meant by pullback and how to differentiate it from Fibonacci retracement?
If a stock goes up from 80 to 90 and falls back to 85, the move from 90 to 85 is called a pullback/correction. Fibonacci retracement is a way to measure the magnitude of this pullback.
what about elliot wave theory,it will be good if you guys teach elliotwave theory
I\’m not too familiar with EW. However, we will try and put up something in that regard. Thanks.
I cannot use the Fibonacci Retracement in Kite. Please check.
Why? Can you please explain what issues you are facing? Thanks.
In the studies list, the fibonacci is not listed.
It is under \’drawings\’ and not studies. Click on drawings and you will see a new drop down on your left. Look for Fibonacci there.
hello Karthik,
If one looks at the EOD chart of AXIS BANK it clearly shows the rally from Rs.450 to rs.625.After it formed the top it is now retraced more than 62% and has given three consecutive closes below this level. What should be the analysis from Fibonacci perspective? should we assume that next support for axis bank is at 450 itself from where the rally had begun?
That will be a 100% reversal. Axis Bank has massively consolidated around 500 between March and Sept 2017. I\’d suspect there would be some buying interest around these levels here.
Where is Fibonacci Retracement in Zerodha chart
Please check under \’studies\’. Thanks.
Hello Karthik.. I might sound stupid.. but I check in studies a few times but i didnt find it.. what is the name used in studies.. may be a short name or something..
On Kite Mobile App, in the Chart screen, click on Settings>Draw. Under Select Tool drop-down, you will find Fibonacci retracements.
On Kite Web, in the Chart screen, you’ll find the Draw button. It’ll open a Select Tool drop-down, under which you will find Fibonacci
On Kite Mobile App, in the Chart screen, click on Settings>Draw. Under Select Tool drop-down, you will find Fibonacci retracements.
On Kite Web, in the Chart screen, you’ll find the Draw button. It’ll open a Select Tool drop-down, under which you will find Fibonacci retracements
Thanks a lot Faisal. I am new in Kite and i was looking at Fibonacci in \”studies\”..
Hi karthik,
Can we use fibonacci series in future or option trading. I want to use it for nifty futures . What\’s your suggestion!
Yes, you certainly can. You apply this on the spot market and then take action in the derivatives market.
Sir, please help me regarding this i am not finding answers in hm gartley\’s book nor scott m carney\’s harmonic trading…
In gartley if the point B of AB after XA just crosses .618 mark but remains under .786 mark, will it still be a valid gartley with all other parameters satisfied??
Sandipan, unfortunately, I\’m not too familiar with either of the techniques.
Where and how does Fibonacci retracement fit in the suggested checklist?
It does not fit directly as it is just another indicator.
I just searched for fibonacci retracement indicator on Kite 3.0 , was unable to find it . Please clarify it to me whether it is available in a different name or not available .
Thank you 🙂
Nevermind sir, I found the answer in the above comments. 🙂
Check the list under \’Studies\’.
Hi Karthik, i am a die-hard day-trader and am doing great with with Zerodha. Thanks. You people are doing great job.
I was going through this article on fibonacci today…..and i just got a little bit confused. My question is – After a upward rally, suppose chart started moving downward, then how i will differentiate if it is fibonacci correction (because, after the correction, it will again start moving in the direction of original trend, that is upward) or trend reversal (means chart really started moving downward ) ? how to differentiate ?
This is exactly where the Fibonacci comes to play – it helps you understand the \’\’extent of the correction\’ with respect to the primary trend.
Sir/madam, how to use fibonacci in kite mobile app…not able to draw from low to high on mobile. On system u can draw with mouse .but how can we use it on smart phone.plz guide
You can select the point from where you want to draw the retracement lines. Grey coloured crosshair will appear, you can tap on it and drag the lines to your desired point. It works more or less the same way as it is on the computer
sir the fibonacci tool provided in kite is different from pi, why is 61.8 & 38.2 equidistant from 50% retracement level in kite ?
Vicky, I see no issue here, both Kite and Pi have 61.8% and 38.2% lines equidistant from 50% retracement level
Hi Sir,
1. It is mentioned that fibonacci numbers are \” 61.8%, 38.2%, and 23.6%\” ,but in some stocks there are about 50% retracement happening.Though the 50% is not a fibonacci number still is it considered a retracement?Fibonacci retracement?If So is 100 % retracement possible?
2.In terms of MACD indicator,what should we look for?whether the MACD line to cross 0 line or the crossover of MACD and Signal line?
3.By the time the Candlestick pattern is formed with the checklist supporting it,and in indicator point of view ,if MACD as already crossed signal line and moved to some extend,then this can be taken as a Indicator confirmation and quantity can be added or since it has already moved to some extend ,it shouldn\’t be considered as Indicator confirmation?
4.What is prior trend, how to identify it? Can a downward prior trend can have small blue candles in middle and vice versa?
5. In a long downtrend (Say 15 to 20 days), if there was a small uptrend without volume (say 4 to 5 days) and followed that if there is any candlestick pattern with buy signal and all checklist supports that ,then that trade could be taken or avoid since the prior trend is not in favour?
6.If the market crashes or if there was some very big bad news about our stock and price drops drastically because of it and if we were to wait for the price to close below SL to exit on the next day, then wont we end up with huge loss as the price would close much below the SL? In this case how should we act?
7.If we have entered a trade and if the trade moves in our favour,but before the target is hit ,if there was some fundamental news (like Q results) announced and price moves in opposite direction,with some defined candlestick pattern and volume supporting it,what to be done?Can we exit the trade or still wait for the target to hit?If we can use trailing stoploss, then how to use that in a swing trading or positional trading?
8. what to be done if there is a price movement without a candlestick pattern but with a huge volume?Can we enter the trade?
9.If price reversal is possible only at S&R ,then how come a trailing SL works? Will there be a price reversal possible at trailing SL point?What is the concept behind it?Should we need to exit the trade if price hit trailing SL once the price is hit or on closing basis ?
1) Yes, 100% is possible
2) Look for the overall oversold/overbought signals. Once comfortable, look for divergence and convergence histogram
3) I\’d suggest you pay more attention to candlestick pattern
4) The prior trend is basically how the price is moving over the last couple of trading sessions. Yes, blue candles in a downtrend is normal and acceptable
5) You can consider this as a downtrend
6) You should close the position – remember when fundamentals are at play, give TA very little importance
7) Same as above
8) Yes, as long as you have the conviction
9) Trailing SL is an improvization and not really mandatory at the time of setting up the trade. However, a SL is an important element of setting up the trade.
can we refer that 100% retracement as reversal ?
Yes, you can.
Is this tool available in zerodha charts. I didn\’t find it. Pls guide me.
Yes, it is available. I\’d suggest you check the earlier comments, have explained how you can access it.
Not available extensions, like 127. 144 etc in fibo.
Sir, for the first 5 Fibonacci series i.. 0,1,1,2,3 if we divide any number in the series by the previous number; the ratio is not approximately 1.618. Example 2 divide 1 is 2. Why?
Well, that the way Fibonacci series works 🙂
Sir,
If after identifying the 100% up move in a stock the stock has fallen till 61.8% level, to further predict any correction do we have to identify a new move or continue with the earlier identified up move?
Usually, you connect highest high and lowest low to get the fib levels. So you always keep these extreme values in perspective while looking at fib ratios. Once the price moves away from this zone, you look for newer high and low points. So given this, I\’d suggest you stick with the same points, until the stock has moved significantly away from these points.
Sir,
If the prices are within the range then after 61.8% level correction how to determine the next level at which correction can take place in stock?
You can extend the Fib levels beyond the 61.8% and watch for a 100% retracement.
Thank You Sir!
Cheers!
Hi karthik sir
What\’s your view on ichimoku kinko hyo??
Is it worthy to learn it?
I\’ve not used it much and know very little about it, hence my opinion would not matter 🙂
Yes, go ahead and learn it. Nothing wrong with knowledge gained 🙂
Hello Sir,
In intraday trading, how do we differentiate between retracements and reversals. I had losses because i thought it would reverse but then it was retracements.
Thanks and Regards,
Aishwarya
Well, you cannot differentiate between the two. Reversals start off as retracements.
Hi Sir,
I have many doubts to be clarified. Kindly help on it.Sorry for the trouble… 🙁
1.Is that in Bollinger band can we use 20 EMA instead of SMA?
2.Is that every stock which rallied up will definitely have a FIB retracement?Is it sure or a possibility?
3.Is secondary trend in Dow theory and FIB retracement are same concept?are they inter linked?
4.How to indentify the peak and trough exactly?As in your FIB retracement example there are several peak before 240.Why din\’t you consider them ?How have mentioned in the chapter to consider the previous peak and trough,if so the previous peak is 240 in the example then i could see that the immediate trough is not 150 and it is something higher than 150.Why is that not considered?
5.In examples given here the stock have also retraced bit higher than the FIB %. Is this mean that its approximate % range?If so can the stock retrace even to 55 % or 65%?If so are they still considered FIB retracement?
6.Is the Initital movement need to be more steep for FIB retracement to happen? What if the momentum of the up move is very slow (say 2/3 years with 25 to 30 % price change) will the FIB retracement will happen for that to?
7.what is max time that a stock take to retrace?
8.How much the stock could bounce back after retracement? any % value is there?After bounce back will there be a retracement again?
9.When a Support or Resistance is a range instead a particular price value ,then what if the Candlestick pattern form at the lowest of the range,should our target be the upper portion of the range?if so then the price difference wont be very less ?
10.If a trade work in our favor, how to identify will the price move has a potential to break first Resistance and reach second resistance?Because I usually close position at first resistance but prices move till to next resistance and I miss them? 🙁
11.In intraday trading , how to close the position(in 15 min chart based trading).what i mean to ask is if the CMP reach SL(lowest of the candlestick pattern) ,should the trade be closed immediately?or should i wait to check whether that particular candle close below SL?If the price tough SL but that 15 min candle closes above SL can i continue with the trade?
Again a Sorry for the too many questions… 🙁
1) Yes, you can change this to 20 EMA
2) It just a possibility
3) No, they are two different, although you can combine the two
4) Look for the most recent highest peak and lowest trough – this will help you draw good fib levels
5) Everything around TA is approximations
6) No, nothing like this
7) This can pan across month, hard to put timelines
8) No guarantees here, but some traders expect at least a 50% move up from the time it starts to bounce
9) In fact, S&R is always a range and not really a specific price point. Yes, you can do this – essentially trade the range
10) Track the momentum and volumes, if both are supportive, then you can expect the target to reach R2. Otherwise, you can simply trail your SL and stay in the trade
11) Its best to close the position as soon as your target hits, this is especially true in intraday trading.
Good luck.
Hi Sir,
1. My Doubt was,how should a intraday trader need to close his position, when the STOPLOSS is hit and not on TARGET hit?should the trade be closed immediately as soon as SL is hit?or should i wait to check whether that particular candle close below SL?If the price tough SL but that 15 min candle closes above SL can i continue with the trade?
2.Also can you explain how to check whether there is a possibility of bollinger band expansion or not?
3.How to place a trailing stop loss? what are the rules(math calculation) behind it with respect to target?-(please explain in detail)
4.If there is a small difference between the SL(low of the candlestick pattern) and Support, then on breaching of which value should the trade be closed?(explan it for both intraday and swing trading)
5.if the close and high difference is 0.5% and low=open ,can it be considered as marubozu?
1) Well, if the SL hits first, then the best practice suggests that you will have to close the position. This is best done upon the close of the candle. If the price closes above, then you can choose to continue
2) No defined way to estimate this, but usually, the expansion happens upon momentum build up
3) Check this – https://zerodha.com/z-connect/tradezerodha/zerodha-trader-software-version/bracket-orders-trailing-stoploss-sl
4) I\’d suggest you watch out for the support level
5) I\’d be slightly uncomfortable. 0.5% is slightly high for a marubuzo.
1.Which one of these do consider more sacred , manually drawn S/R levels OR Formula generated Pivot Levels…?
2. When we enable Pivot points in Kite, previous days levels are also visible, so suppose Yesterday\’s R1 falls between Today\’s Pivot and R1, can I consider that as a halfway take profit level and trail with remaining till Today\’s R1(if the trend is up) ?
3.For that matter if we zoom out any chart,many days/minutes/hours/weeks/months of Pivot points are visible, how far back can we consider the levels as our targets/stops ?
4. How do the Pivots differ on a daily and on all the shorter TF\’s…. Means will the Pivots levels be different on a 30 min chart and a 5 min Chart ?
Thanks…
1) I prefer the manual S&R
2) This is exactly the reason, I\’m not too fond of Pivot Levels. It\’s a little too fickle for my liking
3) This depends upon your risk appetite
4) Yes, this is possible. In fact, this happens for manual S&R as well.
Please explain how to set target price with Fibonacci, I have seen some people give target price even for newly listed companies like DMart. They give long term target. Target in charts where price is at all time high and also for other.
From my experience, Fib retracements are best for identifying retracement levels – you can use the same to identify targets by looking at the ratios. I\’ve explained this in the chapter.
How to view fibonacci retracement in kite mobile app… Since i didn\’t find fibonacci retracement? And how to view S&R?… In pivot function i find S&R, but in stocks like saregama and titan etc S1 is showing in 600 levels… R1 & R2 below the current market price and R3 is above CMP… How is this possible?
On Kite Mobile App, in the Chart screen, click on Settings>Draw. Under Select Tool drop-down, you will find Fibonacci retracements.
Support and Resistance levels vary based on the time-frame of your chart. I\’m assuming you chose a longer time-frame(Daily or Weekly), since your seeing 600 as support for Titan. A smaller time-frame will have updated S&R levels
Pivot points are static lines calculated on the values of the previous period(35 candles), they don\’t change with the market price. If the LTP is higher than R1 and R2, it means that the scrip has broken resistance twice in this period and S&R levels will reflect in the next period
Hi, is there a way to change the fibonacci settings in pi ?
What changes are you talking about, Alnoor?
Hi,
I have a question on drawing the Fib retracement line. If after drawing the line if a new low or high happens should the line be extended to that new low or high
Fib is drawn based on the previous high and low – considering this, its best not to extend this.
Will it be possible for your team to include the 127% Fibonacci retracement level in Kite and Pi?
Need to check on this, Swapnil.
Hi Karthik,
What is the most suitable time frame between a low and peak for fibonacci charts for medium to long term investments? If the low is formed, in say, December 2016 and the peak is in April 2017, is this period long enough to form a meaningful fibonnaci charts? Say, another peak is formed in August 2017 which is higher than that in April 2017, will the charts now be created for the period from December 2016 to August 2017? Till what period will the low of December 2016 be used for creating the fibonnaci charts?
Thanks.
It should ideally be separated by at least 10-12 trading sessions for short trading frequencies…for slightly longer term, I\’d suggest at least 20+ trading sessions.
how to calculate EMA and standard deviation
Explained in the MA chapter.
u said that many platforms alredy provide calculated ema and u gave a example regarding sd
You can use the \’Bollinger Band\’indicator for standard deviation measurement. EMA is calculated based on the time period you choose. Both of these are available on Kite.
Hi
Can we use Fibonacci for intraday or equity futures
If yes
Intraday : How many days should i consider? candle stick should be in hours or mins or days
equity futures: How may days should i consider ? candle stick should be in days or hours
Yes, you certainly can. Not an issue. I\’d suggest you look at 15 mins candle for at least last 3-5 days.
Do we have Fibonacci retracement drawing tool in kite??
Yup, please click on draw…and select fibonnaci under \’select tools\’.
Hi Karthik,
Earlier you had mentioned that you will bring out a module on \’Trading Strategies and Systems\’. I was awaiting for it but I cant find the link for it anymore. Please help.
Thanks
Shantanu
Shantanu, I\’m working on Risk Management. In trading strategies, I mail plan to discuss few arb strategies.
Karthik sir could you please explain only 1 intraday setup for nifty which have good accuracy.
Will write about everything I know in the Trading Strategies module, Pawan.
Hello Team,
Can you please let me know how to apply Fibonacci retracement in Kite (desktop browser) ?
Regards,
Gautam
I\’d suggest you attend one of our online demos here – https://www.youtube.com/user/zerodhaonline , subscribe to the channel and you will get a live notification when the demo is on. We conduct the demo twice a day.
Hi Karthik,
Request you to make a video on PI scanner and how to use it to scan stocks using multiple trading strategies.
Regards,
Mitesh
Have you seen this – https://www.youtube.com/watch?v=uqKtFl46P2Y
Hi Karthik,
Thanks for sharing this topic, as you may aware of that Elliott wave theory and Fibonacci retracement are co-related to each other and I am not an expert in Elliott wave but I am still learning, so my concern here is, the Fibonacci tool which is available in the Kite does not suffice or partially suffice the purpose of Fibonnaci retracement . In Elliott wave and Fibonacci there are three aspect of retracement 1) Reracement measuring high low point. 2) extension of retracements. 3) Projection of retracement. In Kite there is no option for Fibonacci projections which is measure draw back.
Note : Fibonacci projection is based on A – B – C price movement, for an example 0 -A is the first price movement, and it will retrace to B point (opposite direction), after retracement we can project the next price movement from end of B, measuring how much wave C will retrace like 127%, 161%….of wave A or you can visit this link http://www.chart-formations.com/fibonacci/projections.aspx
If you could bounce it off this to your technical team and make them to understand the importance of Fibonacci Projection that would be great.
Thank you,
Raghunath
Raghunath, sure I can. However, I\’m not sure if they would be of any help. We use a 3rd party charting engine and this is really upto them to modify the indicators. Let see what best we can do about this. Thanks.
Any progress on Fib projection / Extension tool.. this will be really helpful in exiting position. Thanks any ball figure date when it will be release or if work has been started on this request ??
Puja, I guess these indicators/studies are already there on Kite.
Zerodha site explains all the concepts very nicely and in a simple language. I am referring the material for Technical analysis. Most of my doubts hv got cleared. Thankyou for putting in so much efforts. God bless you.
Glad to know that, Radhika 🙂
Respected Sir, I am a small Intraday trader & having almost less knowledge in trade, but this above mentioned suggestion is really useful & effective for me, Sir I only trade in Crude-oil, so before doing any assumption as per Fibonacci calculation how can i identify the trend in Intraday, whether it would go upside or down-worth…Sir, if you kindly help me on this by giving your valuable suggestion…I\’ll be grateful to you..Thanks
If you are new, I\’d suggest you take this one step at a time, Manas. I\’d suggest you do small EQ trade before taking up leveraged products.
thanks for your valuable suggestion sir, but in equity also how can i determine the trend…if you kindly help on this…that will be very much helpfull for me…thank you sir
There are many tools to evaluate trend, Manas. Something as simple as Moving Averages will help.
Sir, are you talking about MACD…
Yes, you can include MACD to the list as well.
Sir, i know i am disturbing you by asking several question…but hats of to your patience sir…one more thing sir…which MA period will be best for intraday trading along with MACD…
This is not a disturbance, Manas, its learning for all of us 🙂
Try the default MACD parameters, to begin with.
Thanks for the explanation. I didn\’t find Fibonacci in Zerodha Kite. Is it available only in Pi?
Yup, it is!
Hi,
Can you please share link of any video that has been created to explain the Febonacci tool on Zerodha kite and PI. How to draw it and how to follow the steps while trading using it. I am active Zerodha user but I always have a challenge in placing the febonacci tool and looking referring it while trading on Kite. Please help me with it. I have searched on Zerodha channel on youtube but I never find any video for febonacci tool.
Suraj, no we do not have any video on this, maybe we can make one sometime soon.
Hi Karthik,
No problem and Thanks for reply.
Cheers!
Fibonacci Retracement tool is not present in Kite at the moment. Could you please add the functionality in Kite. The tool is very helpful and I remembered using it in the old version of Kite.
I just discovered it in your past reply. Sorry for posting the same query.
Happy learning!
Retracement is present – click on draw – select tools, and then select Fibonacci.
Hi Sir, I am unable to find the Fibonacci retracement on KITE studies. Please advice. Does it exist under a different name or is there any other setting change needed for it to appear under studies in KITE. Thank you.
It does, click on \’Draw\’ and then select tools (left hand top), 3rd option is Fibonacci.
Hey, I can\’t find this chart in kite? it was there earlier, but since couple of days back when the UI was changed, I am unable to find this chart.
I think you should tune into the webinar Nithin is conducting today. He will help you understand whats new in Kite charts. Keep a look out here – https://www.youtube.com/user/zerodhaonline
the price going below 61.8% and might get to 100%, look the chart at https://ibb.co/bCK5Vk . at 61.8% a bullish harami pattern is formed with volumes crossing slightly the average volume of last 10 days but still why the price declined ? was it because day after pattern the earnings were declared and were not as per expectation. the chart is for infosys.
Well, patterns can fail. Please remember, CS pattern does not guarantees an outcome. It only enhances the probability of an expected outcome. Also, when you have fundamental news in the corner, please do not consider any CS patterns, however attractive it may look.
HI,
Over what time period does the Fibonacci retracement add the best value based on your experience? A stock may go up over a period and fade back over the next couple of days.. In this case does this indicator add value or is this good only for intra day parabolic peak up or peak down?
I really appreciate your response.
Thanks,
Ajmal
You should try this on slightly larger time frames like 3/6 month. Good luck.
hi,
Do you have any plan to include fibonacci extension tool in zerodha pi software soon?
Guess it is already there. Please email – [email protected] for clarification.
1)sir , if there is gap up opening , forming 2-3 long bullish candle and after that the stock started to retrace ; In this situation which low point should i take for drawing Fibonacci Retracement Either the Low of gapup candle (OR) the low of the candle which is below the gap?
2)can we still draw Fibonnacci if there is no lower shadow?
1) Include the gap
2) Yes, you can.
The same for macd with sma\’s.
Moving averages are providing more useful information as compare to macd.
Again, I\’d prefer MA!
Compare to Fibonacci retracement is it better to use support & resistance? Pls suggest.Else Fibonacci can give any additional information for better results. After checking iam not getting such information.
I\’d suggest the regular Support and Resistance as opposed to Fibonacci.
how to draw fibonocci extennsion in pi?..iam unable to find the tool..
It is quite simple. I\’d suggest you speak to [email protected] for this.
If we select pivot points indicator and further select the type as Fibonacci, the lines are automatically constructed. Are these lines drawn in conjecture with the logic of drawing fibonacci lines i.e. does the indicator automatically plot lines based on highs and lows?
Yes, on a stand alone basis, fib plots these lines based on highs and lows. However, I cant seem to understand the role of pivot points here.
I mentioned Pivot points as the Fibonacci lines are plotted only by selecting \”Pivot Points\” in the \”Studies\” section. Additionally, since these Fibonacci lines are not showing the ratios, it becomes slightly confusing to understand if these lines are plotted correctly.
You can make the ratios appear, I\’d suggest you email [email protected] for this.
Ok Thanks
Dear Karthik,
Shall we use FIB studies only for finding a suitable time for entering in the trend or we can try for making something in the retracement itself. For example: Attached chart is of Axis Bank, down trend is almost of 191 points (from 7th Sep till 7th Dec).
Now FIB chart shows retracement upto 521 (38.2%) and 566 (61.8%). Shall we use these points as an additional confirmation for buying opportunity if all other pre-requisites (volume, s&r and pattern with indicator) are available.
https://kite.zerodha.com/share/XF1HK5KPKE.png
FIB should ideally be used to identify entry points in the direction of primary trend. I would hesitate to initiate trades in the direction of the retracement.
Dear Karthik, a very basic suggestion if possible, while reading The Varsity chapters, user is not able to see the main content on full screen as a locked grey area is always remain visible on the top of the screen containing links such as \”about, login, register etc.\”. As the main content of reading also include charts etc. it is best to see the full screen to make most out of it.
If possible, make the grey area visible or invisible depending upon the user\’s choice by giving a push up arrow there similar like you have provided a push down button with Modules tab on the top of the screen.
Thanks
Thanks again, we are working on a new design. Hopefully, that should eliminate all the readability issues 🙂
Thanks Karthik !
Welcome!
Dear Karthik,
I am currently using the Nest trader pack that Karvy has provided me just to help me see the rates at a quicker pace,i\’m new to stocks and just started to know various aspects in tech. analysis and i have one question that\’s bothering me immensely which i hope
you can provide some valuable insight on,so here it goes –
I have observed that different people draw the fibs in two distinct ways,some draw it from top to bottom while some do it from bottom to top and that\’s pretty easy to spot as well because once they finish drawing it,in some charts the fib percentage looks like 38.2,50.0 and 61.8 while in some it\’s like the total opposite.
Just to be even more sure,i looked at the trend to the left of the screen as well to make sure the trend is the same irrespective of the examples i have gone through so let\’s say,the trend was down and the fib retracement tool was used…..in some charts the fib percentage levels were contrasting in nature.Some had 38-50-61 while some had 61-50-38.Please help me out on this as i don\’t want my
initial learning to go wrong.
Cheers.
Hi Vijay….the way you draw the fib retracement really depends on what you expect. If you expect the market to re trace after an up trend therefore looking for a buying opportunity, then you would draw it from bottom to top. Likewise, if you expect the market to re trace after a down move, therefore looking for a shorting opportunity, then you would draw it from top to bottom.
Remember, retarce here means, the price moves in the opposite direction of the trend.
I see….that soothes the mind a whole lot & thanks for such a quick quick response.
I owe you one!
Cheers.
Welcome!
Very good question. Had same doubt. Thanks got cleared:)
In lot of videos, they talk about 1.27 extension and others as well. 1. How to draw those and change properties of the fibonacci series? 2. There are also retracements drawn from top to bottom and then in the future as well. Can that be done in Pi/kite as well, and how?
Yes, the Fib indicators are available on Kite, I\’d suggest you give it a try. For general queries on chart, I\’d suggest you check here – https://kite.trade/docs/kite/#charting
Hi,
How I can change retracement setting values. I want to change like 0,33.33,66.66,100.
Few softwares do provide you options to customize.
Dear Karthik,
How to draw Fibonacci extentions. Thanks
I\’ve explained this in the chapter itself, request you to read through.
when will we have fibonaccy in kite?
It is already there, please click on \’Select tool\’ and click on the option available.
I didn\’t found fibonacci indicator in kite charts. I looked for every indicator.
It should be these, let me check this and confirm.
sir, in bank nifty option trading which charts we can look
Depends on your time frame, if you do intraday trades then 5 or 15 min chart is ok, else EOD for swing trading.
Sir in option trading which tools are familiar
Sorry, dint get that.
Some times it is seen that the candlestick on the bottom or top have a large tail, so which point we should consider candlestick body or tail, as to use Fibonacci tool or to draw trendline
Candle body should be good enough.
If a stock has moved 5-8% in last 5 candlesticks (5 mins per candle), Can I use Fibonacci retracements here?
Yes, you can.
Hi Karthik
Can the fibonacci ratios (23.6%, 38.2% & 61.8%) be used as support and resistance levels??
Regards
Dipankar
Yes, you can.
What is PayIn and PayOut Obligations? How is it charged?
Payin is when you want to transfer funds to your trading account and Payout is when you want to withdraw funds from your trading account. More details here – https://zerodha.com/funds-transfer
Karthik Sir, According to my understanding….percentage levels marked on last graph(uptrend) should be the other way i.e it should start with 0% to 100% from top.Am i correct or not?????
Hmmm…need to check this Vishal. Thanks for pointing it.
100% to 0% is correct.
Think of it this way. Suppose the rally was of 100 points. So, you are now 100 points higher from where rally started. Now if stock retraces 23.6%, it means that the stock has shed 23.6% of the total rally and come down 23.6% from the top. So, the 23.6% line is drawn from the top.
Im not able to install Pi in my mac due to some issues, what can i do? please help me
Pi does not work on Mac.
Hello Karthik,
I just have a question regarding Fibs so here it goes….most of the videos i have seen about Fibs are historical in nature i.e. they go back in time in order to explain how it works which is fine since they are trying to make us understand how it actually works.
In real time,it\’s a different ball game altogether,isn\’t it?I mean the retracement or extension can be any percentage…..right?
There is no guarantee it will go to a certain percentage and then go in the opposite direction depending on short,medium or
long term.
So,the 2nd part of my question is…..it\’ll be more beneficial if Fibs is used along with other indicators so that we atleast get a better idea
about how things are shaping up,will that be a reasonable way of looking at it?
Regards
Vijay
Yes, it does. In fact all indicators give you a perception on whats happening at a broad level. You will have to use this and make trading judgements….but make sure you are not entirely dependent on this.
Thanks a lot for the quick reply mate.
Cheers!
Cheers!
HI KARTHIK RANGAPPA
In intra-day 5 min time plot from 9.15 to 10.15 taking High and low of 1 hour will this be help full ?
I am using BB and MACD on heikin ashi
waiting for your replay …..
I\’m not too familiar with heikin ashi, so cant really comment. But in general 5 mins is good if you want to scalp the markets.
Hello Sir, In the last para you have mentioned that \”if the stoploss also coincides with the Fibonacci level then I know the trade setup is well aligned to all the variables and hence I would go in for a strong buy\”.
My query is that, after a downtrend, when we mark the top & bottom of the trend then how can the stoploss coincide with fibonacci levels (reason being that the low of the trend forming a recognizable pattern is itself set as stop loss for the long order).
Please correct me or guide me !!!!
Thank You very much !!!
SL coinciding simply means that the low of a pattern also coincides with the fib level…this generally gives a better confidence.
Sir , Intraday trading , Which is the best candle to refer , 5 minutes or 10 minutes time frame candles.
Thank you sir
10 mins. Higher the time frame, the higher is the quality of information and lower the noise component.
Sir, your trading experience which are the indicators are best for intraday trading.
I personally prefer the combination of moving averages, S&R, and candlestick patterns.
Sir, Fibonacci indicator which level can i take for 1 st target for uptrend, 61.8 % or 23.6 % ,38.2%
The usual practice of traders is 38.2%.
Dear Kartik,
Hats off to you bro for your valuable and altruistic efforts. I just wanted to request you for a bit more favour. Can you add a separate section for GANN Analysis? I am sure it will make our weapons more sharp.
Will try my best to include this, as on now work is in progress for option strategies.. maybe after that.
I have seen video in YouTube in it referring to 100, 161.8, 261.8 bounce after retracement..any relevance…any input about Eliot wave and heikinashi..Thanks
Ah, not too familiar with Elliot wave and Heikinashi, so cant comment.
Hi , I have got the fibonacci indicator in KITE. Thank you sir.
Welcome and good luck!
Sir, how you got it in kite, I cant find
On Kite Mobile App, in the Chart screen, click on Settings>Draw. Under Select Tool drop-down, you will find Fibonacci retracements.
On Kite Web, in the Chart screen, you\’ll find the Draw button. It\’ll open a Select Tool drop-down, under which you will find Fibonacci
Hi, I took help from Sreenivasulu, he didn\’t find Fibonacci indicator in Kite. Hope technical team has to add it…
Let me check Abhilash, will get back as as soon as I can. Thanks.
Not able to find indicators in both Pi and KITE.
Open the chart in Kite and click on \’Studies\’ and you will get the list of indicators. There are close to 100+ indicators in Kite. There is an idicator drop down menu in Pi..quite easy to spot actually.
Hey Karthik
I am also not able to find the fibonacci indicator in studies list. Could you please help us with exact name of fibonacci indication on kite platform ?
It is not in the Studies. Click on the \”draw\” icon and then select Fibonacci.
Hi Karthik, I went through few calculation y using Fibonacci Retracement. Please do have a look whether I am doing right or wrong.
I took Union Bank Dec Future and chosen 1 DAY candle delay.
Recent High = 185.90 , Low : 156.
185.90 – 156 = 29.9.
then, 29.9 * ( 0.168) = 18.478. ( I took 61.8 % of the ratio).
Add upon 156 + 18.478 = 174.478.
174.80 was the recent high on Dec 1. Hope the calculation is right. Thanks in advance.
But then you use the ready made indicator to identify the values, why are you calculating the same ?
Hi Karthik, Fibonacci Retracement is mind Blowing. Also I have checked Golden Ratio as a separate article. I was melting by Golden Ratio. The Universe and most of the things have an application of Mathematics and fibonacci calculations. Really amazing stuff because of this platform. :).
I have a doubt on fibonacci Retracement, We need to calculate the difference between Rally started and Peak level of it to get a number to which we have to calculate 61.8% / 38.2% / 23.6 % of that value. My question is there any restriction to it, by means,
1. Nearest Low and High difference and
2. Around 1 month / 3 month High and Low difference
No such repstrictions to it…just identify the recent high and low, connect them and identify the levels.
Dear Karthik
Sorry for bugging you but I hope you understand my doubts as I am a novice.
In the last example you gave in this chapter Step 1 is Identify the immediate peak and trough. In this case the trough is at 150 and peak is at 240.
But I can see after the trough at 150 the immediate peak is at 187 and 221, then trough at 191, peak at 225, trough at 191 and then finally peak at 240. Marked peaks in red and troughs in blue.
Is my judgement of peaks and troughs wrong?
Thanks in advance
Vivek – this platform is meant for sharing knowledge and asking questions, so please do not hesitate.
Yes – your points are valid…its just that I\’ve taken this for a longer period you are looking into shorter time frames.
Sure. I will… Thanks again for your effort..
Karthik – I\’m familiar with EA\’s and how it gives auto buy/sell signals in Pi. Can i consider stock scanner and pattern recognition would do the same functions what EA\’s do.. Thanks..
Prabhu – I would suggest you get in touch with [email protected] with regards to queries on Pi.
Thanks Karthik. Could you explain scanner and pattern recognition options with some example. Does it apply for both intra-day & Delivery.
Is it useful to find out past history(Like back testing) of the specified scripts or we could use these to understand current(Intra-day)/future trend of the specified scripts. Thanks again for the articles which you guys posted here…
Prabu – have you checked out the exper advisor feature on Pi? Check this – http://zerodha.com/z-connect/tradezerodha/pi-tradezerodha/eas-for-auto-buysell-signals-pi
Hi Karthik,
How we can ensure that we\’ve selected right peat annd low points. i tried some but when i verified with formula, i do notice there was some difference values like 0.1 to 0.5.. could you clarify this..
To do this you need to refer to the recent peak and recent low, just connect the two and you should be able to see the results. Are you using Pi?
Yes. i\’m using Pi. below chart shows Fib retrace which i created for LTFH (15 min chart). Could you clarify whether did i choose correct peak and low.
This seems fine to me Prabhu. Am;I missing something?
Karthik bro,
Did Prabu tried to drag lines in wrong direction?i,e from right to left?? I am confused
Thank You!
Since he is trying to identify a reversal to the top I guess right to left makes sense.
I didn\’t understand the last graph in para 16.2. In the graph the lines are from 100% to 0%(up to down) but shouldn\’t the lines be from 0% to 100%(up to down). I mean the stock price retracing 61.8% should be lower than 38.2%. Isn\’t it??
I am confused in that.
This can be a bit confusing, but let me attempt…..So if a stock has rallied from 50 to make a new high say 60 then the move from 50 to 60 is considered a fresh 100% move. A decline from 60 to say 55 is considered as a 50% erosion of this 100% move….likewise a decline to 50 from the high of 60 is considered a complete 100% erosion of the latest upmove (i.e from 50 to 60). I know it is a bit confusing but I hope this helps you clear up some doubts !
I am not using TA in CE/PE options chart. In Nifty futures contract only iam using TA and after getting confirmation, taking positions in Nifty Call/Put options.. Am i in the right path sir?
Absolutely. Many people end up making the mistake of applying TA on Options, which is not really a good practice.
Then what is the way to decide entry, exit & stop loss in options w/o TA?
Many other ways, I\’d suggest you read this – http://zerodha.com/varsity/chapter/getting-started/
I am trading in Nifty index options using tech analysis like Candlesticks, fib retracement, S&R, OI change etc and it\’s working fine . But while studying the 1mins chart the opportunities for trading in nifty is more compare to 5mins. As a scalper it\’s the chance to trade more with min targets. Provide your comment on the usage of 1min chart particularly in nifty index options. While using 1min chart how many days i have to load to plot the fibonacci retracement?
Vasanth, few things to note –
1) Please do not use TA on Options chart. It does not work.
2) Higher the frequency of time period better is the quality of signal. Going by that I would say 5 mins is better than 1 min….and 15 mins better than 5mins..so on and so forth
3) Also, please do not get into scalping if you are new to markets. I would suggest you try simple day trading to get a hang.
@Karthik,
Which charting you were using before Zerodha Pi?
Amibroker or Metastock?
Metastock….I\’ve used the same for over 8 years now 🙂
As suggested while using 5 mins candle stick chart, 9Mins/21Mins candle to be loaded. In the 5 mins chart how can i load the 9mins candle for plotting the fib retracement? In the uploaded chart i counted the 21candles for plotting. After the 22nd candle formation whether the retracement to be moved further after the 5min candle formation? Please clarify with example…
I\’m sorry there seems to be some confusion. The 9 & 21 day should be used for moving averages. For Fib ratios, just connect the recent high and low point and get the retracement. It could be done on the 5 or 15 mins chart.
Sir, 9/21Mins or days?
9 & 21 Mins since you would be referring to intrday charts.
Dear sir,
You generally refer it 9*21 min or 9*21D , why can\’t you say it simply 9*21 candles irrespective of the chart/timeframe individual is using, when it is applicable to to every timeframe candlestick either it is an Intraday (5, 10, 15 min ) or day or week chart.
Regards
For intraday, it would be minutes and for EOD it would be day data.
As mentioned above 9/21 days data can be loaded to plot Fib retrace…If iam using 5Mins candlestick pattern for decision, which time period data will be the best?
You can still go ahead and use 9 minute and 21 minute to plot this.
Is it recommended to use 9×21 days EMA for making positions in hourly candlesticks? or should one convert it into 9×21 hours EMA?
You certainly can, Nishant. Give it a try and see what kind of results you get. You can always improvise.
How to select a low and high for fibonacci retracements? Should there be a minimum gap between low and high?
I use KST and MACD crossovers to identify low and high? Is my method correct?
Thanks in advance.
Fibonnaci Retracemets are used to identify ans set up trades on slightly long term perspective so its always good to select the high and low from a 1 -2 or maybe upto 3 months perspective. I\’m not sure if KST or MACD is really helpful in doing the same.
Thank you.
Can we get a chapter on fibonacci extensions also?
Thanks for the suggestion Anil, will try and add that sometime soon.
Hi Karthik,
In the NSE website, the chart calculates the Fibonacci Retracements based on the closing prices rather than the exact high or low points. This is my observation. So my doubt is, whether we need to use the actual lows and highs or the closing prices on that day? Which is more reliable?
Thank you,
Regards
Thiyagu
Unless there is a huge spike which tends to create a long candle tail, it may not make any difference. I would suggest you stick to the closing prices as well.
Can Fibonacci indicators use in intraday 5. & 15. Minits charts if. Yes, how to use
Yes, you can. Use it the same way as you use for EOD charts.
FIB Retracement module is very informative.There should be module on Fib Expansions also.
Sure, hopefully sometime soon 🙂
Can we say that more sharp/steeper the previous up/down move, the higher the likelihood of retracement being stretched towards 61.8% than say 23.6% or 38.2%?
Intuitively, I would think the other way round. The sharper the move, the lesser the retracement. The reason being – people usually miss sharp moves, they would wait for retracements so that they could take positions. Hence a 23.6% or 38.2% is more likely compared to a 61.8%.But as I said, this is just intuitive 🙂
Gann cycle work perfectly then why people use other failed methods . i request zerodha to literate traders about Gann cycle method
Is my understanding right on the below?
You said, \”For example, the first level up to which the stock can correct would be 61.8%. If this stock continues to correct further, the trader can watch out for the 38.2% level. So on and so forth.\”
In the above case, you said that the first level retracement is up to 61.8 and then look for 38.2 and so on. So, if I calculate the 38.2 and 26.3 of the Fibonacci move, obviously it will be less than 61.8. Then, how come these will be the next levels. Correct me if I am wrong.
As I understand, the first retrace may be 23.6 and if it breaks we can wait for 38.2 and so on.
I am trading options, can I use last 9 trading days data of nifty or bank nifty to identify the next retracements? or suggest me with suitable days. I might hold the position for 2 days to 1 week, which will be best?
Thank you
Thiyagu – You are absolutely correct, an obvious typo error. Thanks for pointing this, will make the corrections right away.
For short term trading, I personally prefer 9 or 21 day data points.
It is very important that we identify the reasonable upmove or downmove. The moot question is what constitutes this reasonable / significant move? What should the bare minimum move in terms of % with respect price of the particular scrip?
Are you referring to the prior trend up move or down move? If yes, I usually like to look at last 5 days trend…I consider a move over and above 5-8% as reasonable.
Is it fair to look at the prior up/down move of only last 5 days ? In the examples given above also it seems the prior uptrend / downtrend extending to large no. of days or even weeks for that matter.
Also, what should be the signal that trend might get reversed? Or we must wait till we get the confirmed signal of reversal of trend?
The larger the look back period, the better. However if I have to put a minimum number to it then it would be 5 days. I guess it pays off to wait for a confirmed signal which indicates the trend could be reversing.
in nest chart spot there is premarket values inclueded which distorts values. can you set right the problem so that i can give data with dates.
for eg. on 10 nov 8264 is low but nse site gives 8304 low for that day.the reason being values of 9 to 9.15 taken
Yeah, Ashok. I\’ve seen this distortion that you mention. Thanks for reporting it. We\’ve sent this over to our developers and hope to have it fixed within the next few weeks. 🙂
hanan, can u make a video on fibonachi and mail that will be much better to understand ,
Will pass that message to him 🙂
now a days rather than fibonacci levels what i have observed is retracement of 33, 42 to 45, 52 and 65 to 68 percent range. just accidental or what i want to know. to be precise i dont have data to give but i hope ypu have them to check and reply.
Without actual data this would be hard to verify 🙂
D/sir
I am zerodha customer and make my trade through kite by Android phone only. Is there is application on chart for Fibbonacci retractmen
Retracement is available on Kite, request you to give it another look. Thanks.
Don\’t think it\’s available on kite
Its available.
1.open any chart
2. click on draw (which is available after cross hair and info. has pencil icon )
3. in select tool select Fibonacci.
4. click latest lowest point on the chart and move the cursor to highest high
FIBONACCI EXTENSION DRAWING TOOL ISNT AVAILABLE ON ZERODHA. KINDLY MAKE IT AVAILABLE.
Its available, Shreyas. Please check the studies.
Sir, I am unable to draw the Fibonacci levels from mobile at kite app. If there are any tutorial videos regarding drawing of Fibonacci. Would be helpful for me.
What is the problem that you are facing, Suraj?. Maybe you should call our support executive, they will help you with it.
The concept of fivonachhi is not available in Zerodha Kite platform. Kindly intimate how can I apply the fivonachhi retracement in zerodha kite.
SANTANU HALDER
USER ID : EO3455
Santanu, I\’d suggest you speak to our customer care desk for this, they will help you with it.