18.1 – Trading Range
The concept of the range is a natural extension to the double and triple formation. The stock attempts to hit the same upper and lower price level multiple times for an extended period of time in a range. This is also referred to as the sideways market. As the price oscillates in a narrow range without forming a particular trend, it is called a sideways market or sideways drift. So, when both the buyers and sellers are not confident about the market direction, the price would typically move in a range. Hence, typically long term investors would find the markets a bit frustrating during this period.
However, the range provides multiple opportunities to trade both ways (long and short) with reasonable accuracy for a short term trader. The upside is capped by resistance and the downside by the support. Thus it is known as a range-bound market or a trading market as there are enough opportunities for both the buyers and the sellers.
In the chart below, you can see the stock’s behaviour in a typical range:
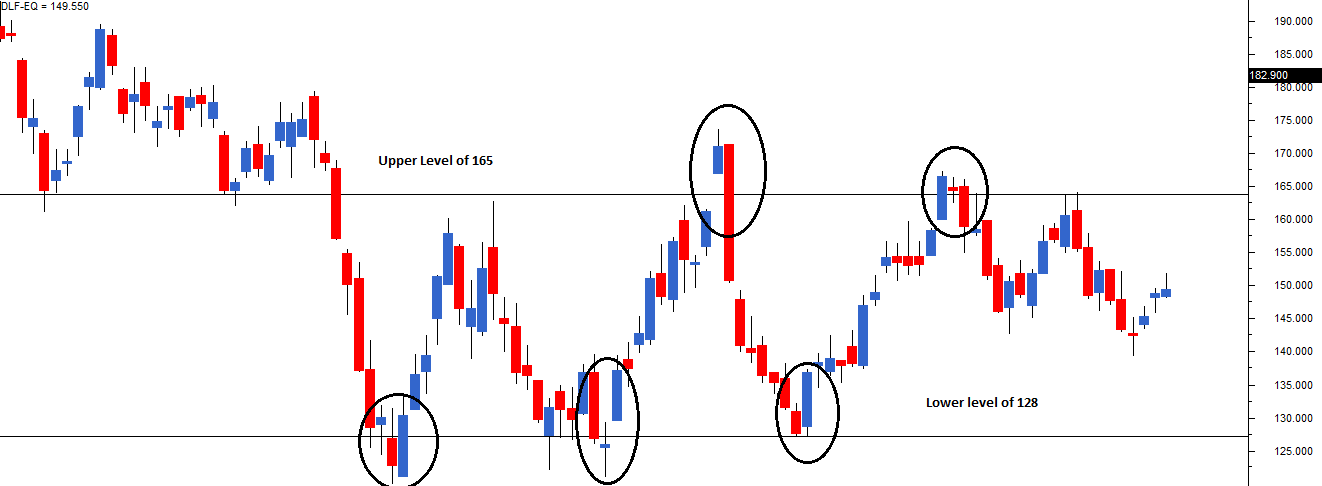
As you can see, the stock hit the same upper (Rs.165) and the same lower (Rs.128) level multiple times and continued to trade within the range. The area between the upper and lower level is called the width of the range. One of the easy trades to initiate in such a scenario would be to buy near the lower level and sell near the higher level. In fact, the trade can be both ways with the trader opting to short at a higher level and repurchasing it at the lower level.
In fact, the chart above is a classic example of blending Dow Theory with candlestick patterns. Starting from left, notice the encircled candles:
- The bullish engulfing pattern is suggesting along.
- Morning doji star suggesting along
- Bearish engulfing pattern is suggesting a short
- Bearish harami pattern is suggesting a short
The short term trader should not miss out such trades, as these are easy to identify trading opportunities with a high probability of being profitable. The duration of the range can be anywhere between a few weeks to a couple of years. The longer the duration of the range, the longer is the width of the range.

18.2 – The range breakout
Stocks do break out of the range after being in the range for a long time. Before we explore this, it is interesting to understand why stocks trade in the range in the first place.
Stocks can trade in the range for two reasons:
- When there are no meaningful fundamental triggers that can move the stock, these triggers are quarterly/ annual result announcements, new product launches, new geographic expansions, change in management, joint ventures, mergers, acquisitions, etc. When nothing is exciting or nothing bad about the company, the stock tends to trade in a trading range. The range under these circumstances could be quite long-lasting until a meaningful trigger occurs.
- In anticipation of a big announcement – When the market anticipates a big corporate announcement, the stock can swing in either direction based on the announcement’s outcome. Till the announcement is made both buyers and sellers would be hesitant to take action, and hence the stock gets into the range. The range under such circumstances can be short-lived lasting until the announcement (event) is made.
The stock after being in the range can break out of the range. The range breakout more often than not indicates the start of a new trend. The direction in which the stock will breakout depends on the nature of the trigger or the event’s outcome. What is more important is the breakout itself, and the trading opportunity it provides.
A trader will take a long position when the stock price breaks the resistance levels and will go short after the support level breaks.
Think of the range as an enclosed compression chamber where the pressure builds up on each passing day. With a small vent, the pressure eases out with a great force. This is how the breakout happens. However, the trader needs to be aware of the concept of a ‘false breakout’.
A false breakout happens when the trigger is not strong enough to pull the stock in a particular direction. Loosely put, a false breakout happens when a ‘not so trigger friendly event’ occurs, and impatient retail market participants react to it. Usually, the volumes are low on false range breakouts indicating; there is no smart money involved in the move. After a false breakout, the stock usually falls back within the range.
A true breakout has two distinct characteristics:
- Volumes are high and
- After the breakout, the momentum (rate of change of price) is high.
Have a look at the chart below:
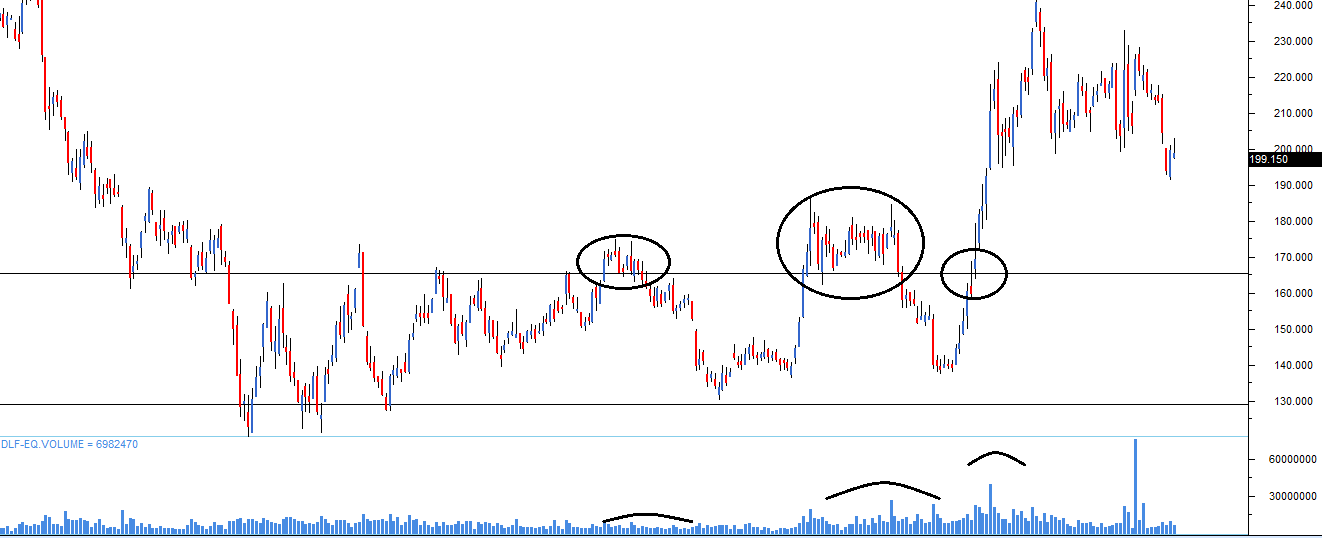
The stock attempted to break out of the range three times. However, the first two attempts were false breakouts. Low volumes and low momentum characterized the first 1st breakout (starting from left). The 2nd breakout was characterized by impressive volumes but lacked momentum.
However, the 3rd breakout had the classic breakout attributes, i.e. high volumes and high momentum.
18.3 – Trading the range breakout
Traders buy the stock as soon as the stock breaks out of the range on good volumes. Good volumes confirm just one of the prerequisite of the range breakout. However, there is no way for the trader to figure out if the momentum (second prerequisite) will continue to build. Hence, the trader should always have a stoploss for range breakout trades.
For example – Assume the stock is trading in a range between Rs.128 and Rs.165. The stock breaks out of the range and surges above Rs.165 and now trades at Rs.170. Then trader would be advised to go long 170 and place a stoploss at Rs.165.
Alternatively, assume the stock breaks out at Rs.128 (also called the breakdown) and trades at Rs.123. The trader can initiate a short trade at Rs.123 and treat Rs.128 as the stoploss level.
After initiating the trade, if the breakout is genuine, then the trader can expect a move in the stock that is at least equivalent to the range’s width. For example, with the breakout at Rs.168, the minimum target expectation would be 43 points since the width is 168 – 125 = 43. This translates to a price target of Rs.168+43 = 211.
18.4 – The Flag formation
The flag formation usually occurs when the stock posts a sustained rally with almost a vertical or a steep increase in stock prices. Flag patterns are marked by a big move which is followed by a short correction. In the correction phase, the price would generally move within two parallel lines. Flag pattern takes the shape of a parallelogram or a rectangle, and they have the appearance of a flag on the pole. The price decline can last anywhere between 5 and 15 trading sessions.
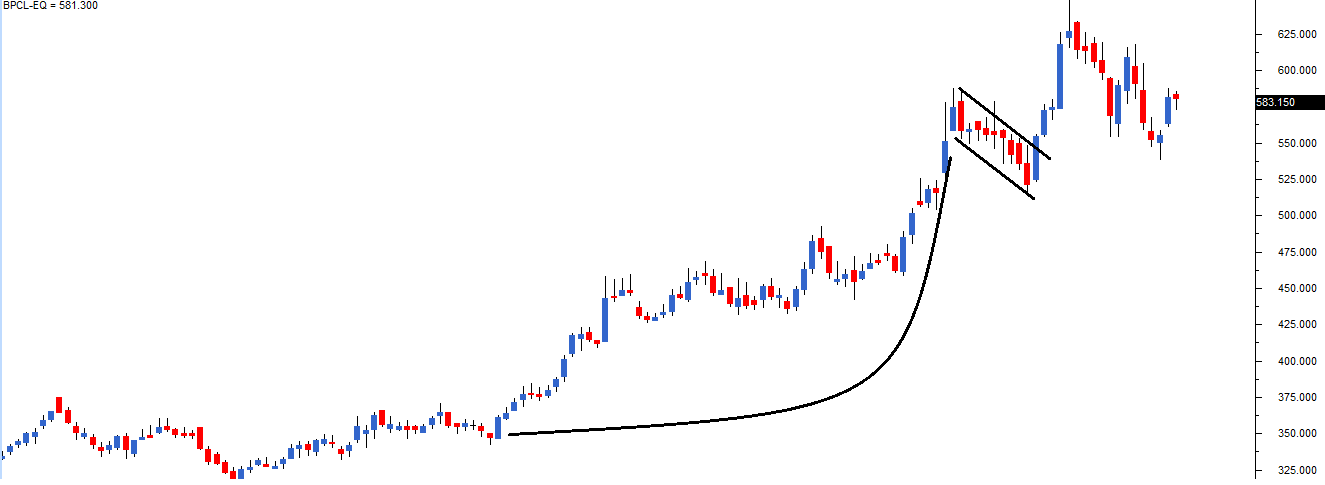
With these two events (i.e. price rally, and price decline) occurring consecutively a flag formation is formed. When a flag forms, the stock invariably spurts back suddenly and continues to rally upwards.
For a trader who has missed the opportunity to buy the stock, the flag formation offers a second chance to buy. However, the trader has to be quick in taking the position as the stock tends to move up suddenly. In the chart above, the sudden upward moved is quite evident.
The logic behind the flag formation is fairly simple. The steep rally in the stock offers an opportunity for market participants to book profits. Invariably, the retail participants who are happy with the recent stock gains start booking profits by selling the stock. This leads to a decline in the stock price. As only the retail participants are selling, the volumes are on the lower side. The smart money is still invested in the stock, and hence the sentiment is positive for the stock. Many traders see this as an opportunity to buy the stock, and hence the price rallies all of a sudden.
18.5 – The Reward to Risk Ratio (RRR)
The concept of reward to risk ratio (RRR) is generic and not really specific to Dow Theory. It would have been apt to discuss this under ‘trading systems and Risk management’. However, RRR finds its application across every trading type, be it trades based on technical analysis or investments through fundamentals. For this reason, we will discuss the concept of RRR here.
The calculation of the reward to risk ratio is straightforward. Look at the details of this short term long trade:
Entry: 55.75
Stop loss: 53.55
Expected target: 57.20
On the face of it, considering it is a short term trade, the trade looks alright. However, let us inspect this further:
What is the risk the trader is taking? – [Entry – Stoploss] i.e 55.75 – 53.55 = 2.2
What is the reward the trader is expecting? – [Exit – Entry] i.e 57.2 – 55.75 = 1.45
This means for a reward of 1.45 points the trader is risking 2.2 points or in other words, the Reward to Risk ratio is 1.45/2.2 = 0.65. Clearly, this is not a great trade.
A good trade should be characterised by a rich RRR. In other words, for every Rs.1/- you risk on trade your expected return should be at least Rs.1.3/- or higher. Otherwise, it is simply not worth the risk.
For example, consider this long trade:
Entry: 107
Stop loss: 102
Expected target: 114
In this trade, the trader is risking Rs.5/- (107 – 102) for an expected reward of Rs.7/- (114 – 107). RRR, in this case, is 7/5 = 1.4. This means for every Rs.1/- of risk, the trader is assuming, he is expecting Rs.1.4 as a reward. Not a bad deal.
The minimum RRR threshold should be set by each trader based on his/her risk appetite. For instance, personally, I wouldn’t say I like to take up trades with a RRR of less than 1.5. Some aggressive traders don’t mind a RRR of 1, meaning for every Rs.1 they risk they expect a reward of Rs.1. Some would prefer the RRR to be at least 1.25. Ultra cautious traders would prefer their RRR to be upwards of 2, meaning for every Rs.1/- of risk they would expect at least Rs.2 as a reward.
A trade must qualify the trader’s RRR requirement. Remember, a low RRR is just not worth the trade. Ultimately if RRR is not satisfied, then even a trade that looks attractive must be dropped as it is just not worth the risk.
To give you a perspective think about this hypothetical situation:
A bearish engulfing pattern has been formed, right at the top end of a trade. The point at which the bearish engulfing pattern has formed also marks a double top formation. The volumes are beautiful as they are at least 30% more than the 10-day average volumes. Near the bearish engulfing patterns high, the chart is showing medium-term support.
In the above situation, everything seems perfectly aligned with a short trade. Assume the trade details are as below:
Entry: 765.67
Stop loss: 772.85
Target: 758.5
Risk: 7.18 (772.85 – 765.67) i.e [Stoploss – Entry]
Reward: 7.17 (765.67 – 758.5) i.e [Entry – Exit]
RRR: 7.17/7.18 = ~ 1.0
As I mentioned earlier, I do have a stringent RRR requirement of at least 1.5. For this reason, even though the trade above looks great, I would be happy to drop it and move on to scout the next opportunity.
As you may have guessed by now, RRR finds a spot in the checklist.
18.6 – The Grand Checklist
Having covered all the important technical analysis aspects, we now need to look at the checklist again and finalize it. As you may have guessed, Dow Theory obviously finds a place in the checklist as it provides another round of confirmation to initiate the trade.
- The stock should form a recognisable candlestick pattern.
- S&R should confirm to the trade. The stoploss price should be around S&R.
- For a long trade, the low of the pattern should be around the support.
- For a short trade, the high of the pattern should be around the resistance.
- Volumes should confirm
- Ensure above average volumes on both buy and sell day
- Low volumes are not encouraging, and hence do feel free to hesitate while taking trade where the volumes are low.
- Look at the trade from the Dow Theory perspective.
- Primary, secondary trends
- Double, triple, range formations
- Recognisable Dow formation
- Indicators should confirm
- Scale the trade size higher if indicators confirm to your plan of action
- If the indicators do not confirm go ahead with the original plan
- RRR should be satisfactory
- Think about your risk appetite and identify your RRR threshold
- For a complete beginner, I would suggest the RRR be as high as possible as this provides a margin of safety.
- For an active trader, I would suggest a RRR of at least 1.5
When you identify a trading opportunity, always look at how the trade is positioned from the Dow Theory perspective. For example, if you consider a long trade based on candlesticks, then look at what the primary and secondary trend is suggesting. If the primary trend is bullish, then it would be a good sign, however, if we are in the secondary trend (which is counter to the primary), you may want to think twice as the immediate trend is counter to the long trade.
If you follow the checklist mentioned above and completely understand its importance, I can assure you that your trading will improve multiple folds. So the next time you take a trade, ensure you comply with an above checklist. If not for anything, at least you will have no reason to initiate a trade based on loose and unscientific logic.
18.7 – What next?
We have covered many aspects of technical analysis in this module. I can assure you the topics covered here are good enough to put you on a strong platform. You may believe there is a need to explore other patterns and indicators that we have not discussed here. If we have not discussed a pattern or an indicator here on Varsity, do remember it is for a specific purpose. So be assured that you have all that you need to begin your journey with Technical analysis.
If you can devote time to understanding each one of these topics thoroughly, then you can be certain about developing a strong TA based thinking framework. The next logical progression from here would be to explore ideas behind backtesting trading strategies, risk management, and trading psychology—all of which we will cover in the subsequent modules.
In the next concluding chapter, we will discuss a few practical aspects that will help you start with Technical Analysis.
Key takeaways from this chapter
- A range is formed when the stock oscillates between the two price points.
- A trader can buy at the lower price point, and sell at a higher price point.
- The stock gets into a range for a specific reason such as the lack of fundamental triggers, or event expectation.
- The stock can break out of the range. A good breakout is characterized by above-average volumes and a sharp surge in prices.
- If the trader has missed an opportunity to buy a stock, the flag formation offers another window to buy
- RRR is a critical parameter for trade evaluation. Develop a minimum RRR threshold based on your risk appetite
- Before initiating a trade, the trader should look at the opportunity from the Dow Theory perspective.
Hi Karthik,
a. Your 4th Point in the checklist- How does primary trend help us in trading? I can understand about secondary trend. Shouldn\’t Trading be short term and not looked from long term perspective?
b. If I want to see a primary downtrend, should I be looking at a stock which is not performing well since a last couple of years? For Ex: Yes bank
Thats right, but knowing about the primary trend gives you a sense of where the market is headed in the longer run and when likely the secondary trend is likely to reverse.
Hi Karthik,
Someone asked you about shorting for a few days and you said \”The idea is to short the the stock via futures and options. With this, you can roll the position for overnight positions.\”
How do I Learn this? Do I have to complete until Module 6(Option Strategies) and then start Trading?
Yeah, do read through at least futures module to get a sense of how to short.
Greetings Karthik Rangappa Sir. I have a doubt, If I am trading futures which timeframe for candlesticks do you recommend to use, for example 15 mins, 30 mins, etc. Which would be the ideal one to find the trends? Also currently is there no trailing stop loss feature on Zeordha? Is there a possibility of it coming back?
There is no such thing as an ideal timeframe, it all depends on your trading activity. I would still be ok to trade intrday using EOD chart. But many prefer using 5 or 10 mins. That said, I\’m not a fan of 5 mins, I prefer slightly longer time frame like 15 mins for intrday trading. You can use GTT for trailing SL. Also if its intraday, then maybe you can trail it manually, I think that gives you better control.
Thank you for replying to my comment and for the advice. I have one more doubt and it is regarding the trade exits, you mentioned earlier that if we are going long then keeping the resistance point as exit is viable and vice versa for shorting, i.e. the support point. However when trading futures, the resistance and support seems too far fetched, is there any other method or strategy that increases the probability of profit booking keeping RRR in perspective. Is there any other good trading exit points that is worth looking for?
Agree it feels far fetched especially when you have a leveraged position. However, why not try the trailing SL method to book profits? Basically start with a certain target price in mind, once that is hit, move you SL higher. This was at one point you will be locking in higher profits while also paying attention to stoploss.
Hi karthik Sir,
I completed till Dow Theory ( Part 2 ) TA, I have understood most of the topics, however in some topics I still have doubts and seems like need to visit again. However at this point, I am not sure, how to proceed forward. I can think of following scenarios
a. Again Read the all the topics to understand better
b. Do Paper Trading and perform back testing and simultaneously read the topics.
c. Start with small capital and invest directly in stocks
d. Read further Topics like Fundamental Analysis
Can you guide me on the same ?
I am a working professional, so I cannot invest more than 2 hrs in a day for reading
Glad you did, Shashank. I\’d suggest you do paper trading and simultaneously read the topics. This will give you a lot of clarity. Once you do this, maybe you can even try actual trading with small capital. If you are inclined towards investing, I\’d suggest you skip all these and pick up FA directly.
Correction – Dow Theory Part 2, Section 18.1 (Chart Reference):
In the referenced chart, the fourth encircled candle near the ₹165 level is incorrectly labeled as a Bearish Harami suggesting a short.
On review, that candle does not form any valid pattern — it’s just normal price movement near resistance.
The first three pattern identifications are accurate; only the fourth needs correction for clarity and accuracy.
Ah, ok. Let me check this, Vishal.
Hi Karthik,
Just following up on my earlier comment about Dow Theory Part 2 – Section 18.1.
In the referenced chart, the fourth encircled candle near ₹165 doesn’t actually form a Bearish Harami — it shows no valid reversal structure, just normal movement near resistance.
The first three patterns are accurate; only that fourth point needs correction for accuracy and clarity.
Thanks for looking into it earlier — appreciate your time and the excellent content you share!
Warm regards,
Vishal
Vishal, yes..but check this video – https://youtu.be/z0Rwoz6PduM?si=2cGstArKKltmT2xA gives you a perspective on how to use candlestick patterns.
Hi Karthik,
Thanks for sharing the video — I appreciate it.
Since the Technical Analysis module was taught by Prateek Singh, I’d prefer to get his clarification on this point.
In Dow Theory Part 2 – Section 18.1, the chart doesn’t actually show any Bearish Harami pattern as mentioned — that fourth candle near ₹165 isn’t forming a valid pattern.
Would be great if Prateek could confirm this for accuracy.
Thanks,
Vishal
Let me pass on the query to him then 🙂
Please reply to this:
Let me pass on the query to him then 🙂
I\’m not able to reply directly to that comment.
Vishal, please give me the context, unable to understand 🙂
hello Kartik sir Aditya here, you said \” if you consider a long trade based on candlesticks, then look at what the primary and secondary trend is suggesting. If the primary trend is bullish, then it would be a good sign, however, if we are in the secondary trend (which is counter to the primary), you may want to think twice as the immediate trend is counter to the long trade\” sir could u please give me an example of primary trend and secondary trend , i didnt understand how to identify them moreover whihc patterns help us know if the trend is primary or secondary
Hi Aditya, I believe what he tries to imply is that, at some times even if the primary trend is bullish, the secondary trend maybe bearish, in such a scenario the trader might try to take advantage of the bearish period to make quick profits. I think what Kartik tries to imply here is that if primary and secondary trend are one and the same (either bullish or bearish), it\’s better, but be prudent when they are contradictory, as you have to carefully calculate the exit point. I think I clarified your doubts, Aditya, please correct me if I\’m wrong, Kartik.
Thanks for the wonderful lessons, Kartik.
Yes, in fact my reply is also on similar lines 🙂
For example Nifty\’s primary trend is bullish for a long time now. However, there could be instances when the markets could correct and decline like 5-8%, this would be a secondary trend which is counter to the primary. You as a trader should be cautious in terms of setting up short trades because the secondary trend can quickly reverse and align back to primary.
hello kartik sir aditya here, so for example if a stock which in a trading range for a long time suddenly breaks the resistance level but , as soon as it broke the resistance level , at a price just above resistance it started trading sideways so does it most probably mean that it is traded by retail traaders and sooner or later its price is gonna go down
It just means that the long term resistance which was tested multiple times in the past is now broken. Usually when this happens, it can lead to larger moves. But if it trades sideways, then maybe a new zone is being formed.
thnk you sir
Happy learning 🙂
Entry: 107
Stop loss: 102
Expected target: 114
Dear Sir, can you please elucidate as to how did we arrive at Target 114. Para 18.5.
Or based on entry and stop loss we have calculated targer by X it by 1.5 times?
Target or for that matter SL is based on tools like support and resistance. Or you can even have a fixed percentage – 3% target, 1.5% SL.
Thanks Sir. Now clear, Regards
Happy learning, Kapil!
hello sir, i learned a lot from here now i learned almost all basic of stock market like chart, candlestik pattern, chart pattern etc but now i decided to enter the market with some capital for learning more then how can i strat like at the beginning what can i focus chartpattern or candlestik pattern. please guide me…..
Yes, I\’d suggest you pick 1 chart pattern at any given point and focus on just that. Try and understand its price action and then place trades on basis of that. After you get comfortable, pick up the next pattern to trade.
HI Karthik,
Since five years I am investing and some times trading (swing). Still daily i am learning.
Zeroda Modules help alot. This is third time i am reading Varsity Modules, everytime i find myself upgraded. I request investers/traders to read again and again,keep notes of important points. Its very helpful.
Thanks for you kind effort to make Varsity.
Thanks for the kind words, means a lot to all of us at Varsity! Happy learning!
How to follow the checklist in case of range breakout trading?.It is already in uptrend.
Then look for a retracement, and buy. That is probably the best way to ride the trend.
Sir,
1] What are the ways to find out stocks which are going to breaking out for intraday?
there are screeners like Chartink but they provide data lately
2] can we choose Cash segment stocks for Intraday rather than Nifty200 0r Nifty500 only ?
I\’m newbie to Stock Market
1) Not sure, you will have to explore this 🙂
2) Yes, you can.
Hi Karthik,
Is there a way to short a stock over a few days?
You have talked about taking a short trade multiple times in this module, and according to my understanding, we can only short intraday.
So, is there a way through which we can bet on a stock price falling over a couple of days?
Thanks.
The idea is to short the the stock via futures and options, Kushal. With this, you can roll the position for overnight positions.
So even you are of the same view? If that is the case, should we exercise more caution while trading? If any tips you have that we all could implement to be on the safer side would be really helpful:)
Be self aware 🙂
Hi Karthik, what is your view on the markets now? Just an overview would be fine. I\’ve heard from people and in the news that the bubble might burst at anytime, what are your views on this?
Waiting for the bubble to burst from a long time 🙂
Thank you. I mean it is above the p1 candle right so I assumed it is covering the previous day\’s loss, it is not bullish engulfing then, right?
Yes, thats right.
Hi Karthik,
Can you kindly check this chart and tell if my inferences are correct?
https://www.tradingview.com/x/08UUXjaK/
1 and 2, yes. Unable to see how you are seeing this as a bullish engulfing pattern.
Thank you:)
Thank you so much for the responses. #3 despite missing a prior trend gave a great run-up, does this happen often or its rare? And in bullish/bearish harami the color of the p2 candle doesn\’t matter, right?
Yeah, it does not.
Hi Karthik,
Can you kindly check the following?
1. https://www.tradingview.com/x/o8dckmdv/ – I have marked 5 points, this is an old chart of HDFC, I\’m trying to understand the patterns as well as other things here.
2. What is the difference between S&R and the Trading range?
3. There isa triple top formation here right?
1) All correct, except maybe 3. The prior trend could have been better.
2) A trading range is between S&R
3) Yup
Hi Karthik,
Can you kindly answer the following,
1. Can we say that Nifty had formed a flag pattern between 5 June 2024 and 2 Aug 2024?
2.
Seems like a big gap in Aug 2nd right? Would not consider it as a flag.
Hi Karthik sir,
As we saw about the trigger or the events…. when the company announces the shares buy back and in case of QIP, how would the market sentiment be? would it be based on the company\’s Financial position or any other reasons?
Yes, eventually it all boils down to that. Also other factors play a role – the market mood at the time of announcement, the particular stock\’s prices, details of the buy back etc.
Hello,
You mentioned that a trade in a secondary trend counter to a primary trend can be risky. You also mentioned that a primary trend can last for years.
Now given that a trader tries to make money off short-term variations of the price, going by above, in a primary bull trend, a trader can never take a short trade irrespective of all items confirmed in the checklist.
Kindly elaborate.
Thanks,
Ankur
Its risky, but I dint say you cant take these trade. YOu can. Once you do, you need be vigilant enough to square off the trade as soon as your target hits. Also, no point having elaborate targets for such trades in secondary trends, better if these are quick short term trades.
Thanks Karthik.
So it\’s safer to go with primary trend, but one go always go against thr primary trend (if all other parameters suffice). Just need to more cautious in these cases.
Yes, keep the primary trend in perspective when initiating trades 🙂
Thanks Karthik first of all for the material.
I am not clear on the comment related to always checking primary/secondary trend.
The position should always confirm with the primary trend? Is this what you mean to say ?
If yes, most of the stocks in Indian markets are in primary uptrend, so even if candlestick indicates going short — we should avoid such trades ?
If yes, most of the stocks in Indian markets are in primary uptrend, so even if candlestick indicates going short — we should avoid such trades ? >>>>>>> Not really, the idea here is to be aware that the primary trend is bullish, and the short position is based on the secondary trend. So even if you are initiating a short trade, then you need to be aware that the primary trend forces may kick in and reverse the secondary trend. So you need to be quick to reverse the position when tides change.
Thank you sir!
Welcome!
Hello sir,
As of 21st May 2024, I am looking at Indian Bank\’s (INDIANB) chart on a 1D timeframe. According to me, I think that it has broken its resistance of 560-573 with volumes greater than 20 day MA and can be considered as a stock for a long trade.
I would like to know your opinion on this analysis.
Thank you!
Yes, do check other parameters as well before you take a trade. Good luck!
Hello Sir,
I want to know more about trialing stoploss. Is there any module related to it. If yes kindly share the link.
If not, I want to know that trailing stoploss can be done only manually?
or we can change it with an algorithm or any function on kite?
And what should be the right way of trailing it.
There is no specific module for that, right now its manual.
hi sir , how do we come to know that momentum is high
You can use simple momentum indicator to figure how the momentum is playing out. Or even moving averages will help.
No I mean to say, a successful buyer and seller collaboration decide the price, so we got the market depth, so can there be any way to check the price???
You can always check the last traded price, Jeesu. Is that what you are looking for?
While trading in zerodha i say the market depth of a stock, and the price move according to buyer and seller price, that is bid and ask price….
so lets say the price that the seller want is 101.50 (200 quantity), 101.70 (350 quantity), 102.00 (500 quantity)
and the buyer price was like 99.50(500 quantity), 99.20(650 Quantity), 99.00 (50 quantity) …. so according to these data where the price will move in the next step… i mean how can we find the just next sec price looking the market depth ??
Where the price moves really depends on the market and no one can really guess that 🙂
In one of above comments you said – Best if you have a system which does this for you.
Do you mean to use streak tech and setup our conditions so that every day it shows qualifying trades??
Basically any tech enabled process, thats what I mean by a system. Yeah, you can use streak as well.
Hello Kartik,
I request you to plz chech the EOD chart of clean science, it has formed tripple top and tripple bottom, can u plz assist me?
Yes, looks like on a 1 year chart basis.
How to find stocks that could satisfy our checklist?
Randomly I am trying to get the stock to trade but mostly not satisfying checklist.
Sometimes recognizable candle stick doesn\’t meet or volume or Support & Resistance.
I am Beginner
YOu just need to scout for opportunities regularly, Gaurav. Best if you have a system which does this for you 🙂
sir
ok sir for primary or secondary trend.is any book or video for understanding too much.
please dont hesitate sir I am week student of class.
I think there is a book by Edward Magee on Dow Theory, please look for that.
Sir
I don\’t understand Dow theory sir. I read three times. Can anything else to understand primary trend or secondary trend.
If not, how I think what is Dow do in grand chechklist trade ,tell me in simple form
Use Dow Theory as a tool to understand the overall trend Vishal. If not for anything, spend time on understanding the concepts around primary and secondary trends from Dow Theory.
very helpful,thank you sir
Happy learning!
Sir are their any breakout pattern who have satisfying RRR after confirmation of breakout, cause I am not able to see it in many charts
There could be instances, Advait. Markets are full of opportunities 🙂
sir, I see that waiting 3-4 days after the breakout in search of momentum takes away most of the profit and when, and when i would conform for a range breakout and wish to take trade then RRR would not allow me to do so because of price level near target.
so should I take trade in such cases?
If the RRR is not favorable, then its not worth the risk 🙂
sir, in range breakout
for momentum should we need 3-4 days or price spike in a single day(like 8-10%) can be satisfying enough to classify as high momentum
If you are looking at momentum on a sustained basis, then I\’d say 3-4 days.
Hello Karthik,
Could one of the situations for a false breakout be that momentum is high but the volumes are low? It wouldn\’t make sense for the number of transactions to be low if the price shoots up above the resistance or shoots down below the support. In what situations would the above scenario be possible realistically?
Thank you!
This is possible, especially when the market has a lot of volatilie.
Sir, How to realize if we are sitting on primary/secondary trend?
Always look at the longer time frame to check for the market trends.
sir, as you have mentioned in flag formation as firstly there is a need of a big up move and that is too quick
so can you tell me in approx % how much up move is sufficient and in how many EOD candles?
Hard to fix a % point, but something in the range of 8 to 10% should be good.
Hello Sir, Can you please specify the timeframes we should consider for different things here?
Can you please specify the timeframes we should consider for different things here?
I\’d use end of day. You can too. If you are trading intraday, then maybe you can explore 10 or 15 mins time frame.
Hello Karthik, I wanna clarity on something
From my understanding so far I think S&R is equivalent to the trading range that you discussed above and if there is any major difference…what is it?
Thanks in advance!
Not really. These are all different techniques to establish a range. The logic remains the same.
Thank you for such a wonderful course but just wanted to know how to set targets?
The easiest way is to use support & resistance technique to set targets.
Sir just to confirm when you say that there are differences in primary and secondary trend it basically means that on a montly time frame the stock is in uptrend but let\’s say on a weekly time frame the stock is in downtrend right?
Yes, there is a primary trend, and a counter-trend to the primary called the secondary trend.
So sir according to you one must be cautious in a correction i.e secondary trend right?
Yes, all the time.
Ok sir thank you so much for the prompt reply as always hatsoff to you . understood now
yaa there is no guarantee of anything in market but as much as we do practice and get experience in trading then our perception will become more strong and can b profitable, also then we will able to manage our loss and profits is it right? more we practice and take experiance , then we can be profitable on this?
True Neeraj. End of the day, it is all about enhancing your odds.
If above it is bullish marubozu then next clarify that in same chart of daily timeframe some days back i found like same OHLC wihch is i mention above and seeing long green candle without lower wick have OHLC as– O= 100.75, H= 113.80, L= 100.70, C= 112.75. Also volume was also greater than average vol. in this, but after this candle two candle formed and then sudden fall in price why this fall in price if it is bullish marubozu with high volume. please explain all three queries above pointwise.
this is i am talking about RBA stock (burger king) can you please look into that chart of RBA from 1 april 2022,if you have some free time. both queries are of RBA stock. i am unable to attach that link and chartt in this section soryyy.
Neeraj, you need to understand that bullish marubuzo or, for that matter, any candlestick pattern does not necessarily guarantee trades. These patterns enhance the probability of a profit, but 0 guarantees. Keep this in mind while trading based on candlesticks.
Also please tell me i have found OHLC — O=116.45, H=120.60, l= 116, C=120 this can i should consider a bullish morubozu , i i see the candle its look like bullish marubozu,, it has no lower wick or some small point wick which can be flexible and is green candle. so should i consider it bullish marubozu??
YOu can consider this as a Bullish Marubuzo. No problem with the lower wick.
sir i bought some days ago a stock of some quantity on delivery basis in CNC, now in zerodha mobile app when i am watching spot chart of that which is add in watchlist then day candle formed is different from when i am watching same chart of that in holding section whys so?
Not sure what you are talking about, Neeraj. Chart should be the same.
Sir you mention somewhere that shorting is only for futures and intraday, but in that case we need too much money as broker gives leverage also, but as a new begginer if we dont have too much money and if we found short trade in any chart then to do.?
Also option selling needs more money as a begginer we dont want to trade with so much capital then please tell me in which segment and how i can do trade with small amount of money ,with as much minimum amount. if either I want to go long or short
There is no way around this Neeraj. You will have to bring in the necessary margins to carry forward a short position.
Hi sir,
Is there any website or app which gives the type of candlestick pattern formation?
Because there are so many stocks listed, we can\’t go through each stock and if any website which gives the type of candlestick formation, so we can easily pick right one amongst them.
You can try the candle pattern indicator in chart IQ.
Wonderful analysis. It is the best traders mantra you provided in Dow theory. It will be more helpful if you add the section of Elliott wave with it. I believe that your way of teaching and expressing the technical analysis is awesome, and if you will add a chapter on Elliott wave, you will explain it very nicely.
Thanks
I\’m myself not too familiar with Elliot wave, have not used it much. Maybe sometime in the future 🙂
The bullish engulfing pattern is suggesting along.
Morning doji star suggesting along
Not along, \”a long\”.
Thanks. Noted 🙂
Thanks Karthik,
Really appreciate the effort you put in to make this tutorial as intuitive as possible.
You are answering every query even after 7 years of this series which is really great!!!
Happy learning!
Hi Karthik,
Can you kindly clear this doubt. I am copying a portion from this chapter
\”When you identify a trading opportunity, always look at how the trade is positioned from the Dow Theory perspective. For example, if you consider a long trade based on candlesticks, then look at what the primary and secondary trend is suggesting. If the primary trend is bullish, then it would be a good sign, however, if we are in the secondary trend (which is counter to the primary), you may want to think twice as the immediate trend is counter to the long trade.\”
Say if the primary trend is upward and if you are in a secondary downward trend, then a pattern like a bullish engulfing will be suggestive of going long since the nearby trend was downward. Is my understanding correct?
I am getting confused when I read it along with the quoted comment.
Can you elaborate the scenario which you mentioned to think twice?
Thats right. Basically, you need to look at two things –
1) Check what the primary trend is
2) Check what the secondary trend is
3) See what the trade is suggesting. Its best if you can spot a trade that is counter to the secondary trend which is basically in line with the primary trend.
Sir I know the option greeks. Have read the options module as well as the strategies module several times. I buy options after applying technical analysis on stocks. It\’s the technical analysis that is failing me more often than not. That is why I was asking if quantitative analysis gives relatively consistent results.
Nope, Prashanth. There is no evidence to support claims that QA produces better results over FA or TA. End of the day, all these techniques enhance the odds of your profitability.
Sir I\’m trading stock options positionally only. Its just that I\’ve become disgruntled with technical analysis. The results from trades taken on the basis of technical analysis are very inconsistent. I\’d request you look at my previous two posts that are immediately above this one for context. I don\’t trade merely for kicks or for making quick bucks. I want to be seriously good at trading and am willing to put in time and efforts for it. You\’ve shown me the path till here through Varsity. I\’d request you to be my guiding light going ahead too.
Do I need to embark upon learning quantitative analysis to get better at trading options? Is it more consistent than price action? If yes, can you please suggest some good books to get started?
Prashant, I was referring to equity positional trades and not options. If you are trading options, then there is more to it than just technical analysis. You need to fully understand greeks and other factors which impact the premiums. Without this understanding, trading options will lead to a sure-shot disaster. However, just on basis of TA, you CAN take positional EQ trades. The point is that you need to understand the instrument you are trading, its dynamics and the factors that impact it. To give you an example, assume you learn how to drive an car. Now, just because you know how to drive a car, you cannot assume you know \’driving\’, and straightway pick up a truck to drive. Yes, the core driving technique is the same, but the car and truck driving nuances are very different. Same with trading.
Sir I\’ve been trading stocks directionally through option buying strategies over the last 1.5 years as per the checklist you\’ve provided in the modules. My results have been all over the place. Let me cite some examples: In Sept 2021, the market was trending and I ended up making 50% returns on capital. In Feb 2022 the market was very volatile and I ended up losing around 50% of my capital. I had made 15% gains on capital in the first three weeks of March 2022 and ended up losing all of them in the fourth week. The results make it look like I am gambling even though I\’m following a proper process. It\’s draining me psychologically. How can I make stable returns? How do proprietary trading desks do it? What should I read to get better at it and generate stable returns?
Prashanth, its not worth it if its draining you psychologically. Take a break. I\’d suggest you look at positional trades where you hold the stocks for few days to weeks. This is much better than intraday trades. How does it matter if you make money intraday or by swing trades? Swing trades are lot less stressful.
Sir you\’ve done an excellent job with Varsity, explaining complex things in a very simple manner. I\’ve a query, does technical analysis work consistently? In my humble opinion it doesn\’t. I\’ve been trading futures and option buying strategies following the parameters you\’ve mentioned in the checklist for 1.5 years now and it has been mostly hit and a miss. In no way am I implying what you\’ve taught us isn\’t valuable. It\’s immensely valuable. But I\’ve serious doubts about technical analysis itself. It\’s very inconsistent even if you follow rules to the tee. There have been times I\’ve ended up making serious money deploying Bull Call Spreads and there have been times I\’ve lost huge sums despite following the same set of rules. I have started feeling the inconsistency of technical analysis is the reason a whole lot of traders take non-directional trades on volatility despite it yielding much much lesser returns relative to option buying. I feel lost, please guide me.
Prashant, I cant dispute what you\’ve said. What I\’ve observed and experienced is that no single technique works consistently in the market. You always have to mix and match different techniques and in the process find your own path. These techniques are mere means to an end, not the only solution you should rely upon 🙂
For example, a company announcing its results tomorrow forms a bullish engulfing today, then you may want to play it with a call option (risk only premium). Do you see the mix of techniques here?
Sir how to recognise primary trend and secondary trend? in my 1week reading i guess by volume..?🙏🙏
YOu just have to look at the chart on a larger time frame Murari and you will get the primary trend. For secondary trend, look at the short time frame like maybe for 3 months.
Thank you sir.
I do only swing trading sir.
For long trades, I have equity.
For short trades, i cannot do equity.
FnO will help in shorting in swing.
My first priority is Nifty and Banknifty.
For Nifty Fut, If I keep min 200 points stoploss, it means Rs 10,000 Risk per trade.
For Rs 5 Lakh capital , its more than 1% risk per trade.
How can I bring my risk to Rs 5000 risk per trade.
Thank u
Given your situation, there are two ways to reduce SL, Abdul –
1) Keep tighter SLs on Nifty futures
2) Try options (risk is higher, but SL can be controlled)
But with options, you will encounter other types of risk as well.
Hello sir,
I would like to thank u for your constant support.
It\’s been more than 2 years now since I started.
1st year I was in net loss (did all the mistakes that a novice does).
2nd year I followed all the trading rules no matter what the results yielded out, I ended up in net profit.
With a win rate of more than 50%, RRR of 1:2, 1% risk per trade, and sticking to swing trades.
All this time I was trading with a capital of Rs 1 Lakh taking only long trades.
Now I am confident enough to take my trading to next level.
I planning to start with Rs 5 lakh.
I have no doubt in long trades since I can control my risk per trade(i.e 1%) by going in cash if not in Fut.
My concern is how can I control my loss in short trade (swing only).
Minimum 200 points in Nifty Fut will cost Rs10,000 which will be 2% of my capital.
I tried hedging by buying call options at the swing high or at stop loss level at OPSTRA but it shows results in terms of expiry.
Is there any way I can control my risk on the short side or should I trade with Rs 10 lakh so that my 1% will be Rs 10,000 or should I change my 1% risk rule to 2%?
Hope I have placed my question.
Thank u
Abdul, I\’m glad you have found a grip on trading, I hope you have more success. Btw, if you can control risk on the long side, then controlling risk on the short should be very similar. Why are you finding it different for short trades?
Hello,
Firstly, you\’ve done a wonderful job with these materials. Very helpful. Thank you.
Why does a breakout happen exactly?
I understand, stocks trade in a range and while trading in the upper range for some time, it tends to breakout to a much higher price, even if there\’s no volume spurt as such. Can you explain why?
Thanks, James!
Stock prices may fluctuate within a range for a long time with no real cues for it to move out of the range. But when a news flow occurs which can impact the price, the stock does a breakout.
Hello Karthik,
A conscious heartfelt Thanks to you and the entire Zerodha team for bringing out such wonderful sessions to general public and helping us kick start our journey in trading.
I have a couple of questions on the Dow Theory, hoping you would clear them-
1) My concern is with the secondary trend and reversal swing – Looks like identification of secondary trend is very difficult, they can be mistaken as minor trends in certain cases. Is there something that can be used to classify secondary swings properly. There are high chances of falling for false breakouts in Dow Theory.
How to overcome this, some tips/guidance on dealing with this?
2) Can we say that Dow theory better applies to Bull Market more than Bear Market?
3) Regarding the Grand Checklist-
Look at the trade from the Dow Theory perspective.
1. Primary, secondary trends – As already asked, can you give some tips to precisely identify them at least to some extent.
2. Double, triple, range formations (At what time frame can this be best viewed?) Can you please specify it for different types of traders (Intraday, Short term, Swing trading, long term trading etc.)
3. Recognizable Dow formation (What Dow formations are you referring to here?) Aren\’t formations already covered above in point 2.
4) On a scale of 1 to 10 – How important is Dow theory as a checklist (can this be skipped?) _ I am finding it difficult, but if you say its very important, I will get motivated and spend time to learn this.
5) Among all the checklists – Can you specify THE MOST important checklists a trader shouldn\’t be missing or can you arrange the checklist in the order of importance.
Thank you for all your efforts you are putting in to bringing such quality content to us and more importantly addressing 1000s of queries without fail. I feel pity that I don\’t have words to express my gratitude.
All I can say is you truly deserve the best and a Joyful life for the person you are.
Jidugu, thanks for the kind words, I/we feel humbled. Hope you continue to enjoy learning on Varsity.
1) There is no objective way of doing this. From my observation, I think the best way to identify the secondary trend is by your past experience.
2) Nope, as far as I know, dow theory does not discriminate between bull and bear markets 🙂
3.1) Check my earlier response
3.2) For swing and long term, look at at least 3-6 months of data. For intrday, I guess its best to look at at least 2 weeks of data
3.3) Yes, by formation, I mean double/triple tops and bottoms, range formations etc
4) I\’d say at least 6 to 7. Try and get comfortable with it, makes it easy in the future
5) The entire list, no discount on this 🙂
Once again, thanks for your kind words, its encourages us to do more 🙂
1)Sir,
while trading indices, do we need expect recognizable candle stick pattern to make decisions?
2)is Technical analysis work for crypto currency trading like Bitcoin, Shibha?
1) Yes, trading by considering recognisable candlestick patterns is one of the techniques. You can also look at overall trends and trade as well, like in the case of dow theory.
2) FYI…I\’ve not traded crypto so take my comment with a pinch of salt. But here is the thing – you can apply TA to any asset which has stock/commodity/currency like OHLC time series.
Hi Karthik!
Is there a lesson/module that talks about \”smart money\” in detail and how to follow smart money for better RRR?
I\’d suggest you take a look at the chapter on volumes.
Sir,
while trading indices, do we need expect recognizable candle stick pattern to make decisions?
No Sir
I am asking that is backtesting a tool or we can only build it like drawing lines as support and resistance?
It is not a tool, Pavan. To draw trendlines, Support & Resistance you need a charting tool (which is available in Kite).
sir,
I guess, we have not discussed it.
could plese elaborate it, how to use it on charts?
Can you share the reference, please?
Sir,
what is Back testing Strategy?
Backtesting will help you understand if your strategy has been profitable historically or not. It will also help you understand the shortcomings of your strategy.
Sir,
1)Around last two weeks hdfc,kotak,axis banks are trading in some range, can we consider this as range and also as accumulation phase?
2)today, prices are incresed and I can see prices are higher than that range —-Can we consider that as range break out?
3)if its range break out, but there is no recognizable candlestick pattern for long, Should we really consider a recognizable candlestick pattern during range break out? or can i long because of range break out?
Could please check around last 10 candles and confirm Sir
Thank you
1) Range yes, not sure about the accumulation phase. Usually, accumulation lasts for a few weeks
2) Perhaps
3) Not really, if its a breakout and you are convinced, you can trade based on support and resistance
To team zerodha …. Sir I\’ve been reading the varsity material in the varsity mobile application by zerodha … So what I found out is .. the application lacks a questioning point ..or a place to ask doubts though it is available in the web version …. Looking forward to varsity mobile application updates.
Chetan, having queries section the app will be tough, won\’t be practical.
Thanks sir .. you\’ve been answering things since 2014 thanks a lot and still looking forward to other modules too you\’ve been doing a great work … Thanks to both zerodha and head Kartik sir
Happy learning, Chetan.
Hi Karthik. In Reward to Risk it is mentioned that, Near the bearish engulfing patterns high, the chart is showing medium-term support.
Isn\’t that high supposed to be at Resistance level?
As per Checklist:
For a short trade, the high of the pattern should be around the resistance.
You need to think about the S&R with respect to the current market price. In a bearish engulfing pattern, the idea is to short. So you expect the prices to come down. Hence, the high price becomes support and the lower prices are resistance.
Sir , how do you find stocks for intraday transaction .. because when I tried a little I found stocks that were moving sideways and some that showed way too high volatility… Looking for you guidance
Chetan, you can technique remains the same. I\’d suggest you make a list of stocks that you comfortable with and observe the price action on a daily basis. YOu will soon start finding trade opportunities in these stocks.
Thank you sir
Good luck!
Karthik sir, i have some doubts…
1.Sir what you prefer, take position as soon as breakout happens with volume or wait for retest?
2.Do we need to look for fundamental news when we are anticipating breakout?
3.If flag and pole appear in downtrend is it also valid?
1) Take part position upon breakout, add a bit more if it retests. Exit all, if the retest does not hold.
2) That will be a huge advantage if you do
3) Not so much conviction, would trade light.
Yes, tagged you and it worked well..😅
Experience matters, Thanks to Zerodha varsity head Mr. Karthik. 👌
Happy trading 🙂
Hi Karthik,
Just now I have gone through flag formation. It says the steep increase in stock price and immediately declines in parallel.
So I think ITC has formed flag formation I think can you just confirm it ??
Yes, it does. Guess you tagged me on Twitter right?
Trade ranging breakout example where did 125 come from?, and what about 43 points?
Your sessions are fantastic n really enlightening , thanks
Have a few questions n will be interacting more n asking them over some time
How does one decide how long the stock will move up, eg some fund houses give targets but the stock moves much beyond n you exit much earlier than was necessary eg in case of Godrej Properties recently, the target was around 1800 but it went beyond 2200
Well, Deepak, that is hard to say. As an active trader, I think its job well done even if you manage to catch 40 to 50% of the entire move in the stock.
Hi Karthik
The content has been very helpful and I am grateful to u for the efforts put in.
After a few sessions of trading,
I have two questions for you
– How can i better my target setting skills. I somehow am not hitting the price range till where the stock ends up and miss out the opportunity of the same.
– Also, having read the material (on technical) and as a novice in stock market, what more should i be doing now. How can I have better prospects in stock market for it to be a stable source of income .
Need your guidance
Priyanka, for targets, I\’d suggest you understand the concepts of support and resistance. This is usually the simplest method to set targets. If you think you\’ve read and understood TA, then focus on risk management 🙂
Good luck!
https://drive.google.com/file/d/17CLWZTpmZR3rTalvQcYKEp2rYReLUUFm/view?usp=drivesdk
In the above pic I\’ve shared the stock as given a breakout from range but there is RSI and macd divergence should I exit or just hold in this situation.
Chandu, I\’d pay more attention to the dow and candlestick pattern as opposed to the indicators.
Thank you so much sir for always clearing our doubts.
Good luck, Rajesh.
Hello Karthik sir
Some of my trades are not profitable because of strict RRR of at least 3:1, rewards reached around 2:1 or 2.5:1 but I am waiting for at least 3 or more than 3,4 or 7 so I cannot book profit on given trades. What should I do take 2:1 or wait for atleast 3:1, or take loss.
Note : I am a daytrader only
3:1 in day trade is tough ask Rajesh. I\’d suggest you look for 1.5:1 or even 2:1 kind of trades.
on options trading most Credit spread strategy risk to reward is not favourable (out of the money) but strategy offers good probability mostly around 60% -70%. is it worth trading based on probability ?
Yes, especially if you think the probability of retaining the credit is high enough 🙂
Hello Sir,
Analyzing Individual stock chart we can easily identify S & R , range and dow patterns.
But if we have to analyses 100+ stocks , this will become a tedious job and meanwhile we are analyzing, the patterns, s&r , breakouts, will be completed/over and we will be missing the opportunity.
Is there any screener available where we can get the list of stocks near breakout or any criteria which we can apply to filter the stocks?
One effective way is to reduce the number of stocks on your watchlist. Concentrate on just the stocks that you know well. It will be much easier that way.
how can we find mathematically the rate of change of price is reasonable for the entry in the trade ?
That\’s hard to establish. But you can always have a reference price in terms of support and resistance to figure if it is the right price to transact or not.
Sir, I have a doubt about the Reward Risk ratio. How to Estimate the reward we want as any trader will want the maximum reward possible in a single trade?
While there are many ways to estimate this, the easiest is to your own metric. For example, for short term trades, especially options, I\’d personally prefer at least Rs.1.5/- as reward for every Rs.1/- of risk.
Sir ,in previous chapter , I studied double top & bottom and triple top and bottoms, I have a question how can we predict a stock will form triple top are triple bottom after it formed double top & bottom . if we wait to form triple top& bottom we may have more chance to miss the trade when it not form triple top & bottoms. how can predict that stock will form triple top& bottom after it formed double top & bottom sir ?
There is no way one can do that, Babu. Also, there is no need to perfectly time the bottom and top. The idea is to catch the rally at some point and ride it for however long you can. Suppose the stock\’s absolute bottom is 100 and the absolute top is 200, its job well done if you manage to catch at least 40 points in this move.
Hello sir, if you would suggest one book for Trading stocks and options which would it be.
Varsity itself 🙂
Sir,
I have traded triangle patterns (trading breakouts) since May 1. Most of them were good breakouts. But I just did 10 trades.
How do I backtest triangle patterns/channel patterns for the past 10 years or so?
Or is it already a backtested pattern?
Can you suggest some websites where I can backtest trading systems?
I\’m not sure, but maybe you can check streak.tech if they offer this?
Sir..how to draw flag formation
Typo on 18.6 (1)
What should i do when the trade pattern says go short or sell but indicators say buy or the price will go up
I\’d always give the patten more attention.
Sir
I didn\’t find Dow theory in indicators. Wher I plot Dow sir
I\’m completely new in technical analysis. In several chapters you used term \”Long & short\”, what do they mean by ?
Long means to buy, short means to sell.
Hi Karthik,
Does Kite offer auto-recognition of candlestick/Dow patterns? Are there any tools which you know of which do auto-recognition and highlight these patterns when you plot a chart?
There is a candlestick pattern indicator that identifies patterns, needless to say, its on the past data.
Sir
One question more sir you tell us volume are not satisfactory, in that condition you also work on your plan. So I asking you how much value of this volume to take ttade
If the volume is not supportive, then I\’d reduce the trading qty to 1/3rd and initiate the trade.
Sir
How much important is Dow theory. Is any substitute of Dow theory.
No substitute as such. I\’d suggest you give it a shot once, it\’s anyway not much time-consuming.
It\’s fine karthik. As per the tutorial the minimum target for this stock (breakout price +range) is around 2700 but due to the recent news of this stock(valuation got pricey) there may high chances of reaching 2900. so i am perplexed as to which target should I take.
Hmm, I understand. Good luck.
Hi Karthik,
small help needed
https://www.tradingview.com/x/2gNumiWj
should I buy now as I feel it is breaking the range and showing a bullish pattern. And even I see high volumes following this momentum. RSI 14(80,20) seems heading towards overbrought region. so what should be my target for this stock.
Sorry, Vamshi, I wont be able to help you make that decision 🙂
When are you going to add chapters on trend lines ?
Its on the list, Hemant. But will try and do that soon.
CAN U PLEASE SUGGEST SOME BOOK FOR LEARNING EW
Not sure.
Would be exciting to learn more chart patterns from you Sir.
Looking forward for more patterns.
Thank you.
You only need to understand the price action behind these patterns, Abdul. Once you get that, the pattern itself does not matter.
Hi,
In this grand checklist where do the moving avg cross over strategy stands?
Thats not there, remember MA CS is a separate strategy.
sir,
Everything you taught used daily candles. Can you give how to use the various strategies intra-day basis. I am confused about the time frames to be choosed for a day trading. please help.
Sachin, the same is applicable to intraday as well.
hai,
Can the grand checklist explained can be used for intra-day trades(because throughout all course, everything is explained using daily candles). If so, which time frames are the most suitable.
Yes, you certainly can. You can start with 10 or 15 mins time frame.
Hi Karthik…How would you ascertain the target when onboarding a stock that has breached its All Time High and going up and up (like a lot of scrips these days). How would you assess RRR in that case?
It is very hard to figure target for stocks which are making ATH and ATL, the best thing a trader can do here is to trail the SL.
Should a Intraday trader give attention to the company news or should he just focus on the technical analysis? what is your take on this?
Usually, its technicals, unless a major news flow is expected on the day you are trading.
Hi Karthik
Thank you for the fabulous tutorials.
Can the checklist be defined algorithmically in Streak? If how, please provide a few pointers.
Thank you.
I suppose so, but for that, you need to speak to the folks at Strek 🙂
Hello karthik sir,
I\’m quite confused that what time frame should I use for chart reading for intraday & swing trade.
If you are a complete novice, please start with EOD chart.
Valuable lessons
hi sir i have one doubt,is there any chance the stock may fall after flag formation.
No one can estimate that. We only have to deal with the odds 🙂
Sir, i read about more patterns such as pennants, triangles, head & shoulders. Can i include these in my system? Just want to know your perception and do you use these patterns?
Yup, these are all extensions of Dow theory.
Sir. this time i am quite right about the flag formation i guess?
https://www.tradingview.com/x/P8829Mrl/
It appears so 🙂
Near the bearish engulfing patterns high the chart is showing a medium term support.
i thing it should be medium term resistence not a support.
please correct me if i\’m wrong.
it is in hypothetical situation example in 1st paragraph second last line
Let me recheck that, Salim.
Sir, i am still having doubts with the flag formation part. Could you please tell me whether this one is a flag formation or not as there was a steep increase in price and then the prices were somewhere going down(profit booking)-
https://www.tradingview.com/x/z1PL6Upz/
No Mohit, this is not a valid flag formation. For a flag, you need to have a quick uptrend followed by a low volume retracement.
Sir, can i move on with this trade?
If you have the conviction, then yes, you should.
Sir, can i consider the below trade as a flag formation?
https://www.tradingview.com/x/2enD0BSP/
And please give me your review regarding this trade-
Sl- 65
Target-76
buy price-69.
The support and resistance marked points are within the span of two years(was not able to show them in this picture)
No Mohit, this is not a flag formation. Flags are formed when there is a steep price increase, followed by a decline in prices on thin volume.
The longer the duration of the range the longer is the width of the range.
Is there a typo here.
Did you mean –
The longer the width of the range, the longer is the duration of the range.
Ah, I mean to say, \’longer the duration of the range, the higher is the probability of a profit\’
In order to observe all these patterns/breakouts/candlesticks patterns how should i shortlist the stocks to observe and recognize patterns?
There are thousands of stocks, one can\’t t go through all of them one by one to observe any of the pattern, so how may i shortlist the stocks?
For this reason, you need have an observable universe or the tracking universe, which is usually a set of stock you follow regularly. Nifty 50 is a good set to start with.
Hi Karthik,
18.1 section, Point 4
The 4th circle is a bullish harami and should go for long, but you mentioned the reverse, please clarify.
Sir can we consider this as Range Breakout
https://imgur.com/a/Ypi02NU
More like a channel breakout.
how to use flag in kite. I cant find it under studies
Flag is a dow pattern, you can recognize it with by looking at the charts in any format – candlestick or bars.
The old format for display of Chapter list at the end was better than what it is now as because content was well centered and easy to read because of bigger font size. Request if not a change, but an option could be given to cross the box, so that content gets aligned back to center.
Thanks, will share the feedback with the team.
1) Yes i agree but that is after i am done with my logic and thorough backtesting. After that no interference. But i cannot do that when i am not satisfied with my system.
And just FYI i also tried backtesting with risk taker and risk averse methodology. That doesnt increase accuracy but decreases the returns. We should just take the risk.
Thank you so much for your replies. And happy 10 years to Zerodha. 🙂
1) Of course, risk is good as long as its calculated 🙂
Thanks! Happy coding and trading.
Thank you so much for your inspiring words.
1) I am trying to calibrate it. Filtering out the wrong signals. Doubling down on the right ones. While looking at the charts manually we see reversal and see the candlestick and volumes and S&R there almost at every reversal and think well this is accurate. But our eye spots the reversals and conveniently leaves out every time all the signals were there and it didnt work out. The system showed me all those signals. Any tips on how to improve accuracy from here.
2) Are all those ads claiming 80% 90% accuracy on their signals are scams? I mean i always thought that they were but figured if they have clients then at least they must be giving them something.
3) I do believe increasing my returns from here will be possible with all the things you mentioned. They were my next step after increasing my accuracy further. The major problem i am facing is with accuracy.
Thank you sir. 60% accuracy is good is kind of reassuring and motivating. Till now i was thinking that there are only two directions a stock can go. Up and Down. Then the \”You have come this far\” part was saying that i still have skills of anyone who can do a coin flip.
I will keep on working. Although idk what i am going to do to make it more accurate.
Anyway thank you sir.
1) If you are using machine, then you need to code your logic and let the machine do the spotting 🙂
2) These ads are scams. Please stay away from them and let them not influence your path.
Good luck!
Hey Karthik sir. First of all. Amazing work explaining all these concepts. I am a huge fan of your work.
I have been working on coding my strategies for trading.
I didnt know how to write a single line of code 7-8 months ago. But has worked day and night towards learning to get into trading in an efficient manner.
I didnt know anything about trading either. I started from scratch there too at the same time.
I have read hundereds of blogs, many books, watched YT videos for more than 15-18 hours a day for the past year.
I have read the entire Varsity and amazing work honestly. It has been the simplest explanations.
Now the problem.
I coded \”The grand checklist\” and backtested it. (which was not easy).
This was the program i had all my hopes on.
It recognises the candlestick patterns, checks the volumes, for s&r i found a way to code it in such a way that it gives as accurate results as hand-picking them visually, checks indicators (tried every one you have included in the module) calculates SL – TP, calculates RRR. I am not able to code double tops, flags, etc, yet.
And after trying for months coding this as i didnt know how to code, this week i finally ran the backtest with NIFTY50 as universe.
And the results were disappointing. The winning rate after all that were around 50-60% with just 1 RRR which is breakeven. Keeping RRR at 1.5 makes it even worse.
I wasnt expecting 90% accuracy but at least around 70-75%. If i wanted 50% i would have done a coin flip instead of countless sleepless nights. Now the backtest had more metrics ofcourse including returns, sharpe, sortino, max dd , peak, and many more.
I learnt about all of this in these 7-8 months through which i tried to judge it but 1:1 RRR with 50% accuracy.
The variations i tried to improve accuracy.
1) Different Time frames:
a)15 min
b) hour
c) 2hour
d) EOD
2) a)Keeping the next S&R as targets.
b) Keeping fixed targets computed wrt SL. Ex: 100 price, 98 SL so 1RRR will give 102 as TP.
3)a)All Trades.
b) Only long trades with primary trend bullish and vise versa. (Using EMA/DEMA)
4) With and without indicators. (There are very few trades with indicator confirmation)
5) a)Manually putting in S&R levels just to confirm.
b)Coding s&r which was as good as manual.
c)traditional, fib, woodie, classic, demark, camarilla
And idk many more p&c.
The results so far have been no good. Some stocks did give 70 even 80% return. But some were down to 20s. On average of all 50 stocks, the winning rate over 1RRR was near 50-60%.
But i wasnt able to process that \”The grand checklist\” doesnt work. So I doubted my backtest which has been working fine because ofcourse the checklist cant fail because all this hardwork was based on that, right? Started checking all the signals generated during the backtest and manually checked if everything was good. And it was. Still no results.
Now I am sorry to bore you with my long story but i have devoted countless sleepless nights and multiple thousands of hours into studying. And i honestly dont know where to go from here. Just want your honest advice as there is no one i admire more.
I also have started doubting that is trading beyond luck and insider trading. Is it actually for retail traders at all beyond luck.
I dont regret a single minute i spent over this. I was never able to read, code, and many more skills and knowledge i have gained.
But i dont want to give up in trading and could use some advice as to how to increase the accuracy or at least which way to go from here.
Thank you so much for reading this long post.
Posting this anonymously so that it doesn\’t come off as show off kind of thing for personal or advertisement purposes.
Firstly congrats on acquiring all the skills, that too in such a short period. This is no ordinary feat!
I completely understand your situation. Let me highlight a few things –
1) The winning rate after all that was around 50-60% with just 1 RRR ——-> trust me 60% is good. I\’ve hardly seen any retail systems with more than 60% accuracy. If you\’ve got 60%, I\’m 100% sure you can calibrate the code to drive you to 70%. Beyond 70% is a tough ask in my opinion
2) Now, assume you have 60% rate, then the signal generation is not an issue. You can now play around with the risk and reward metric. Make sure you lose 1x on trade but when you profit, ensure its 3x.
3) Do stick to regular SL\’s, try to trail your stop loss
4) Work only with EOD data. Intraday data is a lot of noise.
5) Don\’t waste time on indicators – they complicate and over-engineer your model. At best, stick to MAs, BB, or ATR
6) Since you are coding this, dont stick to just Nifty 50, expand the universe to the 100 or 200 liquid stock, maybe the largest companies by marketcap
7) Don\’t bother about other ratios like sortinos etc. How is this adding value?
8) Generic SL\’s won\’t work. Incorporate volatility based SL. Check this https://zerodha.com/varsity/chapter/volatility-applications/
9) Look for RRR like 1.25…anything above 1 is good.
10) Dont give up easily. You\’ve come this far!
Hello sir,
Please suggest me some application software for technical analysis.TIA
You can use Kite charting engine. It has everything that you may require 🙂
In godrej CP, recently stock is having lots of hanging man, spinning top etc and all in combination of red and green both. How to interpret such candle stick pattern. If you can look into the chart and revert back, would be great. Thanks in advance.
Look at it from the overall trend perspective. You cant base your trades based on spinning tops, but hanging man yes. Do run through the checklist before initiating a trade.
Hello,
In last checklist it is said that as per Dow theory check for primary or secondary market trend. and be cautious if it\’s a secondary market trend.
If primary trend is bullish for quite a long time then wouldn\’t secondary trend will be minor correction, giving opportunity to enter the market before next upmove?
I mean after having some bearish trading session, secondary trend will give indicators of next upmove and that could be a buying opportunity.
Please correct if I have understood it incorrectly
That\’s correct. By being cautious I meant to say that that you should not mistake the secondary trend as the primary trend, if you do you, you may just get caught on the wrong side of the trade.
Sir, Your work is fantabulous.
1. Can you elaborate on drawing Support and Resistance lines in inclined form? Are they reliable if they are well spaced in time?
2. What do you think of Triangle patterns ( and channel patterns)?
3. Are the triangle pattern breakouts and channels breakouts sustainable?
Thank you so much for offering such deep insights and knowledge.
1) Yes, they are reliable. I\’ll try and do a note on this
2) Hmm, nothing special. Works to identify a regular breakout
3) Prefer channel as this is built over a longer time period. The triangle can be really short term.
*Intraday CO for equity
Sir, one doubt.
If a company, lets say ITC has futures contract lot size of 3,200. Will the margin required to trade in intraday futures b same as that of money required for Intraday CO ??
Intrday CO – you mean cover order? The margin for futures is different compared to Equity CO.You can check the same here – https://zerodha.com/margin-calculator/SPAN/
Module 18.4. Flag formation.
Sir, I am not able to understand below line under this module. Can you please elaborate & How we can benefited with this please explain in detail or suggest any book or article for detail study about Dow theory.
\”The price decline can last anywhere between 5 and 15 trading session\”
Have discussed many of those in this and the previous chapter, Yogesh.
Understood Kartik. Thanks.
Welcome!
Hi Kartik,
Does the flag always appear during a bullish trend only ? Does it also appear during a bearish trend ?
Colloquially, Does smart money always enter the market with a long position (owing to the accumulation phase theory) ? Or they sometimes enter short trades too (meaning they enter the market during the distribution phase or when their analysis tells that the price is going to drop) ?
Mrinal, that\’s right, a flag formation is formed in an uptrend.
Hey Karthik, I need some advice I have recently completed the technical analysis articles but when I\’m trying apply practically I\’m finding it difficult to remember all the patterns and apply it. how can Improve myself about remembering all the patterns and to apply in practically? what are the ways you are suggested even it is a small steps I\’m ready to follow that.
You have to get used to thinking about candlestick as a manifestation of price action points. When you do that you don\’t really need to remember the patterns, you will see them as a viable trading opportunity. This takes time and experience across many market cycles, but if you are at it, you will get it soon 🙂
Sir, I\’ve seen Many technical analyst saying channels and using a rectangular area, that is some what rotated according to the trend.
Aren\’t we gonna study that? Isn\’t it the range is the same as channel 🤔
Yeah, it is the same. These guys like to complicate simple things 🙂
Sir, does the support and resistance should need to be straight line?
Shall we consider the trend line (https://imgur.com/a/00ojIUo) as support and resistance.
Is there is any specific term for this, kindly explain
Yes, you can consider the trend lines as S&R as well. Unfortunately, I missed discussing this point in the module 🙁
Sir, I understood the primary trend and secondary trend, but how can we use that for our trade.
let\’s say, if I\’m bullish on the market, does both the trend need to be bullish, in order to take a trade. or if primary trend is bearish and the secondary trend is bullish, shall I take the trade
There are a variety of combinations here. For example for long term positions, you want both the trends to align, for contrarian calls you want both the trends to be opposite. So it really depends on what you are trying to do 🙂
Sir, how can we set the Stoploss and target for the flag formation
The low of flag marks the SL, Nagit. But this is not a candlestick formation, so there are no rules here. You just have to improvise on the situation.
i just finished the course zerodha offers to students on instagram, it was amazing and i know a lot about short terms trading. but for the next step i want to learn about finance can i get help? i just wanted to know where i can learn finance in depth. im a 16 year old so i wont be able to do any courses offered by colleges.
thank you!
Which Instagram course are you talking about, Ishan 🙂
Zerodha Varsity has many topics related to Finance, you should checkout one by one 🙂
Dear Karthik,
Thank you for your prompt reply and answering these queries. Much appreciated!
Regards,
Nirav
Happy reading, Nirav!
Dear Karthik,
Many more thanks to you for this all information.After learning TA in Varsity, It changed my perspective for trading. I have few doubts, Kindly help me to clear with this.
1) As an Intraday trader, which candelstick time-frame should i follow? 1 min or 3 min or 5 min?
2) I am using EMA 5 and EMA 9 crossovers. Is it okay?
3) I am comparing EMA corssover with standard MACD. So, when I have same signals in both indicators then only I consider trade. Of course, our checklist also should be meet at this point. Is this process fine specially the indicators?
Hope for your positive response, as usual.
Thanks a ton again.
Regards,
Nirav
1) Start with EOD, once comfortable try 15mins
2) Increase the frequency a bit, especially if you are starting new
3) Yes, but mixing 2 or more indicators, in the long run, may not be a useful affair (personal view). Good luck.
Hello Karthik,
in S&R chapter, it is written
\”S&R should confirm to the trade. The stoploss price should be around S&R
o For a long trade, the low of the pattern should be around the support
o For a short trade, the high of the pattern should be around the resistance\”,
but its written as,
\”A trader will take a long position when the stock price breaks the resistance levels and will go short after the stock price breaks the support level.\”
these two thoughts are contradicting. Can you clarify please?
When prices break through support, the support becomes resistance and vice versa.
Really sorry sir, i asked before reading the topic \’Trading the range breakout\’, everything is clear now.
Happy to note that, Rajesh! Good luck and happy trading 🙂
Sir,
Regarding range false breakout, we can know about it by volume and momentum. But above in the chart related to second breakout example where volume is good but the momentum is not enough. How can we know about momentum at the earliest? i think momentum is checked only after it happened like a lagging indicator type, so how can we avoid this false breakout where volume is high?
Dear Karthik Sir
Case to case basis means
other points mentioned in the checklist according to those or something what ?
Yes, you look at it basis each trade. You cannot generalize it. Thats what I meant.
Suppose I\’m going to short sell
Should I see Primary and secondary trend must confirm bearish trend according to Dow theory prospective.
If primary is bullish n secondary is bearish
Should I go ?
Or
If primary is bearish n secondary is bullish
Should I go ?
Or both are bearish then I should go for trade ?
It is best if both trends are aligned, if not, do look at the candlesticks (price action) and take a call on a case to case basis.
Now understood, at day of end (EOD)
I have to check chart at least for 2 to 3 back to find out primary trend
As well as at least 6 months back to find out secondary trend if both confirm with above checklist then I should go for long
Am I right sir ?
Same I can check EOD chart on weekly base too or not ?
Yes, that\’s right Hitesh.
For Primary trend
Monthly chart, ryt?
For secondary trend
Day or weekly chart ?
Please give more ideas
You can use EOD chart for both primary and secondary trend.
checklist to confirm primary & Secondary trends
Means for long term
Both trends must indicate bullish trend , ryt?
Monthly time frame – showing bullish trend
Day or weekly time frame – showing bullish trend
Ryt or wrong ? Please correct me
It\’s the right method to identify primary and secondary Trend?
Yes, both the trends should confirm.
Karthik Sir
How can we say it\’s primary or secondary trend
If am I wrong please correct me
According to dow theory
To identify primary n secondary trend
By using monthly time frame if we see bullish trend there on the behalf of indicators n lots of things mentioned above. Can we say it\’s primary trend?
Same using monthly time frame we see correction, can we say it\’s secondary trend? Or week or day time frame if we use n we see some corrections then we can say it\’s secondary trend.
Please sort out my this confusion.
Primary trend = Evaluate the underlying asset from at least 2-3 years perspective, you can look at EOD charts for this.
Secondary trend = Evaluate the underlying asset from at least 6 months years perspective. This gives you a shorter-term perspective.
Hi Karthik,
Could you please explain what is \”Bid ask spread\” ? And
You said make sure stock is not operator driven.
What is a operator driven stock and how to find it is a operator driven stock ?
Thanks for giving clarity for my previous question. 😊
Ganesh, check section 9.6 -https://zerodha.com/varsity/chapter/the-trading-terminal/
Operator driven stocks are basically stocks which are operated by a group of people. The usual candidates for this are illiquid stocks listed on BSE.
Hi Karthik,
First of all thank u so much brother for your effort. Literally it had helped me a lot.
My doubt is simple, When you say in the checklist to confirm primary & Secondary trends what you mean exactly.
Ganesh, it should go with a larger trend (when you look for 1 -2-year perspective) and also the short term (say 3-6 months) trend. Think of it as a situation where a stock in long term uptrend has correct a bit and now bouncing back from the recent lows.
Thank you
Hi Karthik,
Thanks again for the amazing work..Really appreciate it..
My doubt is about the RRR..Suppose there is a long trade on D2 based on a really large bullish engulfing pattern.Obviously, the SL would be quite steep (opening price on Day2).and it\’s likely that the target may be closer …making the RRR maybe less then 1…should I go ahead with the trade (the 1st 3 in checklist are conforming) with less exposure or full exposure or not trade at all?
Thanks
I\’d personally hesitate to take this trade, but yes, if you feel compelled to take the trade, then maybe you should do so with reduced bet size.
sir how to create watchlist and select stock for swing or positional trading from nifty 50 stocks using technical analysis
Swing trade depends on the pattern. I\’d suggest you look at the Nifty 50 as the proxy watchlist.
Hi Sir,
Need your guidence, when i look at a particular stock from checklist prospective and I try to apply checklist on daily/weekly/monthly chart, I get different results so I get confused and really not sure when to apply checklist and on what timezone because sometime when i apply the checklist on daily chart it gives bullish sign but same checklist applied on weekly chart for same stock gives bearish outlook.
Thanks in advance
Vikas, hence the reason to stick to a single timeframe, EOD works if you ask for my opinion 🙂
Thanks karthik; really appreciate your time!
Happy reading!
Hi karthik.Just went through RRR.what would you suggest RRR for scalping ?Love what you\’re doing and keep it up
RRR for scalping could be 1:1 or even lesser. This is so because these are ultra short term trades.
Hi Karthik Sir,
Good Morning.
First of all, I would like to thank you for the simple and efficient way of teaching the complicated stuff in very clear and simplest way to even beginers like me. and it is easy to review the whole topic, if I didn\’t understand it ,in first reading.
Now, I have few doubts.
1). If I want you to see, my chart study, How can I study the charts in Zerodha, Like, Fibonacci, making trend lines, Horizontal lines, support level, resistance level, because studyning ( Pencil mark) is not working in my Zerodha Kite, and how can I Post It to you?
2). Many Tools Like Fibonacci is not there in my study portal in Zerodha Kite?
In Chapter 18.3, Trading the Range Breakout:
\”For example with the breakout at Rs.168, the minimum target expectation would be 43 points since the width is 168 – 125 = 43. This translates to a price target of Rs.168+43 = 211.\”
According to the prior example in the context, wouldn\’t it be
\”For example with the breakout at Rs.165, the minimum target expectation would be 37 points since the width is 165 – 128 = 37. This translates to a price target of Rs.165+37 = 202.
Please look into the matter. Thanks 😊.
Great material, studying them for last 1 and a half months.
If this corrects out then plz let me know with a msg.
Saikat Sarkar: 9874425776
Thanks, Saikat. Let me check this, could be an oversight. But the idea stays the same 🙂
I agree to you on the point.
Now, In this case, if i want to trade, how can i make a profit? What analysis or study should i do?
The only way is to experience the market and develop your own risk-reward temperament. This comes with experience and market observation for at least a few years.
Please reply Karthik
I did, Suhas.
I couldnt understand any pattern in last month. I mean is is too volatile to generate pattern? Or is it not following the candlestick guidelines? Or is it that we shouldnt trade crude using candlesticks?
I am failing to get answers to these questions
Suhas, markets have been volatile, no doubt about that. Patterns form as an outcome of these movements in the stock market and not the other way round, hence, you cannot expect the markets to follow the guidelines 😉
Hello Karthik,
I have been watching crude oil charts 15M, 1H and 1D but i couldnt recognise any pattern in it. Please guide me in that regard.
Will check, but then you cannot do much if there is no recognisable pattern 🙂
Ohk. Sounds fair.
But how to calculate S&R levels for commodities? I mean for Day charts i should refer 6 months to 1 years candles (Day wise) but in commodities, i can see only 2 month data at max.
Then how should i manage that?
It is the same way you\’d for stocks, Suhas. No changes.
Yes Karthik, you are right. After that it went so down that i would have lost 3-4K.
But was my analysis right?
If you would have been at my place, would you initiate the trade?
Yep, I\’d have probably taken the trade, would have looked at the volume and S&R levels as well to ensure things are aligned.
https://drive.google.com/file/d/10DRg_PCS7nfb6gP-xzt5uWqwOBqvxm11/view?usp=drivesdk
Dear Karthik, i was observing zinc for past few days. It was totally in downtrend so was waiting for reversal. Two days ago, it generated bullish harami pattern. I waited for one more day to confirm the green candle.
So i bought it today. It started with green and suddenly went low. My SL hit with loss of 1K.
I couldnt understand what went wrong. 😓
Please guide me.
Well, at the end of the day, TA is all about probabilities. There are no guarantees in markets, Suhas. At least, you dint take a trade on random thoughts and at least you got out the trade with pre-calculated stoploss 🙂
Hello Karthik,
I am a new trader currently trading in commodities futures so far.
1. Being a chart of the month only, I feel there are very fewer candlesticks to identify the trends if I switch to a 1D chart. Could you please tell me how should I position myself so that I can recognize it way better.
2. Also, please tell me how can I identify that the current trend is going to reverse in commodity?
3. How important is fundamental analysis in commodity trading?
Thank you
Suhas, I\’d suggest you look at 1D chart as opposed to a monthly chart. The current trend can be identified with simple Dow theory or even moving averages. I\’d prefer TA over FA when it comes to trading commodities.
Dear Mr. Karthik, thanks for your prompt reply. I fully agree with your view points and I conclude that one has to design and evolve his own strategy and back test it by sustained exposure in markets. Your response is very enlightening and I could read between the lines. : PK Singh, Bhopal
Good luck, Mr.Singh 🙂
Dear Mr. Karthik, This is in context of query of Mr. Shashank given above, dtd. Nov 21, 2018. I am still not clear about depth of knowledge level of Smart Money, their team as a whole or individual fund manager, who handles crores of Rupee of investors. I want to benchmark my level after going through Zerodha University content thoroughly and grasping it with 90% efficiency. If it can be roughly compared as equivalent to High School, Intermediate, under graduate (BA/B Sc.) or PG level. I am very disciplined and willing to learn skills to handle my retirement corpus and see it multiply manifolds like wealth of great investors. : PK Singh, Bhopal
Good luck, Mr.Singh. Having interacted with few \’professional\’ investment management guys, let me assure you that their level of understanding of markets is no different from many of us. The two advantages they have over the retail – (1) They strictly follow investment protocols/thesis (2) They have deep pockets. Understandably so, these two things make a big difference.
I read Nitin Zero to zerodha 60 days challenge
Nitin sir says trading required inborn skill if you not found in you stay away from trading
I am just starting trading one month before
My question is that I am profit in last month trading but in this month I face loss of 1 lac Now I What to do
I want to know how to know that that Inborn skill required for trading is present me or not
What to do continuing trading or stay away
Please Guide I am new
Pankaj, I have a slightly different view on this. I think anyone can be trained to do anything in life as long as you are motivated enough.
That said, I\’d suggest you cut down on trading and spend more time in developing a strategy and improvising on it.
Please explain in short about Head & shoulders pattern
what is it indicate
How it generates buy or sell signal
It is yet another dow patter, I\’m not really a big fan of that. Have mentioned so in the chapter 🙂
So, the dow theory pattern won\’t work in smaller sessions used in intraday trading?
I\’d rely more on the candlestick patterns.
Hi Karthik Sir,
This is purely a wild guess, but I have a doubt.
Does this look like a possible Head & Shoulders pattern in the forming?
https://drive.google.com/file/d/1MHkDj1nP9dStryCrpUTZ_PiVsno39A0Z/view?usp=sharing
Yup, it does. But personally I;\’ve never really been a fan of these patterns 🙂
Okay.
So, in your experience, how reliable are these patterns?
Thanks.
It depends on how you use them. Not all patterns can be applied to all stocks. For example, a bearish engulfing pattern may work extremely well on ICIC but may fail on HDFC. So the trick really is to know which pattern works on what stock.
Where Can I learn Elliot Wave? please help!(Suggest)
Hiten, not a big fan of that. I\’m really not sure of good resources for this.
Sir if all these conditions are satisfied means in which instrument should we trade is it in cash,futures or options.
If you are a complete newbie in the market, I\’d suggest you look at the cash market.
WHile looking at candlesticks, does it make a difference whether the high was formed before the low or afterwards to track the psyche of bulls and bears on that particular day? i.e. Would you treat these two differently, based upon the order, when looking for a pattern – OHLC vs OLHC? If possible, could you explain with some examples? Thanks in advance.
In some way, yes. If the high formed first, unable to sustain and trades near the low (therefore creates an intraday low), the outlook is biased towards bearishness. Of course, you should consider at the prior trend as well for this.
Thanks for the amazing work Karthik, really very helpful! My question is how should one set the targets in case the range breaks out of previously formed support/resistance levels?
Rohit, one theory is that if the breakout is strong enough, then the price can move at least to the extent of the range itself. For example, if the stock is trading between 220 – 240 (20 point range), breaks above 240, then the stock is expected to move to at least 260 (240 + 20).
Honestly I have learned a lot about trading just from zerodha varisity, thank you guys so much.
I opened a broker account in zerodha before few months still haven\’t started trading though hoping to start once I finish every modules *fingers crossed, hoping for the best*
Good luck, Mohammed! Hope markets treat you well and you stay profitable!
Hi Karthik,
In the example for RRR mentioned in the very last part of the chapter where a bearish engulfing pattern along with a double top is being formed, the high of the pattern should coincide with the medium term resistance of the stock to validate shorting the same. However, as mentioned in the example, it is coinciding with the medium term support, which seems a little confusing. Can you put some light on this?
Ayush, it should read medium-term resistance (since you are shorting). I guess its a typo.
What exactly makes \’smart money (institutional investors)\’ so smart? Is it some kind of special software or something else?
They can hire smart people to make decisions for them 🙂
What do you say about open low,open high strategy on daily time frame charts becoz this is also widely used by traders.Sometimes it get reversed immediately sometimes it get rallies how to identify whether open low open high sustains only on volumes average or is there any other method for it and how much time we should wait to check whether it gets sustains are not.
I too personally prefer to look at EOD charts. This according to me has lower levels of noise. Btw, there is no technique to figure out if the OHLC value sustains through the day.
This is my examle for the above check-list.
If last 5trading sessions will be in down trend with above average volumes with recognisable cs patterns. If 6th day will be the big short covering day means with counter trend rally for the primary trend with above average volumes and bullish cs
Pattern wat should be our trade should it be on the long side or should be on the short side since the primary trend is bearish.
Reactions and reversals to the primary trend are always sharp and quick. Given this, I\’d always suggest you look for trades in line with the primary trend.
Hi Karthik Sir,
1. I have tried to identify triple top and flag in the chart attached, could you please take a look at them? Also, I am dubious about the second flag formation(the one just before the triple top, and the highest one.) Would it qualify to be one?
Link: https://drive.google.com/file/d/1h_dtUvoOKMh0EMy66l2YSUqTYSj-DXEb/view?usp=sharing
Thanks.
Apurva, the triple top is valid. HoweI\’d not consider the flag (both of them) as valid flag formations.
If you could just share briefly also, the reasons, it\’d be great.
Since, it looks like a rally before the sell off in it.
Thanks. 🙂
A flag pattern should ideally have a short retracement, unlike the one you have pointed out. Hence the apprehension 🙂
Great. Thanks a lot! 🙂
in the range breakout para, u mentioned that a trader will take a long position when the stock price breaks the resistance levels and will go short after the stock price breaks the support level. But Resistance acts a trigger to sell and one should go with short position, right? Then how will it possible to take a long position when the stock price breaks the resistance level?
The general perception is that if the price moves higher than the resistance, then the stock is expected to rally up further. Likewise, if the current price falls lower than the support, then the stock is expected to go lower.
So, if the current market price is more than the resistance , one should go for the long position and if the CMP falls below the Support ,one should go for the short position. Am I right ,sir?
Yes, that\’s right. Also, once the CMP crosses the resistance, that particular resistance now becomes a support. Like with support.
Thanks for the help sir.. 🙂
Good luck, Santhosh.
Sir, Am new to trading. I read and understood first two modules and am planning to read it again well and like to clarify some other doubts. I will read other modules too. But, Is that enough to enter trading with my knowledge on basics and technical analysis or should I need to read further modules before trading ?
Yes, you should be in a position to identify patterns and place trades in Equity cash segment, Santhosh. Good luck!
Thank you so much sir 🙂
Welcome!
sir in intraday trading in 1min charts the rsi will be in overbought position for the same stock if we see rsi in 15min timeframe it will be in 55 (trending up ) position suppose if i initiate a short position in 1min chart the price again goes up and i end in loss.pls advise best time frame to choose to avoid volatility for profitable trading.
Vikas, for this exact same reason you need to stick to one-time frame. I\’d suggest you look at 15 minutes time frame.
sir how to spot price volume breakout.pls advice and if we initiate a trade after breakout what is the minimum time frame we have to wait for better realisation
Can we trade options, by analysing stocks technically?
Yes, you can.
Hi karthik Sir,
**Bit Off Topic Query **
Do traders use mean reversal , arbitrage opportunities, F-score calculations,Mathematical model based (delta neutral),index fund re-balancing etc strategies for executing manual trades. ?
Yes, they do. In fact, the latest module is all about that, check it out – https://zerodha.com/varsity/module/trading-systems/
Your modules are excellent … But please clarify my doubt
In the picture (Trading range) Several times hits bottom and top… There is almost 3 times price hit bottom.. why can\’t we consider it as a triple bottom? How can distinguish between triple bottom/top from a trading range?
I think trading range gives false signals…
kindly reply me
Thank you
Rajesh, if the same price points are hit 3 or more times, then it is referred to as a trading range. Else it is double/triple tops or bottoms. I think the trading range is a great area to trade.
Hello,
If my current account value is Rs. 2000, then can I place Bracket orders/cover orders for two different stocks for a total traded value of Rs.40000. For eg. Rs. 20000 in INFY and Rs. 20000 in RIL.. is this allowed? or am i supposed to close one trade and only after that I can place the new one with full leverage?
I\’d suggest you take a look at the BO&CO calculator here – https://zerodha.com/margin-calculator/BracketCover/
You mentioned RRR is kind of a hard limit right(it clearly tells you to go with the trade or to skip it)? Then it should have been at the top of the checklist(maybe number 3 or 4) right signifying its importance?
Hmm, it is very important. But then so are other parameters, not easy to prioritize. In fact, I\’d like to put the first 3-4 items under 1 itself!
Today, I have noticed a company\’s volume 1.9M which is very huge compared to last 1 week average ( 9K ).
Price of the stock has also been increased in a noticable amount.
The price formed in triple low as on Dow theory.
I infer this as an Smart money entry. Is my inference correct?
Hi Karthik,
I place a short trade on TechM Fut(P: 497 SL 513 T: 463) few days ago and below points were matching with the checklist suggested:
1. Bearish Engulfing (prior trend- UP)
2. High was a couple of ticks above the resistance
3. Primary trend of the scrip- Downwards
4. RRR of 2:1
CMP is 502, should I continue holding or exit. Kindly advise..
Hi Sir,
Can flag formation exist for more than a month (say 1.5 months or more) ?
Not completely impossible. Can happen.
Hi Sir,
Suppose if we are a risk averse trader and if the P2 day is not confirming with the rule \”buy strong ,sell weak\” and if P3 or P4 is confirming with the rule and also till that if the price hasn\’t reached the SL price, then can we enter the trade on P3 or P4 , though P2 was not in favor?
Yes, once a pattern occurs, you can keep this on your radar for upto 4-5 trading sessions, post which the effect of the pattern starts to wane. This is purely from my experience and I cannot really justify this with any data.
Hi Sir,
During Flag pattern also should we need to look for a Candlestick pattern to buy the stock?If so along with candlestick pattern in flag should we also need to buy only on the green day(buy on strong )? Or without candlestick pattern merely just buy on strong is enough? or is nothing needed ,just needed to buy during flag formation?
The flag is dow theory pattern, you can trade that independently without the candlesticks. However, general candlestick philosophy like buying strength and selling weakness helps.
Hello Karthik,
Referring to the below text –
\’A trader will take a long position when the stock price breaks the resistance levels and will go short after the stock price breaks the support level.\’
When you say that \’stock price breaks the support level\’ , does it mean that the stock price goes below the support?
If yes, does it mean that because the stock has already crossed below support (which was intended to trigger max buying activity), there is no possibility now for the stock to be bought highly? Meaning by that when any stock when goes below support shall be short sold.
Yes, that\’s correct. The possibility is there, but the chances are less.
Hi Karthik,
Firstly would like to thank you for the interesting and valuable notes/insights you have in this website to get me started. Have always wanted to try trading but always ended up giving up after reading few pages, until I stumbled unto your website!
I do have few questions in mind though:
1) How many indicators should I be using altogether?
2) Is there a chance that indicators have conflicting views and if so, how should I go about it?
3) Usually how many points of the checklist is sufficient to get conviction in trading as i was wondering if finally finding a trade which ticks all the checklist may take a long time?
Eager to start trading soon,
thank you!
Glad you liked the content 🙂
1) Good to know few, but end of the day stick to few simple ones
2) There is more than a chance, happens quite frequently 🙂
3) Higher the number of points, higher is the conviction in the trade. Given this, you should look at ticking as many checklist items as possible.
Good luck!
Hey Karthik,
When you used to trade, would you at least spot 1 trade a day satisfying the 6 point checklist or you could go more than a week without spotting any? Just want to own your frequency of spotting form Nifty 50 Index stocks.
Thanks,
Ash
I still trade, but the frequency has reduced 🙂
I would run a mixed bag strategies (including the candlestick based patterns), so I\’d have some signal of the other. Hard for me to isolate just this one strategy and quantify the number of signals.
Ah great, then in that case would you be okay to list down the other mixed bag strategies that you employ? I can do a side reading on the same, would be of great help.
Yes, I\’d suggest you look up more on Dow Theory.
I thought strategies mentioned in Dow Theory should be used along with the Candle stick pattern. Are you suggesting those are independent strategies?
Not really, you can combine Dow theory with CS and calibrate your trades. Example – you spot a double bottom and you are looking at a long trade…simultaneously spotting a bullish engulfing will help you strengthen your bullish view.
Yes sir! Exactly looking, i think 🙂 🙂
I finished reading Varsity modules in May and for the last three weeks i am looking nifty 50 fut June contract chart from 09:15 to 15:30 hr unceasingly. I also looked EOD charts of major constituents of Nifty 50.Well i am about to finish Toni Turner\’s book on day trading.
Now i am zeroed on to day trade Future contracts of Nifty 50 using tight SL via CO provided by Zerodha.
I am quite aware of the fact that buying shares in spot for trading is a bit different from trading in Fut. Along with volume OI comes into the arena.
Whatever little i know today is because of Varsity. I therefore request you to suggest me as a mentor if it is right time for me to trade in Fut Contract. I want to add one more thing i did paper trading & performed well.
Thank you
Varsity student.
Happy to know that, Kumar. I\’d suggest you take a look at the checklist. If you think the trade falls within this checklist, then take it…else you may want to hold back for the right opportunity.
Good luck.
Hello sir
I thank you for prompt reply all the time.
A polite request: It would be better for beginners like me if you spend a few minutes of your tight schedule on twitter. Please take it as a request not an advice.
Thank you 🙂
Varsity student
Sure Kumar, I\’m active on Twitter as well – @karthikrangappa is my handle.
Hello sir
Have you noticed the flag formation in nifty 50 for 1 hr chart in June?
Sorry, dint track that. However, do check out EOD chart of PEL – looks like a flag formation.
Opening Range breakout start : 9.15 am
Opening Range breakout end : 9.45 am
Scripts to be selected from the following :
——————————————
These to be done by 9.40 am
1. Top performing index
( select top gainer, top loser, top volume
stocks each 1 )
2. Worst performing index
( select top gainer, top loser, top volume
stocks each 1 )
3. use scanner2.afl to find stocks
4. use wmascanner.afl to find stocks
5. use bigpaisa.com for eod stock selection
6. OPEN = HIGH best few stocks (consider volume )
7. OPEN = LOW best few stocks (consider volume )
now, we have 10 to 20 stocks in list
Strict Rules :
————–
First entry gives profit,there wont be
no re entry on that particular stock
for the entire day
take double qty, if first entry failed
———————————————–
buy entry :
———–
when ORB high breaks on candle closing bias, take a buy
in next candle open price with stoploss
1 percent below entry price.
target 1 % or keep till 3.15 pm
————————————————
sell entry :
————-
when ORB low breaks on candle closing bias, take a sell
in next candle open price with stoploss
1 percent above entry price
target 1 % or keep till 3.15 pm
———————————————–
kindly help me to create trading code for the above logic.. is it possible to do ?
I\’d suggest you reach out to – [email protected], if he is free then he may just oblige with the code.
Hello sir
In intraday trading, candle pattern doesn\’t play a very crucial role. Many times after bullish engulfing or marubuzo pattern there remains downtrend. The indicators we learnt here are lagging. Then please let me know how to predict the trend in intraday trading. Is there some special skill we are missing for such trading ? I have been watching all day one minute basis candle pattern of nifty futures.
I personally find 1 minute candles too noisy for intraday trading. Please increase the frequency to at least 5 minutes.
sir,
how to predict a false breakout? Can you please explain little more. As i have seen many traders caught and suffered a huge lose due to false breakout.
The only good indicator for this is volumes. Here is a general perception – If volume is surging/ then there could be a possibility of a genuine breakout…in the absence of which, the breakout is questionable.
If I find a bullish engulfing pattern in prior downtrend.
As I am considering a long trade based on candlesticks,Is the above candlestick pattern comes under primary trend ?
as the pattern formed in prior downtrend.
You only need to look at the primary and secondary trend to get a broad overview, it is not advisable to mix it up with candlestick patterns.
How to calculate Expected target price(expected change in price) of any security.?
It really depends on the target you\’ve set for the trade.
Hi Karthik ,
i was novice in Stock market,but after reading your different module till now. i have gained quite good amount of knowledge . Thank you for such a excellent study material published on the Zerodha.
i have just one query, will it be possible to share your checklist which i can refer to build my own checklist.
Thanks Shankar!
The checklist I follow is what I have shared in the chapter 🙂
Hello Sir
while trading futures, should i look at the charts of the futures or the underlying entity.
I prefer to look at the chart of the underlying.
Now a days attachment option is not available to upload any images. Pls check & fix up the issue.
Will look into this, thanks.
Hi karthik!
Could you please share how much money can I make by taking trades on the basis of above 6 points checklist. Also could you share how much money you make by trading on an average in a day?
Ankur – Why don\’t you backtest the checklist and estimate the paper P&L?
What is the time frame to select the support and resistance for intraday trading?
Lookback period could be that of last 5 days intraday.
What is the time frame to decide the primary and secondary trend for intraday trading.
No standard rules here – primary is usually the longer term trend, runs for at least a year plus. Secondary can be anywhere between 3 to 6 months.
RRR is not 114/107.
it is 7/5=1.4
Thanks Manish! Will make the change 🙂
Sorry to disturb you Sir once again. I just have one last doubt. I am unable to understand this para related to Dow perspective.
\”When you identify a trading opportunity, always look how the trade is positioned from the Dow Theory perspective. For example if you are considering a long trade based on candlesticks, then look at what the primary and secondary trend is suggesting. If the primary trend is bullish, then it would be a good sign, however if we are in the secondary trend (which is counter to the primary) then you may want to think twice as the immediate trend is counter to the long trade.\”
Could you please simplify this in layman terms. Thankyou.
It just means, that you need to validate the trade that you plan to execute with what Dow Theory suggests. For example if you wish to short a stock, but the secondary trend is bullish then it may not be a great idea to go against the trend. Similarly if you plan a long trade but the trend according to Dow theory is bearish then its good to stay cautious.
Sir, I am bit confused here.
Say if primary trend is bullish and we are in secondary trend(bearish) and we find bearish marubuzo in secondary.Then what I understood is that we should be cautious in such situation since secondary is counter to primary. Am i right?????
Yes, but there is no harm if you go ahead and short. End of the day trades depend on conviction, as long as you are convinced, you should execute.
Hello Sir! I just want to ask if the range is same as S&R or its altogether different concept?
Closely related, but they are two different concepts. In a sense the trading range over time defines the S&R level.
Hello Sir
I have been reading TA on web for short period of time, but this material is way ahead from others. Thanks for your contribution sir to world of TA. Concepts are so clear and easy to understand. Thanks a lot sir.
One question is there:-
As you say for shorting a trade, we can short only on intraday and future trade.We can\’t short on delievery based trade and say CNC, am i right?? If not how to short a trade in downtrend also how to short for next 3-4 months, is it possible??
Thanks for the kind words 🙂
Shorting is only futures or intraday…unfortunately you cannot short in spot market and carry overnight.
Hi,
Many traders say that if we trade in Future and option even if we are in profit by end of the month we lose the money, every month can not make profit whatever strategy or check list follow, in this case what is your opinion?
Well, this just depends on how you trade! There are many traders who do extremely well month on month, check this – https://zerodha.com/60-day-challenge/winners
Sir,
We can adjust the stop loss according to our will therefore adjusting the RRR.
For eg Entry: 765.67
Stop loss: 772.85
Target: 758.5
Risk: 7.18 (772.85 – 765.67) i.e [Stoploss – Entry]
Reward: 7.17 (765.67 – 758.5) i.e [Entry – Exit]
RRR: 7.17/7.18 = ~ 1.0
Here the stop loss can be modified to a different number say 767 . thereby increasing the RRR
Can this be done ? If not then why ? Thank you
Stoploss has to be placed at logical points, hence this does not permit you to play around with SL levels 🙂
Hi Karthik,
can I assume a flag formation for the GM Breweries scrip here? the volumes are not so impressive, seems smart money is still invested. also, at this moment there are no buyers. Can I assume that stock will rally again? what should be the target?
Looks like it, usually when the stock bounces back it can potentially go back to the previous highs.
Pls. refer to section 18.5 – \”… RRR in this case is 114/107 = 1.4\” .
This needs to be changed to \”RRR in this case is 7/5 = 1.4\”
Will check, thanks Pavan 🙂
karthik, i was referring to the chart before yesterdays upsurge in volume with a bullish candle….the chart looked bearish then to me. the analyst mentioned his views yesterday saying that based on day before\’s chart he expects an uptick in the stock price.
I should have realized, my bad 🙂
I would have been bearish too…unless there was some fundamentals brewing.
hi karthik, i heard one of the technical analyst on T.V saying he was expecting the HDFC stock to rally based on the charts…i couldn\’t make out any signal for such an upsurge. can you identify any patterns or signal? there was though, a lot of fundamental news attached to the stock today. would like to hear from you on the same. regards.
The only bullish signal is the surge in volumes along with a bullish candle….good enough for a follow on bullish trend.
Karthik, how could have one traded today\’s break out? was this a range break out? or was it a bounce near support? please share your views.
I would treat the most recent up move as a bounce from the support. The earlier part of the chart is a range breakout. So basically when you look for range breakout, ensure the range is well spread in time (at least for 1 or 2 months in case of EOD charts).
Karthik, wanted to hear your views on the ascending triangle pattern. the chart of ambuja shows a failed ascending triangle in a downtrend. is it more reliable in an uptrend? is it prudent to trade it as a continuation pattern and not look out for a reversal?
Tricky one here – especially considering the presence of support around the same region. I\’d be happy to take a wait and watch approach.
Thanks for that. how should one be trading this pattern? is it more reliable in an uptrend or downtrend?
Ascending triangle is more of a continuation pattern in an up trend. Best to spot this when the market has rallied and the stock is having some sort of correction. So yes, look for it in an uptrend.
Hi Kartik, In the chart attached how would one have traded today\’s break out? i post this under dow theory as i thought there seems to be a symmetrical triangle formation. is that valid? or is there any other signals i should have picked to trade the break out.
Totally valid, by the way this is a good stuff. The only other thing I would add is that the breakout is also near the support region. Hence there is more conviction on the long side.
Sir,
With reference to Capital First chart stock has already rallied much, it is advisable to wait for a correction and to long only when a recognizable pattern occurs during the down trend. Pl. clarify. Regards T.S.S.Kishore
Yes, to initiate any trade there has to be a recognizable candlestick pattern.
Dear Sir
In the above chapter 18.1, What is Morning Doji. Pl. explain. I have benefited with your Technical Analysis chapters by avoiding trades without proper candle stick patterns. This helped me not only selecting good trades but also cutting the losses at the right time. Thanks alot.
Regards
Most welcome, and I\’m happy to know it has helped you. Morning doji start is a regular morning star pattern, except instead of a spinning top on the 2nd day it will be a doji. This is the only difference.
Flag formation bulish indicator.
dear karthik sir..
I\’m so happy person in this world….ha ha ha karthik ji, thank you, thank you.
I enjoyed all each ta indicators happily, in my office each indicator I found perfect i loudly cheerup my self…..everytime i feel like nasa researching like that……again I keep practice regulry & now i\’m going to live fun with my friend \’trend\’…
Ta module helps me a lot, now i\’m planning to buy metastock software because free website arrow up & down some are the indicators giving me false. thank you, i\’ll keep regulry add my workshop with you karthik ji, I believe one day i\’ll search own technique in stock trending..
Glad to know this Girish. Hope you get all the success u deserve. Good luck.
heartly thank you sir….yes i\’m rocking in market sir….your ta article helps me lot, I sincerely studied and worked practice…now see the magic sir…all stocks are rocking…..My Goal is 5,00,00,000.00 cr..
thank you sir.
Dear Mr. Karthik,
I would appreciate if you can elaborate the Dow Theory Primary, Secondary trend confirmation which you have briefly referred to after the final checklist. From the initial chapters, majority of the suggested trades have been on anticipation of the end of a current up or down leg. What exactly should be checked from Dow Theory perspective? Do we have to ensure that the prior leg which is expected to reverse should be secondary (i.e. counter) to the prevailing primary (major overall) trend so that after the reversal our trade should ideally fall in line with the prevailing bigger trend?
Also kindly suggest if my trading horizon is from a few days to a couple of weeks (or to a month at most), which time frame(s) should I refer to for determining the primary/secondary trends? Should it be from a single time frame or multiple ones?
Thanking you for the great work and anticipating an early response.
I personally like to use Dow Theory to get a perspective on –
1) Long term primary trend
2) Secondary trend
3) Double or triple tops/bottoms
4) Flag formation
Besides these, I never use the Dow Theory for anything else. Calling the top or bottom of a rally is not really easy (because its not quantifiable) hence you take cues from formations like double top/bottoms etc. Also I would suggest you rely more on candlesticks as opposed to Dow Theory.
Suggest you stick to EOD data for the kind of trades you prefer to do.
Dear Mr. Karthik,
Thanks for the quick revert. Just wanted to know whether the long term primary trend and the secondary trend are determined in the daily charts or weekly/monthly.
Also from what you have elaborated, it appears to me that a secondary trend by definition must be counter to the primary trend. Please let me know if I have correctly understood it.
Thanks again for the wonderful work!
Deep
I would suggest you look at the EOD chart to determine the primary and secondary trend although you can use a weekly chart to determine the same. Yes, the secondary trend has to be counter to the primary trend. So if the primary trend is bullish secondary should be bearish, vice versa. Also, do remember the secondary reactions could be short lived. Meaning if the primary trend is a strong bullish one, then obviously the secondary trend is bearish…but in the backdrop of a good bullish trend the secondary trend could last for a relatively short time…which means to say you should be quick to buy on corrections 🙂
Thanks a lot for the help!
Most welcome 🙂
totally i am unable understand how to fix up the target pl help me in detail if possible with eg.. i have gone thru many books and stock chart .com and now i found for people lke me the infn what u have provided is very much useful. i have alredy lost some money. i am very new to zerodha, i am already 66 now i am entering this field.
Sir I would request you to go through the chapter on support and resistance – http://zerodha.com/varsity/chapter/support-resistance/. I have explained the concept of target and stoploss in detail. Also, I would sincerely request you to go through the Technical Analysis chapter from the beginning and follow the contents closely. If you have any queries please post the same and we will be more than happy to help you through. Also, request you to trade with small amounts till you get comfortable with trading.
This image suggests the EW2 pattern ending and the beginning of EW3. Could you confirm this?
the present EW looks like trend reversal EW.
Its the end of EW2 and waiting for a breakout. The end of EW2 is also supported by Fibonacci levels and the pennant. The only thing it is waiting for is a trigger.
Have a look at the attached image. Is it following a similar pattern like that formed in Waterbase (the earlier image)?
Could you tell us what is the current Elliot wave as in (EW1 or EW2 or others)?
EW, you need to use in combination with fibanocci retracement. Based on S/ R lines you can judge if current EW is a continuation of the previous one or new EW altogether. Also you can take help of trendlines.
Above one, looks like continuation of existing EW
Can I ask you certain questions on certain chart patterns on certain stocks? I need a confirmation before I ask you the questions. Thanks in advance.
Of course, as long as it is educational and helpful to other 🙂
Have a look at the following chart. Could you tell me what kind of pattern is this?
1) Is it a pendant or a flag pattern. Is it ready for a breakout?
2) The downtrend pattern, is it the Elliot wave 2 nearing its end and EW3 is ready to take off?
Correction, It should have been Pennant and not Pendant
I have seen all the charts that you have posted –
1) I\’m not too familiar with EW, so cant comment
2) I guess there are too many elements in your charts, from my experience charts should be very basic with just few basic elements. Having too many distracts you from the price action to all the noise in the chart.
In the first chart, in the third encircled zone before the formation of the bearish engulfing, the chart shows a clear cut gap up opening breaking away the traditional resistance, suggesting going long. However, on day 2 the stock has formed a bearish engulfing hitting my stops. On day three after the bearish engulfing it is clear to short from the top. How do you handle such cases, do you take up the loses fast and align with the trend and go short?
Few points that come to my mind with respect to the chart you have pointed out, this is probably how I would handle the situation…
1) The gap up opening is good but it should not be the sole point based on which the trade should be initiated
2) Considering the stock was in a range – I would apply my thoughts on range breakout (which I have explained in the chapter)
3) On the formation of a bearish engulfing pattern, I would initiate the short position (considering other checklist items are in place)
4) After initiating, I would stay put till the target is hit or SL is breached.
sir how can we set support and resistances for intraday trades ? can we do it with the data of few previous trading sessions ?
When it comes to intra day S&R can be plotted by taking a look back period of at least 3 – 5 trading days.
But sir, you had told in the chapter on S&R that for intraday you need to check short term S&R, where you had defined short term as 3-6 months or so.. ? Would you clarify? Thanks!
Aj, yes, having a 3-6 months perspective certainly helps. That plus the recent few trading sessions is what you need to look for.
Hello Sir,
Regarding the chart patterns in 15min intraday chart, how much should be the minimum time spacing to recognize it as a dow patterns??
I my personal trading experience, Dow theory works best on EOD basis. However, on 15 mins intraday basis I would advice you to use it with at least 60 mins separation..that would be four 15 mins candle.
At first you say the formula of risk (RRR) is {Entry – Stoploss} and at the last example you put it as {Stoploss – Entry}???
Need to correct that. Here is what I mean –
Long trades –
Reward: Target – Entry
Risk: Entry – Stoploss
Short trades –
Reward: Entry – target
Risk: Stoploss – Entry