The Dow Theory has always been a very integral part of technical analysis. The Dow Theory was used extensively even before the western world discovered candlesticks. In fact, even today, Dow Theory concepts are being used. In fact, traders blend the best practices from Candlesticks and Dow Theory.
The Dow Theory was introduced to the world by Charles H. Dow, who also founded the Dow-Jones financial news service (Wall Street Journal). During his time, he wrote a series of articles starting from the 1900s which in the later years was referred to as ‘The Dow Theory’. Much credit goes to William P Hamilton, who compiled these articles with relevant examples over a period of 27 years. Much has changed since the time of Charles Dow, and hence there are supporters and critics of the Dow Theory.
17.1 – The Dow Theory Principles
The Dow Theory is built on a few beliefs. These are called the Dow Theory tenets. Charles H Dow developed these tenets over the years of his observation on the markets. 9 tenets are considered as the guiding force behind the Dow Theory. They are as follows:
| Sl No | Tenet | What does it mean? |
|---|---|---|
| 01 | Indices discounts everything | The stock market indices discount everything which is known & unknown in the public domain. If a sudden and unexpected event occurs, the stock market indices quickly recalibrate itself to reflect the accurate value |
| 02 | Overall there are 3 broad market trends. | Primary Trend, Secondary Trend, and Minor Trends |
| 03 | The Primary Trend | This is the major trend of the market that lasts from a year to several years. It indicates the broader multiyear direction of the market. While the long term investor is interested in the primary trend, an active trader is interested in all trends. The primary trend could be a primary uptrend or a primary downtrend |
| 04 | The Secondary Trend | These are corrections to the primary trend. Think of this as a minor counter-reaction to the larger movement in the market. Example – corrections in the bull market, rallies & recoveries in the bear market. The counter-trend can last anywhere between a few weeks to several months |
| 05 | Minor Trends/Daily fluctuations | These are daily fluctuations in the market; some traders prefer to call them market noise |
| 06 | All Indices must confirm with each other. | We cannot confirm a trend based on just one index. For example, the market is bullish only if CNX Nifty, CNX Nifty Midcap, CNX Nifty Smallcap etc. all move in the same upward direction. It would not be possible to classify markets as bullish, just by the action of CNX Nifty alone |
| 07 | Volumes must confirm | The volumes must confirm along with the price. The trend should be supported by volume. The volume must increase as the price rises and should reduce as the price falls in an uptrend. In a downtrend, the volume must increase when the price falls and decrease when the price rises. You could refer chapter 12 for more details on volume |
| 08 | Sideway markets can substitute secondary markets. | Markets may remain sideways (trading between a range) for an extended period. Example:- Reliance Industries between 2010 and 2013 was trading between 860 and 990. The sideways markets can be a substitute for a secondary trend |
| 09 | The closing price is the most sacred. | Between the open, high, low and close prices, the close is the most important price level as it represents the final evaluation of the stock during the day. |
17.2 – The different phases of Market
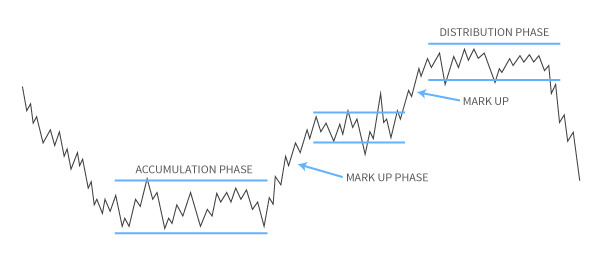
Dow Theory suggests the markets are made up of three distinct phases, which are self-repeating. These are called the Accumulation phase, the Markup phase, and the Distribution phase.
The Accumulation phase usually occurs right after a steep sell-off in the market. The steep sell-off in the markets would have frustrated many market participants, losing hope of any uptrend in prices. The stock prices would have plummeted to rock bottom valuations, but the buyers would still be hesitant to buy fearing another sell-off. Hence the stock price languishes at low levels. This is when the ‘Smart Money’ enters the market.
Smart money is usually the institutional investors who invest in a long term perspective. They invariably seek value investments which are available after a steep sell-off. Institutional investors start to acquire shares regularly, in large quantities over an extended period of time. This is what makes up an accumulation phase. This also means that the sellers trying to sell during the accumulation phase will easily find buyers, and therefore the prices do not decline further. Hence invariably, the accumulation phase marks the bottom of the markets. More often than not, this is how the support levels are created. Accumulation phase can last up to several months.
Once the institutional investors (smart money) absorb all the available stocks, short term traders since the support. This usually coincides with the improved business sentiment. These factors tend to take the stock price higher. This is called the markup phase. During the Markup phase, the stock price rallies quickly and sharply. The most important feature of the markup phase is speed. Because the rally is quick, the public at large is left out of the rally. New investors are mesmerized by the return, and everyone from the analysts to the public sees higher levels ahead.
Finally, when the stock price reaches new highs (52 weeks high, all-time high), everyone around would be talking about the stock market. The news reports turn optimistic, business environment suddenly appears vibrant, and everyone (public) wants to invest in the markets. By and large, the public wants to get involved in the markets as there is a positive sentiment. This is when the distribution phase occurs.
The judicious investors (smart investors) who got in early (during the accumulation phase) will start offloading their shares slowly. The public will absorb all the volumes offloaded by the institutional investors (smart money) there by giving them the well-needed price support. The distribution phase has similar price properties as that of the accumulation phase. Whenever the prices attempt to go higher in the distribution phase, the smart money offloads their holdings. Over a period of time, this action repeats several times, and thus the resistance level is created.
Finally, when the institutional investors (smart money) completely sell off their holdings, there would no further support for prices. Hence, what follows after the distribution phase is a complete sell-off in the markets, also known as the mark down of prices. The selloff in the market leaves the public in an utter state of frustration.
Completing the circle, what follows the selloff phase is a fresh round of accumulation phase, and the whole cycle repeats. It is believed that that entire cycle from the accumulation phase to the selloff spans over a few years.
It is important to note that no two market cycles are the same. For example, in the Indian context, the bull market of 2006 – 07 is way different from the bull market of 2013-14. Sometimes the market moves from the accumulation to the distribution phase over a prolonged multi-year period. On the other hand, the same move from the accumulation to the distribution can happen over a few months. The market participant needs to tune himself to evaluating markets in the context of different phases, as this sets a stage for developing a view on the market.
17.3 – The Dow Patterns
Like in candlesticks, there are few important patterns in Dow Theory as well. The trader can use these patterns to identify trading opportunities. Some of the patterns that we will study are:
- The Double bottom & Double top formation
- The Triple Bottom & Triple Top
- Range formation, and
- Flag formation
The support and resistance is also a core concept for the Dow Theory, but we have discussed it much earlier a chapter dedicated to it because of its importance (in terms of placing targets and stop-loss).
17.4 – The Double bottom and top formation
A double top & double bottom is considered a reversal pattern. A double bottom occurs when a stock’s price hits a shallow price level and rebounds back with a quick recovery. Following the price recovery, the stock trades at a higher level (relative to the low price) for at least 2 weeks (well spaced in time). After which the stock attempts to hit back to the low price previously made. If the stock holds up once again and rebounds, then a double bottom is formed.
A double bottom formation is considered bullish, and hence one should look at buying opportunities. Here is a chart that shows a double bottom formation in Cipla Limited:
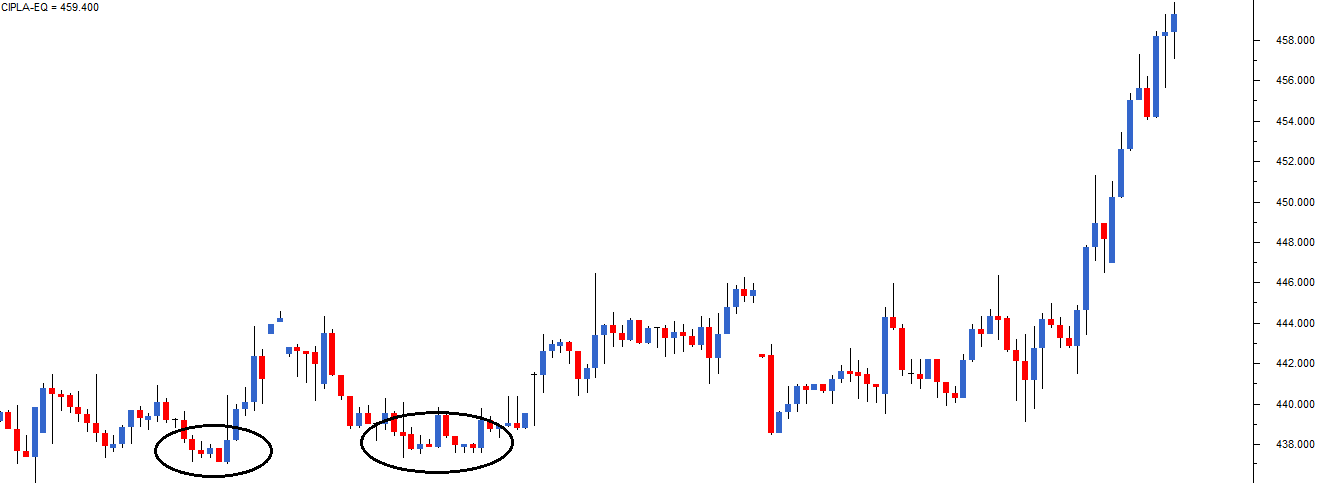
Notice the time interval between the two bottom formations. The price level was well spaced in time.
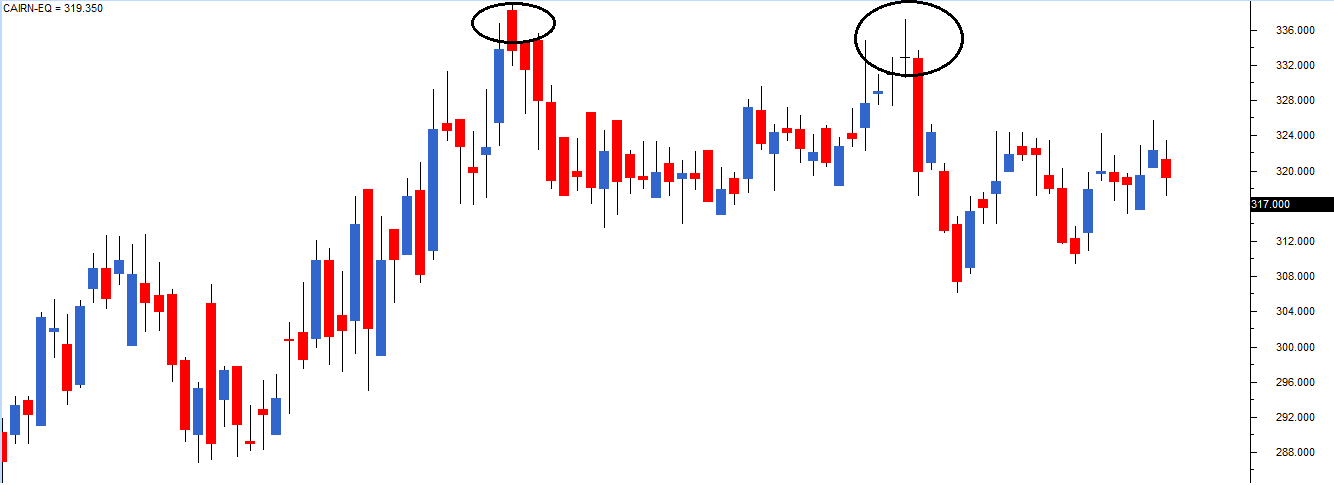
Likewise, in a double top formation, the stock attempts to hit the same high price twice but eventually sells off. Of course, the time gap between the two attempts of crossing the high should at least be 2 weeks. In the chart below (Cairn India Ltd), we can notice the double top at 336 levels. On close observation, you will notice the first top was around Rs.336, and the second top was around Rs.332. With some amount of flexibility, a small difference such as this should be considered alright.
From my own trading experience, I find both double tops and double bottoms handy while trading. I always look for opportunities where the double formation coincides with a recognizable candlesticks formation.
For instance, imagine a situation wherein the double top formation, the 2nd top forms a bearish pattern such as a shooting star. This means, both from the Dow Theory and candlestick perspective there is consensus to sell; hence the conviction to take the trade is higher.
17.5 – The triple top and bottom
As you may have guessed, a triple formation is similar to a double formation, except that the price level is tested thrice as opposed twice in a double bottom. The interpretation of the triple formation is similar to the double formation.
As a rule of thumb, the more number of times the price tests, and reacts to a certain price level, the more sacred the price level is considered. Therefore by this, the triple formation is considered more powerful than the double formation.
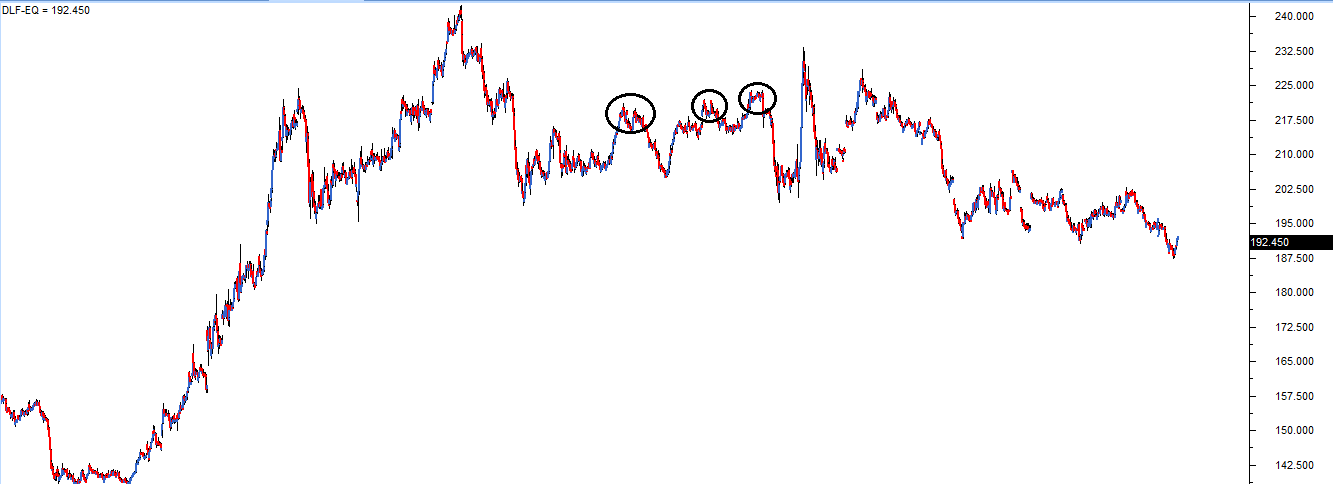
The following chart shows a triple top formation for DLF Limited. Notice the sharp sell-off after testing the price level for the 3rd time, thus completing the triple top.
Key takeaways from this chapter
- Dow Theory was used in the western world even before candlesticks were formally introduced.
- Dow Theory works on 9 basic tenets.
- The market can be viewed in 3 basic phases – accumulation, mark up, and distribution phase.
- The accumulation phase is when the institutional investor (smart money) enters the market, mark up phase is when traders make an entry. The final distribution phase is when the larger public enter the market.
- What follows the distribution phase is the markdown phase, following which the accumulation phase will complete the circle.
- The Dow theory has a few basic patterns, which are best used in conjunction with candlesticks.
- The double and triple formations are reversal patterns, which are quite effective.
- The interpretation of double and triple formations are the same
Hi Karthik,
Can we be a bit flexible in Double Top/bottom & Triple Top/bottom?
Ex: If we have a double top and First one\’s high is 98 and second one\’s high is 100/102. Can we consider this?
Please ignore this question- You have already explained this in the chapter
Sure, replied anyway 🙂
Yeah, you can. But don\’t generalize, take it on a case to case basis.
ok, Thank you
Hi Karthik sir!
I have a question. One of the tenets of the theory says that all the indices should confirm the trend. For example, NIFTY 50, NIFTY BANK, NIFTY IT, etc., should all go up. Why is that? For one sector may be doing great, while the other may be in tough times; yet, the overall index (NIFTY50) may be in a rally.
This is just to ensure the overall market strength is in place to support your view/position in the market 🙂
Hello Karthik,
Thank you for creating such wonderful material. The best part about Varsity is that you’ve kept everything practical and easy to understand.
I have a question regarding points 6 and 7 of Dow Theory:
Point 6 mentions that a trend can only be confirmed when all market indices move in the same direction.
Point 7 states that volume must confirm the trend.
My doubt is — how can one check the volumes of the indices to confirm the trend?
Thanks, Saurabh.
For volumes, you can check its respective futures\’ volume. Else, maybe check the stocks that are heavy weight in the index for volume.
At what point is a trend reversal usually confirmed? Around 20% retracement from the peak/trough, right?
Yeah, 15% to 20% is good, plus you also get a sense of how the market is moving and the sentiment on street. You combine all these to figure whats happening 🙂
I didn\’t understand tenet #8: Sideways market can replace the secondary trends. Please clarify.
It just means, that the sideways market itself can be so prolonged that it can be constituted as the secondary market.
This line needs clarity: \’Once the institutional investors (smart money) absorb all the available stocks, short term traders since the support.\’
Hmm, will take a look. Thanks.
Yes, it was quite unclear to me too.
which time frame should we use to identify the phases? is it accumulation or mark up or distribution. if we consider mark down phase as 4th phase then total phases will be 4. Am i right?
Savita, not sure if I get your query fully, but you can use Eod of day charts and load at least 3-4 years of data for this.
sir where do the different phases of market apply is it only for primary trend or includes all 3 phases?
It applies to all phases 🙂
Sir, could you please suggest websites or applications through which we can use free tools for technical analysis, atleast the basic ones
Why not use Kite, it has everything you\’d want 🙂
I’d like to suggest adding advanced screeners to Kite, such as:
52-week high/low breakouts with volume
Range breakouts
Top OI gainers/losers
Intraday gainers/losers
ETF segment movers, etc. like other brokers are giving many useful features.
Thanks, Jaimin. Sharing the feedback with the team.
WHAT IS THE TIME GAP FOR TRIPLE TOP AND BOTTOM
Have explained double and triple bottom in the chapter itself. Not sure about time gaps.
Please correct this line \”Once the institutional investors (smart money) absorb all the available stocks, short term traders since the support.\” in section 17.2. There seems to be something missing in the part where Short term traders is mentioned.
Sorry, I meant to say, they form the support 🙂
Sure Karthik. Thanks for the response
Sure happy learning 🙂
VCP is Volatility Contraction Pattern – a method used by Mark Minnervini. Many say Mark Minervini is good to study vs older market wizards as his success is more recent.
What if I use a combination of indicators along with 52 week high? For example MACD cross over plus ADX increasing above 25. Is that a good indicator of a markup phase atleast for maybe a few weeks to few months of uptrend?
I read scalping can be useful if you have a big corpus (eg 20 lakhs) as you can enter for short while and get a decent profit just with a short increase in price. Do you agree with this?
What if I have very good risk management in place, eg if I limit my loss appetite per trade to just 0.5 % and decide the amount to invest based on risk level eg if I see a bullish candle or indicator and I see a recent low , I place a stop loss few points below that – formula would be for eg if my risk per trade is 1000 Rs (0.5 or 2 lakhs total corpus) – 1000/(entry price – SL) which will give me number of shares and hence total money to invest in that stock? Would this mean that even if I get a no of trades wrong but a few right I would still be profitable?
About your view on big corpus and scalping – don\’t agree. End of the day, it all depends on price movements and the way you react to volatility.
Here is my suggestion – do it with small corpus and observe your own behavior, see how you react and then figure if this is for you or not?
Hi Karthik. Thanks a ton for all these modules. In a rough sea of trading knowledge your content is like a lighthouse that can guide us.
Few questions
1) Are the Dow patterns related by any chance to VCP since it is also a reversal pattern. Do you think studying VCPs is of any use?
2) Are 52 week high and indicator of a stock entering its markup phase or is it a late entry?
3) Can I screen fundamentally good stocks with good returns using a screener and keep watching them to come out of the accumulation phase? Do you think this is a good method?
4) You mentioned that few weeks to few months is good for secondary pattern. However for Intra day we will have to look at minor trends right? And maybe a prior overall secondary trend to check if stock will continue to go up
5) Can I use the Dow patterns for scalping and is 2-3 lakhs a good amount for Scalping or a bigger amount is better?
6) Are there any specific indicators/signs that help us know if the stock is in accumulation or distribution like combination of moving averages or length of the S/R?
7) I have heard Swing trading gives 30-35% for an expert. Is it worth going down this line for a few years to gain experience and reach this stage. Or should one stick to MF?
Sorry for too many Qs. Thanks in advance
Thanks for the kind words, Swapnil.
1) I\’m not sure what you mean by VCP. Can you please expand?
2) Not necessary. A stock can remain in 52 week state and then make another high. So cant really conclude this.
3) Yes, you can.
4) Yes, that is correct as you tend to shrink your timeframe you look at shorter trends.
5) Its good enough, but I\’d advice you against scalping. Most people end up over trading, paying hefty charges without making a decent profit for themselves.
6) Not really, you will have to visually identify these.
7) All I can say is swing is better than scalping and there are no guarantee of returns in any aspect of market.
Happy learning!
Hi,
Which is valid swing high and swing low. how to indetify it as it is necessary to check for trends. further, what is the difference between Pullback/correction and swing high and swing low. what is the criteria for valid Pullback/correction. whether trens are indenified by swing high and swing low or Pullback/correction
Swing high and lows, are points that you think are intermediate high or low points in the stocks\’s momentum. These are the points where the price rally takes a halt and corrects before resuming its uptrend again. These corrections can last a few days before the trend regains. This is also called the correction or pullback.
Once the institutional investors (smart money) absorb all the available stocks, short term traders since the support
Short term traders since the support means?
Support means buying activity to ensure there is adequate price support, and not letting the price slide further.
Hello,
In para 17.4 about double top and double bottom, it is clear at what stage to buy. There is this line \”If the stock holds up once again and rebounds, then a double bottom is formed.\”
How do we define rebound here? I know a recognizable candlestick can confirm the reversal but it appears its not mandatory. Then how do we define rebound?
Thank you,
Ankur
Rebound is an action where in the price retrace in the opposite direction. There is no % retracement that can be defined.
Can i close my cnc position at 3:28pm ?
Yes, you can, provided the trade goes through.
Hi,
Can anyone help me to find the indicator (name) in Kite that depicts the double bottom and double top formation? Thanks
Not sure if any indicator does this, but maybe you should use a simple support or resistance line.
Thank you for your guidance and support, have been asking you doubts since 2019 🫡
Keep going 🙂
Hi sir,
Can we consider this as a double bottom, stock name: AMBUJACEMENT occurrence date 28/11/2023, attaching the image below,
https://drive.google.com/file/d/1eE0SfP029CcWZxUxNPrPYfXvETEL5Gd5/view?usp=sharing
Thanks sir.
I\’d consider 24th as a double bottom.
If a top Double Bottom indicated SELL. we enter as sell trade then how do we know that third top will not form? After all it takes a few days. What protection/caution do we have?
Double bottom is a validation of support, so its more of a buy and not sell.
Hey Karthik
After reading the \’Phases of the Market\’ theory, I can\’t help but see all the charts through the lens of Dow theory phases and I try to work out the current phase that the stock might be in (Accumulation/Distribution/Mark-up/Fall-of). This helps me set the stage for the longer-term price action.
For example, If I deem a particular stock to be in the distribution phase, I expect it to trade in a range for at least a few weeks (and up to a few months) before falling off, and plan my strategy with that background.
And I tend to ignore the stocks of which I can\’t quite fit into this theory.
Is this the correct way to go about this? If not, how should I apply the Dow theory correctly?
Why can\’t I fit all the charts into this theory? Is this a skill issue or a corner/convoluted case?
TIA
Its best if you marry both candlesticks and Dow and form your views. For example, you could be in a accumulation phase, so dow tell you that largely the prices are going up, but of there is a strong bearish pattern within this phase, then you know that you have to be quick to exit the short as there would be buying on all dips.
Hello sir,
1. Is there any minimum mandatory chart period (like 3 months) within which one should look to identify the patterns of Dow theory and double and triple top-bottom patterns, as it takes time to form such patterns?
2. As you mentioned, there should be at least a 2-week gap in pattern formation. What time period more than 2 weeks is okay to identify these patterns?
Thank you.
1) No rule like that, but personally i prefer at least 6 months chart.
2) 2 or more is ok.
Sir what should be our stance if stocks hit all time high and at the point some bearish pattern occurs. With a nice volume. Bcz there is no resistance out there and no dow patterns so what should we do, can we go for the trade or wait for some other signals to confirm the reversal.
You can continue to hold the stock with a trailing stop loss. So as and when the stock prices increases, your trailing SL also moves higher and therefore locking in higher profits.
Thank you Karthik sir for always supporting varsity students. As I posted queries since 2019 I found that the very next day your reply is ready. I fill overwhelmed with your every reply. And whenever I revisit technical analysis module I found something that I cannot catch or found previously.
Happy to support and happy to note that you still continue to enjoy reading Varsity! Happy learning 🙂
Hello karthik sir,
It\’s important to have good amount of time between triple top and bottom as like double top and bottom, as you mentioned 2 weeks of time.
Yes, the more number of days these points get tested, the better it is Rajesh.
Market is devine. It never follows the same things again and again. There is no proven strategy ever found. Take warren buffet or Rakesh or Mehta.. These all who earned heavily because they kept holding for life long. They lost in 8 stocks however only 2 stocks made their Life..!! As those 2 stocks went from penny to moon..!!
Well, there is argument against that 🙂
Stupid Question: Can TA be applied to something like Zinc Futures, whose data is generally not available for longer periods like one year?
Yes, you can apply TA to anything that has a price movement and historical prices.
Are you anytime in future going to teach about elliott wave theory?? Will be happy if you teach it.
Nope, dont think we will head that direction.
Hello Sir, Thank Again,
On Renuka Sugar chart, mainly from 15th May 23 to mid July, is it accumulation Phase?
from 20th July to till date is it Markup phase?
Yup, thats right.
What time frame should be considered for identifying double top/ double bottom or triple top / triple bottom.
Whether 15 minutes , 1day ,2 days, 3 days, one week, fortnight. Please clarify.
I\’d suggest you look at it from EOD perspective.
are these patterns effective for intraday. If we go for lesser time frames we can see lot of accumulation, markup phase and distribution phases.
sir
in double top pattern
1)how much should be the growth in terms of % ?
2)and in what amount of time this growth should occurs ?
I know that data varies in different cases ,but i am very confused so can you give me some real-life examples of past data so that I can get some idea
Both are dependent on the particular stock and the range its trading in. There is no one size fits all for this 🙂
I just wanted to check if these are available in form of books. I would like to buy complete sets. Thanks
No printed books, Pankaj.
Hey Karthik this is just like one of my dream came true, to learn about market in very simple language. I really appreciate your efforts.
Please help me to understand the structure of out performing small cap companies. As I noticed most of the stocks with outstanding results rally from the momentum zone.
1. Why smart money shows no interest in value zone of a better performing small cap company?
2. If some HNIS invested in momentum zone of a company, what is their real intention ? To hold it for long time till the distribution face or make short term profits and exit?
3. Do they expect more smart moneys to enter or targeting retail investors?
Thanks for the kind words, Renjith.
1) Small caps are inherently more volatile, so many institutional investors avoid small-cap investments
2) If it is based on momentum, then they will hold till the momentum lasts
3) Usually expect bigger players to enter and hope momentum will sustain.
Greetings Sir,
What should we use to evaluate the primary trend, i read in one of the comments above you said we can use trendline over 3 years for getting the primary trend, and trendline for 1 year as secondary trend, my doubt is how much minimum percentage should be considered for considering it an uptrend in case of primary trend.
Also, just out of curiosity can we use CAGR of 3 years to get a perspective of primary trend. If so then what should be the minimum 3 year CAGR percentage for considering it a strong uptrend
You can use 1 to 2 years Dhruv. CAGR may not work, think about it – starting value can be 100, ending value at the end of 3 yrs can be 150, CAGR is great, but what if the bulk of the returns were delivered over the last 6 months? In this case CAGR wont capture the fact that there was no trend for 2.5 years.
how much should be the selloff in terms of % ?
and in what amount of time sell off occurs ?
is around 50-60% selloff enough to be classified as selloff.
Ah, these things really depend on the stock you are looking at, Advait. You cannot generalize it 🙂
sir, what should be the trade setup for double top/ double bottom and likewise too for triple top/triple bottom?
There are multiple ways, once you establish that the range breakout is true (price surge +volumes) –
1) Naked long/short Futures
2) Option set ups
But the key is to be double sure that the range has indeed broken out and not merely a false breakout.
Can you please correct this sentence – \”Once the institutional investors (smart money) absorb all the available stocks, short term traders since the support. \”
Unable to understand what happens here exactly after the institutional investors absorb all the available stocks.
I\’ve eaten up a few words inadvertently. I mean to say that the short term traders end up buying, which drives the stock prices higher. This is the mark up phase.
Is there any indicator on Dow theory in zerodha
No indicator as such, but things like double bottom, double tops etc originate from dow theory.
Is the time interval fixed for double bottom or double top as 2 weeks or can it be more than 2 weeks to fall into double bottom or double top candle stick pattern?
Minimum 2 weeks is good, Arvind.
Section 17.2 Para 4 : \”Once the institutional investors (smart money) absorb all the available stocks, short term traders since the support\” , not sure if \”since the support\” is typo or not?
Looks like I\’ve swolled a word. Taking up the task of cleaning up the content soon will fix this. Thanks for pointing.
Sir, how can we judge whether a double top bottom formation will either result in higher price movement or triple bottom position??
Only by experience, no formal technique as such.
The Dow Theory is excellent in all type of market. Thank you Nithin Kamath for this information.
Happy learning!
\”It depends on how you use them. Not all patterns can be applied to all stocks. For example, a bearish engulfing pattern may work extremely well on ICIC but may fail on HDFC. So the trick really is to know which pattern works on what stock.\”
Above comment is yours sir, i want to ask as you said this so how to analyze, if some pattern works well in one stock and not in other stock,
if i take trade and put my money and TA is fit according to checklist also but trade fails, so it feels that it is not necessary to get success trade even after TA fit according to check list, then what is the advantage to analyze different stocks if we select 2-3-4 stock and TA will not fit on that then i loose money and also confidence as well patience.
yes we can bare this pain if we do paper trade then we will get by practice but if we are doing in real cash after practising a lot then also every time or most of the time our trade failed as you said according to above comment,, i hope you understand my query sir, so i think this is the speculation because probability will be there,
i understand that there is no 100% perfect strategy or rule to make trade success,there is some probability either to win or loose we have to make conviction by practicing, sometime i can earn and sometime i can loose according to strategy, but in your above comment i think there is something different concept that pattern strategy may fail in some stock and may works well in some stock ,please clear that why so??
Neeraj, I posted another response explaining the same. At the end of the day, TA enhances your odds of being profitable. There is no guarantee here.
ok sir got it thanks for make me understand……
Sure. Happy learning!
hi sir, you are master in trader and having more than enough knowledge in both trading and investing,you are an expert thats why you are giving this knowledge to all. So why you are saying this in above comments that—-
\”Prabhajeet, I’m not trading actively. I take up a trade only when things seem compelling, which is very rare. I invest in the market though, very actively. I invest via both mutual funds and direct stocks. Both the portfolios are doing ok\”
things seems compelling is very rare for you then, what will others learning and experts trader do how they earn a lot if opportunity will be rare, then how and why others trader trade most of the time or do trade in daily basis who are doing good .
Are you getting my point – if i want to become regular trader or may be trade weekly or monthy or daily then how this will going, afterall by getting much knowledge and spending time for doing trade and after that if i do trade very rare which is monthly or after every 3-4 month then how i will become regular trader and how will i earn by doing trade very rare,,, i am just asking because you said that very rare you get opportunity and you do trade very rare, because you also invest for long., but if other traders who dont invest for long and they want to do only trading then how they will do and get something more. because there will be many other traders who will be doing trading regular i dont know how they do but confused, dont you think then this will be like part time .,what if who want to become full time trader, and what is the way is it correct or wrong , is it correct that opportunity will be rare or many time… please dont take it in wrong manner , i just getting confused by this because i also want to be regular trader ,so confused with this point because i dont want to invest for long , actually want to invest long but aftersometime when i will be good to go in trading. please clear my this doubt fully in maximum words .hehehehehe thanks i am waiting ….
Neeraj, I dont trade actively for the only reason that we are not allowed to trade. It is the company\’s policy. But that said, if in case that restriction was not there, I\’d trade only when the trade comes across as a compelling trade, which as you can imagine is not so often.
Sir, Are we using one day time frame for intraday technical analysis.
YOu can use EOD charts also. But most people prefer 10 or 15 mins charts.
Yes,extending it further if we are identifying a strong S&R then is there any need to look for these Dow Jones patterns?
Or are they are the ones which act as a gap fillers/Mini S&R when there is huge gap between the current identifying pattern and strong S&R?
Guide for the same.
Thanks in advance!!
Paras, it\’s best to combine these things and get an overall perspective. So dont ignore one thing over the other 🙂
You didn\’t got the point I guess, A important aspect of dow Jones is the support and resistance as we used to consider price actions zones which are well spaced in time on the basis of large historic data here but we use only 2 or 3 candles which are well spaced in time to identify the mini S&R.That is what I was talking about.
Yeah, since the S&R is basis 2 or 3 candles only, our reliance on this S&R won\’t be much. Right?
Can we say that the patterns in Dow Jones theory are a lighter version of price action zones which we considered while forming a support and resistance zones just that here we judge only on the basis of two candles whereas while plotting S&R\’s we considered historical data on large scale.
Guide for the same.
Thanks in advance!
I\’d not say they are lighter. Remember, the US markets was traded based on Dow for a long time until the candlestick patterns gained popularity.
\”Once the institutional investors (smart money) absorb all the available stocks, short term traders since the support.\”
Since or Sense?
Sense 🙂
As a Swing Trader, While evaluating a stock, wouldn\’t it be prudent to also analyse from the perspective of which phase the stock is currently in? So that we don\’t end up taking a Short position at Markup Phase or a Long Position at the MarkDown Phase. Should we or not add this point to the Grand Checklist?
Of course, it does. I think we have discussed this in the subsequent chapters and the checklist itself.
I fell like the paterns discused above are like support and resistance zones?
Am i right sir?
Yes, it is all an extension of the S&R concepts.
Thank you so much sir for your view 🤝🤝
Happy learning!
—-From Comments—-
Sumeet Chavan says:
Hey karthik. What if i take a trade based on the double bottom pattern and buy the stock as soon as the double bottom pattern is formed.
But it can also form a triple bottom pattern after my buy. So i this case i will lose my money if i buy after the double bottom pattern( in case it forms a triple bottom pattern).
So whats the reliability of this pattern. On what basis should i take the trade???
Karthik Rangappa says:
Hence, I always prefer to take an option position when I spot such opportunities based on Dow Theory!
My question:
Sir can you please shortly explain why you prefer option when opportunities based on Dow Theory? is there is any advantage? (actually im not went through option module yet)
It is just that with options, you know what your worst-case scenario is before entering the trade. So even if the trade does not work out the way it does, then you know how much loss you will suffer from it.
From chapter: Triple top and bottom,
\”the more number of times the price tests, and reacts to a certain price level, the more sacred the price level is considered\”
Sir, Is it means these tested levels are very strong and hard to break?
Thats the idea, Yathish.
Sir, can we say that Accumulation and Distribution phase is kind of sideways markets?
Thats right, Yathis. Usually, it lacks a trend.
Why not as retail investors, invest during the accumulation phase? Currently, Zoom Video is I entering the accumulation phase. @Karthik what\’s your thought on it?
I don\’t really track US stock, so can\’t really comment on that. As far as why retail don\’t participate, they probably do, but will they hold onto their investment is the question 🙂
Fix the error here , Karthik Rangappa Sir ji. \”Once the institutional investors (smart money) absorb all the available stocks, short term traders since the support\”
Thanks in advance
Noted, thanks for pointing it out.
In you\’re point of view can we attribute \”Dow theory\’ to current market rally, the covid crash and the current euphoria in the market
Sorry, dint quite get that. Can you add more context to your query? Thanks.
\”Once the institutional investors (smart money) absorb all the available stocks, short term traders since the support.\”
I am afraid this sentence doesn\’t add up. Could you please clarify?
What I mean is once institutions absorb the shares, short term traders also buy and support gets created. Sorry, I guess I had swallowed few words 🙂
How to find daily nifty and bank nifty support and resistance levels
YOu can plot the same on the chart by using the technique taught in this chapter.
Thanks Karthik for the confirmation
Good luck!
Hi Karthick,
Shall we consider double/triple bottom pattern as accumulation and double/triple top as distribution?
Yes, it is in fact a part of distribution and accumulation.
On what time frame I can find this type of patterns sir.?
All time frames, including EOD and intrday.
Dear Sir,
How come you don\’t talk about triangles and broadening formations?
Aren\’t they part of the price patterns?
They are and there are many more as well. I just included what I thought was important to know.
Can we apply this in swing trading..?
Yup, you can.
thank you
Its an assessment opined by many experts, but where would you put it in context of DOW theory ?
Sorry, I may have missed the context, can you frame the conversation in a single query?
Hi Karthik,
Looking at trend of market in last one year would you say that mkt is in consolidation phase post rapid rise after COVID scares in last year? Or is the timeline far too short to arrive at a consolidation phase yet?
Regards
The current market is a bit weird, not really sure why its up 🙂
This is a great explanation!!
Happy learning!
Hello Karthik,
A big thumbs up for your efforts and the way u explain things. I was wondering if we can use all these TA in option trading as well ?
Thanks
Happy learning, Ankit. Yes, you apply this on spot and then take appropriate decisions on options.
Sir , then what percentage difference is allowed in double top or double bottom. Like if its double top , then how much percentage they have to be close. Is till 1 % allowed ?
It is the number of times these levels get tested, that\’s all the difference.
Sir, how much percentage of change is accepted in double top formation. First high was 99.850 and second high was 99.860. During this time The lowest was 99.835. Is this okay to be accepted as double top formation.
That is too close, I\’d not consider this as a DT.
Hi sir,
what timeframe candlestick charts should I look into daily, monthly, or weekly to identify the primary, secondary trend for swing trading?
thanks in advance
End of the day would work.
Dear Sir,
Can you talk about fib projections and how one should go about using them to set targets?
Hmm, will try and add a note on this.
Sir, if 3-top or 3-bottom is formed, and stock price is coming 4th time to these levels. Is this the sign of a potential breakout? Will these levels become weak?
Tough to predict as these prices can stay in the range for an extended period. We will know only when the breakout happens.
Can we use dow theory in intraday trading for time frame of 5 minutes?
Yup, especially the concept of range trading.
valuable lessons
Happy reading!
Hi Karthik,
I have been reading your content since a long time and got very useful information about the market which is helping me to grow. I have a small question. How can I know when you update any module in varsity? Is there any notification system or email through which I can get to know if any new content is added? I really don\’t want to miss out on any new information.
Karthik, the best way to keep track is on Social media, especially our Twitter handle – https://twitter.com/ZerodhaVarsity
Sir,
Thanks a lot for your reply.
However regarding my question no.1, I know i can do swing trading in spot market. My question is whether I should apply double/triple bottom formation patterns and other Dow patterns in swing trading in spot market or not ?
My apology if i misunderstood something here.
Regards
Thats right, you apply these theories to spot market and take the positions.
Hello Karthik Sir,
1.Is it advisable to use double/triple top/bottom formation patterns and other Dow patterns only in option trading ?
2. What is the use and relevance of primary/secondary/minor trend in swing trading ?
Regards,
Rajnish
1) Nope, you can do swing trading in the spot as well
2) Gives you a perspective on the overall trend and take better decisions
Hi Sir,
What will be the trade setup for double bottom ?
Should i go for trade just after price has hit the same low ? or i should wait for 2-3 trading sessions after low point. ?
Regards
Ishwar
Go long with the low of the double bottom working as the support/sl for the trade.
Sir, while observing a chart, can there be both double bottom and double top? How should i consider which one to take?
https://www.tradingview.com/x/BB5AB9aV/
Like the chart above.
Yes, that\’s possible. In fact, this is what causes a trading range.
Sir, what would be the stoploss in double bottom and double top formations
The double bottom itself or maybe 1-2% below the double bottom.
Cool.
Then currently should I stick to the web version for other modules ? That seems full fledged. Right ?
Both are the same, except for minor differences 🙂
Sir, I have almost completed the TA module and I think I will be finishing it by this week or next week at most.
However there is some difference between the Web version and App version, like Fibonacci is not included in App version as well as few end chapters like supplementary notes, central pivot range, etc.
I wanted to know whether same is the case for other modules as well ?
What would you suggest the Web version or the App, so that i don\’t miss out on anything important ?
Since for TA i was shuffling between both and now for other modules, would like to stick to one thing (either Web or App).
please do share your thoughts.
Thank You.
I think there are minor differences, but we are working on plugging it so that its seamless across both the platforms.
Thank you so much Sir.
it is really helpful.
Good luck, Sunny.
Sir, when talking about double/triple bottoms and tops are we not talking about Support and Resistance in hindsight, as well as breakout and breakdown respectively ?
1. Suppose we find triple bottom in one case, aren\’t the chances high that the stock will breakout this time ?
2. Similarly in case of triple top, aren\’t the chances high that the stock will breakdown this time ?
3. Is there a possibility where one can find both formations forming simultaneously since the prices are in the same range of support and resistance ? and here we won\’t be sure then, whether its going to breakout or breakdown.
Hope my question is clear enough.
please provide some insight on this.
Thank You.
Yes, double/triple bottoms and tops are other forms of S&R.
1) Cannot conclude as the triple bottom can continue and the same price can be tested multiple times
2) Same as above
3) Yes, these are called channels and trends.
can you check HINDPETRO and tell what it is forming clearly?
I tried analyzing myself; correct me if I am wrong
it previously(between march-June,2020) made two bottoms around 170 and two tops around 230
and recently (june-sep 2020) two bottom around 200 (possibly third bottom is under construction as well) and two tops around 240
thank you sir ji
you are the best teacher indeed
I see it as a possible breakdown from the double bottom 🙂
Ge Karthik, can we use the double top & double bottom for intraday?
Yes of course, you can. All TA patterns can be used for intraday as well.
Sir, kindly explain the thought process behind the double and triple top & bottom formation
Manoj, I\’ve tried doing the same in the chapter itself 🙂
sir how can we ensure, double-top won\’t form triple top
We cant, that\’s depended on the market, we can only be prepared for such situations with an appropriate trade.
Sir, how can we set the Stoploss for double-top, if I set the Stoploss as high value of red candle, then if triple-top formed, it would have triggers our Stoploss.
Is there is any way to find the formation of triple top, so that we can avoid the trade.
Depends on what position you are trading with the double top. For shorts, yes, you keep the high which also marks the resistance, else you opt for the bottom as the SL, which marks the support region. So it really depends on your trading position.
Hello Karthik,
Thanks for explaining TA in lucid manner.
I have one confusion on practicality of Primary trend and Secondary trend.
Take example of reliance from 2019 to last month.
So, according to my understanding 2019 to 2020 JAN Primary trend is bullish but from Feb to April Mid secondary trend is bearish.
Is this understanding right?
Maybe, I\’ve not looked at the chart. But in primary trend, you evaluate the trend across few years and in secondary trend for maybe 12-18 months.
can you please elaborate on time series data
Please check section 3.5 – https://zerodha.com/varsity/chapter/chart-types/
If there is indication of double top & bottom and i purchased shares after identifying this pattern , Sir what is the probability that it will create triple top &bottom ? and if i confirmed the stoploss (highest high b/w double top) and it get reverse but again it form triple high crossing my stop , then it will be stop hunting .
That will be very hard to say right? However, you can guesstimate here by looking at the amount of time the underlying has spent within a trading range. Higher the time, higher the possibility.
Sir , triple bottom is more bullish then double bottom and triple top more bearish than double top ?
I look at it that way because the same price point is tested more number of times.
Oh okay. I still haven\’t reached that module yet. No wonder why I was wondering if I missed anything from the previous modules, while I was so sure I didn\’t 🙂 Thanks again for this great stuff 🙂
Happy reading, Kiran 🙂
Hey Karthik,
*I had the similar question as one below for which you have answered as, you prefer to take an option position. Could you please explain what an option position is?*
Question:–
Hey karthik. What if i take a trade based on the double bottom pattern and buy the stock as soon as the double bottom pattern is formed. But it can also form a triple bottom pattern after my buy. So i this case i will lose my money if i buy after the double bottom pattern( in case it forms a triple bottom pattern). So whats the reliability of this pattern. On what basis should i take the trade???
Reply
Karthik Rangappa says:
February 6, 2019 at 11:36 am
Hence, I always prefer to take an option position when I spot such opportunities based on Dow Theory!
Kiran, by option position I mean a trading position in the Options market. Check this – https://zerodha.com/varsity/module/option-theory
Ok. Thank you very much for the reply sir.
Welcome!
Dear Karthik Sir,
Can you please tell me what kind of trading do you do? Intra-day or Long-term value investing? Also, with due respect, would it be possible for you to tell me how much on an average do you make per month through your trades. It would really put things in perspective for me. (I really hope this question doesn\’t come off as rude!) Also, could you suggest some extra readings.. books, articles, websites, etc.
Thank you.
Prabhajeet, I\’m not trading actively. I take up a trade only when things seem compelling, which is very rare. I invest in the market though, very actively. I invest via both mutual funds and direct stocks. Both the portfolios are doing ok.
Other sources of learning – unfortunately they are all too scattered and not well sequenced.
I guess RRR is mostly for sideways market because in a rally everyone\’s target is to go long, it is correct or not ? and one more thing how to decide target ?
Rajesh, it is important to have a perspective on risk and reward irrespective of the market condition.
How useful or effective Dow theory\’s for intarday trading as compare to the long term trading (1 to 3 months)
In my experience, Dow is good for swing positions, the positions which can be held for a few trading sessions.
can we take moving average exponential or crossover as a single source for
decision making, and share your thoughts about moving average ribbon
If I were to select only 1 system/indicator, then it would be the EMA crossover overlaid on candlesticks.
Thanks for replying.🙏
I shall remember this for my next trading sessions.
Hi Karthik,
It\’s always been good and very interesting to me to go through every chapter of varsity.
I have a question: Many times as I have observed, I have seen there was double top/down formation in candlestick chart and I guessed that the pattern formed is double top and it will come down but instead it went further up. Why that happened? (Please note that at that time candlestick patterns were showing price will go up which was confusing to me and I went with Dow theory and shorted stock and my stop loss got hit at that time)
Please answer it.
Vikrant, technial analysis is simply a means to help you understand the odds of a certain event occuring. There are no guarentees in the market 😉
Hi Karthik sir ….first of all thank u by heart for everything u r providing here……..,. I would like to know are Dow theory patterns and charts pattern the same things….like under continuing pattern- flag & pennent ,triangles,cup with handle. And under reversal pattern — double top & bottoms, head & shoulders, wedges, rounding bottom, triple tops and bottom …….are this all part of Dow theory pattern.?? Because when I search for Dow theory pattern on investopedia it does not show any thing but all are displayed in chart patterns…
Thanks, Himanshu. Yes, all of these are Dow patterns 🙂
sir plz tell about option chain analysis ????????????????????????? with the help of option chain how i find the trend of stock.
hi karthik
i just want to confirm , is it a triple top formation on daily charts of voltas?
is it a sell signal?
sorry ,unable to post the chart
Yes, it seems like it.
I must appreciate the Zerodha team and especially Karthik Rangappa for the effort to put together most of the educational information available, related to financial markets on this platform. 10 years back when I started my research work on financial markets, no such platform was available in India. But the availability of such platform now; can really fasten the learning process and help most people who look at financial markets as business and not gambling to make money consistently. Hats off to the team for the effort. Would look forward to meet the team in future.
Regards,
Dr. Anand Verma
Dr.Anand, thank you so much for the kind words and letting us know your thoughts. We will continue to work towards adding more content. Thanks.
Sir
First of all thanks a ton for making aware so many people of valuable techniques.
I have a doubt sir while dealing with volumes ( investing.com) it shows red and green bars how to interpret that volume is up or down
secondly how reliable candlestick pattern as sometime it strikes right and sometimes all reverse situation mostly when I take a position..plz help
I\’ve not checked investing.com, maybe you should check their support articles. CS patterns only increases the probabilities of a trade, but does not really guarantee the outcome. So you will have to use it accordingly.
Hey karthik. What if i take a trade based on the double bottom pattern and buy the stock as soon as the double bottom pattern is formed. But it can also form a triple bottom pattern after my buy. So i this case i will lose my money if i buy after the double bottom pattern( in case it forms a triple bottom pattern). So whats the reliability of this pattern. On what basis should i take the trade???
Hence, I always prefer to take an option position when I spot such opportunities based on Dow Theory!
Sir is v-shaped and double bottom are the same?
Nope, both are reversal patterns, but yet they are different. Its hard to predict and time the reversal in V shape, but in the double bottom, its possible.
Sir in double top double bottom formation on which day should we initiate a trade is it on p1 or p2.And if there is no recognizable pattern can we trade if the particular price point has tested and sustained.
That would be on P2. Yes, you can trade. Remember, double top/bottom etc are all Dow patterns and not really CS patterns.
I went through standard deviation it shows the range but ……How analyst suggest targets? Is there any statistical or technical analysis behind it?
Most of them look at technical analysis based targets, Satish.
Sir how to use market profile is there any tool for it?and how to get it if it\’s there in zerodha.
Unfortunately, this is not available on Kite.
Sir,
Can DCF be used for analysing NAV of Mutual funds?
Nope, that does not sound right 🙂
Is there any suggestion Sir to analyse Mutual Funds??
I guess its best to keep MF analysis simple. I\’d suggest you look for the fund house, fund manager\’s track record, assets under management, and how long they have been in the business.
Thanks Karthik for your help through varsity.
What would you do if there is a double top formation well spaced in time, but not coinciding with recognised candle stick pattern ?
Well, I\’d evaluate other parameters and take a call on a case by case basis. Remember, nothing is written in stone, end of the day it is about price action and your understanding of markets. CS pattern rule help in increasing the odds.
Hi Karthik,
How are the triple top and bottom formations any different from S&R. In the S&R chapter, you mentioned that we need to look for atleast 3 points, well-spaced in time, around the same price level. Isn\’t this the same?
Thank you for doing this btw. I have been going through the modules at record speed!
It is not different, Aviral. Both double and triple bottoms are manifestations of the support and resistance levels. They cannot be looked at isolation. Remember, end of it, it is all related to the price action.
1. I have another query about the timeframe of charts.
So if someone is looking to invest from a year to 2 year basis then the double top formation, separated by 8-9 months or a year should still work for them, right?
And if a trader wants to take a trade based on some days\’ timeframe then the double(or triple) top formation separated by more than 2 weeks should work.
Are these conclusions, correct?
2. I think, that a triple bottom is formed in IDEA, in the attached chart. Could you please take a look?
Link: https://drive.google.com/file/d/1PVq8MCc2nzzoYaX1qZk3OSqKt09M6Re_/view?usp=sharing
Thanks.
1) Yes, this should be good
2) Yup valid triple bottom this one.
Thank you Sir.
Hi Karthik Sir,
For the purpose of this query, let\’s take an example of the double top pattern.
Since the tops in this pattern would also form resistance levels, how to differentiate between an actual pattern and stock just testing a resistance level.
Meaning that, while forming double tops or testing resistance also the spacing should be 2 weeks. So if a particular price point(resistance) is tested twice, but the spacing is well more than 2 weeks, then is it a Dow Pattern, or just stock testing a resistance level.
Thanks.
In fact, the double/triple top is formed by testing the resistance. These two occurrences cannot be isolated. This would be a dow pattern.
Thanks. 🙂
By the way,
When the institutional investors (smart money) absorb all the available stocks why do the short term traders sense the occurrence of a support?
Think about it, when all the stocks are absorbed, it also implies that the stock does not make lows. So the support does occur.
Hi Karthik,
Can you please explain what are trends
Sorry i didnt read further and just asked the question.
No problem.
Trend is the general direction in which the stock or index is moving. If the stock makes higher high on a daily basis, then the trend is said to to up. Likewise if the stock is making lower lows, then the trend is said be down. The trend also has strength associated to it. A trend which is strong can last long. Not all trends can be strong.
Is smart money invested only in equity shares or they invest in Futures also ? and sir one more question.. When I buy a future lot of any stock, does the company blocks a number of shares for me ?
Both Eq & FO Priyesh. No they dont.
Hi Karthik,
How to find the S&R levels for a stock whose price is ever increasing(eg: Ashokley)?
That is not really possible as there are no previous reference points.
Hi, the mark-up, accumulation and distributions phases can be classified as primary trends or secondary trends??
These can be phases within a large primary trend.
Hi,
Do you think Moving Averages can be used to identify the primary and secondary trends. Like use a long period EMA for seeing the primary trend and use a short term EMA for secondary trend?
Thanks
Yup, as long as you use long-term moving averages, like 50, 100, or 200-day moving averages.
Sir, I have just witnessed and double top on NHPC charts on weekly as well daily time frame.. but it is a bit confusing and it seems to be double bottom as well.. Please clarify. Thank you
Its certainly not a double top, Rinkesh. At the most a double/triple bottom at around 27.
Sir, the look back period was 2 years and it appeared to be a double top. The question is that the duration of this pattern should be short?
Also, I read on various websites that the pattern like double bottom is completed when it passes the peak of trough with higher volumes. But it still appears a double top to me because the stock was in an uptrend till the peak around Rs 34.50 during June,2017 and the trough in between was Rs 26.25 during November, 2017. Again, the stock recovered to hit the peak of exactly Rs 34.50 during the start of 2018 and then it has started slipping downwards. It also appears a head & shoulder pattern to me.
I am waiting eagerly on this.
The thumb rule is that the volumes should be higher when the breakthrough move happens. So if you are looking at a double bottom, then the price when it moves through the trough to peak (especially at the time of crossing the peak), should be on higher volumes.
Btw, I\’m not a big fan of H&S pattern, it has never worked for me 😉
Dear Karthikh sir…I\’m very inspired with this all knowledge through varsity. It\’s very useful for traders and investers. I think you should explain some more straitagies specially for intraday trading. It will be useful for retail intraday traders latestly joining Zerodha.
Small correction in my name…Solaskar.
Noted 🙂
Happy to note that, Rajesh. In fact, the current ongoing module is dedicated to Trading Systems – https://zerodha.com/varsity/module/trading-systems/ . Request you to keep track of this module.
Did companies know who are big players(smart money) buying/selling their stocks?
Not really.
Why can\’t we consider Double top and Double bottom as resistance and support, as it testing.ly
what is the difference between?
kindly reply
thank you
In fact, double top/bottom formations happen because of the support and resistance points. So they are interrelated.
sir please tell me how to use market profile/volume profile chart & how to get it
Are you familiar with volume study? Take a look at this – https://zerodha.com/varsity/chapter/volumes/. I plan to cover market profile sometime soon. Thanks.
please add market profile soon
Yes, will put up notes on this sometime soon.
HI Sir,
1) If in a double/triple top/bottom patterns are reversal patterns,then does it mean that there must be a prior trend to reverse.I read so in stockcharts,is that true?
2)If the peak in between double top/bottom is around 30% is that considered a double top/bottom patter?or in what percentage the peak in between can be formed?
3) if the double top/bottom is formed and if we enter the trade, what should be the target?if there is any other resistance in between the middle peak and the pattern top/bottom, that should be considered? or should we consider the in between peak as the target or can we hope or the breakout to happen and wait for that too?
1) Not really, these tops and bottoms form in a sideways market, which obviously has no prior trend
2) Not sure what you mean by this
3) The tops and bottoms form a range. If you enter at the double bottom, then the target could be the high of the range, likewise for shorts. If you think the range will break, then you can trail it as well.
Hi Sir,
1) In which phase of the market(accumulation,mark up,distribution,mark down) does the primary,secondary and minor trend occur?Do the primary,secondary and minor trends occur during the markup and markdown phase alone or even in accumulation and distribution phase also they occur?To my understanding on reading this chapter accumulation and distribution are sideways market and in mark up and mark down phase alone the three trend would occur,am i right?
2) Sir suppose if we are a risk averse trader and we are planning to enter a trade on P2 day, but suppose if the target what we have planned is reached before 3.20 PM of P2 day and the candle start to retrace and from a very small wick around 3.20 pm and is trading slightly below (less than 1%) our target and close the day, then still can we enter that trade for the same target (T1) or can we hope that it will reach the new target(T2)?or should we avoid the trade?
1) Primary includes everything, however, the secondary trend is quite common in accumulation and markdowns. Yes, both markdown and accumulation are rangebound markets
2) This can be a little tricky, but you can setup a trade with a very strict stoploss.
Thanks for all the knowledge you share with us from zeroda platform. Sir I want to know how to calculate that stock is undervalued or overvalued ??
The easiest way to do this is by building a simple DCF model. Check this https://zerodha.com/varsity/chapter/dcf-primer/
1. In the DLF Chart that you show, after the 3 top formation, there are 4th and 5th higher tops, so in this case, what should make the trader be sure about his prediction, shouldn\’t the trader be worried and exit the trade?
2. Also are there stop losses employed for these theory? If yes, the stop loss would have triggered in DLF case isn\’t it?
1) No, triple (or more) top formation indicates a strong price action zone, which can be either a support or resistance (based on the CMP)
2) No SL as such, multiple tops/bottoms add as a supplement to candlesticks
sir, if these double/tripe top/bottom formations occur in intraday then will they hold the same significance?
Yes, TA is applicable across any timeframe.
Please include some lessons on Trading Psychology
Keep a track on this module – https://zerodha.com/varsity/module/trading-psychology-and-risk-management/ will be updating a very important chapter today.
Is there any prior trend condition for double bottom and top formation ?
No, not really. The condition is applicable for all candlestick patterns though.
Please correct me if i am wrong
primary trend is long uptrend or long downtrend which exist for around a year.
secondary trend is small correction to the primary trend whenever we find sudden upmove/downmove in primary trend.
if I consider different phases of the market
primary trend is nothing but mark up phase
secondary trend finding in between mark up phase and distribution phase
but I confused what is minor trend ? are we finding in accumulation phase.?
Yes, your understanding is correct. People consider the minor trend as the day to day fluctuation in prices, usually keeping not more than a week in perspective.
How can I ensure that I am not placing my order near the end of an ongoing trend (short term, intermediate or primary trend)? Because momentum indicators tend to remain overbought/oversold for quite long in some cases?
This will only come to you by experience 🙂
Could you plot the Primary and secondary market trend for any stock taking as example ?
Will try and put up the graph sometime soon. But this one is fairly simple, the long term trend is primary and the shorter term trend (over the last few months) is secondary.
how do I identify stocks that are likely to have a greater volatility and continued price growth or decline (around 15% to 20%) over a 10-20 day time period? Usually the problem that I face is as soon as I zero in on a stock and enter into a trade, the price moves very slowly and sometimes remains in a sideways trend. This happens in case of good liquid stocks also. Hence is there any way through which I can be a little more confident that upon entering into the trade the stock price will move decently (up or down)?
No, its really hard to predict the future volatility, unless there is an event around the corner, in which case the volatility invariable shoots up.
How to scan stocks out of a large list (400 stocks) daily that are breaking out from a previous support or resistance level? how can i perform such a screening on a daily basis?
You can use a simple screener and look for price volume breakout. Check this – https://zerodha.com/expert-advisors/
I am confused between primary and secondary trend, can you explain little more what does it actually mean?
Primary trend is the longer term trend which can occur over many months of even few years. Secondary trend is a short term trend, which is counter to the primary trend.
Finally when the institutional investors (smart money) completely sell off their holdings, there would no further support for prices, and hence what follows after the distribution phase is a complete sell off in the markets
Sir can you please explain this statement
It means there is no smart capital investing in the stock, a good case for a sell off.
sir for intraday trading which trend we should follow primary,secondary OR minor?
Secondary trend. But do keep an eye out for reversals.
thanks sir
Welcome!
If there is bearish candle with huge volume, obviously the volume candle is also red.can we consider the high volume bearish candle for the trading plan?
Yes, you can.
Hi Sir, Thanks for a great article. My query is: Can we say Head and shoulder pattern also as a DOW pattern? also request you to please clarify if Pidilite Industries has formed a bullish head and shoulder pattern on daily charts and has given a break out on 25th Jan 2017. Thank you.
Yes, in fact H&S is considered as a Dow patter. Pidilite seems bullish, but I\’m not sure of its a H&S pattern.
You have mentioned that before double bottom/top formation the stock should trade at higher/lower levels for at least two weeks. Are you advising this for swing trading?
If iam considering the pattern for intra-day what is the time frame for better result?
Playing the double top/bottom is a bit tricky, you would need to look at points where the price coincides with the band\’s top or bottom. For example if the price is at the bottom level, you need to look at buying the stock/index with an expectation that the stock will bounce back into the range. Likewise if the stock is at the top of the bank you could look at shoring opportunities within the day with an expectation that the stock will fall back to the range.
hello, karthik you are doing wonderfull job i wanted to know if we a price action trader do we need to follow other technical indicator or price action is enough, also help me to scan stocks as per price pattern in zerodha pi
A combination of price action + basic indicators will help you get started and achieve results.
For scanning on Pi, check this – https://zerodha.com/expert-advisors/
WHILE DISCUSSING MACD CROSS OVER, IT HAS BEEN INDICATED THAT BUY SIGNAL IS GENERATED WHEN WHEN SIGNAL LINE CROSSES MACD LINE& SELL SIGNAL IS GENERATED WHEN MACD LINE CROSSES SIGNAL LINE. I FEEL IT IS NOT CORRECT. I FEEL BUY SIGNAL IS GENERATED WHEN WHEN MACD CROSSES SIGNAL LINE. PL CLARIFY
I know there is some confusion wrt to MACD, I do plan to re write this as soon as possible.
Hi,
I have one doubt if the INDIA VIX is below 18 the movement in Nifty option is low and above 20 the movement is high, Is it right or wrong?
Yes, I\’d suggest you go through Option Greeks module for a better understanding of this!
Hi,
For plotting Fibonacci Retracement in chart first we should find trough and peak, there are many small peaks, is it any minimum number of days or % of price moved from trough to peak to identify ?
I usually look for 10% or more.
Hi,
If the stock formed any recognized pattern from bad news or good news and the volume also increased above 10 days\’ average line,
how can we find these are institutional or retailer traders?
There is no way you can determine this. General assumption is that if volumes are good, then its the smart money trading.
Hi,
While initiating trade for long or short after recognizable candlestick pattern formed prior trend should be down and up respectively, but how many trading session prior trend should be for strong trend? 1 week, 2 week or more?
At least last 5-6 trading sessions or price change of at least 5%.
Hi,
Sir I want to know about your trading experience, actually most of the people will exit soon by making huge loss
the people who stay even they make loss will get success.
I have been trading for 2 years initially I got loss after some days I was getting profit but by end of the month I was losing all the profit, because I had not any proper guidance . I have attended so many seminars and classes they taught only some key points and indicator based trading, some times they work and sometimes not, but I didn\’t loose confident after reading this module confident is increasing
now I am correcting my mistakes. it is really difficult to stay long in Trading for newbie .
Really hats off you sir, you have very good knowledge I have seen many traders but no one taught us like you.
so please share how was your first trading experience and how you got such valued precious information, after how many days you got success and efforts everything? if you share really everyone will inspire and they won\’t stop trading until they get success
Suresh, I\’ve been trading for over 14 years now. My initial days were just like many newbie traders (losing money, getting demotivated). I\’ve made several mistakes while trading, because of which I learnt. ..but later on things improved. All I can say is stay put, stay focused, keep learning, and I\’m sure you would be a much better trader going forward.
Good luck, stay profitable.
Hi,
How can we find whether it is The primary and the secondary trend.?
Casual look at the charts will reveal this.
Hi,
when we are going to long or short how to find well defined prior trend? any minimum days?
No prefixed rules here, depends purely on the strategy.
Thanks for you way of teaching, Excellent Sir…
Can i use double/triple bottom/top system on intraday trading ?
Yes, you can.
how we know foreign investors are in and out of our market?
You can track the daily data put out by NSE/SEBI. Suggest you check their website.
Hello sir,
First of all thank you for these awsome tuts…
I have a doubt in the tenet 7. Even if the prices falls the volume is going to increase. How will it decrease tha volume if prices falls?
Welcome.
Well, the fall in prices can be backed by low volumes, no harm in that. It just indicates lack in participation, and maybe some weak hands placing trade.
So this indicates a decrease in volume from previous day!! on the same day the volumes can\’t fall
In fact its best if you compare toay\’s volumes on a end of day basis by looking at last 10 day simple average.
Dear Karthik,
This is a Triple Bottom, so we can be bullish. But this is also a Descending Triangle which means a potentially bearish signal. So how should we Read This ?
Thank You.
Guess you can initiate for quick long trade…but looks like the stock may correct a bit.
Karthik, If i say at this date the primary trend in nifty is UP,
the secondary trend is SIDEways and
the near term/short term trend is DOWN.
Will that be a correct statement?
Yup – Primary trend is the generic multi month trend, secondary is the multi weak trend, and short term would be over the last 1 week or so.
Dear sir
If a nice looking Double Top formed in the weekly chart , may I take that as a long term down trend?
Double Top is conducive for a short trade and not really a long trade, unless you are expecting a breakout.
hi Karthik sir,
. repated double/triple bottom/top can indicate \’sideways\’ direction of market too.. right? can we use B-Bands to confirm this?
. in light of A-D phases , please help about \”AD\” and \”ADX\” indicator . i read about it but i m still feeling clueless.
thnx,
Rajesh
A-D is for accumulation and distribution phase ..usually this is when the markets are in a range. Will probably include a write-up on ADX soon. Also as you said repeated movement between two bands can indicated sideways movement. In fact BB is a great indicator to trade the sideways market.
dear karthik sir..
here i\’m sending you very interesting triple bottom of my workshop…
thank you karthik sir.
Interesting indeed…Hope you are riding the wave 🙂
hmm…..i\’m enjoying sir….thank you sir….
dear karthik sir…
double bottom bulish & double bottom top indicators.
thank you sir.
Perfect 🙂
Essential condition for Double Bottom Reversal Chart Pattern is that the stock must be in continuous down trend before forming the pattern. Moreover Volumes play a very important role in the success of the pattern. If the stock breaches the bottoms formed it will sureshot head lower and lower forming lower highs and lower lows and thus continuing the downtrend.
Thanks for pitching in 🙂
SIR ,CAN WE USE FOR INTRADAY SWING.IF SO WHAT WILLL BE % BETWEEN TOP TO TOP, BOTTOM TO BOTTOM
Sorry, need a bit more clarity on your question Narsimha.
Hello sir, this is graph of JP Power.. Can it be said that JP power is in accumulation phase? Volume was relatively less when the stock was falling.. Volumes are remarkably higher since last few months.. Also, there are lower points which the share has not breached.. It does seem to have reversed its downtrend and heading towards accumulation and then uptrend..
Not really Ganesh. In a typical accumulation phase the stock gyrates in withing a 20 – 30 % range, but I can see JP Associates moving from Rs.20 (or sometime near Rs.30) all the way down to Rs.10..which is more than 100%. For this reason I would not really call it an accumulation phase.
oh ya.. That sounds more plausible.. Thank you sir 🙂
Except in rare cases, prices never go up with the increase in volumes, but are off=loaded. Why? Secondly markets are very volatile in India due to algo trading and also due to very high cost of transaction. What steps traders and regulators should take
how can we apply dow theory to commodity market in silver to predict the future which is constantly moving down for 4 months?how future market of commodity also affect such situation?
TA can be applied on any asset class..as long as it has a time series data. Try and look for retracement on low volumes, double tops, double bottoms etc.
Please correct typo @17.1
Thanks for pointing this out, made the correction 🙂