3.1– Overview
Having recognized that the Open (O), high (H), low (L), and close (C) serves as the best way to summarize the trading action for the given period, we need a charting technique that displays this information in the most comprehensible way. If not for a good charting technique, charts can get quite complex. Each trading day has four data points, ’ i.e. the OHLC. If we are looking at a 10-day chart, we need to visualize 40 data points (1-day x 4 data points per day). So you can imagine how complex it would be to visualize 6 months or a year’s data.
As you may have guessed, the regular charts that we are generally used to – like the column chart, pie chart, area chart etc. do not work for technical analysis. The only exception to this is the line chart.
The regular charts don’t work mainly because they display one data point at a given point in time. However, Technical Analysis requires four data points to be displayed at the same time.
Below are some of the chart types:
- Line chart
- Bar Chart
- Japanese Candlestick
This module’s focus will be on the Japanese Candlesticks; however, before we get to candlesticks, we will understand why we don’t use the line and bar chart.
3.2 – The Line and Bar chart
The line chart is the most basic chart type, and it uses only one data point to form the chart. When it comes to technical analysis, a line chart is formed by plotting a stock’s closing prices or an index. A dot is placed for each closing price, and a line then connects the various dots.
If we are looking at 60-day data, then the line chart is formed by connecting the closing prices’ dots for 60 days.
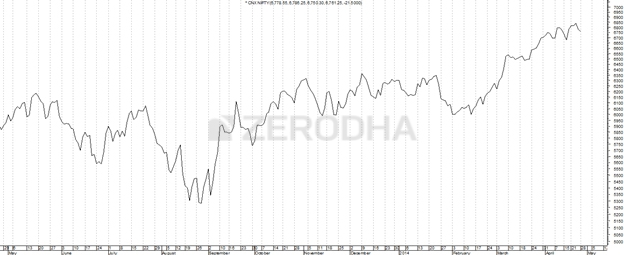
The line charts can be plotted for various time frames, namely monthly, weekly, hourly etc. So, if you wish to draw a weekly line chart, you can use weekly closing prices of securities and other time frames.
The advantage of the line chart is its simplicity. With one glance, the trader can identify the general trend of security. However, the disadvantage of the line chart is also its simplicity. Besides giving the analysts a view on the trend, the line chart does not provide any additional detail. Plus the line chart takes into consideration only the closing prices ignoring the open, high and low. For this reason, traders prefer not to use the line charts.
The bar chart, on the other hand, is a bit more versatile. A bar chart displays all four price variables: open, high, low, and close. A bar has three components.
- The central line – The top of the bar indicates the highest price the security has reached. The bottom end of the bar indicates the lowest price for the same period.
- The left mark/tick – indicates the open.
- The right mark/tick – indicates the close.
For example, assume the OHLC data for a stock as follows:
Open – 65
High – 70
Low – 60
Close – 68
For the above data, the bar chart would look like this:
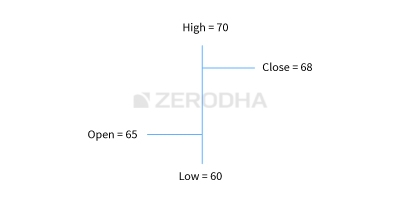
As you can see, in a single bar, we can plot four different price points. If you wish to view 5 days chart, we will have 5 vertical bars as you would imagine. So on and so forth.
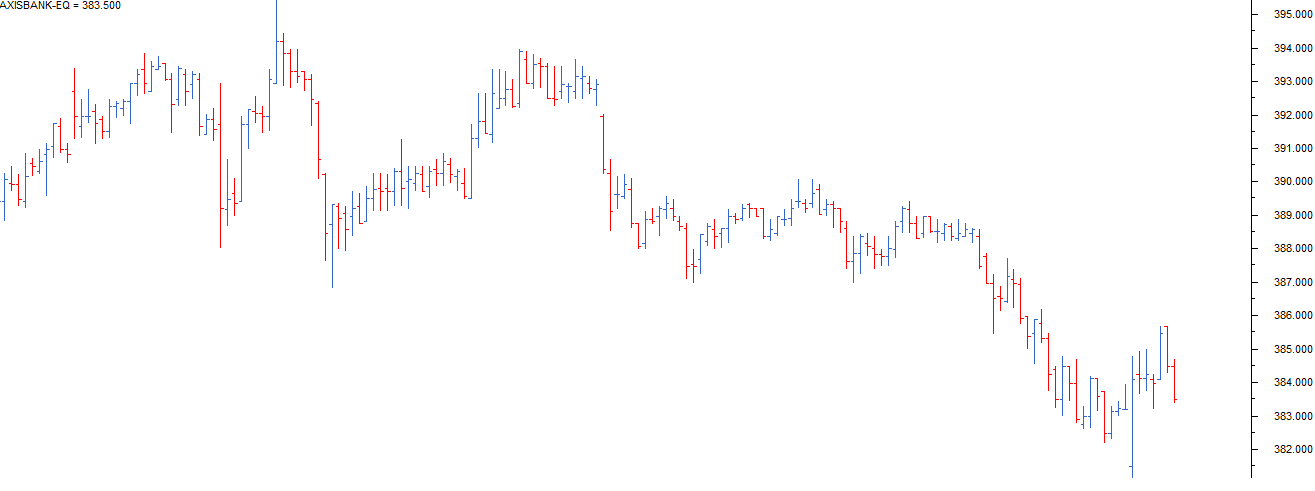
Note that the left and right mark on the bar chart varies based on how the market has moved for the given day.
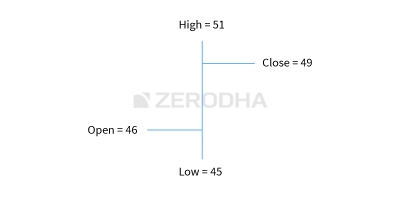
If the left mark, which represents the opening price, is lower than the right mark, it indicates that the close is higher than the open (close > open), hence a positive day for the markets. For example consider this: O = 46, H = 51, L = 45, C = 49. To indicate it is a bullish day, the bar is represented in blue colour.
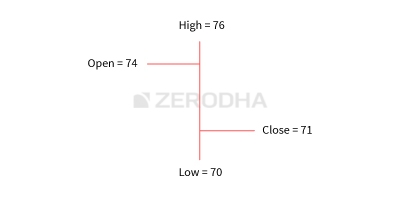
Likewise, if the left mark is higher than the right mark, it indicates that the close is lower than the open (close <open), hence a negative day for markets. For example consider this: O = 74, H=76, L=70, C=71. To indicate it is a bearish day, the bar is represented in red colour.
The length of the central line indicates the range for the day. A range can be defined as the difference between the high and low. Longer the line, bigger the range, shorter the line, smaller is the range.
While the bar chart displays all the four data points, it still lacks a visual appeal. This is probably the biggest disadvantage of a bar chart. It becomes tough to spot potential patterns brewing when one is looking at a bar chart. The complexity increases when a trader has to analyze multiple charts during the day.
Hence, for this reason, the traders do not use bar charts. However, it is worth mentioning that there are traders who prefer to use bar charts. But if you are starting fresh, I would strongly recommend the use of Japanese Candlesticks. Candlesticks are the default option for the majority in the trading community.
3.3 – History of the Japanese Candlestick
Before we jump in, it is worth spending time to understand in brief the history of the Japanese Candlesticks. As the name suggests, the candlesticks originated from Japan. The earliest use of candlesticks dates back to the 18th century by a Japanese rice merchant named Homma Munehisa.
Though the candlesticks have been in existence for a long time in Japan, and are probably the oldest form of price analysis, the western world traders were clueless about it. It is believed that sometime around 1980’s a trader named Steve Nison accidentally discovered candlesticks, and he introduced the methodology to the rest of the world. He authored the first-ever book on candlesticks titled “Japanese Candlestick Charting Techniques” which is still a favourite amongst many traders.
Most of the candlesticks pattern still retains the Japanese names; thus giving an oriental feel to technical analysis.
3.4 – Candlestick Anatomy
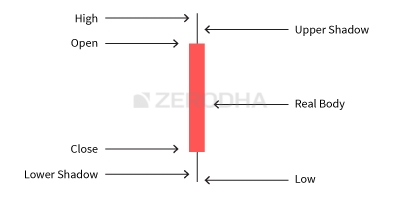
While in a bar chart the open and the close prices are shown by a tick on the left and the right sides of the bar respectively, however in a candlestick the open and close prices are displayed by a rectangular body.
In a candlestick chart, candles can be classified as a bullish or bearish candle usually represented by blue/green/white and red/black candles. Needless to say, the colours can be customized to any colour of your choice; the technical analysis software allows you to do this. This module has opted for the blue and red combination to represent bullish and bearish candles, respectively.
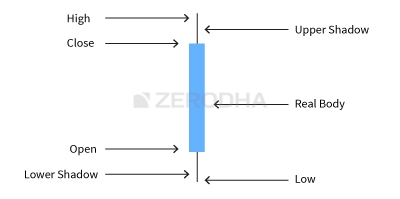
Let us look at the bullish candle. The candlestick, like a bar chart, is made of 3 components.
- The Central real body – The real body, rectangular connects the opening and closing price.
- Upper shadow – Connects the high point to the close.
- Lower Shadow – Connects the low point to the open.
Have a look at the image below to understand how a bullish candlestick is formed:
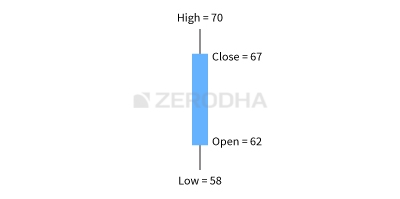
This is best understood with an example. Let us assume the prices as follows.
Open = 62
High = 70
Low = 58
Close = 67
Likewise, the bearish candle also has 3 components:
- The Central real body – The real body, rectangular which connects the opening and closing price. However, the opening is at the top end, and the closing is at the rectangle’s bottom end.
- Upper shadow – Connects the high point to the open.
- Lower Shadow – Connects the Low point to the close.
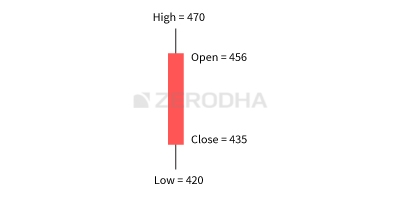
This is how a bearish candle would look like:
This is best understood with an example. Let us assume the prices as follows.
Open = 456
High = 470
Low = 420
Close = 435
Here is a little exercise to help you understand the candlestick pattern better. Try and plot the candlesticks for the given data.
| Day | Open | High | Low | Close |
|---|---|---|---|---|
| Day 1 | 430 | 444 | 425 | 438 |
| Day 2 | 445 | 455 | 438 | 450 |
| Day 3 | 445 | 455 | 430 | 437 |
If you find any difficulty in doing this exercise, please ask your query in the comments at the end of this chapter.
Once you internalize the way candlesticks are plotted, reading the candlesticks to identify patterns becomes a lot easier.
This is how the candlestick chart looks like if you were to plot them on a time series. The blue candle indicates bullishness and red indicates bearishness.
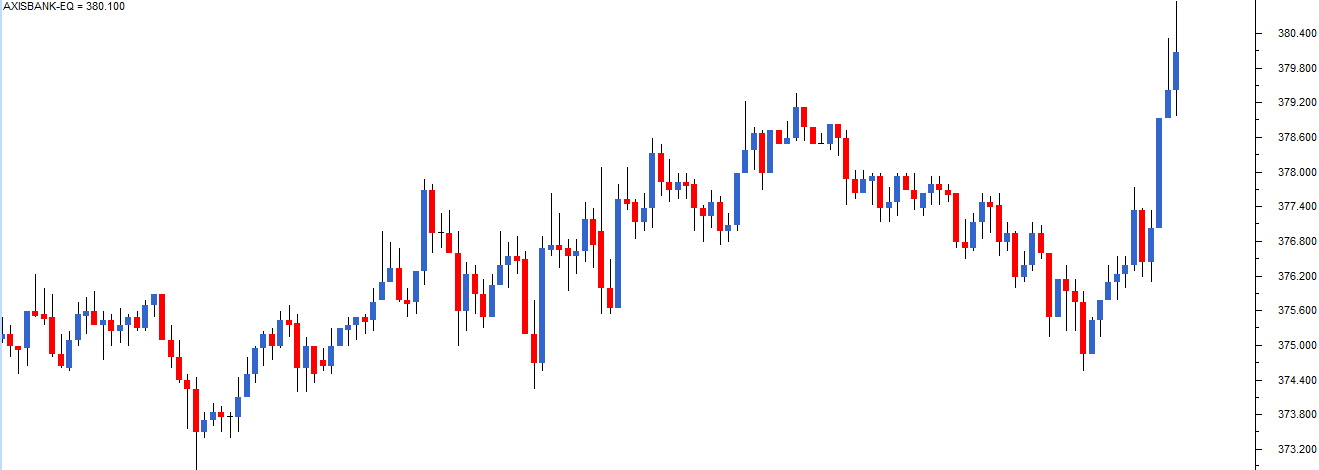
Also note, a long-bodied candle depicts strong buying or selling activity. A short-bodied candle depicts less trading activity and hence less price movement.
To sum up, candlesticks are easier to interpret in comparison to the bar chart. Candlesticks help you quickly visualize the relationship between the open and close and the high and low price points.
3.5 – A note on time frames
A time frame is defined as the time duration during which one chooses to study a particular chart. Some of the popular time frames that technical analysts use are:
- Monthly Charts
- Weekly charts
- Daily or End of day charts
- Intraday charts – 30 Mins, 15 mins and 5 minutes
One can customize the time frame as per their requirement. For example, a high-frequency trader may want to use a 1-minute chart instead of any other time frame.
Here is a quick note on different types of time frames.
| Time Frame | Open | High | Low | Close | No of Candles |
|---|---|---|---|---|---|
| Monthly | The opening price on the first day of the month | The highest price at which the stock traded during the entire month | The lowest price at which the stock traded during the entire month | The closing price on the last day of the month | 12 candles for the entire year |
| Weekly | Monday’s Opening Price | The highest price at which the stock traded during the entire week | The lowest price at which the stock traded during the entire week | The closing price on Friday | 52 candles for the entire year |
| Daily or EOD | The opening price of the day | The highest price at which the stock traded during the day | The lowest price at which the stock traded during the entire day | The closing price of the day | One candle per day, 252 candles for the entire year |
| Intraday 30 minutes | The opening price at the beginning of the 1st minute | The highest price at which the stock traded during the 30-minute duration | The lowest price at which the stock traded during the 30-minute duration | The closing price as on the 30th minute | Approximately 12 candles per day |
| Intraday 15 minutes | The opening price at the beginning of the 1st minute | The highest price at which the stock traded during the 15-minute duration | The lowest price at which the stock traded during the 15-minute duration | The closing price as on the 15th minute | 25 candles per day |
| Intraday 5 minutes | The opening price at the beginning of the 1st minute | The highest price at which the stock traded during the 5-minute duration | The lowest price at which the stock traded during the 5-minute duration | The closing price as on the 5th minute | 75 candles per day |
As you can see from the table above, the number of candles (data points) increases when the time frame reduces. Based on the type of trader you are, you need to take a stand on the time frame you need.
The data can either be information or noise. As a trader, you need to filter information from noise. For instance, a long term investor is better off looking at weekly or monthly charts as this would provide information. While on the other hand an intraday trader executing 1 or 2 trades per day is better off looking at the end of the day (EOD) or at best 15 mins charts. Likewise, for a high-frequency trader, 1-minute charts can convey a lot of information.
So based on your stance as a trader, you need to choose a time frame. This is extremely crucial for your trading success because a successful trader looks for information and discards the noise.
Key takeaways from this chapter
- Conventional chart type cannot be used for technical analysis as we need to plot 4 data points simultaneously.
- A line chart can be used to interpret trends, but no other information can be derived.
- Bar charts lack visual appeal, and one cannot identify patterns easily. For this reason, bar charts are not very popular.
- There are two types of candlesticks – Bullish candle and Bearish candle. The structure of the candlestick, however, remains the same.
- When close > open = It is a Bullish candle. When close < open = It is a Bearish candle.
- Time frames play a very crucial role in defining trading success. One has to choose this carefully.
- The number of candle increases as and when the frequency increases
- Traders should be in a position to discard noise from relevant information
Under \”Key takeaways from this chapter\”, for number 7: \”The number of candle increases as and when the frequency increases\”, will it not be \”The number of candle increases as and when the frequency decreases\”? From what I have understood, I guess the increases should change to decreases.
Please correct me if I am wrong.
My bad, yes, as the time period increases, the number of candles decreases – 10 mins frequency will have 6 candles in 1 hour, but hourly candle is just 1 candle per hour.
Dear Karthik sir,
I hope you’re doing well.
My name is Siddhaarth Dhawan, and I’m currently pursuing a B.Sc. in Economics and Data Science at the Gokhale Institute of Politics and Economics. During my summer break, I’ve been interning at a mutual fund distribution firm – Decoding Markets Enterprises, Pune, and as part of my learning process, I’ve simultaneously been studying Zerodha Varsity to strengthen my understanding of the markets, especially from the technical and fundamental analysis side of things.
Firstly, I genuinely wanted to thank all of you for building Varsity the way it is. As someone entering the practical side of markets, I’ve found the modules incredibly intuitive, application-oriented, and far more structured than most beginner resources I could find online.
Recently, while going through the Technical Analysis module and simultaneously applying concepts on TradingView during my internship, I came across something interesting that I thought was worth sharing as feedback for future learners.
While learning more about volatility and chart interpretation, I had a discussion with the founder of the firm that genuinely changed the way I started looking at long-term charts.
I was analysing Black Box Ltd. on TradingView using a normal arithmetic chart when the founder asked me why I wasn’t using a logarithmic chart instead. Honestly, until that moment, I had never deeply thought about the difference between the two because I do not remember logarithmic scaling being discussed meaningfully in the Technical Analysis module.
Out of curiosity, we compared both charts side by side.
What I observed was genuinely eye-opening.
From around ₹30 levels during 2020, Black Box rallied to approximately ₹312.25, which was nearly a 911.28% increase.
Then, from around ₹320–330 levels in 2021–22, the stock further rallied to around ₹942–943, which was approximately a 193.88% increase.
However, on the arithmetic chart, the second move visually looked much larger than the first move despite the first move actually being far more significant in percentage terms.
The moment we shifted to the logarithmic chart, the price action suddenly started looking much more proportionate and realistic because the chart began representing percentage growth instead of absolute price movement.
That was the point where I truly understood why long-term market charts are often analysed logarithmically.
I then explored this further using the Dow Jones Industrial Average.
On the arithmetic chart, the Great Depression crash of 1929, where the Dow Jones fell from roughly 381 levels to nearly 41 levels, a decline of about 89.24%, appeared visually compressed and almost insignificant because modern index levels near 50,000 dominate the chart scale.
However, on the logarithmic chart, the crash immediately became much more visible and historically meaningful because the chart preserved proportional movement instead of absolute point movement.
That single comparison, along with further reading on logarithmic scaling, made me realize that financial markets are fundamentally compounding and multiplicative in nature, whereas arithmetic charts are additive.
Because of this, long-term:
– trend interpretation
– trendline structure
– breakout analysis
– historical comparison
– and even perceived momentum
can look very different depending on the chart scaling being used.
I went back through the Technical Analysis module, the YouTube video series, and even the discussion sections afterward to see whether logarithmic scaling had been covered somewhere, and unless I may have missed it, I could not find a dedicated explanation around:
– arithmetic vs logarithmic charts
– percentage-based chart interpretation
– or when one should ideally be preferred over the other.
I completely understand that Varsity is intentionally designed to simplify concepts for beginners, but I genuinely feel this particular topic deserves at least a short subsection in the chart types or trend analysis chapters because it can fundamentally change how a learner interprets long-term price action, exactly as it did for me.
I’ve attached the screenshots of both the Black Box and Dow Jones comparisons that led me to this observation.
Thank you once again for building Varsity. Hoping to hear from you soon!
Warm regards,
Siddhaarth Dhawan
https://kommodo.ai/i/fUUYKYf8PU2abXeAXxip [BBOX (Arithmetic)]
https://kommodo.ai/i/QOTK8zafyiypt49PDU82 [BBOX (Logarithmic)]
https://kommodo.ai/i/hloSv86ZCqj1LVQnCJKJ [DOW JONES (Arithmetic)]
https://kommodo.ai/i/4xkxwUT5XNUzlvYnyc2M [DOW JONES (Logarithmic)]
Thanks Siddhaarth, I\’m fully aware of this, but like you mentioned, the idea with the TA module is to introduce TA to people in a meningful way. I can perhapse take this up and do a video on log scale charts. That said, most of the times, we look at TA charts for short term trade, and for that purpose simple arithmetic charts does the job. For longer term, you may want to go beyond charts and look at FA as well.
Glad you liked Varsity by the way, happy learning 🙂
Thank you so much for such a prompt reply sir!
What you\’re saying makes complete sense. I think the discussion itself helped me realize how differently markets can look depending on the time horizon and scaling used.
One of the best parts about Varsity for me has been exactly – learning a concept, applying it practically, and then slowly discovering the deeper layers behind it.
Would definitely love to watch a video on log scale charts if you ever decide to make one 🙂
Happy learning to you too!
Thanks Siddhaarth and happy learning 🙂
how will i know when to buy or sell
Thats the point of the chart, it kind of helps you set up the trade.
I have unable to draw candlestick and understand. Can you helpt me out
No need to draw candlestick, its automatically there on the charting platform.
For Nifty 50 options day trading.. which time frame candle would be more reliable .? is it only one time frame or multiple timeframes. please comment.thanks
It can be multiple. If you are doing intrady, then maybe 10 or 15 mins chart of the underlying. Else if its positional, you can stick to EOD charts.
Does the WIDTH of the candle mean anything?
Not really, you can ignore it.
Sir, I\’ve been following this course and had a couple of questions regarding this-:
1) What are After Market Order and how does it effects opening and closing price?
2) How can I develop the skill to analyze what is noise and what is information more thoroughly and also analyze that information to make informed decision? I have started reading financial newspaper but it seems to be too cluttered with noise.
1) Do check this – https://support.zerodha.com/category/trading-and-markets/charts-and-orders/order/articles/auto-amo
2) I think the best way is to take up small trades and track your thesis as to why you took that trade and how it turned out. No best teacher than market itself.
1) after market order (AMO) is when u place an order after market time. market time is 9.15am–3.30pm. if u place order after 3.30pm then it becomes AMO and goes to next working day. it will be executed at opening price (depends on liquidity, if no liquidity then no execution).
for eg. stock closed at 200, u placed buy order at 4pm, next day stock opens at 250, then ur order will be executed at 250, not 200.
(if u place order around 3.40pm and sellers r available then it can be executed same day, then its not AMO)
AMO doesn’t affect closing price. closing price is already done. AMO doesn’t care about previous price, it cares about pre open demand and supply and executes next day at whatever price stock opens.
2) first thing is incentive. what do u want? intraday, short term, swing, long term? market depends a lot on this.
news on tv, twitter, newspaper all feels important but most of it is noise if u dont know ur timeframe. so focus on one sector first or few stocks. start small.
for eg IT sector. just track IT related stuff. for global context u can see NASDAQ composite, if its strong then IT / growth stocks can also be strong, gives direction only. strong local news can ignore NASDAQ completely so dont depend on it for intraday.
timeframe is very important. i personally lost money bcz i was seeing long term chart patterns for swing trades. so incentive and timeframe alignment matters a lot.
ALL THE BEST
(im a finance student, based on my understanding and experience, info can vary)
So, it is safe to say that when a candle opens high and closes low then its bearish.And when it opens low and closes high then its bullish righr.
just like the exercise the day 1 and 2 are bullish and day 3rd is bearish
You need to compare it with previous day. If it opens high and closes low, but wrt previous day it closes positive, then its bullish overnight, but intrday bearish 🙂
can you guys make module which explain the follwing
1) how to use NSE data
2) use of \’screener\’
3) explaining \’trading view\’ for beginers and some useful features of it
Hmm, will think through this. Meanwhile, please do keep a track on all the courses here – https://varsitylive.zerodha.com/home
daily time frame me koi aur pattern ban rha ho aur 15 min me koi aur…to kis pr trust kre
Broader the time frame better the picture. Shorter time frame is for short term or daily profit means. Needs attention all the while. Daily or weekly gives better trend for longer time frame invest clarity.
I agree, larger the timeframe, the better it is. Less noise 🙂
higher time frame is give more importance.
Hello Karthik,
It would be helpful if you could create few more topics related to
1) Breakout analysis
2) Types of chart patterns(Ascending triangles, descending triangles etc)
3) FII, DII data analysis
Noted, Arun.
What is difference between intraday time frame and daily time frame?
Intraday helps you visualize the price movement on shorter timeframes like 5 minutes, 10 minutes, 15 minutes, etc….whereas daily time frame lets you look at the charts from 1 day perspective.
how to learn to trade by using zerodha kite app? zerodha kite app has many features and keys and we dont know the use of many keys..how to learn this?
Savita, please do enrol for this session – https://varsitylive.zerodha.com/programmes/3f2973a2-b6f2-4c18-ba1d-4c48346937b6
Will not the closing of previous day be the same as opening of next day?
No, check this – https://www.youtube.com/shorts/oCj3LzeVTj8
The correct link should be https://www.youtube.com/shorts/5uhDBpH3Og4
In the previous module we learnt that stock price is a function of the actions that traders make on the market. In this case, when stock prices change overnight, who is making these actions? Is it the exchanges?
No, it is still the traders. Exchanges wont interfere in price discovery.
Hello Karthik,
Is it because of after hour or pre opening activities? Also, traders like us generally don\’t buy and sell stocks outside the regular stock market hours? So, any overnight news that causes a stock’s opening price to differ from its previous closing price, who are those participants and how this happen?
Sir existing modules ke videos available hai kya? agar hai to kaha milega
My question is that I think opening price of a share in new trading session should be equal to the closing price of previous trading session, but I have observed that this is not the case why is it so and how pre opening session works.
Ah, we are putting up a short video explaning this, Shakeel. Please look for that on our Youtube or Insta.
Hi Sir, My doubt here is if you are trading long term, I’d suggest you don’t really look at TA. How would it matter if you bought a stock at 100 or 103 in the longer run?” So sir how are supposed to decide that at which point to enter in a fundamentally strong company and at which point we should exit?
Thats the reason we always talk about a price range within which a stock is considered fundamentally valued and not get stuck on a particular price.
Hi sir,What is the recommended time frame for swing trading?
At least a few days if not weeks 🙂
Well, I was assuming it was the start of the markets and hence it will open at what price it closed yesterday or the previous trading day. Minor nitpick but just checking if I am missing anything here.
The opening price need not be the same as the previous day\’s close. I\’ve made a short video on this explaining why, it will come up on our Instagram channel soon 🙂
How can Day 3 open at 445 when Day 2 closed at 450?
It can right? Why do you think that not possible?
Sir I have gone through the video model of the model(3),in witch I have read all the key points and in the 8th poin \” Trader should discard noise from relevant information\”,My question is what do you ment \”discard\” ,what kind of \”noise\” you are talking about, and what kind of \”information\” is it the information we det from viewing the char or something else. Plise help.
Think about this – you ask your friend to give live update of the prices of onions from the vegetable markets. He keeps relaying the price as 30 per Kg every 5 mins. So that would be 100s of messages to you giving you same information…thats noise. But maybe in the evening, the price changed to 31.50, that was information. So as a trader, you should know what is noise and what is information.
Had the following questions:
Body:
Does it mean that whatever trading that happened, it happened at the prices b/w Open and Close?
Wick – Does it mean that:
– Trade occurred at the High (price)
– Trade occurred at the Low (price)
– But no trade occurred at the prices b/w Open/Close and Low/High (since it\’s just a line connecting the Open/Close with Low/High)
Thats right, Daljeet.
Hello Karthik, I am new to option trading and unable to create chart the way suggested above for intraday. How can I do it in my zerodha account?
I\’d suggest you call the support desk for this, they will be happy to walk you through the process, Neeharika.
May I know if Pi software is available right now?
Nope, its not available, Veni.
How to identify noise and how to avoid it..can you please elaboorate on it.
Generally speaking, longer the time frame of the chart, lesser the noise. So do try to stick to end of day chart or longer.
There are showed that long shadow and short shadow what is represent it?
It just indicates the peak price movement from the high point and low point with respect to open and close. I\’ve discussed this in the further chapters.
there is term \”Look Back Period\”.
As per the timeframe table, does the look-back period is the same as the \”number of candles\”?
and if not then what could be the answer for each time frame?
Thats right, look back period is based on the number of candles, which in turn is number of days, assuming you look at EOD charts.
Sir, as explained in the chapter, TA is used for short term trades(few minutes to few weeks), then how can monthly or weekly time frames be used? Aren\’t those used for long term investor?
Yes, you can apply TA for longer term trend analysis, Raj. Things like moving averages especially.
Intraday Trading Ke Liye Kis Timeframe Ka chart dekhna sahi rahenga
i cleariy understood the concept of candlesticks, ultimately enhanced my confidence.
Happy to note that, Sagar. Happy reading!
hey, can you please explain the noise and information part in a little depth Thankyou
Noise is basically too many data points with very few of them actually which can help in making a decision. Information is fewer data points but they are quality data points which can help in making informed decisions.
Can you elaborate this point – “Traders should be in a position to discard noise from relevant information”
The lower the frequency of the chart, the higher is the noise. Noise can be random data points with no valuable information. The higher the chart frequency, the better is the quality of information.
So if you are comparing 1-minute chart with 10 minutes…then 1 minute is considered noisy compared to 10 minutes.
Everything is so nicely explained that I could learn and quickly apply it in my daily trading activity. Thank you for this!!
Glad you liked the content,Vrushali. Happy learning 🙂
In the normal candle stick charts when volume charts are plotted, the volume readings shown are in green and blue for green candles and in red and blue for red candles. What is the significance of different colour indications and how to read the volume readings to help in our trading decisions?
Murali, do check the chapter about volumes and the queries there. You\’ll find your answers 🙂
Hi,
Please could you advice if this is correct: \”A short-bodied candle depicts less trading activity and hence less price movement.\”
Wont the body be short also when the open and close is nearer to each other? That does not really mean that there was less price movement right?
Hmm, a short body indicates a lower trading range. But the volume (activity) can be higher even if the trading range is low. Traders buy and sell within that range. This happens when bulls and bears are both in control and letting the price move in a particular direction 🙂
What does the length of the central body of the candlestick indicate – the difference between O and C, or the volume of trade? Please elaborate on this – \”a long-bodied candle depicts strong buying or selling activity. A short-bodied candle depicts less trading activity and hence less price movement\”.
I\’d suggest you continue to read through the rest of the chapters in this module, you will understand this better.
Sir, can you set trailing stop loss directly from chart trade.
Sir, in intraday, I can buy and sell, but I couldn\’t place stop loss directly from chart. How do I fix this. What I mean is directly from chart , not typing orders.
Check this – https://support.zerodha.com/category/trading-and-markets/kite-web-and-mobile/charts/articles/what-is-the-trade-from-chart-feature-how-can-i-use-it
Sir, in intraday trading, suppose I buy at 10:30 am, can I sell at 2:30 pm on the same day. And once brought can I sell even at the last hour.
Yes, you can. You can buy and sell anytime between 9:15 AM to 3:30PM.
Sir, in intraday, why do buyers buy when the price is up, aren\’t they suppose to buy when the price is low? Likewise , why do sellers sell in downtrend, aren\’t they suppose to sell at high trend? And how do they make profit when they sell lower than the price they brought?
Sam, the trades happen based on price action. Do check the later chapters to get the full perspective.
Sir chart setup ya planting karne ke videos Hindi me provide karaye pl.
Planting?
Since Last Nov,I had Zerodha account, and how fool of me, found this varsity link today…
Happy learning, Ranjan!
Hello
Hi Durgesh.
3.4 – Candlestick Anatomy
\”A short bodied candle depicts less trading activity and hence less price movement.\”
This may not always be the case, if there is a fight among buyers and sellers, resulting candle can be a doji or spinning top wherein volume will be high(i.e. high trading activity)
For example: PIDILITE
6 MAY \”22 CANDLE(BIGGER BODY)
9 MAY \’22 CANDLE(A DOJI)
Both have almost same volume
please clarify if I am wrong, I am a newbie.
I agree. Hence the need to check the volume along with the price range.
Sir,
I am new invester, retired person from Central Government,aged about 64 years. I came in this field since August 2021.I am facing a lot of problems in using KOTE APP . Please make separate video vin each field.
1- How to read chart.
2-How varius tools used
3- All information about zerodha app
Please collect all guidelines at one
Place.
Thanks
Thanks
Anand sir, videos are already available – https://www.youtube.com/watch?v=yzRP-mA2eiE&list=PLX2SHiKfualH_xMbGM-3zWC47s9gUjGR_
Thanks for sharing
Happy learning!
sir,
you have given that a long-bodied candle depicts strong buying or selling activity. A short-bodied candle depicts less trading activity and hence less price movement.
1. my question is does the above mentioned body include the whole central body +lower+ upper shadows or just the central part
You can consider just the real body, Venkatesh.
However late to comment but so delighted to read that no words.. reading second time and now varsity became my close friend.. Kudos to your efforts and way of describing..
Thanks so much for the kind words, Yogesh. I hope you continue to enjoy learning on Varsity 🙂
Sir,
What shall be the wise TF to enter??
Depends on your agenda in the market. I prefer EOD time frame.
Karthik Rangappa: Glad to see u still with zerodha 🙂
I have read these article twice but didn\’t get to know the answer.
1. what is wick / Shadow.
2. why it is formed in candle. as if real body is based in volume
need to understand complete details about Shadow formation
1) A wick or a shadow is an extension of a candle\’s real body, connecting the day\’s high and low points with the opening and closing. Check this video on Varsity Youtube – https://www.youtube.com/watch?v=RNu14To1gdM&list=PLX2SHiKfualH_xMbGM-3zWC47s9gUjGR_&index=3
2) Hopefully, the above video will help you understand this query 🙂
I created one dash board basis all lessons in Zerodha
https://chartink.com/dashboard/122686
Try this .
cann u add next previous buttons at the end of each section in main section.. its a ain to scroll up on side panel
You can click on the chapter names on the panel to your left.
Help sir
I read this bar chart but some time all chart and analysis is wrong. Any cleer example. Explain air.
Just like bullish hamer observe now nifty up. But at that time nifty is down. So bullish hamer pattern is wrong.
I checked many times bullish hamer pattern is wrong. 9/10.
Now sir can I help me.
Sorry, I did not understand your query. Can you please elaborate it a bit more?
Thanks.
Have been looking Everywhere to learn TA.
Finally found out how to use the method thanks to you 🙂
Happy learning 🙂
Why is an investor willing to trade because in this module it was explained that weekly or monthly chart are been used by the long term investors and as specified earlier technical analysis is only related to traders who make 1 – 2 trades in a day.
Long-term investors can use monthly charts to make slightly longish trades, held for a few weeks.
Is it a good dicision to buy because the overall movement of the candles is towards a higher direction i.e more like climbing higher than the previous prices?
Yes, but please make sure your buy decision is backed by other factors too and not just on 1 or 2 candles.
You have given wrong interpretation, When close > open = It is a Bullish candle. When close < open = It is a Bearish candle.
Hey in your videos the subscribe to varsity (logo) and next video suggestion on YouTube are blocking the key takeaway slides.
Arshaan, we have put up the key takeaways right below the video, in the blog itself. Can you please check?
When said – \”Traders should be in a position to discard noise from relevant information\”, what is \”noise\” in the sense, in this outcome ? Can any one please explain.
The easiest way to think about noise is all the excess information for over and above whats required 🙂
Respected Sir,
Have raised the ticket for the same (Ticket Number – #20211227428440 )
Team replied : \” We also have verified this with direct TV, seems the volume pattern is matching with Kite TV.
TV volume bars are the same as the price candle pattern\”.
Sir, Here Team of Zerodha is mentioning that Chart IQ follow above mentioned interpretation of Volume Bar but Trading View does not follow the same but i have also forwarded them a screenshot which substantiate that Trading View Chart on its main usa website was following above interpretation but on zerodha platform it is reacting differently.
Jatin, let me check on this.
Hi
Sir, I have my account on Zerodha.
The color of volume bar on one day (D) chart of Balkrisha Industries (BALKRISIND) seems incorrect. Please refer to the red color volume bar on
23rd December 2021. Since the closing price of 22nd December 2021 is 2137.30 and closing price of 23rd December 2021 is 2143.95, the color of
volume bar on one day (D) chart should have been Green instead of Red.
Please clarify
Sure, will get this checked.
Hi Karthik,
Once again huge thanks for this educational initiative. Will it be appropriate to say for long term investor \”monthly time frame with 12 candles for the entire year\” is good TA for entry/exit?
Not really, it would be tough to take a call with 12. If you are looking at monthly candles, look at at least 3 years of data.
Hello sir ,
Can you add chart patterns in detail as a chapter in technical analysis module . Please
Or
Can you provide information about chart patterns in detail . please
Yes, we have discussed the same further in the module. Please check.
Hi,
Don\’t you think the order for comments should be like latest
On top and oldest at the bottom .
The existing one is like oldest is at
Top and newest comes in the bottom. We all have to scroll down the entire screen to view the answer , and the scroll screen keeps increasing Year on year.
It should, but I think it will be a little tricky to redo the comment section. I\’ll check with the team again.
How to see the prices on the charts with the help of cursor as I not see it.
I\’d suggest you call the customer desk, they will help you with it.
Why “lol” isn’t he right? Coz thats what i understood
Sir I am not understand this question can you elaborate
And I desperately want to know that why so many technical analyst mostly use EOD charts why they do not use Weekly or Monthly charts ?
EOD strikes a good balance between time frame and trade frequency. Hence the popularity.
Weekly charts have less noise and nice patterns also as compare to EOD charts, can we use Weekly charts for trading purpose of 2-6 months
Of course, you can. In general, the higher the time frame, the lower the noise, fewer trading signals.
wow.This was some amazing information.Thaks
Happy learning, Vivek!
To calculate the market trend, it says do open – close. Can you please give one small example for this?? I am little confused here.
Thanks.
Open = 500
Close = 560
The difference between open and close = 60, so its bullish for the day.
Good article and *In the End* I understood candlesticks 🙂 But there might be disadvantages with the cabdlesticks chart too right?
Glad you did :), but at the end of the day, these are just probabilities, Vishwajith.
sir first time i understand clearly the candle stick chart, thanks a lot.
Happy learning!
Plz add Chapter on Point & Figure in Varsity Chart types.. it will helpful ..
Very informative, Thank you
Happy reading!
Which candle is best for inntraday? 5 min or 15 min?….Pls explain with reasons 🙏
I\’d say 10 or 15 mins.
It\’s good to use monthly chart for long term trading ? like trading based on 1M.
Yes, but I personally prefer daily charts.
Heiken Ashi Candelstic Pattern missing.
Thats because I\’ve not used it 🙂
zerodha varsity is a university for traders. Very informative, simple and short, can you please also explain Renko charts
Thanks, Jayshree. It\’s just that I\’ve never used Renko, hence haven\’t discussed it here 🙂
i really had confusion about the trades and time took in consideration for them
like say
long term
medium-term
short term
swing trading
what exactly is the time for the above-mentioned trades are they in months weeks or years
Unfortunately, there are no standard definitions for these holding periods, Shaik 🙂
Loved the simplicity of the topic.
Happy reading!
Dear Team Zerodha,
This is a great initiative taken for investors education on your part. I found this entire module very helpful. I would like to ask, as a beginner what stocks should we focus on for technical analysis, as some stocks are also present where the candlestick chart is way more complex and is near to uninformative. The charts shown in the module are taken from a selected range of stocks that follow a certain pattern in accordance with the Candlestick pattern theory.
Thank you.
Akhil, I\’d suggest you look at the Nifty 50 stocks. Its a good starting point.
\”Also note, a long-bodied candle depicts strong buying or selling activity. A short-bodied candle depicts less trading activity and hence less price movement.\”
Is it true all the time? Can a long-bodied candle not represent less trading activity and vice versa? I think, theoretically at least, it should be true. Even when candle is short, it can represent frantic activity when substantial percentage of buyers and sellers perceive a price point to their advantage. In that case, wouldn\’t candle line just move up and down many times and ultimately form a short candle?
It is not true all the times. This is generally true.
For example, a short-bodied candle can have a lot of trading around the same price.
what do you mean noise in a trade sir ?
Unwanted information, which is usually in the form of high freq data.
Please provide 75 minute timeframe candlestick
Sir Pls make chapter on Price Action & breakout trading 🙏🏻
The entire discussion on Candlestick is about price action 🙂
the background is too bright for long reading – app has black theme – pl replicate here – in fact an iteractive background n dont wud b great- Thanks
YOu can change your browser settings to dark mode I guess.
There are some \”+\” signs in the chart,what does that indicates. Please explain
You can ignore it.
Dear Sir, is it correct to see bear pressure vs bull pressure to identify bearish or bullish candle.
The candle itself identifies the bulls and bears, right? Btw, not sure about the pressure bit.
Dear Karthik,
Thanks for your amazing content.
My doubt is in the line \”A short-bodied candle depicts less trading activity and hence less price movement.\”
I have learnt that a short bodied candle, with huge volume, could also mean lot of trading activity during that time frame. Could you please help clarify.
Regards,
Shaun
True, volumes are an indicator of activity. However, it should be an equal buy and sell activity, hence the short body. If either the bulls or bears had taken over, then the price would have moved in a direction.
Hi
I didn\’t understand close >open and close <open
Ex: If Infy price on 21st May 3:30 PM close is 1354 and open Pirce @ 22nd May 2021 is 1355…Here Previous day close 21st May < 22nd May 2021 Price so it means bearish?
what if previous day close and next day 9:15 price both are same?
The closing and opening price can be different, Sri. Not necessary that they need to be the same.
Sir I can read only a bar graph not a candle stick chart
So I can invest from zreodha to share market
Of course, you can.
Need a Video lecture on these.
Karthik. Absolutely Brilliant!
Happy learning!
Sir, How is it 252 candles for the entire year in Daily chart ? Can you elaborate please ?
252 = number of trading days after excluding holidays and weekends.
Can someone please explain the volume candle stick chart a bit? What is filled in red, unfilled red difference?filled mean more volume and unfilled means less volume?
Yes, filled means more volume.
Amazing work Karthik in sharing these simple to read & understand tutorials.
I wanted to ask if Varsity has posted any videos that show some live case studies on Indian stocks with charts & how to read them ?
Not yet, Bhavesh. Hopefully soon 🙂
can you explain why after opening there will be a low and a shadow performed, what is the basis of both shadows i.e. open and low or close and high, I mean basis of its formation and why it happens
Jagmohan, the shadows are formed on the basis of the price action during the day. Do read about how the OHLC is formed.
Hi ,
there are multiple candle representing the trading during the complete day. Some with shadow and some without . If have read this chapter each candle blue/read has open/close.
But how do i analysis when there is multiple candle representing to the complete trading
Hence the need to look at the EOD chart, which summarizes the day\’s action.
hi, i do intraday trading in stocks options,call and put, so what time frame candlestick chart should i analyze before making a trade.
I\’d suggest EOD candles, Rishav.
Can you pls throw some light on advantages of using heiken ashi charts wrt traditional Japanese candles
I\’m not too familiar with Heiken Ashi, so won\’t be able to help you with that 🙂
Hello, I have a complain. I was going through this course on the Varsity mobile app. Even though I appreciate the work being done here, the app contains much less information than this website. I completed the whole of technical analysis and moved on to futures only to realise that there\’s more here on the website. Now I have to revisit technical analysis again to see what I might\’ve missed.
Hritik, we have not cut short the content on the app. Can you please point out which topics are missed on the app so that we can fix it, just in case its gotten missed?
soo any calculation or anything about this would be helpful.
Hey Karthik thanks for your reply.
If you could please explain about this caveman algorithm and use of this in setting timeframe in the renko and range bar charts where time is not required then it would be very much helpful for me because the pure calculation i need to implement in python algorithm.
Like I mentioned, I\’m not familiar with this.
what is the calculation for caveman algorithm ? It is used in defining the default brick size for renko and range bar. Soo if this algorithm uses 300 aggregated bars of data on the chart (i.e. about a year for daily charts, and about 5 hours on a minute chart), and comes up with a reasonable default value. Then what is the default value for a 10min chart ?
Hey Basudeb, I\’m not sure about this. Need to do some research myself 🙂
lots of love for ur simple way of expelation
Thanks, Firoz 🙂
Candle at 9:15 :- High and low data will be taken from 9:15 – 10:15.
Candle at 10:15 :- High and low data will be taken from 10:15. – 11:15
—
—-
Candle at 3:15 :- High and low data will be taken from 3:15. – ???
How the first candle and last candle will be formed ?
The first tick forms the Open, and then the High/low, close are formed.
Hi Sir,
Good Morning.I have this basic question about candle formation. select ADANIPORTS and choose hourly candle. You will see total 7 candle. The first candle says it formed at 1/1/2021 9:15. My question is the OHLC or HL data is taken from which time frame ? 9:15 to 10 :15 ?
Similarly you will see a last candle at 1/1/2021 3:15. Now HL data for this candle is taken from which time duration, 2:15 to 3:15 ? if you say yes then for 9:15 candle OHLC data is coming from previous day ?
Thanks for your help
For the 9:15 to 10:15 candle, the OHLC is between this duration only.
i am still confuse.if today open 100 and yesterday close 98 then 100-98=2 so whats its mean.is it bullish or bearshi
Since the stock price has gone up, it is bullish.
super information
Happy reading!
Very detailed and simplified explanation … just waiting to start trading Intraday after completing your reading up to the last chapter
Thanks Zerodha
Good luck, Ganesh!
It was so good
This chapter for exercise 3 days example ,2nd day means 2ns bullish ?but here open>close so how it\’s red ?
Sorry, dint get that. Can you please give more context to your query.
Sir, I would like to make videos on Technical analysis. shall I use varsity for a baseline of that? I will share courtesy in my videos.
Sure, as long as you get Zerodha the credit 🙂
Sir, I want to see the previous month nifty charts in options. As they have expired, how can i see on charts for practice.
This won\’t be possible, Sandeep.
As a fresher to market looking for best books ,and that make more clumsy. Thank you varsity team really love u guys started these varsity modules yesterday hope i continue in few days
Happy reading, Surya 🙂
Is there any way that I could automatically have previous day High Low line in the chart… Now I should manually use tools>horizontal to draw a line for high low (body not the shadow). Is there any option available to have it automatically
Hmm, no, you will have to look at this. No other way around this.
so what i am trying to say is that…. why is it that the position of the opening and closing in the Japenese candlesticks different for bullish and bearish market trend?
That is because of the anatomy of the candlestick, both bullish and bearish candles are represented in two different ways.
ohhh! like this……Thankuuu! very much sr….
keep studying and motivating us sr
…
Sure, happy reading 🙂
Dear sir,
In the time frame chart, i am unable to understand that on what basis, you have alloted the number of candles.
Thank you!
Think about the monthly chart – each month will be a candle, 12 months, so 12 candles right? Likewise weekly, 52 trading weeks in a year, so 52 candles. So on and so forth.
Hey Karthik!!
Why is it that in the case of bullish market, in the position of the candlestick the opening is at the lower and the closing is at the higher end and the position of the 2 changes when it is shown in a bearish candlestick??
I\’m not sure, can you please elaborate this?
Hello sir,
Im confused about which time frame I can use to do my home work for intra-day trading. I usually analyze with the daily time frame but that doesnt seem to work when I get in for the intra day. Could you please throw some light on it.
I\’d suggest you use EOD, but if this is not working for you, then switch to 15 minutes, Brithul.
Why is the number of candlesticks required for daily Technical analysis, 252 for an year?
252 trading sessions in a year.
hello karthik sir,
\”The data can either be information or noise\”, can you please explain what is noise in this context. As every candle gives information only right.
thank you
The higher the frequency, the higher is the noise. Think about it – how different is a candle at 10:00 compared to the candle at 10:01. They would contain similar amount information right? Now think about all the 1 minute candles during the day and the number of candles versus the number of candles with real information? The excess here is called noise.
\”Also note, a long-bodied candle depicts strong buying or selling activity.\” In this statement does long-bodied candle here include only Central real body or Central real body+ Upper Shadow+ Lower Shadow.
I prefer to ignore the shadows and consider just the real body.
Sir for intraday which time frame is best (15,10,5) min?
I\’d prefer 15 mins.
sir IN MY DESK TOP COMPUTER, CHART IQ IN FULL SCREEN, IS NOT COMING, REFRESH OPTION NOT COMING…I WANT TO ASK THAT THESE OPTIONS ARE REMOVED PERMANENTLY OR NOT….BY ZERODHA…OR PLEASE TELL ME HQW IT COME IN MY DESK TOP COMPUTER
I\’d suggest you contact the support desk for this.
Hello sir, I m a beginner and just started these modules and finding it very helpful. Above you have mentioned \” Traders should be in a position to discard noise from relevant information \” . what kind of noise are u taling about?? And how do we differentiate hat is noise and what is relevant information?? Plzz help
Reliance Industries closed flat today, whenever it closes flat the next day it opens 3% higher —-> this is noise
Over the last 3 years, RIL closed flat on 20 days, and the next day opening was also flat with no rice movement\’ —-> this is information as the data is quantified.
How many participants follow this ? Most important is how many buyers are attracted by a stock. Most buyers like stocks having good fundamentals like the price level and profit earnings and news.Further FII ,DII and HNI activity is very important as they buy bulk .Look for volumes and stock price moment.
Hi Karthik,
First of all thanks a lot to you and entire Zerodha team for presenting such a complete and easy to understand content.
I am using Streak to find out S & R and RSI for any particular stock. Hope this is correct ?
Regards,
Rajnish
Glad you liked it. You can you kite itself for this. Much better experience.
can we set time frame of 4 hours in zerodha charts ?…. If so, How can we do that ??
The material is mind blowing. .. One suggestions from my side. Instead of coloring red and green for candles you could use black and white because I read the print out hard copy so it is better people like us to read..
Thanks, I\’m glad you liked the questions. You can customise the colour of the candles by going into the settings.
sir how to see drawing tools in image form
Not sure what you mean by drawing tools in image form, can you please add more context? Thanks.
Does Zerodha provide a per second tick chart? If not, are there plans to provide? When?
No, we provide a 1-minute snapshot. No plans to provide the same. Do check this thread – https://tradingqna.com/t/tick-by-tick-chart-in-zerodha/10348/3
Am wish to trade intraday and as am a beginner, what is the time frame should be used give me your suggestion time frame while now am struggling to choose it am choosing all the time frames like years, month,week,hr,30mins,15mins,10mins,5mins,3mins,2mins & 1mins per MIS… Start to use all the time frames loss going to be huges….please suggest some ideas or time frames
If the intent is to trade intraday, then maybe you should start with 15mins timeframe, any shorter timeframe than that can be difficult to handle, especially for a beginner.
Does Zerodha provide a per second tick chart. If not, are there plans to provide it? TradingView provides it in their paid service, but the Zerodha TV charts don\’t seem to provide this facility.
No Victor, we provide snapshots of 1-minute data.
Investing SIr.
Thank you, Sir. Sir will you suggest any books that will improve my investing knowledge
Investing or trading 🙂
Karthik sir, what does long upper shadow and lower shadow indicate?
Just the range of high and low for the day.
Hi Team,
Is there any graph which displays the % change while checking the graph. Usually it displays the Amount change, but I am looking for % change.
Sorry I am new to this, will be helpful if you could help me on this.
Regards,
Vijay
No, there is no chart type for this.
HI Karthik
One more request plz
If possible include 4H chart in trading view. Thanks
Noted.
Hi Karthik,
Could you please include volume profile indicator in kite >chart type > Trading view. Coz i could not find the same in trading view where as in earlier normal view its available . Thanks
Try switching to ChartIQ, Avinash.
Thank you so much for providing amazing easy to understand information, and helping newbies like us to know about stock market trading.
So I\’m currently going through TA module and would like to know when can actually a newbie who honestly knows nothing and just started going through your modules begin trading.
Should the approach be like we have to first read all the modules before we can do the real stuff? Or, more like any particular modules to be completed before we can get a little confident to start trading?
You read, understand, paper trade and validate your thoughts, gain confidence, and then place a trade 🙂
Good luck!
Thank u for u reply sir. Having one more doubt, shouldn\’t only closing price be connected for drawing trend line. in case we are using candlestick body, we would be connecting green candle open price and red candle close price. Connecting closing price in candlestick chart would be difficult. Shouldn\’t there be consistency in drawing such line like connecting closing price of each day.
You can stick to the closing prices, Siddharth.
Sir in one of ur comment u have mentioned that shadow of the body doesn\’t matter much. In that case sir while drawing trend line, should we consider connecting only closing price of the candles. Wouldn\’t line chart will be more convenient drawing the trend lines. I have seen some screen shots of the traders, where traders r connecting lower portion of the candle, so they are connecting white candle open price, red candle closing price and in case of shadow is there lowest price of the day. Sir could you please guide what is an ideal way of drawing the trend line.
Yes, there is no harm in considering only the real body of the candle.
Hello Karthik,
It\’s good to trade with 3-4 time frames ? Or we must stick with only one time frame what is good for accuracy, I tried but I m so confused
I\’d suggest you stick to 1, maybe EOD charts.
\”Also note, a long-bodied candle depicts strong buying or selling activity. A short-bodied candle depicts less trading activity and hence less price movement.\”
By long-bodied and short-bodied, you refer to the body of the candle from the high to the low point, right? AND NOT JUST from the open to the close point?
Yes and no at the same time, you will have to take this on a case by case basis and think through. For example, a freak trade could have caused a huge spike, may not be very relevant to the day\’s price action. In such cases, you can ignore the long shadows and take just the real body.
Is there any difference between EOD and daily charts or both are same..?
They are the same, Prakash.
How to toggle between pop charts of various stocks in my watchlist with out actually going and clicking in the watchlist or typing in the top left of the popout chart screen? Toggling between popcharts is available in tradingview.in- as we click up or down arrow , the chart of corrresponding stock in the watchlist is displayed without actually typing. Is this feature available in zerodha trading view chart?
I\’m afraid that is not available yet, will share your feedback though. Thanks.
The above case in case of sorting what happens please give detailes
What sort or sorting are you referring to?
If i buy a share in mis then it fall how it can be change to cnc
Check this – https://support.zerodha.com/category/trading-and-markets/margin-leverage-and-product-and-order-types/articles/how-to-convert-mis-to-cnc-nrml-and-vice-versa
Very well written article, thank you very much for this
\’under the key takeaways section
with 7th point, what does \”frequency\” means?
and when i click on \”view chart\” in kite
there are two time frame.. at the upper left side, there is 1 minute, 5 min, 15 min, 1day, 1week
on the left lower side, also time frame there is, 1 day, 1 month, 1 week
why there are two sections, it\’s confusing to choose which one to click, could you please tell
Thanks Raj. The better way would be to figure the frequency/time frame you\’d want to analyse and switch to it.
Hi,
What should be the time frame for an intraday trader ? Willing to Trade breakouts & triangle/triple top/head-shoulder etc patterns . 1min chart or 10min chart ?
10min chart gives the breakout very late. Entry point is already gone by that time.
Any suggestions ?
I\’d suggest 10mins is good enough to start with.
Hi ,
What do you mean when you say a trader should be able to discard noise from information.?
Thanks!
Noise is too much data disguised as information. Information is the data that you can use to make meaningful decisions.
in OHLC …C indicates closing of perticular stock at the end of that day,,,then how we can plot 15 min 30 min 1 he candlesticks…..
It indicates the close of the stock, it could be any time duration like EOD or 10 or 15 mins…whatever you choose.
Hello Sir
There are so many other chart style in zerodha kite , can you tell us the use of Heikin Ashi chart. and also use of other chart
I find candlestick the most useful one, hence the details.
Hi Team,
Can we use Heikin Ashi + Normal Japanese Candle stick together to see the difference in market?
In Zerodha, I can choose either Heikin Ashi or Candle stick. Not both together.
Yes, you can choose one charting technique at a given point, not both 🙂
How will it look if the opening price is equal to its closing??
or does that never happen?
It would be a doji.
does zerodha give weekly options chart……i get charts for full month nifty options only…eg NIFTY APR 9000 CE
Yes, please do check Kite for this.
It means in system like chart formation are Accordingly to mathematical rule .
and not random
Is it correct
Nope, not random.
You says that 2 nd candle is slightly lesser than 1st candle it means can I conclude that 2nd candle draw randomly means specific mathematical calculations of real body not considered to located
If you are using a system, then it will be accurate. If you are drawing manually, then there is nothing much you can do.
If today IOC closed at 90 next day it open at 85 then how I decided real body length means from where shoud I draw bearish candle Is it randomly or we dividend real body in some figure
These would be two different candles, right? The 2nd candle will start at a slightly lesser level than 85 to indicate it is lower open.
sir If I want to draw candle stick pattern on paper I can not understand how I decide X – axis and Y – axis
In this chapter you do not explain the x – axis and y – axis
But why are you drawing it on paper? Also, there is no concept of axis wrt candles.
Just tried, It has the logscale feature. But still do not have indicators pertaining to PnF charts like double top, double bottom, low pole, high pole, veritical counts etc.. That would be really good to have those features too.
Making a note will pass the feedback to the charts team.
choosing a time frame is actually a very difficult task for me i was so confused. i feels that 15min and 1hr is a usefull for intraday or day trading . but how i filter information from noises ?
Rajesh, the thumb rule is – higher the time frame, better the quality of information. So 1hr is better than 30 mins, which is better than 15 mins, which is better than 5 mins 🙂
I see that the point and figure charting in kite is in a very nascent state. Not sure if we will be able to have Log scale for the box sizes, currently it takes only values. Also we dont see many options or indicators for PnF charts like low pole, high pole, veritical counts and many.. Are there any plans down the line to enhance the PointNFigure charts ?
Have you tried using the P&F chart trading view? It is available on Kite.
Hi,
Why do the number of candlesticks increase as the time duration decreases?
More time implies, more number of candlesticks.
Hi,
I have two questions:
1) I wanted to know if you are planning to introduce the time frame of a quarter for chart analysis. Right now, we only monthly, weekly, hourly and by minute options.
2) Is there a possibility to build custom indicators in kite using our own forumlas?
Regards
Anu
Both these are in the list of things to do, hopefully soon.
Hello Sir,
I am really thankful to the entire team of Zerodha for creating modules where it is easy to understand the various technicalities of stock market.
I have one doubt regarding candlestick plot.
What triggers the end of one candle and start of another. I am looking at live plots of ITC in a 1d time frame but could not understand what justifies the end of a candle and start of another.
Thanks.
A pattern triggers the initial buy or sell….and the end is drawn from either the target or SL getting triggered.
Please resolve the following in CHARTS:
1. Select TOOLS
2. GARTLEY ………..When I select & start marking over the Chart, it plots only the First Triangle. But unable to complete Second Triangle.
3. Similarly…. in SHAPES…… after plotting, when changing ……..it is not user friendly. For e.g. ARROW size/shape is not very much likeable as in Trading View,Investing.com charts.
4. In Line charts, there should be a choice for ARROW line also.
Passing the feedback to the team.
Thanks Karthik😊
Thank you Karthik.. and one more thing.. what are best times to enter and exit trades using 10 or 15 mins candles. I mean first 1 hour or last one hour or middle of day??
BR,
Gurvi
Hmm, never force-fit trades with such constraints like a good time to enter and exit, trade setups should happen naturally, as and when the pattern occurs 🙂
Hi Karthik,
What is the best timeframe for intra day? which one works better 5 Mins, 10Mins, 15Mins, 30Min or 1Hr? Please suggest. And is this possible to set stop loss using these timeframe candles? if yes how to determine stop loss with these timeframe candles.
Thank you for the help.
BR,
Gurvi.
I personally prefer the 10 or 15mins for intraday. Yes, you can use these for setting the SL. The technique to book SL is the same as EOD. You just have to look at the S&R level and take a call or any other technique you follow. Generally, ever EOD technique is applicable for intraday as well.
sir ,
I didn\’t get the meaning of buying strength and selling weakness.
Buying strength = buy when its a positive day, selling weakness = sell when its a down day.
thank u sir
Welcome!
Dear Karthik,
Can i add the following parameter to your chart
StochRSI(14,14,E,3)
RSI period =14
Stochastic period =14
Average Type = E
Average Period = 3
Please let me know how to add the following parameter to the chart
You will have to set this up on your charts, I\’d suggest you call the support line and they will help you with this.
Hi Karthik,
First of all a big thank you for this great stuff which is so easy to understand even for a person who is not from the finance background.
I am getting confused with the thing that, if the market has closed at 430 (C) and it is opening at 440 (O) then it should be in general terms the bullish market(Rising or profitable) but as per mentioned if C>O it is bullish which seems some contradictory to me.
Will you please clear my doubt of this bullish and bearish market with C>O and C<O concept?
The close > O is with respect to the intraday movement. I guess you are comparing the previous day close with today\’s open.
what is your take on heikin-ashi candles. could it be used along with other indicators
I\’ve never really traded based on Heikin Ashi, so I cannot really comment.
Hiii Karthik,
I m facing issue in zerodha web is that whenever i draw/mark any pivot levels, support resistance, trendlines in any scipt which is there in my watch list, it got disappear next day when i open a chart althogh i save it from Layout-Save prefrenceces..
Its lot of irratating to again draw/ mark same levels..
What is the solution ?
Vaibhav, can you please have a word with the support team for this? They will help you with this.
Dear Karthik,
This is a continuation to my earlier question \”O, H, L, C not appearing in the kite candle stick chart\” when I put my cursor on a candle.
I restarted the browser but it is still missing irrespective of wherever I login; be it laptop or mobile. So, I think it has to do something with my account. Please let me know how do I bring O,H,L,C back on my screen.
Thanks,
Sayan
Hmmm, not really. I\’d suggest you call our support desk, they will help you with this.
O, H, L, C not appearing in the kite candle stick chart. How to make it appear in the chart?
Thanks
Can you please refresh your browser?
Hi,
Please tell me a way to change the color of the candles and use it as default for all my charts. I know how to change it but I have to do it for all charts individually. How do i do it once and then use it as a default? I am using the tradingview charts.
Also there is a limit on the number of charts that can be saved. I can only save 10 charts and as I add more charts, the older ones are replaced by the latest ones. Please provide a mechanism to save more and keep all the studies as and when we open any chart.
Thanks.
Ravi, you can do this on the app and it will stick. About the max 10 option, there is nothing much that can be done. Will check with the team anyway.
I really have some serious doubts! ( as a scalper its really serious for me !)
We knew that An Aggressive traders like scalpers use time frames like 15 minutes and 5-minute charts. And here goes my doubt…as I\’m noobie at zerodha … I wanted to know the minimum time period for each candle for every 5 minutes time frame in intraday!
Thanks in Advance!
We have charts starting from 1-minute time frame, Jaswaanth.
Recently I joined Zerodha. After Going through Versity, I am glad that I reached the right place. All topics are extremely good and in very simple language. Hat off to the whole team.
Welcome to the Zerodha family, Channa 🙂
Happy learning and trading!
Sir,
There is high volume strike price of Last week expire CE & PE, I Compare 10900 ce & 10900 pe but showing Many range bars candle missing, Sometimes Live range bars candle showing wrong.
Sir,
Why \’Range bars\’ Many candles missing Nifty options chart ?
Guess there were no trades. Are you looking at far OTMs which are not liquid enough?
How do I set P/E charts?
PE charts are not available, Sanchit.
Dear Karthik.
I like to use Renko Charts based on fixed brick size. But after selecting fixed brick like 3 points on Nifty Futures, the chart changes further if I select 15 minutes or 5 minutes timeframe .
This should not happen ideally as Renko chart is independent of time. It should remain same on every timeframe. To make thinks more puzzling , I checked my Renko settings and it continues to show 3 point of value. I am unable to understand why my Renko chart is different for different timeframe despite same brick size
Please help how to rectify this issue.
Vinret, I\’m not too familiar with Renko. Let me check with my team and get back.
Hey Karthik! Why are there only 252 candlesticks to represent a year on a daily chart?
The rest of the days in a year are trading holidays 🙂
Sir, ChartIQ charts for 15-August-2019 is showing as working day! This is causing problems with all indicators as there are no intraday prices (naturally!). Kindly correct it at the earliest and remove 15-August (8/15) as a working day. Thank you!! You can delete this post once issue is fixed. 🙂
This will be fixed, but will retain the comment for the benefit of others 🙂
DOES ALSO ALL THE INDICATORS ARE WELL QUALIFIED FOR ANY TIME FRAME IN INTRADAY PROVIDED THE DEFAULT DATA IN KITE
That\’s right, you can use the indicators across any time frame.
ARE ALL THE TA METHODS APPLICABLE TO ANY TIME FRAME FOR INTRADAY
Yes, TA is applicable to all the assets with time-series data, across all time frames.
Does each candle stick represent a time period?
Because when I see a day chart or month chart(candlestick) there are single OHLC for entire month/day/week. So what is the meaning of \”Lower shadow = Connects the low point to the open\” and \”Upper shadow = Connects the high point to the close\”.
I\’m confused with these shadows meaning. Please explain.
Yes, each candle represents one day. I\’d suggest you check the previous chapter, on the anatomy of candlesticks. I have explained this there. Thanks.
The data can either be information or noise. What is meaning of noise in this context?
Data has to give you information, Parth. Like an EOD data has 4 data points, which summarises the price action for the day. The same thing can be assimilated by looking at 15minute charts…but in the process, you\’ll be dealing with a lot more data points. This is when you convert information-bearing data to noise.
Hello,
Your IQ charts are amazing. just want to improve one things. currently u provide 4 types multiple chart. if possible increase charts type t 6 to 8 in one window. with zomm in zoom out facility(just like trading views) from same window. order placement facility from multiple chart window.
The readings are very simple and easy to understand. I really like the material, its worth reading. I follow the material for other topics as well.
Thnx for such material!!
Glad you liked them, Isha. Happy to note that. Keep learning 🙂
Dear Sir,
I am really thankful to you as we can learn a lot from you. Same thing is being taught by other people charging a lot of money in the name of giving \”certificate or diploma in share market\” , \”Fundamental analysis\”, \”Technical Analysis\” etc. I don\’t know what is the difference between the your contents and their contents. But I am sure that your \”varsity contents\” are very rich and qualitative. Is there any scope of getting any certificate or diploma from your end also ?
Thanks for the kind words, Manik!. Yes, we recently started a certificate program, but its available only via the app here – https://play.google.com/store/apps/details?id=com.zerodha.varsity
i am not able to understand the no.of candles which is in time frame chart
The number of candles depends on the timeframe. For example, if you are looking daily chart for the last 5 days, then you will see 5 candles. If you are looking at 1hr intraday, then you will probably see 6 candles.
Can you please elaborate what stoploss is?
Sankar, imagine you\’ve bought a stock at 100 with an expectation that it will hit 109. However, just to be safer you do not want to hold on to the stock if it starts going below 95. At 95 you want to sell the stock and book your loss. So 95 becomes your stop loss price.
Wouldn\’t line charts with different colors be a better technique to visualize this data?
Line chart is limited to one field (close). Candlestick, on the other hand, helps you visualize all the 4 i.e open, high, low, and close.
when continuous chart will be available for lower time frame
when will it be available for cds?
It is available for EQ and commodities for now. CDS is on the list of things, hopefully soon. Unfortunately cannot give a timeline on this.
What about candle volume chart? it has 5 types of candles.
red-hollow, when the volume is green
red-filled, when the volume is red,
green-hollow, when the volume is green
green-filled, when the volume is red
and
black
what do the colours mean???
Rohan, we have not discussed it here as I don\’t really find any special advantage of candle volume chart over a regular candle chart with volume overlay.
can you please suggest further reading material for volume candles??
thanks in advance
There is nothing more to volumes. This is the only basic concept.
Hi Karthik,
Please make module on price action trading.. 😊😊
Thanks!
The whole of candlestick is about price action, Sohail 🙂
I want crude oil chart closing 1 HR basis, I mean 9:30 am to 10:30 am candle, again 10:30 to 11:30 am candle. IS is possible???
Yes, shift the frequency to hourly charts.
no , no, It i showing 1 candle beginning from 9 am to 10 am, what I want is , the candle will start 9:30am and will end 10:30 am
Manas, the hourly candle starts from 9:15-10:15, 10:15-11:15 etc. You cannot set a custom time frame here.
is Indicator Rsi stochatist and MACD available in Zerodha chart
Yes, it is.
Can technical analysis be used for mutual fund NAV analysis?
I think it is best to avoid that.
Hi, Thanks for your reply. Is there any other form of analysis which can be used for studying the pattern of NAV movement?
You can also check the fund\’s factsheet where you will find a lot of other information.
could you help me ,in my chart not view in the desktop terminal
Request you to call our customer service for this.
Hi Nithin,
what\’s the significance of random black candle in the colored bar chart?
You should not get a random black bar if the colour code is set to say a green and red.
Hi Karthik,
I plotted 5 Days 1 Hour chart today (11 Feb 2019) in Kite and noticed that from 23rd Jan-4th Feb there are no candles..just some small horizontal lines. The market had fallen 750-800 points in 5 days and recovered back on 4th Feb. Also, those horizontal bars were also not spaced at 1 hour…is it an error or am i missing something! Kindly let me know..
Thanks,
Alok
I checked a couple of stocks and they all look fine to me, Alok. Which stock are you looking at?
Hi…sorry i forgot to mention..i was looking at the nifty chart…i cannot attach the snap here..else i would have done that..
Nifty too looks good to me, Alok. Can you refresh your browser and check again?
Yeah…its correct now…all candles are visible at 1 hr gap…I still have the snap though and its looks like a hole in the pattern:))…so i asked just to see if they were some special sort of gaps or some weird pattern!!😂Turned out to be a tech glitch!!
Good luck, Alok 🙂
Hi Karthik,
I have few queries and I have found your course very helpful at least to understand where I was wrong till now.
1) I know you have explained about the S&R levels are very important and how to figure them out from a manual graphical study point of view. I see a lot of formulas to also calculate the S&R. Do you suggest using the formula to calculate the S&R or you would suggest to manually find them? Any suggestion on how to automate?
I am trying to put them in an excel sheet for lil bit of automation. Hence asking this question.
2) Can we take a call of Buy or Sell based on few combinations? Like Bullish Marubozu + VolumeUp or do we have to rely on complete pattern matching? I know this will come with experience however want to know your view.
3) Sometimes I see although the MACD and RSI Suggest the reverse of what is happening in the market. Can we rely solely on these indicators?
Thank you in advance for all your hard work.
Suvajit
1) I prefer the manual way to identify S&R
2) Yes, these combinations in my opinion only increases the probability of a successful trade
3) Nope, I\’d not suggest that. I prefer to rely more on price action which is manifested in candlestick patterns.
Hii Sir,
1. How longer the real body show strong involvement of buyer or seller and it can be measured in numbers.
2.Can we say higher real body means high votality and lower real body means less votality.
3.What does indicate longer the upper/lower shadow and shorter the upper/lower shadow.
1) YOu can check the range for this.
2) Yes, you can
3) Again, you can treat this similar to the volatility.
Sir, I had 2 doubts
1. How will a bearish candle stick represent when close price and low price are same.
2. Sir you mentioned about noise at the end sir please provide an example as to how to differentiate noise and information.
1) It will result in something called as a gravestone doji
2) If the frequency of data flow is high (like a tick chart or say 1-minute chart), then the data set can contain a lot of unnecessary noise and very little information.
Hi Karthik,
Is there any intraday strategy which is 90percent accuracy or is there any training provided by someone or you
None that I know 🙂
Hi ,
okay i got to know reading of the chart and types , so now how i create this charts and trade by self decision ?
Khan, there is no need to create these charts. These charts render themselves based on the streaming data on applications such as Zerodha Kite – https://kite.zerodha.com/
sir, on kite i am not able to scroll charts by finger after turning off crosshair function. is there any new changes brought in kite?
i.e. earlier after scrolling to right i was able to see chart of previous day or earlier days. from yesterday i am not able to scroll it at all.
No, there are no changes, Pratik.
Hello Karthik
Zerodha have a very good charting platform ie kite. Your team have done a great job. But there are some issues which need to be ractified. First issue I am facing is drawing/analysis disappeared next day after log in kite & Second issue – can we expect permanent order type in your platform (ie. we shall place a stoploss or buy order untill execution). This feature I think shall be very useful for working professional as well as regular trader.
Drawings are locally cached. As long you don\’t shut down your browser completely, the drawings will remain.
Will pass the second feedback to the product team
Dear Faisal
Thanks for your reply.
hello Karthik,
How do I access the daily chart i.e 10 min charts of a particular period or a particular date of the past?
Change the frequency to 10 mins, you can check the 10 mins data for the last 3 years.
Can u please provide BUY and SELL order directly in the charts in Kite? I know it is there in Pi but there is some bug in it and its chart features are very cumbersome to use. So, Please provide the same in Kite as soon as possible.
I\’ll pass this feedback to the tech team, Raj.
As mentioned above long bodied candle depicts strong buying or selling activity. A short bodied candle depicts less trading activity and hence less price movement.
What would you say about the length of the upper and lower shadow?
I\’m not too concerned about the shadows, simply because it could be an intraday spike with no real trading.
\”filter information from noise\” Please elaborate it in detail. I didn\’t get this point.
Frequent data like tick by tick data is noise (unless your system is designed to deal with it). In general, larger the time frame, the better is the quality of the signal (information).
Thanks Karthik… Got your points.. varsity really helping to understand stock market . I\’ve just started reading it and found very helpful and easy to understand. I appreciate it.
Best Regards.
Hi Karthik,
Varsity is simply best. Also appreciate you and your team for explaining complex content in simply way to TA beginner like me.
Regarding Candlight charts in kite, cannot it possible to highlight Spindle or Dojji on charts directly by software as indicators part of the chart.
Regards,
Prasad
Thanks for the kind words, Prasad.
That may be a little tricky. I\’m not sure if that would be possible. Let me check.
Hi Karthik! To begin with, I congratulate you on the simple language used for easy understanding of new comers like me.
Request you to elaborate on the statement in this chapter
\’The data can either be information or noise. As a trader, you need to filter information from noise\’.
Also advise how do I draw trend lines on the daily charts while the market is in the session.
Regards,
Bipin
Noise is when you look at high-frequency data – for example within a 5 mins window, a stock could have traded between 100 and 100.75 several time. A trader trying to digest this information at every trade (tick data), according to me is dealing with noise (unless you have a HFT strategy). So lower the frequency, higher is the noise and vice versa.
Thanks Karthik the information is helpful.
Can you suggest a free software or site where I can see or record the daily HLOC rates of scripts to help me select scripts for trading. In fact, I have read about it somewhere in the Varsity or in questions and answers but am not getting it.
Regards,
You just need a good charting library for this. I\’d suggest you use Kite. Here is a quick look at charting on Kite – https://www.youtube.com/watch?v=5M232FaN5Ks&list=PLkxTRam6E2V-okv6gwQlt6dLTsn0v6CD1&index=10
Thanks Karthik the information is helpful.
Regards,
Good luck!
dear sir,
pls tell me what are the charges of \” Pi chart\” uses.
No charges for any trading platform from Zerodha.
Hi Karthik,
first all I would like to say a big thank you from the bottom of my heart for this wonderful chapters. I m new to finance and I feel very comfortable after reading this. now my question to you is that what is \”Mark to Market\” with an example.
Gaurav, thank you so much for the kind words.
Mark 2 Market (M2M) is basically settling your Profit or loss at the end of the day for an open position. Have explained with examples hee – https://zerodha.com/varsity/chapter/margin-m2m/
is it possible to get lower then one minute timeframe candlestick chart say 30 second or 15 seconds.
also what is your opinion on tick charts. Are they really better then time charts.
thank you
No, not possible on Kite. But I personally think, the lower the time frame, the higher is the noise component.
Which time frame best in chart for intraday trading
You can start with a 15 mins chart.
SIR CAN YOU EXPLAIN ME CANDLE STICK CHART IN REAL TIME
What do you mean by that, Rushabh?
When will I find Time series on charts on zerodha.. i mean tool of time series/time gaps?
Are you referring to charts? Do check out Kite – https://kite.zerodha.com/
How can i access your chart to my website is there any method or module?
Login to kite.zerodha.com with your credentials and enjoy the charting feature 🙂
In my Kite account, candle chart is not showing volume candles. Please help. I switched off by mistake
Click on the studies and load the volume chart, back again.
You are right Karthik. After having thought for three days and seen various candlesticks I am beginning to understand the nuances of trading and the meaning of your words now. Entry, exit, stoploss, rentry, adjusting stoplosses all have meaning. it,s tough game really! Clarity of thought, quick right decision and a little bit of luck may improve chances of a trade in your favour , but there is no guarantee to success is all I have understood.
You are absolutely right, Abhishek! Keep learning, this is the only good way to survive and successful in the markets 🙂
morning 10am.
Hello Karthik
pl correct me, if i am wrong. I decide my intraday move from zerodha candlesticks and go for 1Day chart (located at bottom of char i choose 3M and then automatically 1D comes at top of the chart, which i believe is the 1 day chart). Now having seen this 1D chart i put my trade (long or short based on vol, cs patterns and other points from ta varsity) in the morning at 10pm. Then i do nothing for the whole day , i let either sl hit or target hit. By doing this i was getting continuous profit for the last 10 days. but for the last 3 days i am getting continuous losses. Whats wrong in my method, Pl guide.
Abhishek, you will have to introspect on each trade and analyze what went right and what went wrong. I\’m sure you will find your answers.
is range trading disadvantageous as compared to trend trading? i hear people saying to stay away from sideways markets but after having analysed many intraday charts of numerous stocks i find that when the stock goes into a sideways range the support and resistance level become more clearly defined. I agree that the reward will little as the stock will not move much but by trading multiple times going both long and short throughout the day it can be seen that the total gain is almost same as one trending move gain.. so why exactly do people say to not trade range markets even when the SR levels can be more clearly defined?
I\’m really not sure, but I too like trading the sideways markets for the exact same reason 🙂
is there option to download contents in pdf?
Scroll to the end of the chapter and you will find the link to download the PDF – https://zerodha.com/varsity/module/technical-analysis/
End of Day Chart Displays Only up to 03.29 PM Only.
Last minute values are not being shown up. candle is forming from 3.29:01 to 3:29:60?
We sync the data with the bhav copy every day, so the closing prices will match with the exchange data.
Hi Kartik Sir,
After migrating into Kite 3.0, I am unable to open any charts
While opening charts, I am facing a error:
ChartIQ is not available on your computer
Can you please help as to what may be the possible error
Thanks
Meet Shah
Are you using Internet Explorer? If yes, can you try using a different browser?
If this still doesn\’t fix your issue, please raise a ticket here
I compare two charts on KIte (Nifty& Indiabulls hsg. Ltd.). But I don\’t understand what is that % of Y-axis. Can you please, tell me how can I compare two charts on kite & what\’s that %.
Aditya, Y-axis is the price. You can click on \’compare\’ option below the symbol name in the chart. Additionally, you can click on display and select 4 or 2 chart options. Please note, these features are available on Kite 3.
What is an ideal time frame to complete a trade if only Technical Analysis is being used? Is it a day or two or more like two weeks to a month?
If you are using an MA-based system, then you can look at time frames like a month or two. If you are looking at patterns then it has to be short-term – like a week or so.
Superb Tutorial. Thanks for having the patience to write these and educate so many of us Karthik . Not an easy task to make it so simple . And it is free for all.
No words to explain the good will. Thanks again
Thanks for the kind words, Sandhya 🙂
Good luck and happy learning!
Very informative and well explained data.But sir, can you please suggest me some video modules too for the better understanding of the movement.Thank you.
We will try and add more videos here, please do stay tuned – https://www.youtube.com/user/zerodhaonline
Excellent module. is real body of Japanese candle stick represents volume traded on that day?
No, the real body of a candlestick does not really portray volume details. However, similar to candlesticks, there is something called candle volume, which does. Will probably include a supplementary note on this sometime soon.
So, what exactly real body revels and with which variable its length is varied ?
Real body represents the price action for the day, thats what it represents.
Thanks for immediate response. You really helping newbie not only with basics but quick and clear response. Thanks.
Good luck and happy learning 🙂
Hi,
Please add Banknifty Spot chart to kite and Pi.
It is available, try using \’Bnknifty Index\’ as your search in the market watch.
i am not able to getting close price
Can you check now?
please explain noise and information
and how to discard noise
Hmm, that would be very difficult 🙂
Consider this – you are a part of the high school Whatsapp group with about 100 people in it – on a daily basis, you will receive tons of junk messages, like the \’Good Morning\’ messages. Most of such messages are a waste – just like noise. Once in a way, you get an important message, like maybe a message for a school reunion – this would be information. In the trading world, 1 min chart has tons of buy/sells without any meaningful change in price – this is noise. But there could be 1 or 2 trades, which brings in liquidity and influences the direction of the trade. This is information.
Hi,
In technical analysis chart, in 5min chart the figure shows one scenario and in 15 min it is different. As both are used for intraday , on which we should rely.
Yes, this is because they are two different timescales. Which on to depend upon depends upon your trade temperament.
Dear Karthik,
Greetings for the day. Thanks for such great explanation.
If I am looking for a BTST or a Short Term trade and willing to hold my position for few days, than for Single Candle Stick Patterns and Multiple Candle Stick patterns, I would be using data for a single day or last 2 or 3 days only.
1. Please confirm if my understanding is correct ?
2. When we say uptrend or downtrend, in my case as mentioned above, how many number of days should be considered for the stock to be in uptrend or downtrend ?
Thanks in Advance.
Regards,
Muffadal
1) Yes, however, I think 2-3 days data may not be sufficient, at least 1 week\’s worth of data should be good enough
2) Like I mentioned for previous query, look for at least 12-15 trading sessions worth of data
There is a website of Zerodha, I have visited earlier. I am not able to find it now.
The Website is about the Technical Indicators used by the Zerodha. How they work, what they are used for and complete detail about it.
Can anybody provide me the link to that website.
Thanks.
Is this the one? – https://zerodha.com/varsity/chapter/supplementary-notes-1/
Dear sir, how to see NIFTY BANK-SPOT chart in zerodha kite? Or only NIFTY BANK FUTURE charts are available?
Yes, add the chart on your market watch and click on charts. Check this – https://www.youtube.com/watch?v=5M232FaN5Ks&list=PLkxTRam6E2V-okv6gwQlt6dLTsn0v6CD1&index=10
Friends i m a beginer, so i want to know how add data box in kite platform in browser to see particular candle ohlc that already shown in pi platform.
Ajay, you can click on the \’Info\’ button which will enable the OHLC data for each candle. Check this screenshot for more help
thanks sir
Hi Karthik – Had 2 queries:-
1. If I want to place say 2 to 4 trades a week, my understanding is I should use 1 Day Candlestick (instead of 15 minute, 30 minutes or 1 week candlestick). Is that correct?
2. You said that after entering a trade, we must not do anything until the target or stop loss is hit. But for how long should we wait if neither of the two are hit if we are trading based on TA?
1) I\’d suggest you use EOD charts
2) Technically you should wait till either one is achieved, but if you are forced to withdraw, then maybe you can consider time-based SL.
Hi Karthik,
Where can I get more information on Heikin Ashi chart style?
We dont have any content around this as of now, Sunil.
>Also note, a long bodied candle depicts strong buying or selling activity. A short bodied candle depicts less trading activity and hence less price movement.
I don\’t get this. IMO candle length represents the net positive/negative info made accessible to the public over the course of a day which need not correspond to volume traded. If every market participant revises their valuation of a stock upwards by x over the course of the day, this fact will reflect in close = open + x but not have any bearing on market volume.
It\’s also possible that Open = Close but minute fluctuations in individual valuations caused lots of trading activity. Essentially the two are not correlated IMO.
A long-bodied blue/green candle means that the buyers were willing to buy at any given price during the day, hence the long candle. Likewise, in a long red candle – sellers were willing to sell the stock/index at any given price.
Dear Sir.
Requested you that please lets us confirm which suitable time we should enter for intraday…
The time is right when the opportunity strikes!
Hii Karthik
Which chart should I use for Positional trading ( one to two months investment horizon )
I\’d suggest the end of day chart.
Actually Karthik, I am new in the stock market, can u please elaborate what is EOD the chart and in kite app/web where to see it ?
EOD means \’End of day\’ chart. It contains the day\’s open high low and close prices. On Kite, click on a stock name, and you will see the chart icon highlighted. Click on it to open up the chart.
Please add information about:
– Renko charts
– Point and Figure
– Heiken Ashi Charts, etc
This will make this charts journey complete.
Will try and add that in the supplementary note.
Do Zerodha have Point and Figure chart in Kite or Pi?? Is there a note about it in Zerodha Varsity? Pls do share any info about it, will be helpful. By when can we expect it in case if you don\’t have.
Thanks,
Is available on Kite, but unfortunately there is no note on this in Varsity. Will try and work towards it 🙂
Thanks Karthik for your timely reply. If not available in Zerodha Varsity, can you pls suggest some site if you are okay would be helpful.
Diljeet, sure I try and check for resources.
Even a short video from Zerodha would be really helpful.
Thanks, hope I\’m not asking too much!
Got it. I\’ll and figure this out.
What is the difference between \”stop loss\” and \”stop loss market\” ?
Stop loss is an order which prevents you from making a certain loss beyond a certain price. For example, you\’ve bought a stock for intraday at 225, you can place a stop loss at 220, which means you will book a loss and get out if the stock falls to 220. This is also called stop loss limit.
The stoploss market is when you tell the system \”Get out of the stock at any price if the stock falls below 220\’, given this, you could even get out at 219 or 218. Whereas in stoploss limit – you will get out at 220.
Check this – https://www.youtube.com/watch?v=eXMrEMdQWrQ&index=6&list=PLkxTRam6E2V-okv6gwQlt6dLTsn0v6CD1
Thank u sir for clarifying my doubt….
Cheers!
how do i sell shares held on cash and carry basis.
i tried but the amount is not credited in my account
Select CNC while placing a sell order. Do make sure the shares are in your DEMAT account.
Hai Karthik,
very useful for the beginners……..thanks a lot…..
regards
Sharat
Cheers! Happy learning.
The real body denotes what why the high and close price are looks like thin and why real body looks thinner
It denotes the Open and CLose. The next chapter digs into the anatomy of candlesticks.
Sir , today when i was doing check my SBI ipo .. when i saw that , chart was under maintenance. after then i again checked in the start night at 9.40 Pm , now chart showing very small candle against yesterday.. yesterday it was very nice.. but now in all time frame candles showing like almost renko chart. .. So please do it correct as yesterday.
SBI life is not yet listed, Ashok. Also, the charts on Kite are working fine.
Hello, as I started using the chart, it was showing prices as well as volumes on the same chart, but I don\’t know what happened, maybe by mistake, now it is not showing volumes which is very problematic and unconvenient. I have tried all the basic tools available at the chart\’s top but nothing helped. Plz help in restoring the volume candles in the same price chart.
I\’m assuming you are using Kite. Click on studies and select volume chart from the drop-down.
Thanx…
Cheers!
Hi Zerodha,
I am now user. While trading intraday many shares zerodha not giving margin at the same time some shares zerodha rejecting the order. but i am having more than the order money . Please explain what is going on ..
ZM2972.
Regards,
Vinoth
Some of the shares are not permitted for intraday trading as they are under \’Trade 2 Trade\’category. Stocks under T2T should be taken in for compulsory delivery.
Does the length of the rectangle in a candlestick depict
1. the magnitude difference in open and close price
OR
2. the number of trades made?
Length or range for the day.
Very informative??Your resources are always best. But it will be very helpful for us if you add wicks to the range bars, renko like ninjatrader or mt4. And my another wish is to see tick chart on zerodha kite or pi. Please reply me, if these are possible or if you have any plan to add them shortly. Thank you
The lowest frequency for the charts is 1 minute, frankly, in my opinion, this is good enough for low-frequency intraday trading.
Hi,
A lot of time and efforts must have spent in to make such a simplicity rich content. I really appreciate those helping hands behind Varsity. Thank you guys for bringing this introductory yet rigorous trading manual(kind of) to the \”Free World\”.
–
Mayur
Hey Mayur, thank you so much for the kind words! We really appreciate it.
Happy learning.
respected madam ; i see your video in you tube please send me information about your zerodha site how this site open send me my whats app no. in hindi 8446424897
Sir…Zerodha\’s website (www.zerodha.com) opens just like any other website on the internet.
Hi…
I need some clarification regarding Renko charts.
1. As per the definition, Renko charts do not consider time – they consider only value. In that case, Renko chart for a box size of, say, one rupee, should look the same for any time frame. That is not the case. You can check that from the following graphs.
https://www.dropbox.com/sh/sim46jyvpawq4vg/AAB-RqyUUqJbQcfAbx-elkRka?dl=0
2. Renko charts go back and forth for a few latest candles. i.e. they repaint. What is the logic in repainting? Is it related to timeframe? Also, if they are repainting, how can the chart be trusted?
~Shailesh
Not really familiar with Renko, Shailesh. Not sure if I can comment on this.
Repainting is due to time frame which you select. So please select the lowest time frame possible to avoid repainting.
Thanks for pitching in, Shakeel!
But if major fluctuations happens in a minute then repainting of the candle will create confusion. So need to have pure price based chart.
Zerodha team please let me know the solution for this.
The candle will acquire its color only after the minute is over.
And for the renko size in different time frame, I think in kite or any other Indian platform, with change of the time frame, renko brick size also changes. You check it yourself if I am true. I\’m not quite sure. And it may happen because of repainting also.
Do you have heikin ashi chart and stochistic rsi on your kite
Heikin Ashi yes. We do not have stochastic RSI, but we have stochastic momentum on Kite.
In pi EA (Trade script) is there any command to read the price value of the existing position that we hold ? If not can you add the same ?
I do not think so, let me check with my colleague regarding this. Thanks.
Can you provide the facility of automatically indicating open positions (using an arrow symbol or a green or red dotted lines for buy and sell positions correspondingly) in both the Kite and the Pi Charts (I think this is available in Meta Trader and Sher Khan Platforms). We keep manually drawing Horizontal Lines to indicate the same, which is time consuming, especially during intraday Trades where we have to be fast enough ?
Will pass the feedback to our tech team. Thanks.
Hi Karthik Sir, why don\’t you think about expanding the mobile/browser kite app as a desktop software and then completely phase out Pi? This will cut down your development cost at the same time it will provide a familiar environment to the users across multiple platform making it feel seemless
Thanks for the suggestion, Mukesh. I\’ll pass this on to our tech team.
I have two issues:-
1) Can you provide the facility of automatically indicating open positions (using arrow symbol or a line) in both the Kite and the Pi Charts (I think this is available in Meta Trader and Sher Khan Platforms). We keep manually drawing Horizontal Lines to indicate the same, which is time consuming.
2) Can you provide charting in Pi as available in Kite – In Pi chart the candles do not adjust there size (height) according to the chart area available as the chart keeps moving (due to new arrival of datas). It is most of the time seen as minute candles in Pi.
2)
Will pass this feedback to tech team. Thanks.
Thank you for replying Karthik however can you please help me with any link where I can easily understand that how to make intelligent guesses, based on prior chart patters ?
You will have to read this module on TA for that 🙂
I\’m a beginner so sorry if I sound idiotic however I want to understand how can a chart help me trading as I can only see what has happened in last 5 minute of duration however it won\’t let me know that what exactly is going to happen in next 5 minutes ? Please let me know if anyone can answer this.
In fact, nothing in real world will let you figure out what will happen over the next 5 mins in markets :). We all tend to make intelligent guesses, based on prior chart patters.
Kite has RENKO chart. But what I want to know is that are these charts closing price based or hi/low based? In closing price based charts, previous action before the close of candle is neglected and thus it becomes very misleading. Hi/low charts will have hi of candle as hi point in the period and low as low of period, this is better as entire price movement is captured this way. Please let me know Kite RENKO charts are of what type?
Renko is based on price action and not on OHLC basis.
Hi any one please help me,
Is there any charts that gives us information about liquidity of stocks, I f not where do I get informations about it……………….
What sort of information you need? Do you need to know what Liquidity is ? – Check section 9.2 – http://zerodha.com/varsity/chapter/nifty-futures/
I am not able to enter box size(renko chart) in zerodha kite .always i have same result not process my box size always auto selected box.please help.me
You can customize it to any range you need. Whats the exact problem you are facing?
I see zerodha provided this chart on market hours from28april
Ok.
I want to see one week time frame chart for past 10 years. Please help me out
I\’m not sure if Kite/Pi provides this. Let me get back to you.
Hi ,I want to know zerodha provide live renko chart or not.if yes zerodha thanks if not please provide this feature.
Yes, they provide Renko chart. In kite you can find it in chart type section.
Yes, please check Kite charts.
Can u include 2 minutes time frame in the chart?
At present we do not have this feature on Kite. Should be possible in the futures.
hey kartik how can use Elliott Wave chart in kite terminal pls tell me
Nope.
Hi, I have been doing some research on Google about Technical Analysis and One thing that caught my attention was the type scale of the price chart that we see matters a lot. Basically there are two type of scale 1) Linear scale 2) Log scale. And I have learned that using log scale is more accurate than the linear scale. I just want to throw this topic for discussion on this platform for more insights on the same.
Good point, I\’ll try and write a note on this sometime soon. For now, I\’d suggest you stick to log scale.
Dear Karthik,
Please let me if we have an option in pi to use log scale instead of arithmetic.
No, Ayan you cannot do that on Pi. However, you can use Kite to look at the log scale.
Hi Karthick,
Am new to trading. I have a doubt here. In the no.of.candles/ time frame table,
Monthly >12 months/yr > 12 candles,
Weekly > 52 weeks/yr > 52 candles,
Daily > 365 days/yr > one candle/day but total no.of.candles is given as 252…but it should be 365 right?
Intraday 30 minutes > 2 candles/hr will make 24 candles/day..right?
Similarly there are differences down the table…
Please correct me if am wrong 🙂
Your query made me realize that there is a mistake in monthly and weekly as well…there are only 252 trading days a year or about 22 trading days a week …5 a week. It needs to be adjusted accordingly.
I am not meaning the regular Stop Loss orders. BUY STOP and SELL STOP are pending orders as explained below, along with BUY LIMIT and SELL LIMIT for comparision.
Buy Stop = Going LONG once price comes UP to hit the entry price mentioned in the order.
Buy Limit = Going LONG once price comes DOWN to hit the entry price mentioned in the order.
Sell Stop = Going SHORT once price comes DOWN to hit the entry price mentioned in the order.
Sell Limit = Going SHORT once price comes UP to hit the entry price mentioned in the order.
Is BUY STOP and SELL STOP orders available in Kite and Pi as available in Meta Trader.
You mean a regular SL?
Check this – https://kite.trade/docs/kite/#market-timings
As there are 2 types of Renko charts, 1 with only body and 2 with upper and lower shadows.
Can some body help me if i want renko chart with upper and lower shadows on KITE.
I\’m not too familiar with Renko. However, I\’ve requested one of my colleagues to touch base with you soon.
Hi,kite is provide this services.he called coloured bar(without shadow) and candle stick(with shadow).I hope you not have any queries on this topic.
In Kite whenever we click on the notification symbol (i.e. Bell Symbol) all the Menu items on the top ( e.g. Dashboard, Orderbook, Holdings, Positions, Funds and Apps) are vanishing. Please check and solve the same.
Thanks, will share this feedback with kite team.
I found many instances where there was a red candle formation even though it closed higher than the previous candle. What could be the reason?
Can you please share some examples? Also, where did you find this? On kite/Pi?
I found it on Zerodha Pi on a Nifty daily chart. Now, I don\’t know if I have misunderstood something. On November 9, there is a long green candle but on November 10, I see a red candle although it closed above the previous candle. Can you please check and reply?
Request you to please email [email protected] for this.
Alright, will do it.
Thanks.
By the way, did you check it yourself? I hope it is not my misunderstanding of the charts in anyway 😉
Not really, but don\’t worry you are in good hands. Sreeni is a resident expert on Pi 🙂
Thumb rule, if the closing price on Dec 10 opening price on Dec 9, then the candle will be green for Dec 9..
No need to mix Dec 9 & 10..
Green and red color of the candle on a particular day, depends only on the opening and closing price of that particular day..
Hope it clarifies..
Sorry..in the last comment, greater than and less than symbols could not be posted in the comment.
If Closing price on Dec 10 is less than opening price on Dec 10, candle for Dec 10 will be red.
If Closing price on Dec 9 is greater than opening price on Dec 9, candle for Dec 9 will be green.
Don\’t mix Dec 10 with Dec 9.
Red or green candle for a particular day only depends on Opening and Closing price for that particular day
Sir,
Is there any facility in Kite and Pi to indicate the Bought / Sold Positions in the Charts (i.e. small blue and red arrows automatically generated, indicating the positions where we have bought or sold a stock). It will be useful to know how far the chart has moved from the position from which we have Bought / Sold, which will be useful in intra day Trading. The same is available in Metatrader
This is not possible in Kite, however you can trade from chart on PI wherein this is possible.
Sir, What is Periodicity, Interval and Days shown in the pop up window, on trying to open a chart in Pi.
Check this – http://zerodha.com/z-connect/tradezerodha/pi-tradezerodha/trading-from-the-charts-pi
Sir, Is there any facility to see the vertical (y-axis) price line in the charts, in terms of % value (% value w.r.t the previous days close price) in both Kite and Pi. The same is available in i-charts. If not available kindly add the same, since it will be very useful for us instead of manually calculating the same every time when the price moves up or down.
Thanks for the feedback. Unfortunately we do not have the option as of now, not sure if we can add this feature easily. I\’ll anyway check with our team.
How to trade with renko chart. what is size box size we have to put trade nifty and bank nifty. Please reply
Will try and include Renko sometime soon.
Any update on this topic.
Thanks.
Update on?
is it ok to take ltp instead of close ?
LTP and close can vary, better to stick to close.
thanks for this tutorial
Welcome!
I\’m not a geek but wonder why there is no software to determine support and resistance levels of a particular stock.
Not sure, but its so much easier and maybe more reliable if you plot them yourself.
Dear Nithin, Can you please return the PERIODICITY functionality to Pi. Not being able to plot weekly , monthly etc. on Pi . Prefer Pi to Kite. Thanks
Naresh – request you to send this request to [email protected], thanks.
Hi Karthik
Is it possible to view a particular intraday or even a weekly chart on Pi?
For e.g I need a chart for 1st June 2015 Nifty?
If not, can you recommend any source/website/software to get such information?
Thanks
Intraday may not be possible when you date back so much. However EOD is possible on both Pi and Kite.
Check Kite\’s user manual – https://kite.trade/docs/kite/#charting and for Pi check this – http://zerodha.com/z-connect/tradezerodha/pi-tradezerodha/charting-pi
Hello,
Can you please add wicks to the Range Bars chart. Otherwise, it looks so easy that a monkey can trade. Obviously its quite misleading. Range Bars without wicks is close to useless IMHO. Thanks for your understanding.
Sure, thanks.
Hi Karthik,
Do you mean to say you are going to add soon. Please confirm. BTW the options write up and others too on the varsity were out of the world. You could definitely consider writing. Please keep up the good work.
i make callouts for a long time and i want that there will be a search option in chart so that i can search my previous kite easily by typing in search box
Well, charting on Kite is a 3rd party engine so making changes to that is not quite easy.
kite is 3rd party but you can demand for improvement for your customer. If we can search our callout and annotation by using search box. Then every user feel like expert ……
Yes, I do understand. Meanwhile you can check out – https://in.tradingview.com/
Hi,
I needed to know about Renko Charts. Can you provide some information about using those charts for futures trading. Also need to know how to use Renko Charts in Kite.
—
Darshan
Renko is available on Kite, just click on chart types in your chart window and scroll down to select Renko. We will try and put up some notes on Renko.
I trade and work on Kite tool. Is PI also required to be used for charts and analysis or Is Kite alone is sufficient to identify trades based on charts available in Kite tool website
Charts are the same, so that leaves us with which platform is convenient. For me both are good, but I like Kite as its a browser based application.
I wish Pi had weekly and monthly charts. It\’ll such a nice improvement.
Will convey the same to Pi team! Thanks.
Have you tried Kite? Kite has weekly/monthly charts.
I want to understand the difference between Pi and Kite ? Which one is better ? Who generally use Pi and Kite ?
PS: I just started process to open account in Zerodha
Kartik, Please ignore my last comment since I got the answer of my query when I just scroll down to read the answers from others
Sure, good luck, Rakesh.
Hi Karthik, I am going through Varsity and let me tell you that this is one of the \’best\’ \’best\’ resource to start if you are a newbee to trading.
The quality of material is excellent. What leave me baffeled is the honesty with which you and Zd team promptly answer the questions posed by readers.
I particularly like the way in which you teach. You are a excellent teacher. The way in which you pick up simple examples to drilldown the concepts is simply awesome. Heartily thank you for the wonderful work that you and Zd team are doing 🙂 🙂
Best Regards,
Anand
Thanks Anand, encouragement such as this motivates us to do better and better:). Please stay tuned, we have some really exciting content coming up!
Do we OHLC only for a day or can we have it for 15-20 minutes or any other shorter time frame also?
OHLC for a day is the opening price of the day, highest traded price of the day, lowest traded price of the day, and the closing price of the day. Similarly, for a 5/10/15/20 minute chart the OHLC will be compressed for the time frame. So yes, you can have it for 15-20 minutes.
Hi Karthik, I have account with Zerodha, only problem is PI is not supported in Mac OS…. I don\’t have windows in mac 🙁 . is any other free software /URLs to analyze in Mac
Why not use https://kite.zerodha.com/ ?
I dont have zerodha account yet. Can I use PI software???
Nope, Pi is only for Zerodha clients. Why dont you open an account with us, would be a pleasure to have you as a client 🙂
https://zerodha.com/open-account
what is renko chart? which type of traders commonly it use?
Renko is an other charting technique like – bar chart, line chart, or candlestick. It comes with its own set of patterns and trade identification techniques.
hi
when I select renko as chart type for nifty futures, i do not get all data. just few days and it does not show todays data. I have set range to 22. please advise. thanks.
Request you to email our support here – [email protected] , thanks.
What is the size of Renko decider?? Is that ATR 14??
Default brick size is calculated using Caveman algorithm. This algorithm uses 300 aggregated bars of data on the chart based on the timeframe selected and comes up with a reasonable default value. The default range can be adjusted based on your requirements from the Display option.
I found this chapter very informative and useful ; but i still feel that line chart is quite useful for a beginner like me.
Oh certainly…I love the line charts myself 🙂
Do you know of any websites similar to nsebsecharts dot com which offer FREE Live technical charts with Realtime ticker?
Yeah, check out https://zerodha.com/pi/
in earlier version I was able to expand/reduce MACD/RSI rows as required for better view. but now i cant do it. why? can it be restored?
Which software are you talking about? If its Pi, I would suggest you send out an email to [email protected]
The problem with demo candels given above is that both candles are depicted in red. Signalling a bearish candle where the open was lower than the close. That is being quite problematic
Sorry, I was unable to spot these. Can you kindly elaborate?
Is it possible for me to use the datafeeds from Pi to my RStudio setup. Currently I use RStudio to connect to Yahoo and google finance for analysis.
We don\’t provide feeds from Pi to any other source as it is a regulatory mandate..it falls under the data redistribution act.
Ok, In that case what is the protocol used by Pi to get the data from the server. What is the latency? Is this something I could use once I signup?
Sorry for the delayed reply Floyd. However I believe this is proprietary information and cannot be disclosed.
Hi FLOYD ,
Are you from Bangalore ? I have Rstudio installed and would like to learn the price analysis . Would you help
?
@ Karthik Rangappa,
Sir,
Can you please suggest any sites/softwares wherein , say a data about a particular stock over a period of say 10 days gets synced into an a excel sheet as and when required, coz i have a problem updating the prices manually ..
Any solution for this ?
Any free softwares for indian markets?
Thanks,
Regards
hjm–a proud and thankful zerodhiite
Have you checkout Zerodha\’s Pi? I guess that will solve a lot of your problems :). Check out http://www.zerodha.com/pi .
How do i log in on pi as i am already a zerodha customer. But still i cannot use pi
Suggest you shoot an email to [email protected] for this.
Dear Mr Karthik,
Can we say marked candles as bearish engulfing?
Not actually since the prior trend is not really bullish. In fact it is more sideways.
While in a bar chart the open and *low* prices are shown by a tick on the left or the right sides of the bar, however in a candlestick the open and close prices are displayed by a rectangular body.
Pls correct it – open and close prices, thanks
Thanks for pointing this, made the correction.
Please suggest good free software to plot these charts. 🙂
Checkout http://www.chartink.com.
Hi Karthik,
Before connecting with Zerodha i use to search lot of websites for a good charting website, and at last i was banked with chartink.com i believe ita a wonderful charting website, especially for TA. well whel i opened \”zerodha kite\” for the first time just last wednesday 13th April, 2016, \”i was on cloud 9 after seeing the one minutes charting\”, which is as needful as a basic slate for first time school goers kid.
Absolutely!!
Is Zerodha Kite free? Please could you point me to the link
You need a Zerodha account to access Kite for free. https://kite.zerodha.com/. You can open an instant account online – https://zerodha.com/?ref=varsity
how would i plot chart….is there any video sir.
Shishir, do check out the videos here – https://www.youtube.com/watch?v=1Jy23XfKwG8&list=PLkxTRam6E2V-okv6gwQlt6dLTsn0v6CD1
Very good, informative, simple words and short.BUt one should already know how to draw graphs.
Thanks Reyazn. There are many softwares that let you plot these charts.
information is very good .. but i suggest zerodha should have placed a video tutorial for TECHNICAL ANALYSIS for better understanding of the charts .
Sure Mahesh, we will take it one step at a time 🙂
Hi Karthik,
Do you have a Vidio tutorial of technical Anaysis to plot the charts in pi . I can just not understand how to plot it in pi.
Lots of videos here – https://www.youtube.com/results?search_query=zerodha+pi
Sure, one step at a time 🙂
Excellent work Maadi. Keep Going and a Big Huge Cheers …
Thank you 🙂
In the earlier module, it was mentioned that TA is not for long term investor, but here it is mentioned that for long term weekly/monthly charts to be used. Its a bit contradictory, please elaborate. Also what about short term(week to a month) or medium (weeks to few months) terms, what charts to be used?
If your investment horizon is over 1 – 2 years then it makes sense to look into the fundamentals of the company. However if you want to set up a trade for 3-4 months then it makes sense to look into TA. So yeah, from convenience point of view it makes sense to bifurcate long term into 2 baskets – The TA based long term (3-4 or maybe upto 6 months) and The FA based long term (1-2 years plus).
please elaborate. Also what about short term(week to a month) or medium (weeks to few months) terms, what charts to be used?
For any non-intraday trading positions, I would always look for the EOD charts.
SIR A HINDI ME NAHI MILEGA?
Deewakar, unfortunately, we don\’t have this in Hindi for now.
Dear sir,
When close > open = It is a Bullish candle. When close < open = It is a Bearish candle.
So, i think i got my answer now. For identifying whether the market is bullish or not, we had to calculate open minus close.
lol
Why \”lol\” isn\’t he right? Coz thats what i understood
He is absolutely correct.