
It’s the economy, stupid! Rupee is holding its ground
We love IndiaDataHub’s weekly newsletter, ‘This Week in Data’, which neatly wraps up all major macro data stories for the week. We love it so much, in fact, that we’ve taken it upon ourselves to create a simple, digestible version of their newsletter for those of you that don’t like econ-speak. Think of us as a cover band, reproducing their ideas in our own style. Attribute all insights, here, to IndiaDataHub. All mistakes, of course, are our own.
Prefer watching over reading? Here’s the video for you!
The rupee is holding strong, unlike what others think!
If you’ve been even casually following macro news, you’ve probably seen the headlines: “Rupee crosses 84 against the dollar for the first time!” Big deal, right? The rupee has hit a new “all-time low.” But wait… how can something be at its lowest when the number you’re seeing is the highest it’s ever been? Yeah, it sounds like an oxymoron—but it’s not.
Here’s the thing: when the rupee-dollar number on your screen goes up, it means you now need more rupees to buy a dollar. That’s because the value of the rupee has gone down. In simpler terms, the rupee has lost some of its purchasing power—it takes more rupees to exchange for just one dollar.
Think of it this way: there’s so much supply of rupees in the market relative to dollars that people are okay with paying more rupees to get their hands on those scarce dollars. And that’s what economists call rupee depreciation—when the rupee’s value weakens, and you need more of it to buy the same amount of foreign currency.
So, the rupee has depreciated to its lowest level ever—bad news, right? Well, not exactly.
Instead of just focusing on the absolute value, let’s zoom out and look at the long-term trend to understand what’s really happening.
If you plot the rupee against the dollar over time, you’d notice the line trending up towards the top-right corner of the chart. But if you zoom in a bit, you’ll see something interesting—the line is getting less squiggly, and is slowly flattening.
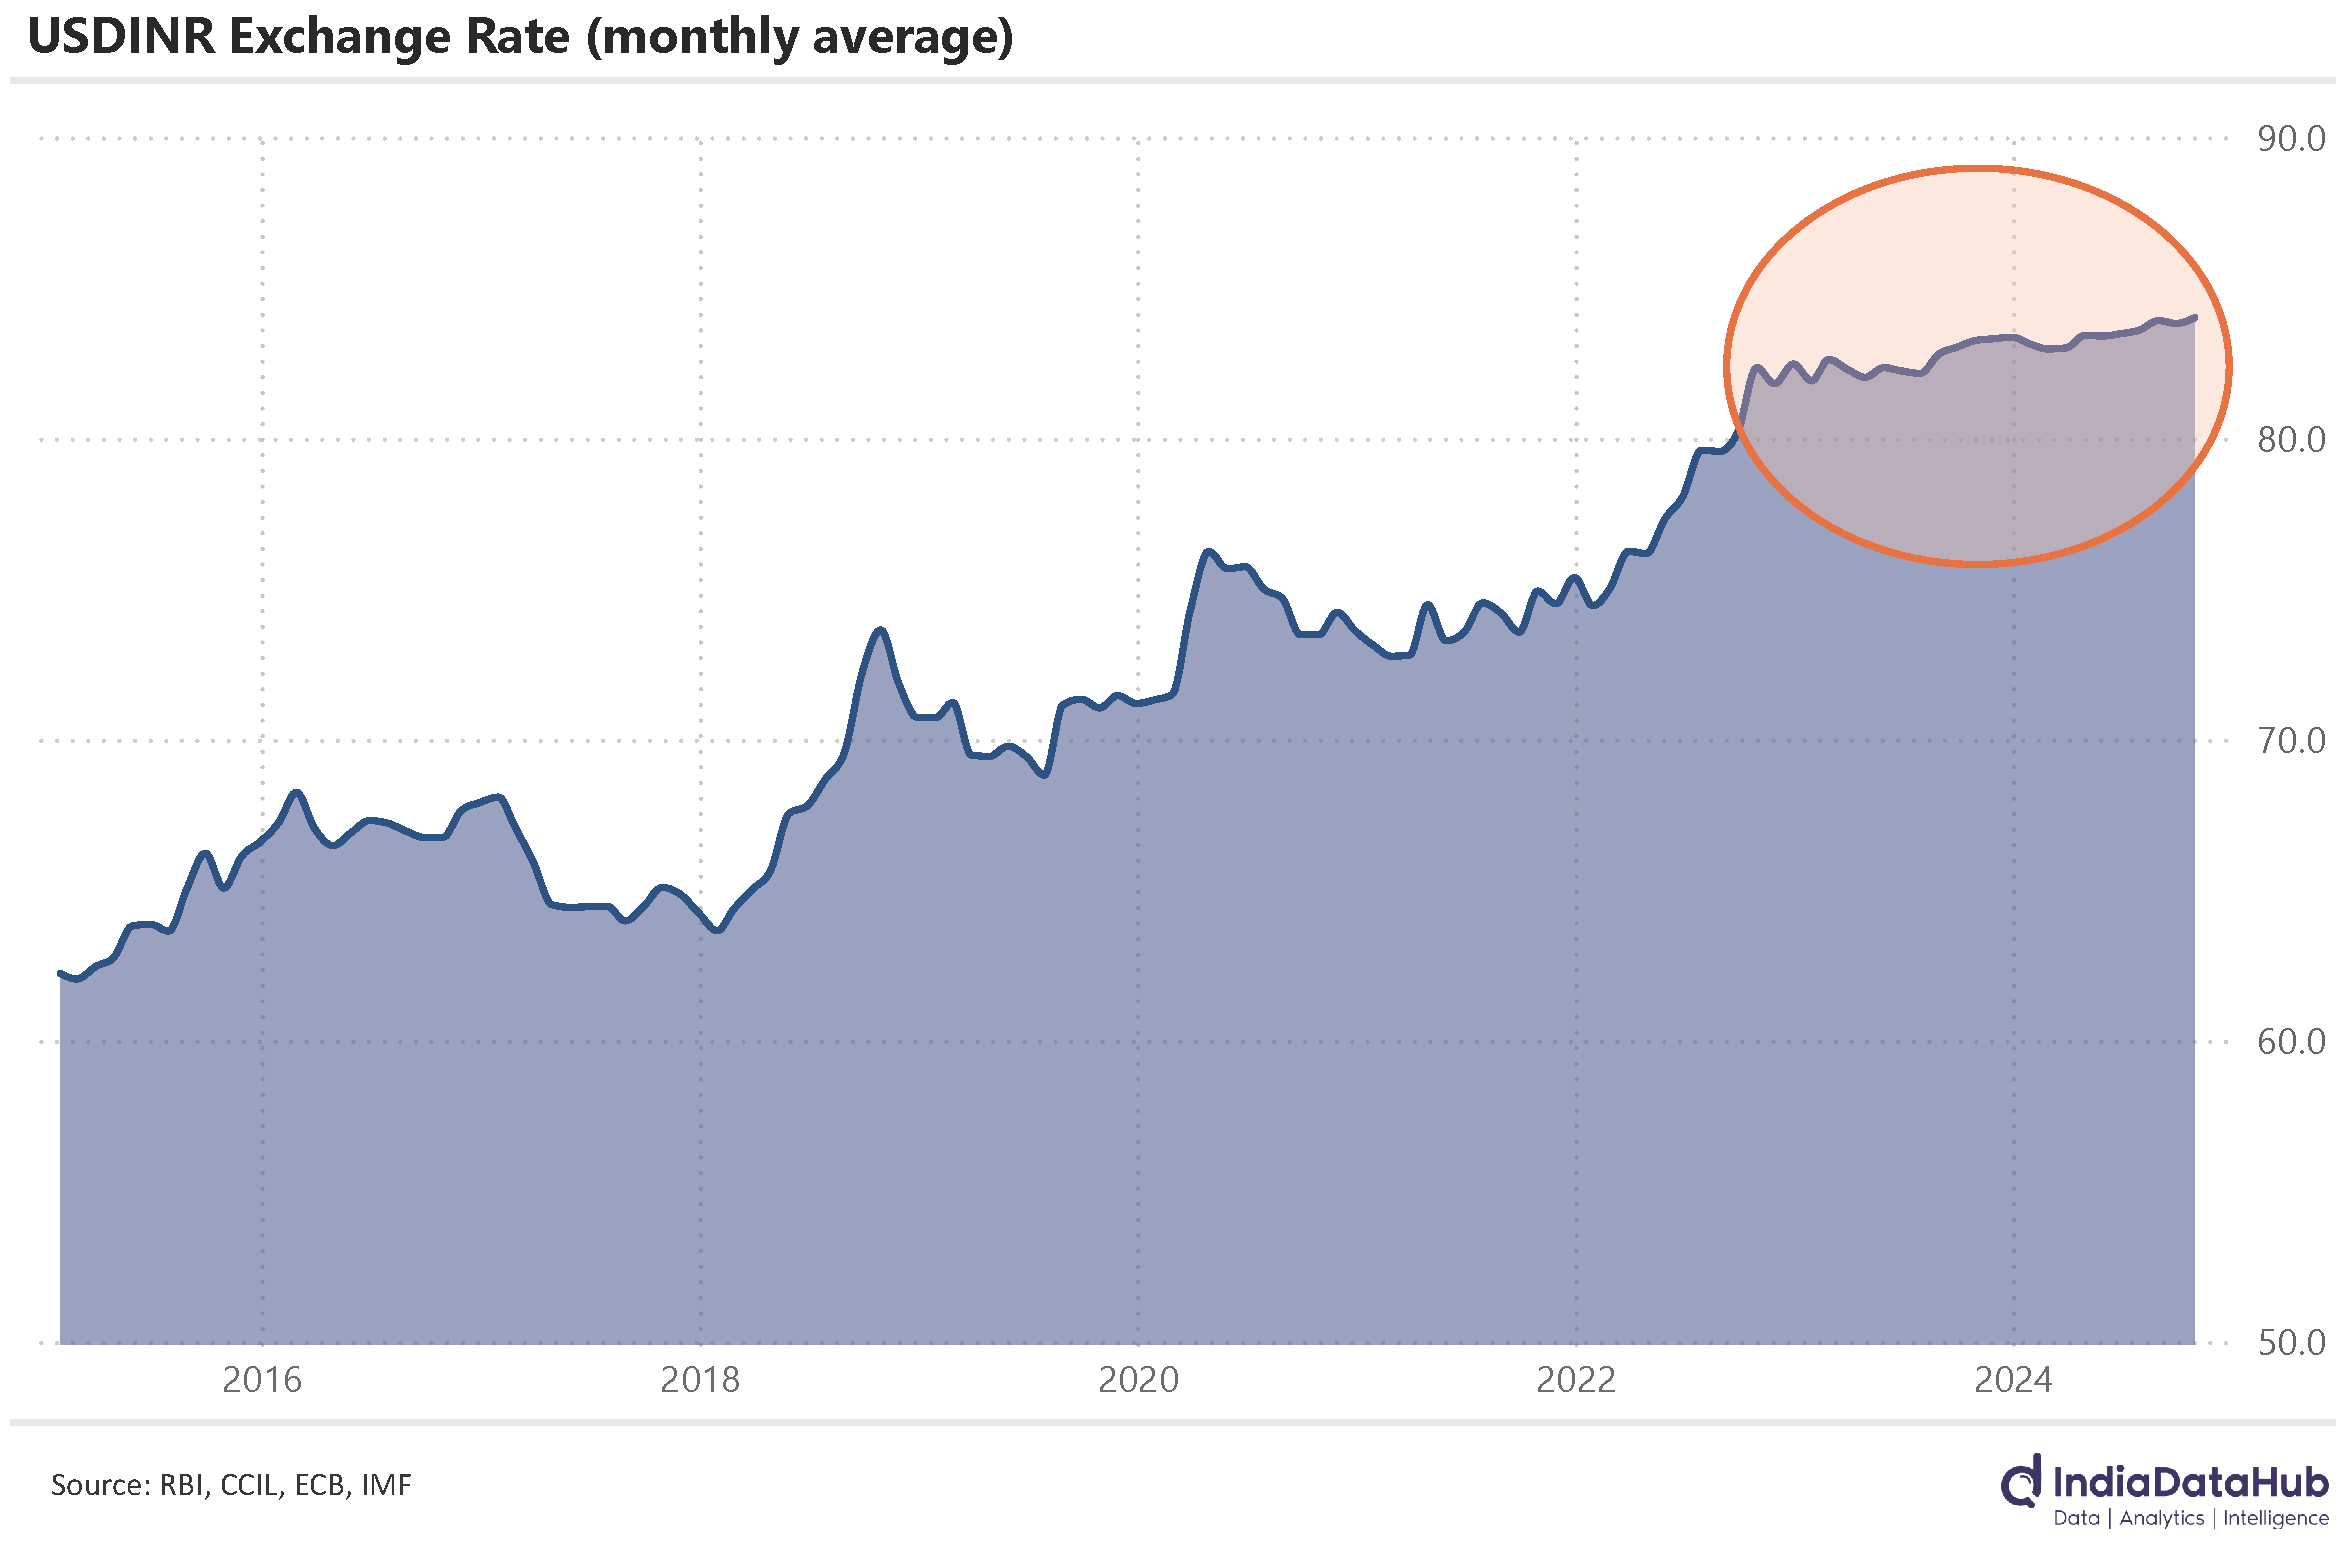
What does this mean? The rupee has actually become more stable against the dollar. It doesn’t swing wildly like it used to. Even with the recent spike above 84, the rupee has depreciated by less than 1% over the past year. On a two-year basis, the depreciation is under 2%.
Now, here’s why this is a big deal: over the past two decades, the median two-year depreciation of the rupee was around 7%.
This trend of reduced depreciation didn’t happen overnight. Back in January, Commerce and Industry Minister Piyush Goyal pointed out that the rupee’s depreciation rate, which used to hover between 3-3.5% annually, has now slowed to around 1.5% per year. He even suggested that by the end of the next decade, the rupee could depreciate by as little as 0.5-0.75% per year—and might even start appreciating against the dollar.
However, while the rupee is holding steady against the dollar, it’s struggling elsewhere. Over the past year, the India Data Hub INR Index—which measures the rupee’s performance against five major currencies (USD, EUR, GBP, JPY, and CNY)—has fallen by almost 3%.
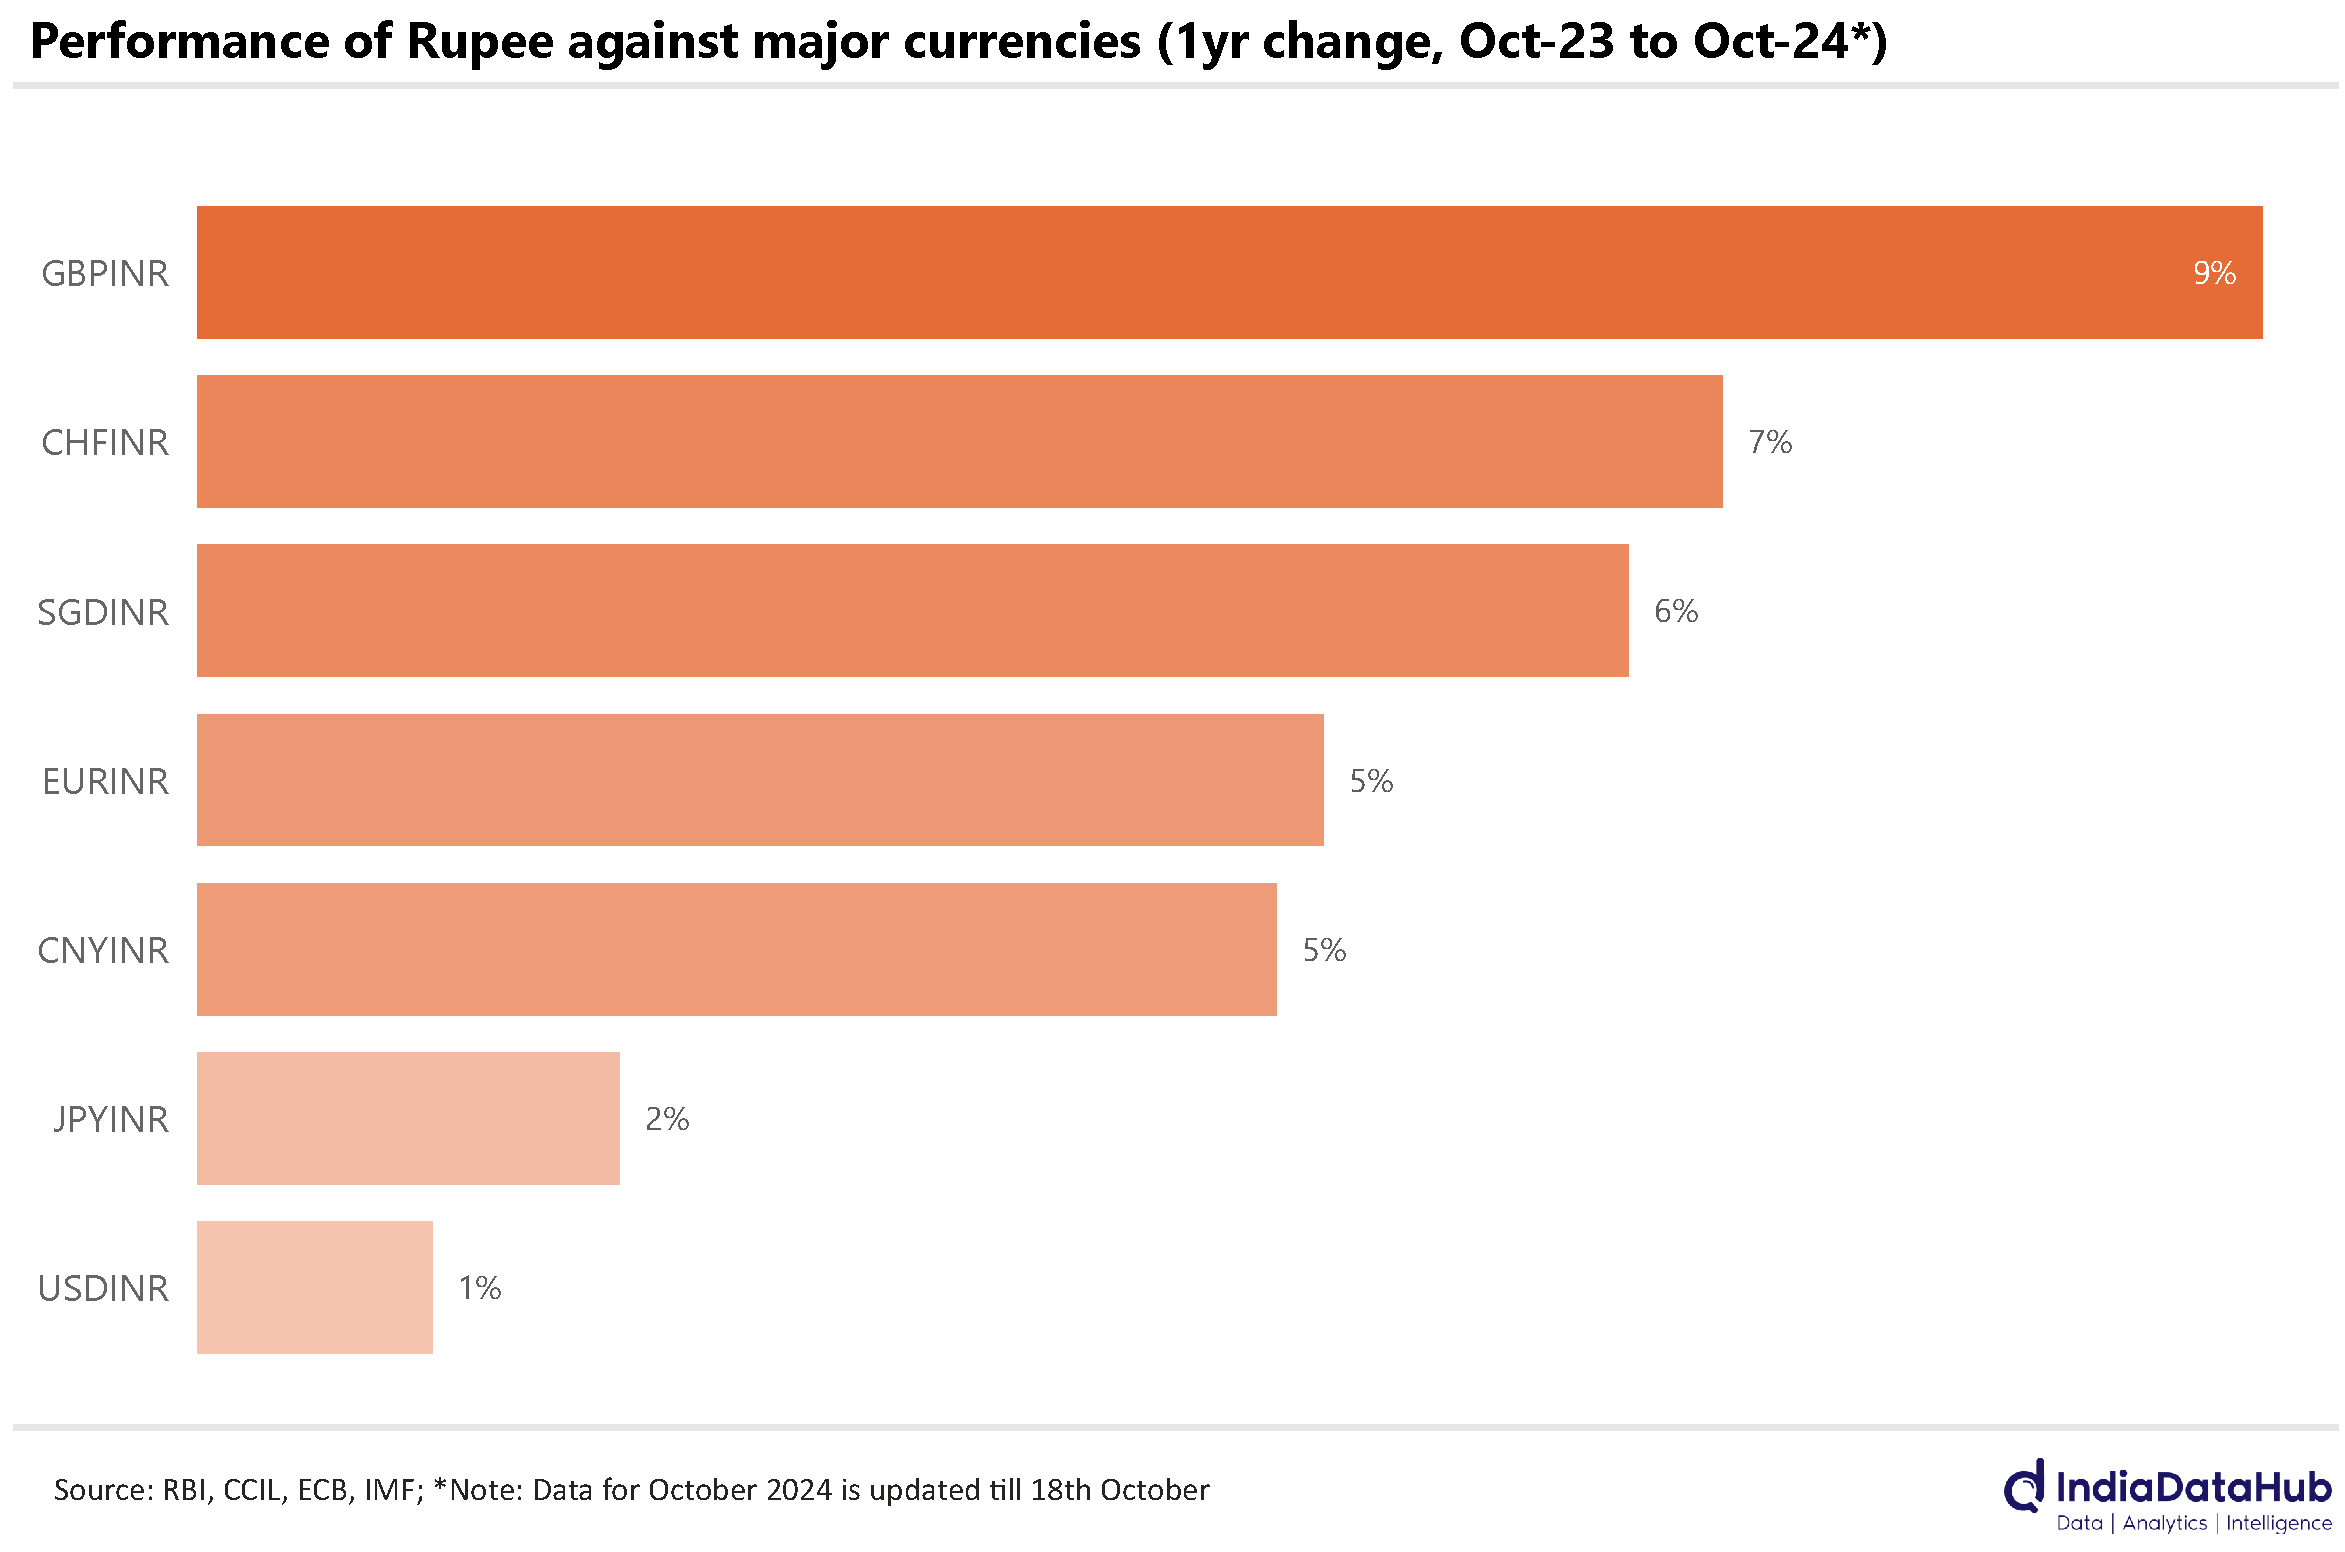
The real concern? A 5% depreciation against the Chinese yuan (CNY). This matters because when the rupee weakens against the yuan, imports from China become more expensive. And given that China is India’s largest trading partner, with a $85 billion trade deficit last year, a weaker rupee could make imported goods more costly, fueling inflation.
What’s up? Inflation! Or is it?
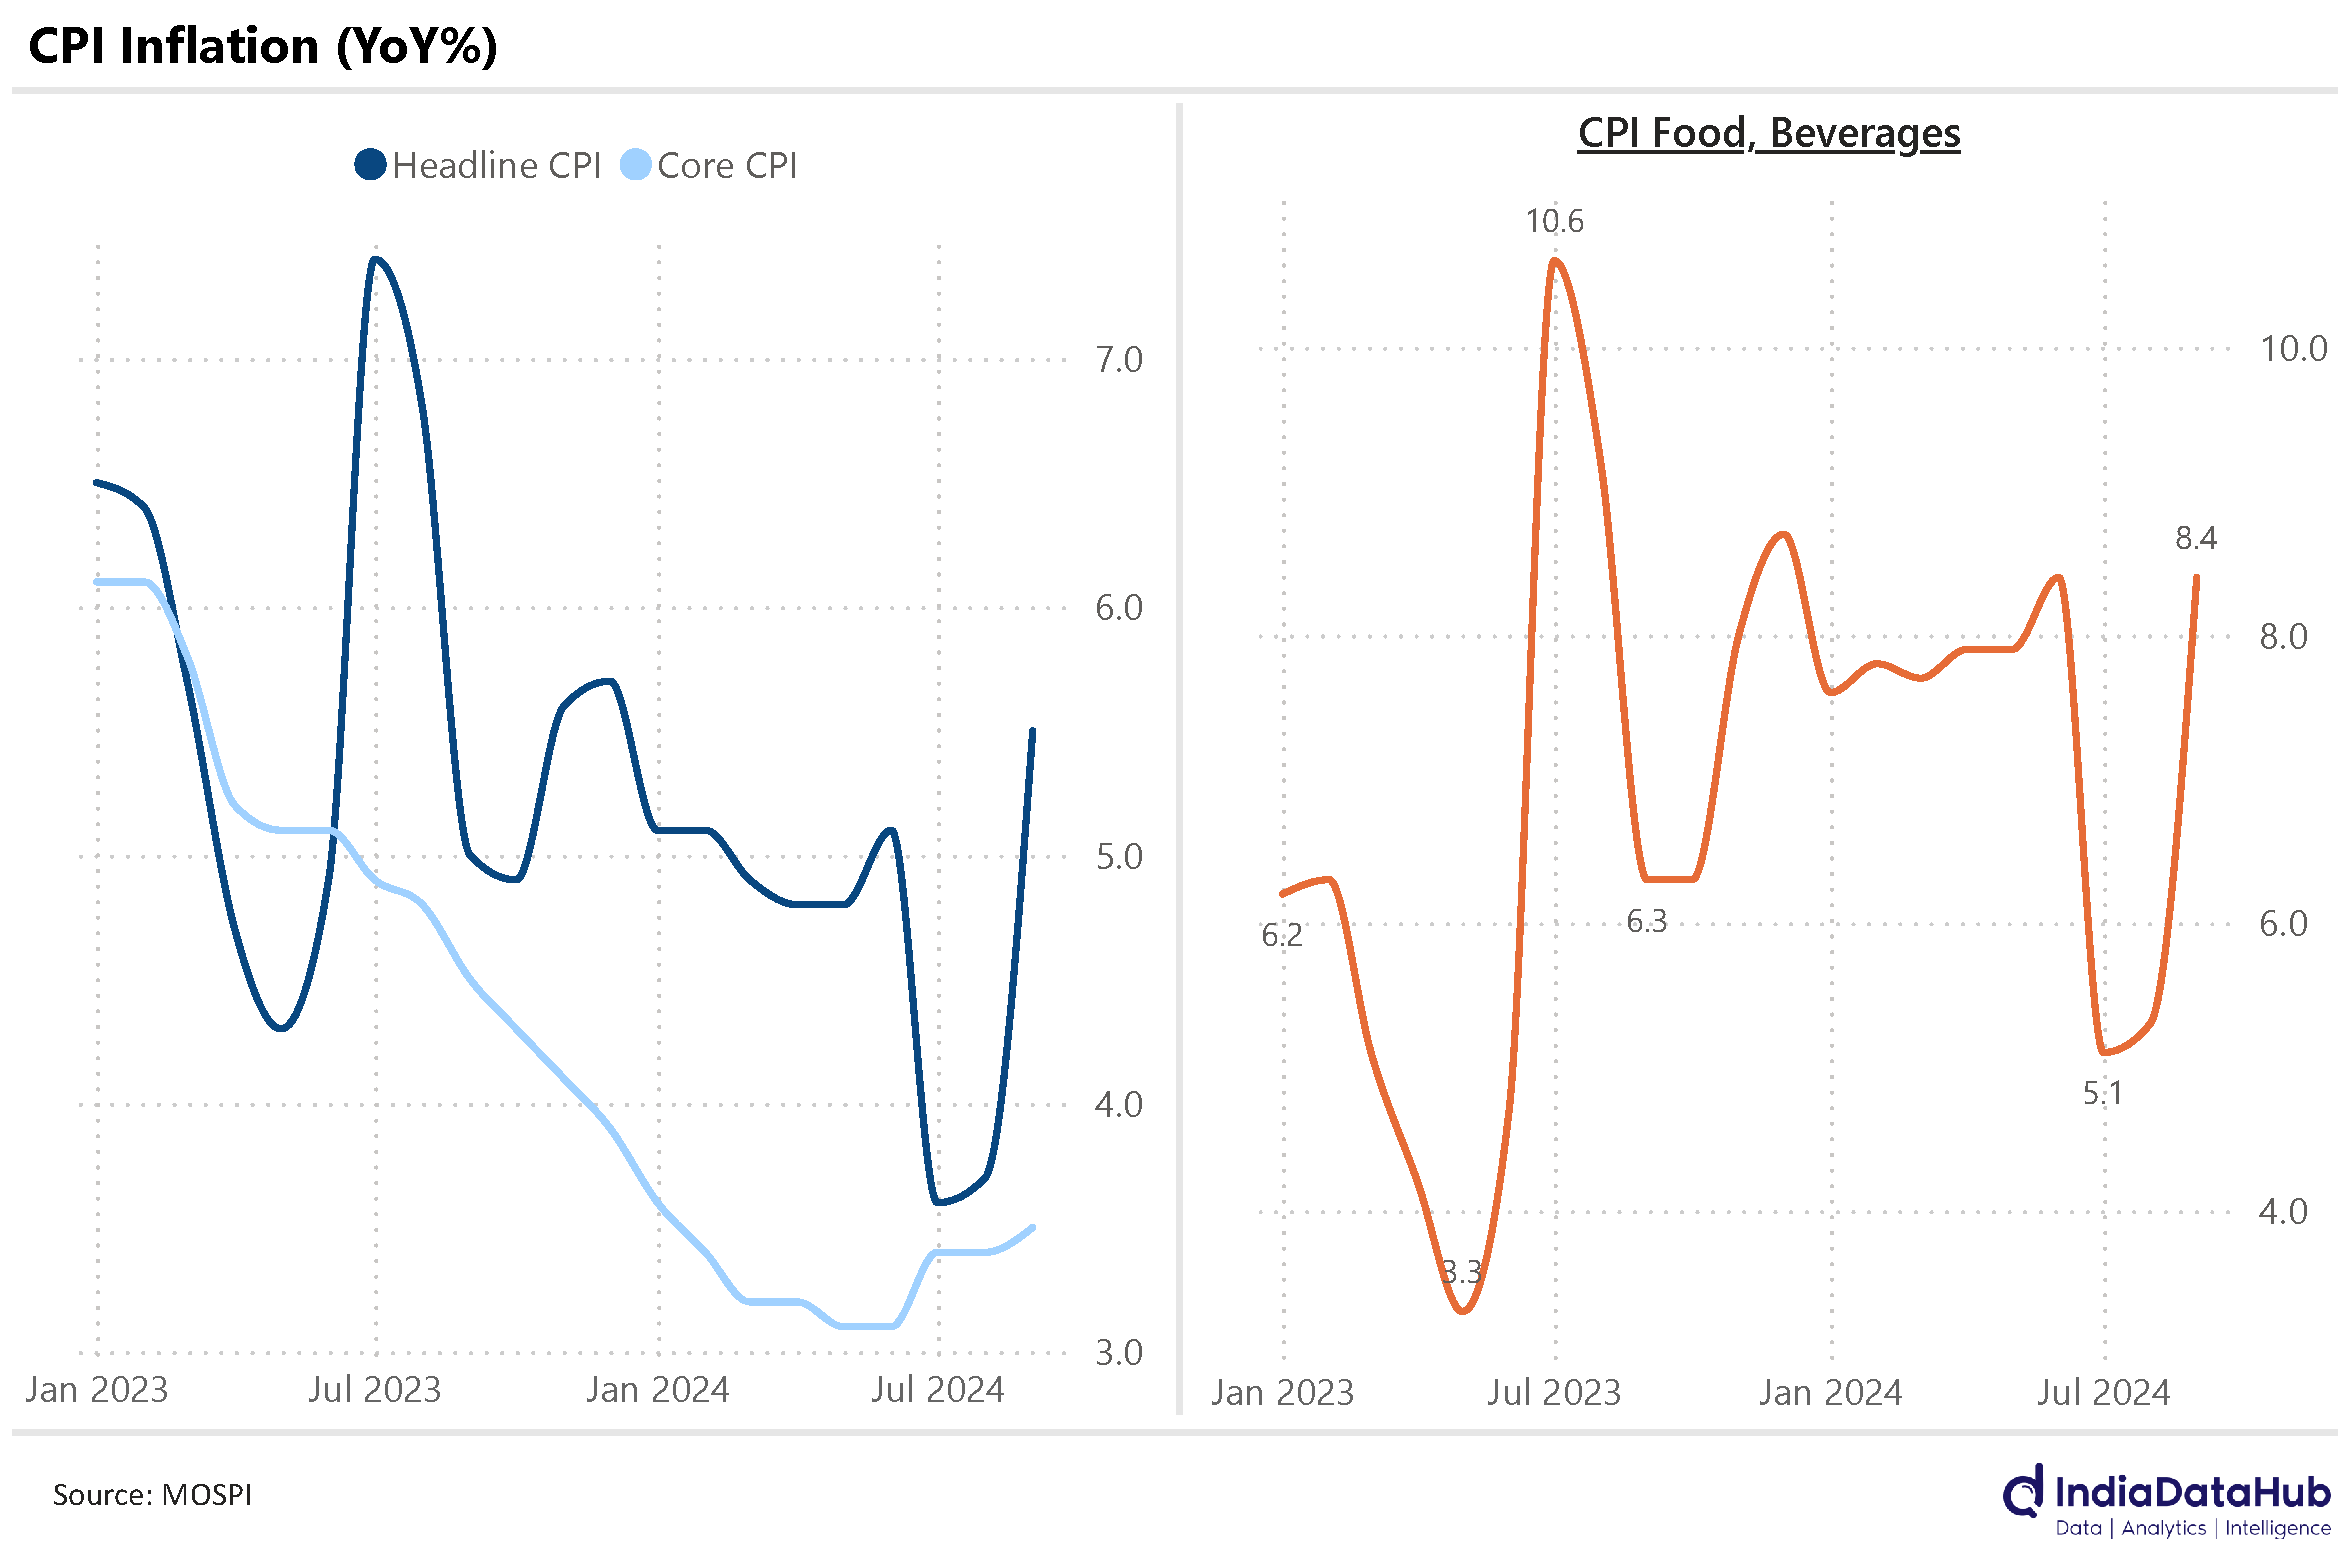
CPI inflation jumped from 3.65% in August to 5.5% in September, with food inflation taking most of the blame. While part of this spike can be attributed to the base effect, industry veterans and government officials point to a sharp increase in fresh vegetable prices as the main culprit. Heavy rains and supply disruptions drove the prices of essentials like tomatoes and onions up by 35.9% compared to the previous month.
As a result, food inflation went from 5.3% in August to 8.4% in September. Meanwhile, core CPI—which excludes food prices—remained largely stable. However, with the rupee weakening, particularly against the Chinese yuan (as discussed earlier), there’s growing concern that core inflation could gradually move higher in the coming months.
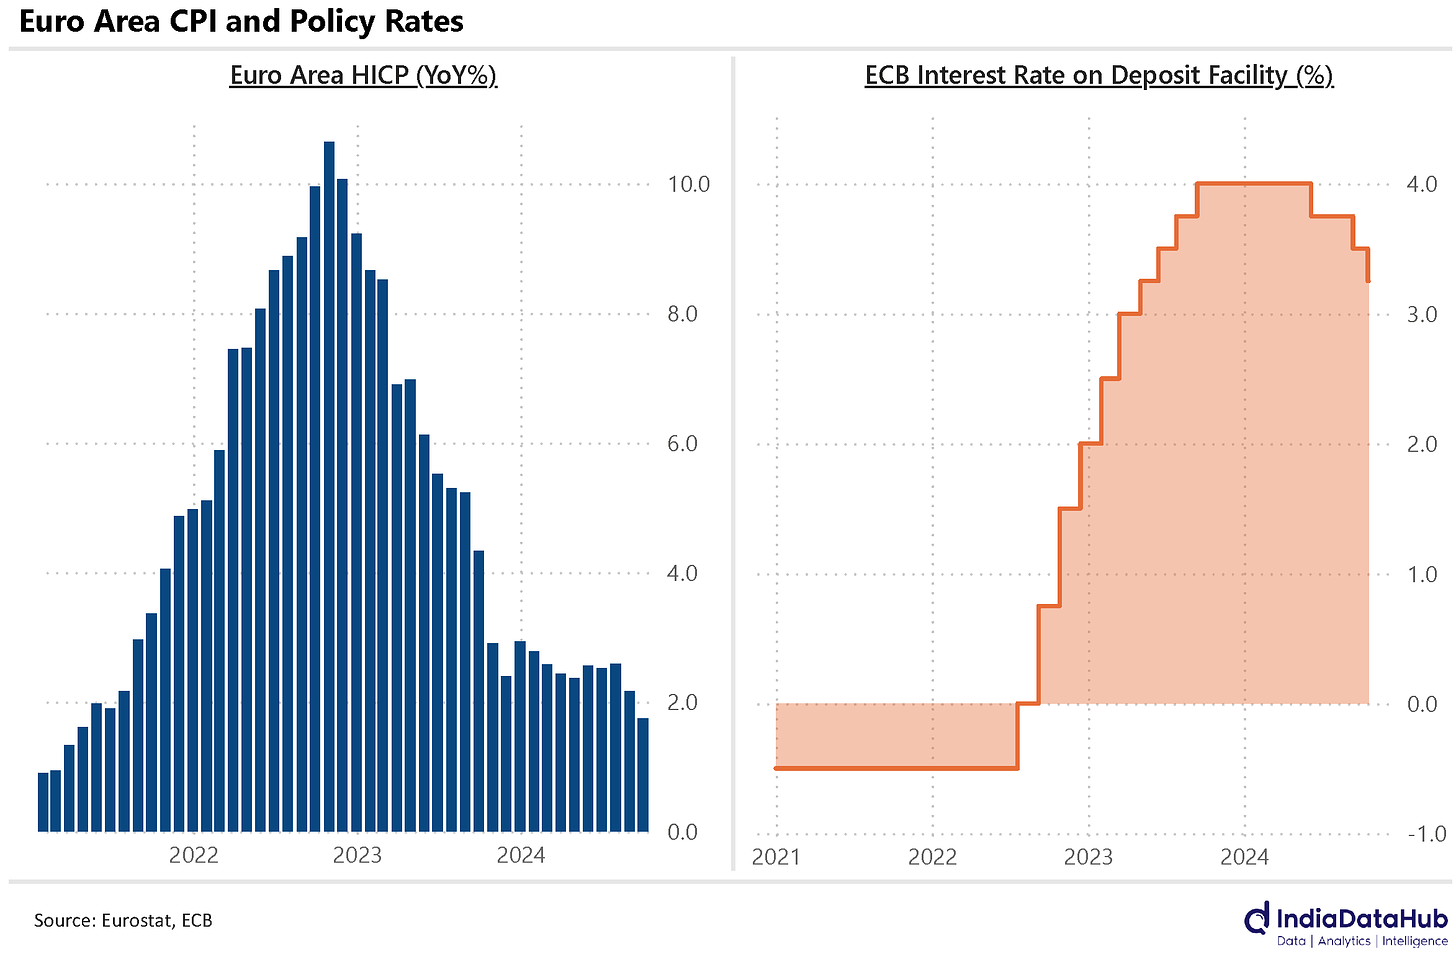
The inflation story abroad isn’t very different. Globally, inflation has been trending downward in recent months. In the Euro Area, HICP inflation—the eurozone’s version of CPI—fell to a 41-month low of 1.7% in September, dipping below the European Central Bank’s (ECB) 2% medium-term target. In response, the ECB cut its policy rate by 25 basis points.
The UK also saw inflation ease, dropping to 1.7% in September from 2.2% in August—its lowest level since April 2021. Similarly, Japan and China reported a slowdown in inflation during September. As inflation cools worldwide, central banks are adjusting their interest rates accordingly—except India.
The RBI Chief remains cautious, stating that cutting rates now would be premature. Although inflation is expected to ease in the coming months, the central bank will only consider rate cuts once it is confident that inflation will stay within the target range and not just dip temporarily. For now, the RBI is committed to a wait-and-watch strategy, avoiding of any preemptive action.
Trade numbers converged this month
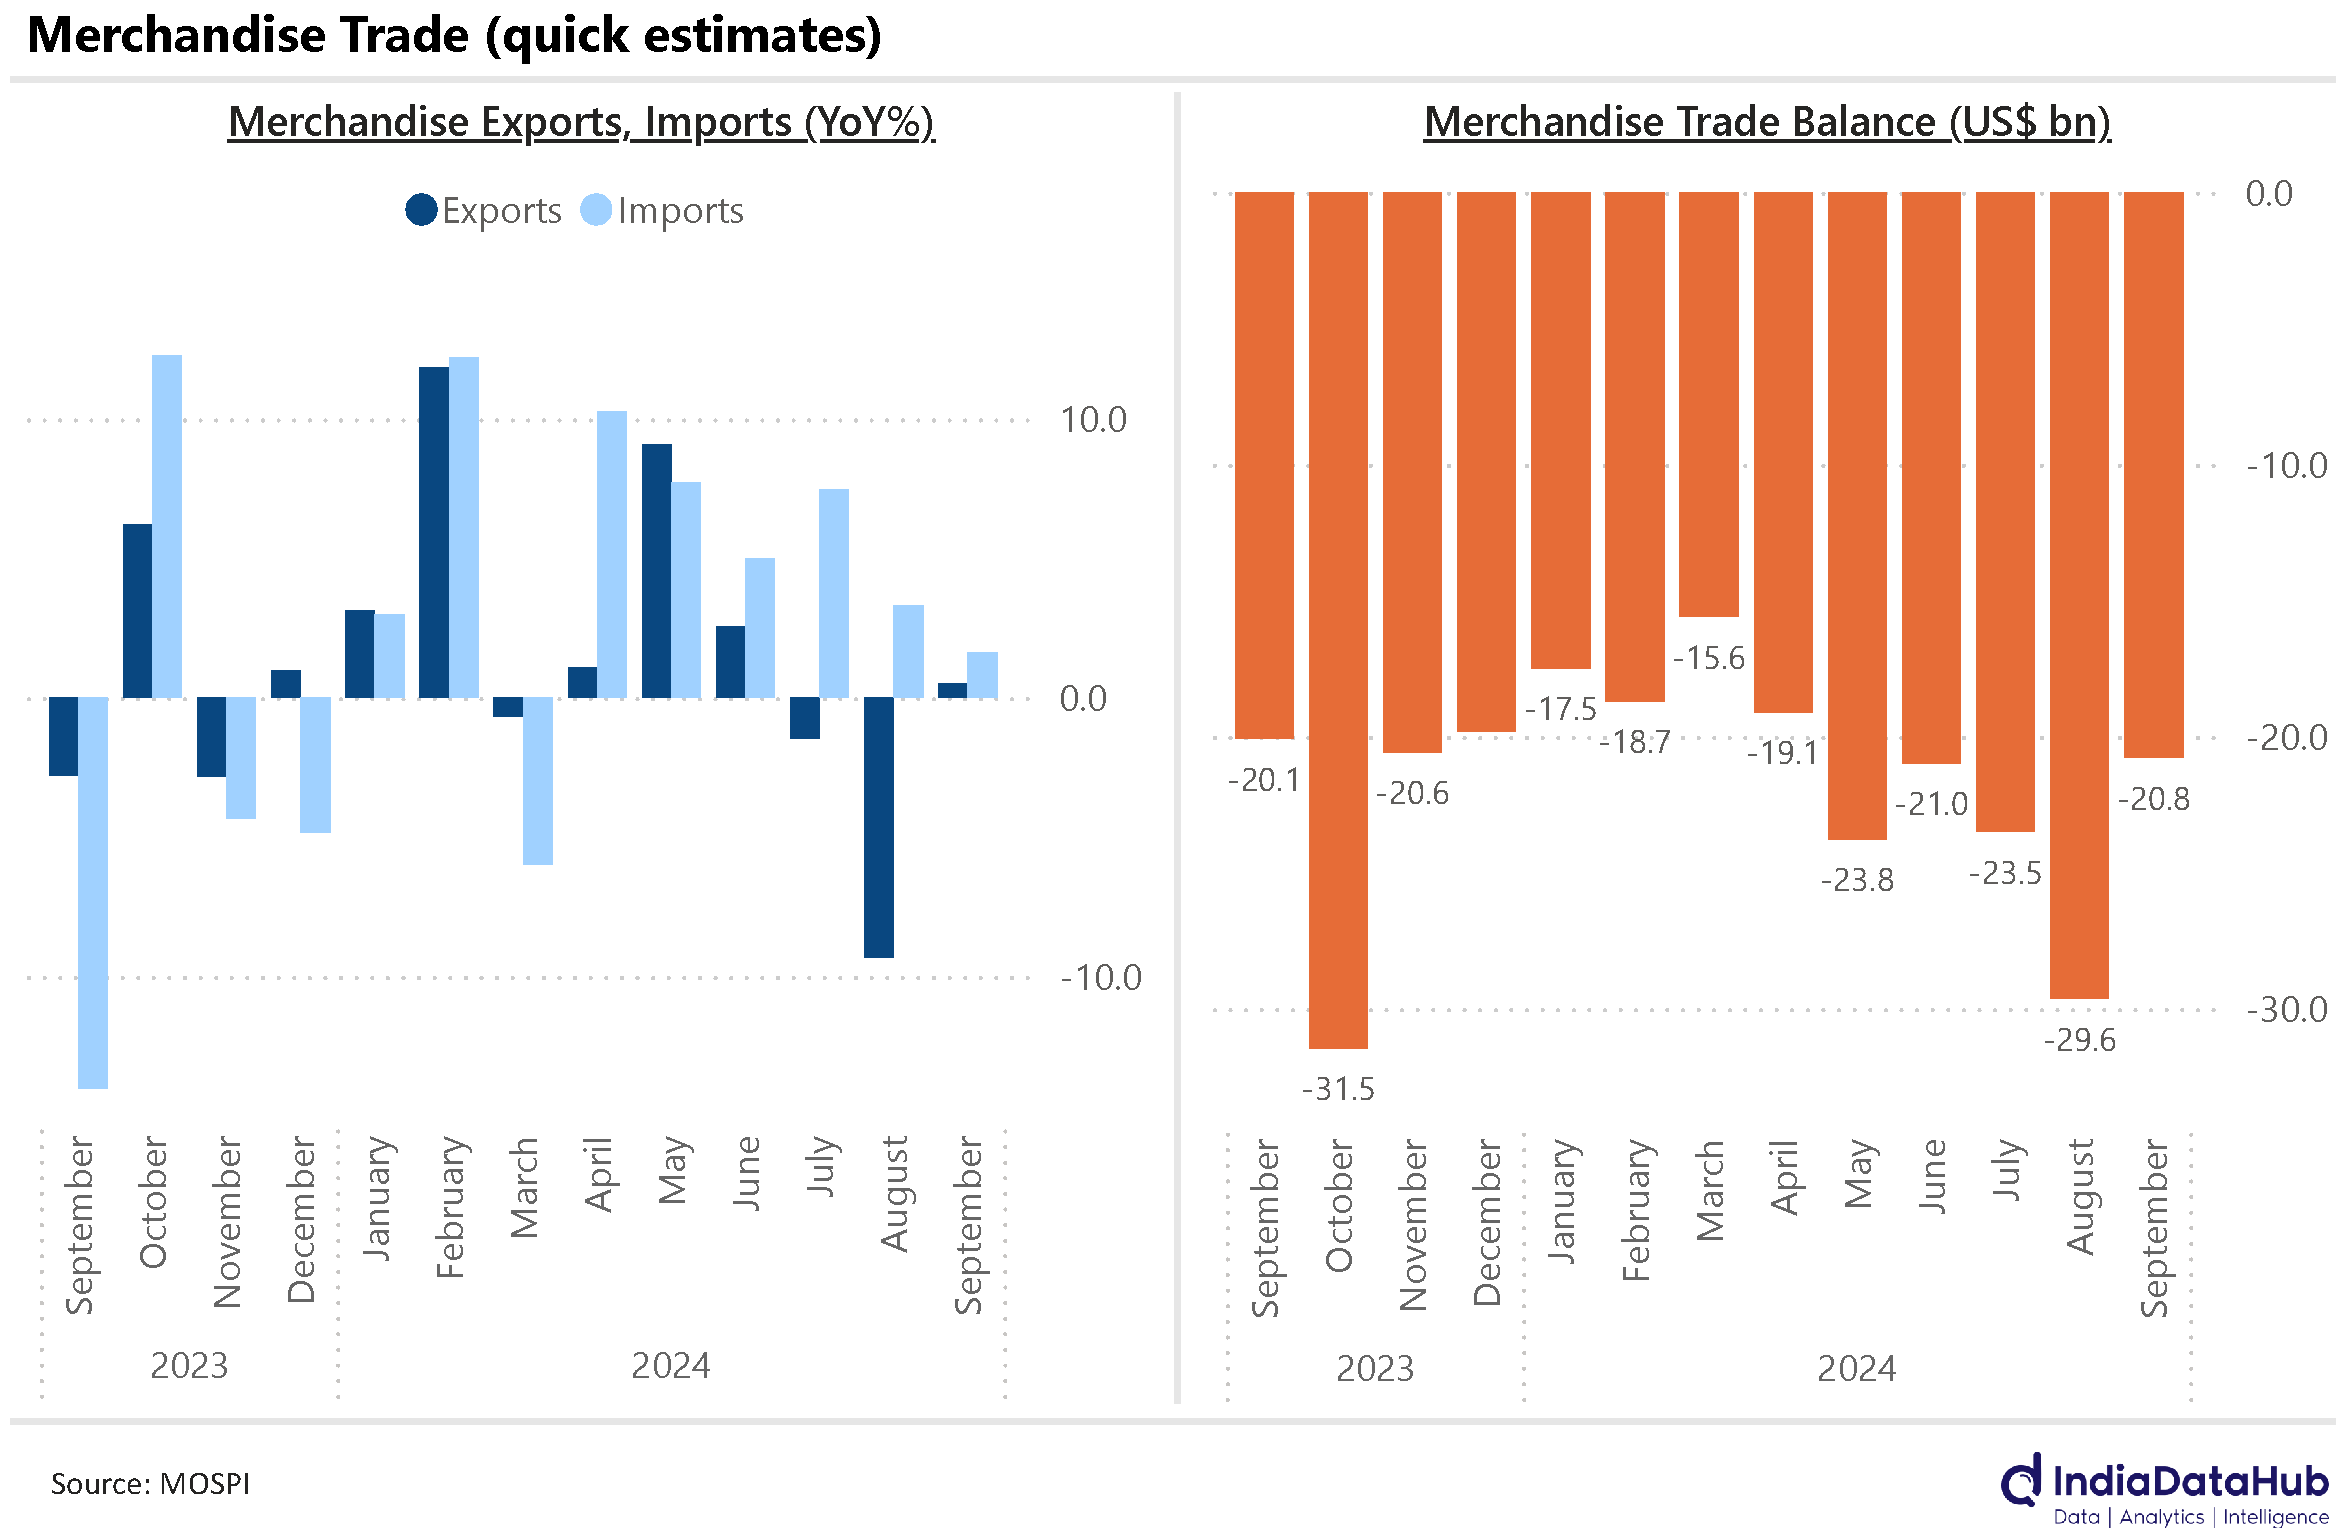
India’s goods trade is painting an interesting picture. Import growth has been slowing for the third month in a row—dropping from 7.4% in July to 3.3% in August, and now just 1.6% in September. Exports, too, are sluggish, increasing by only 0.5% in September. However, this is an improvement from the 9% drop in August and the 1.5% decline in July.
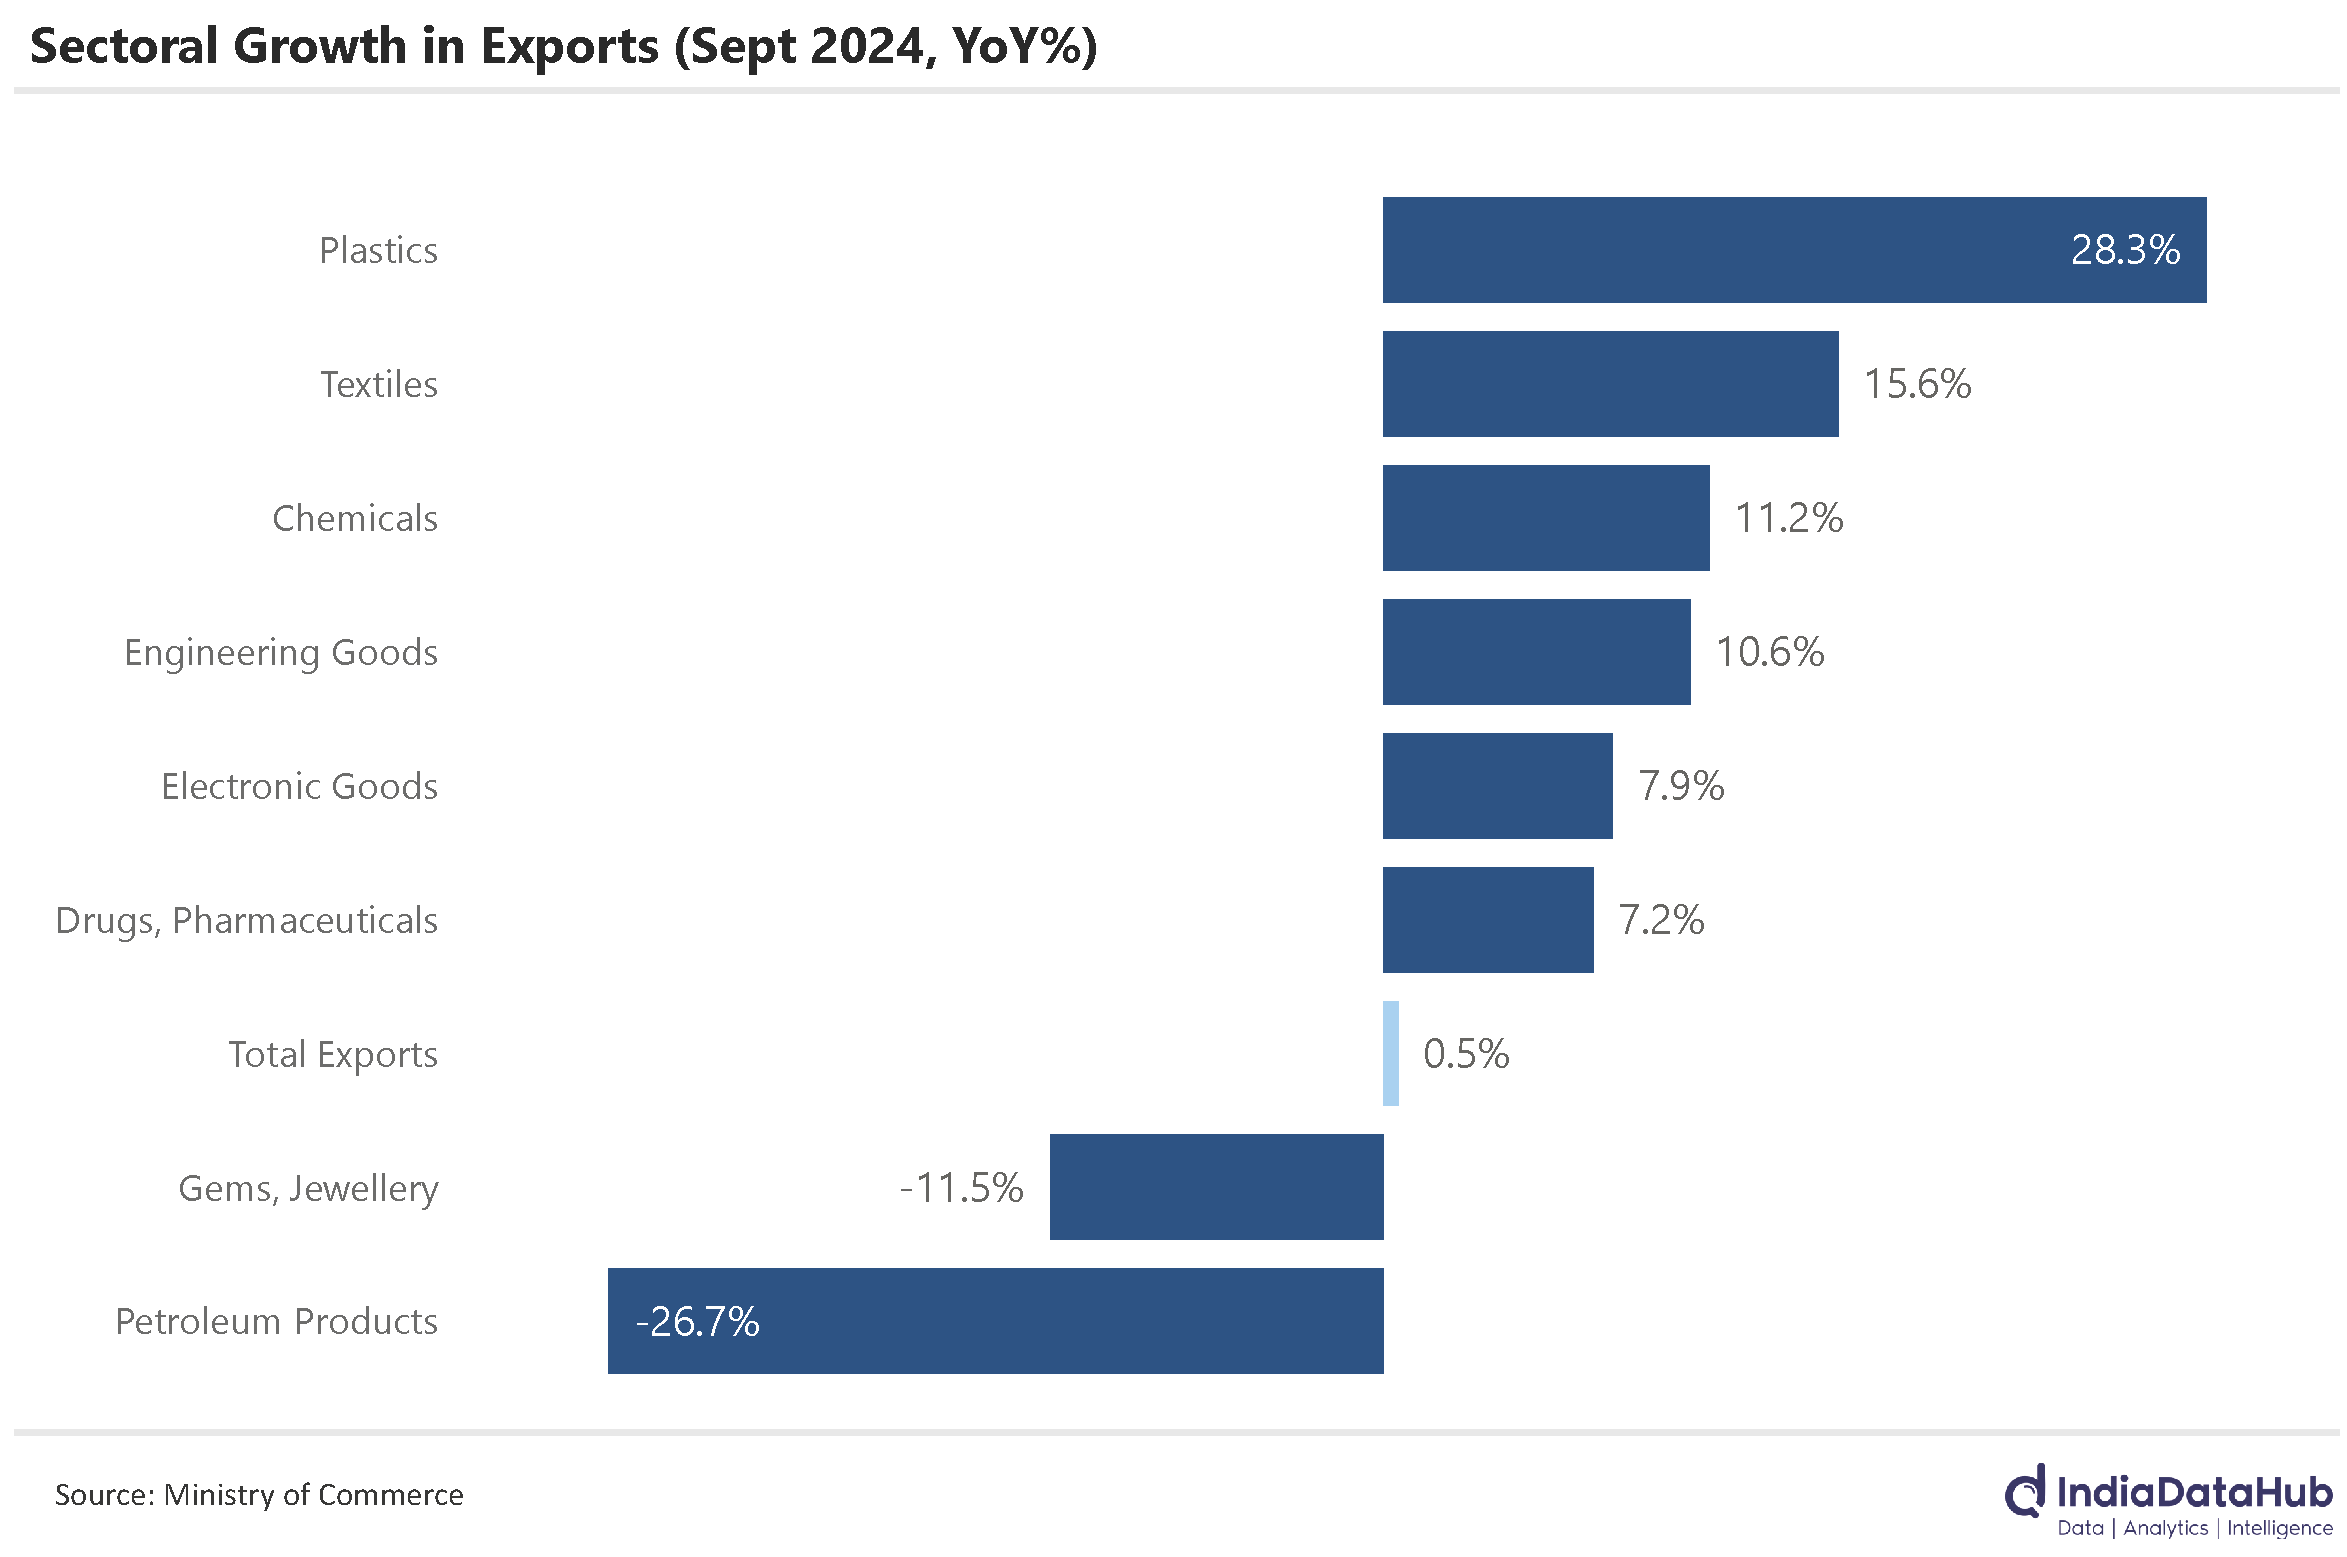
A key factor behind the recent moderation in exports is the sharp fall in petroleum exports, which dropped 25% YoY in September. Interestingly, if we exclude petroleum exports, total exports actually grew by 7%, highlighting just how significant petroleum products are to India’s overall export basket.
So, if petroleum is dragging down growth, what’s driving exports?
For the past few years, electronic goods have been the fastest-growing export category. However, even this segment has lost some steam, with growth slowing to 8% YoY in September, following 7% growth in August. Meanwhile, exports of engineering goods, textiles, plastics, and chemicals grew at a faster pace than electronics in September.
The combination of slower import growth and a modest recovery in exports has shrunk the trade deficit significantly. From $30 billion in August, it fell by over 30% to $21 billion in September.
An update on China
China, once one of the world’s fastest-growing economies, is now facing tough times, and it seems like its days of rapid expansion are behind it. The GDP numbers reflect this shift, with the economy growing by 4.6% YoY in the September quarter—a five-quarter low.
For perspective, from 1992 to 2019, China’s economy consistently grew at an average rate of easily over 6% per year. But since then, and particularly after the disruptions caused by COVID-19, the Chinese economy has been hit by one setback after another. The latest—and perhaps most damaging—blow is the ongoing slump in the real estate sector, which has become the biggest drag on growth.
The real estate sector has now contracted for three consecutive quarters, with everything from sales to new construction on the decline and inventories piling up. Given that the sector accounts for nearly 20% of China’s economic activity, its downturn is having a significant impact on the country’s overall GDP growth.

That’s all for this week, folks!

Nice initiative. Thanks 🙏
Glad you liked it 🙂