
How Indian markets went from backwater to mainstream
In January 2025, I wrote about the dramatic transformation of Indian capital markets. The basic idea was simple: there are two distinct phases of Indian markets—the pre-COVID backwater and the post-COVID explosion.
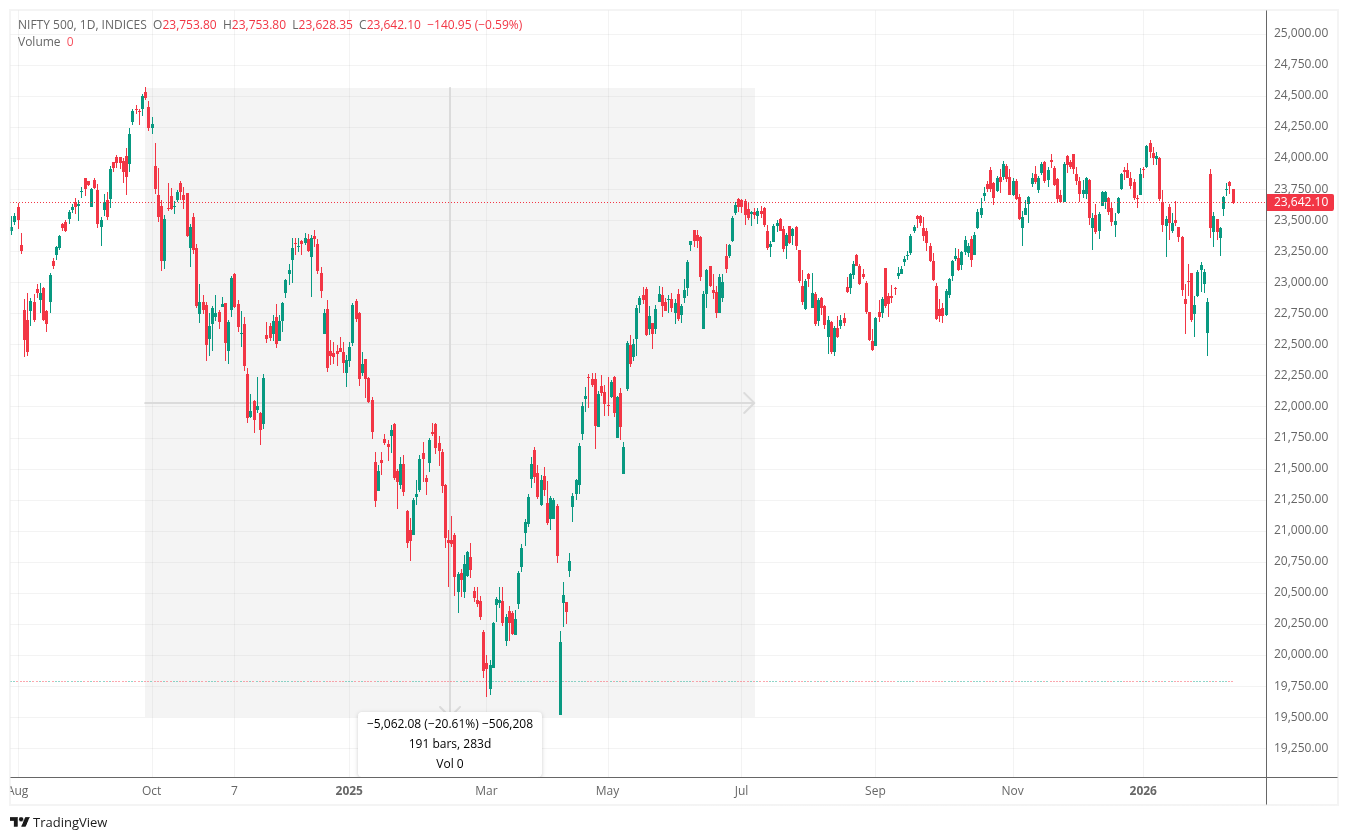
The timing was impeccable in the worst way possible. I almost called the top. From around September 2024, we entered a mini-bear phase. Volumes normalized. The tourists left. A lot of the speculative froth that I’d documented vanished as markets corrected and traded sideways.
The recent Economic Survey had two charts that reminded me of that post, and I thought I’d write a small update.
When I joined Zerodha in 2017, calling the stock markets a “backwater” would’ve been generous. There were barely 50 lakh active traders. Maybe 2-3 crore unique investors total. Account opening involved signing 30-40 page documents, sending photocopies, and dealing with rejections—it was prehistoric.
Then the digital rails fell into place. Aadhaar, e-sign, DigiLocker, and later TPIN and DDPI made onboarding friction collapse. That set the stage. COVID provided the spark. People stuck at home, bored, looking for thrills. The stock market became the go-to place for cheap thrills.
In five or six years, India went from a couple of crore unique investors to around 11 crore. “Stocks” stopped being niche and entered everyday conversation, memes, and coffee-shop chatter. I lived through this from inside the industry, and it was wild.
Then came the normalization. Since September 2024, the mini-bear phase has kicked in. Volumes fell from their peaks. The speculative tourists packed up and left. A lot of the stupidity that comes with bull markets cooled off.
This is where the Economic Survey charts come in.
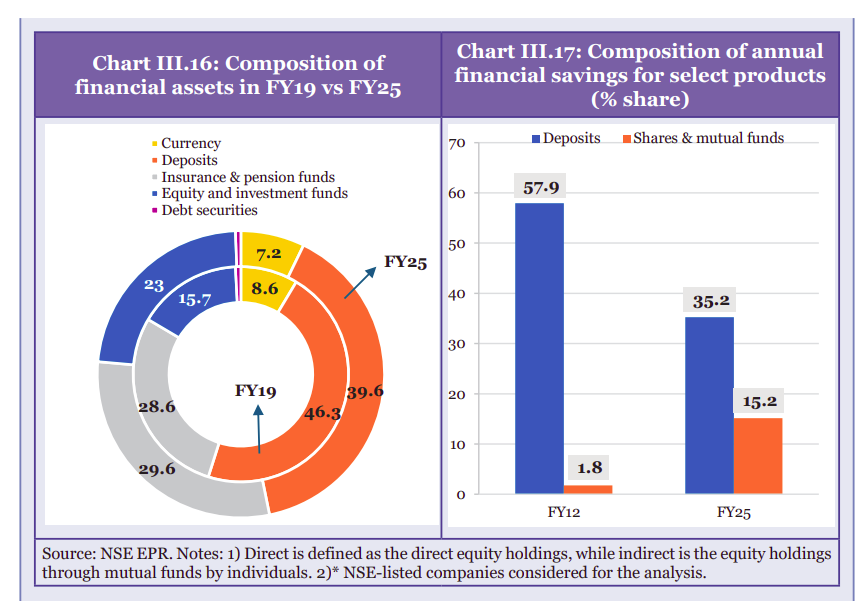
The first chart shows the composition of financial assets and financial savings. Between FY19 and FY25, there’s been a visible shift. Deposits as a share of financial savings have declined. Meanwhile, shares and mutual funds have grown from barely 2% of savings in FY12 to over 15% by FY25.
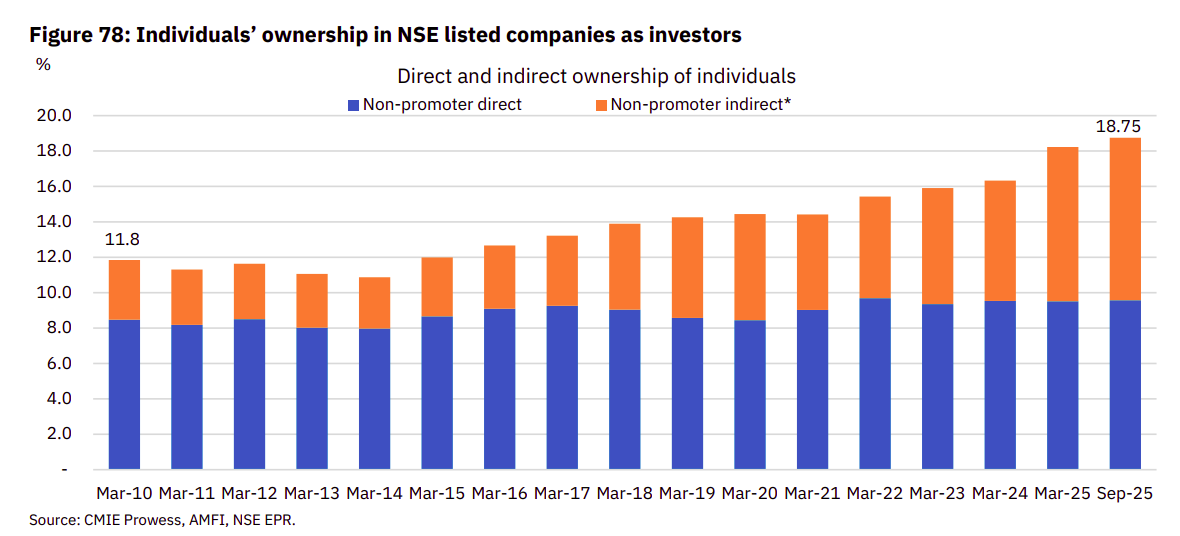
The second chart is even more striking. Ownership trends show that indirect equity holdings through mutual funds have grown at a CAGR of 27.3% since FY19, compared to 20.3% for direct holdings.
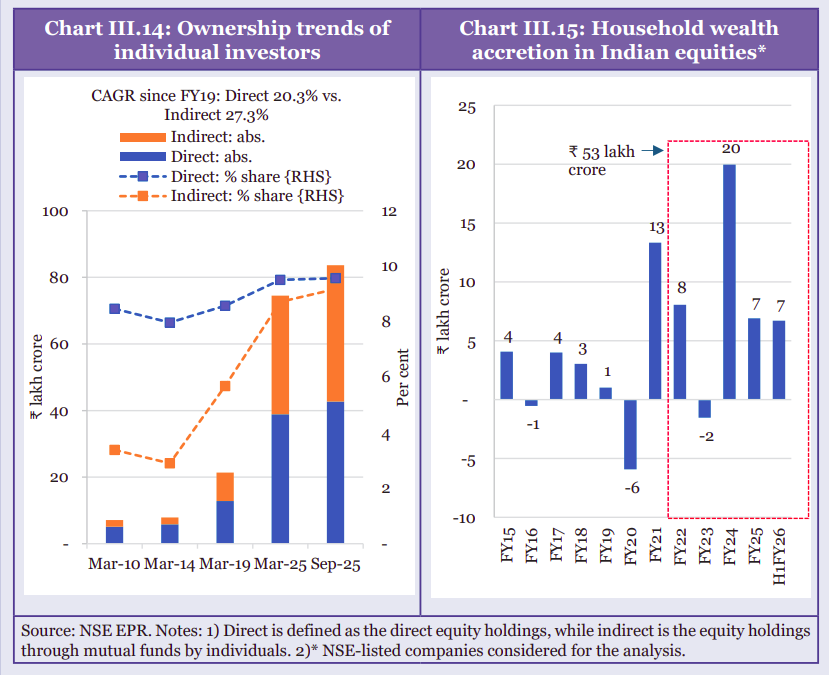
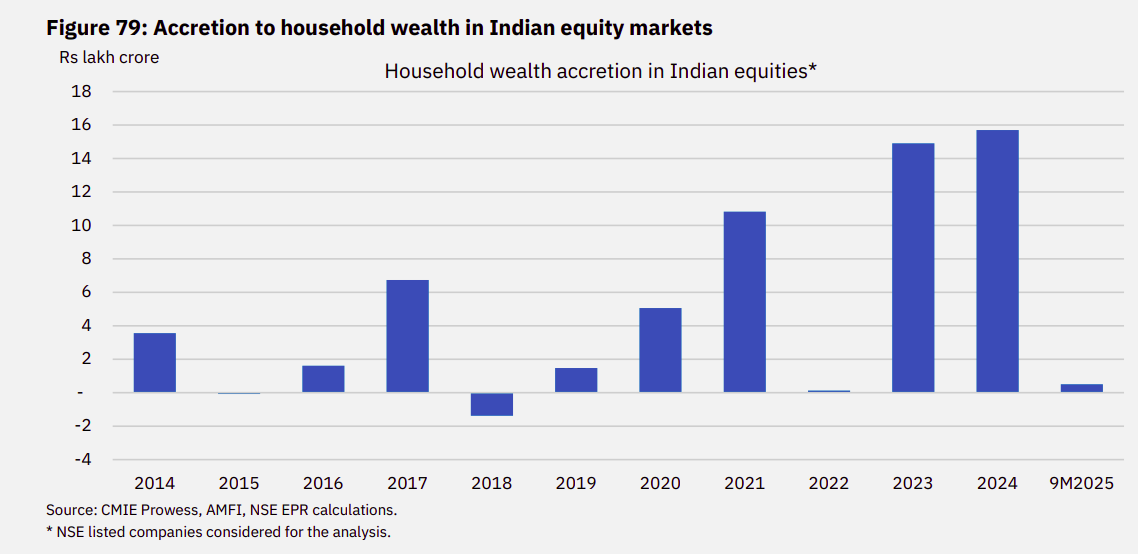
As for household wealth accretion in equities, the survey pegs it at roughly ₹53 lakh crore over the period it measures.
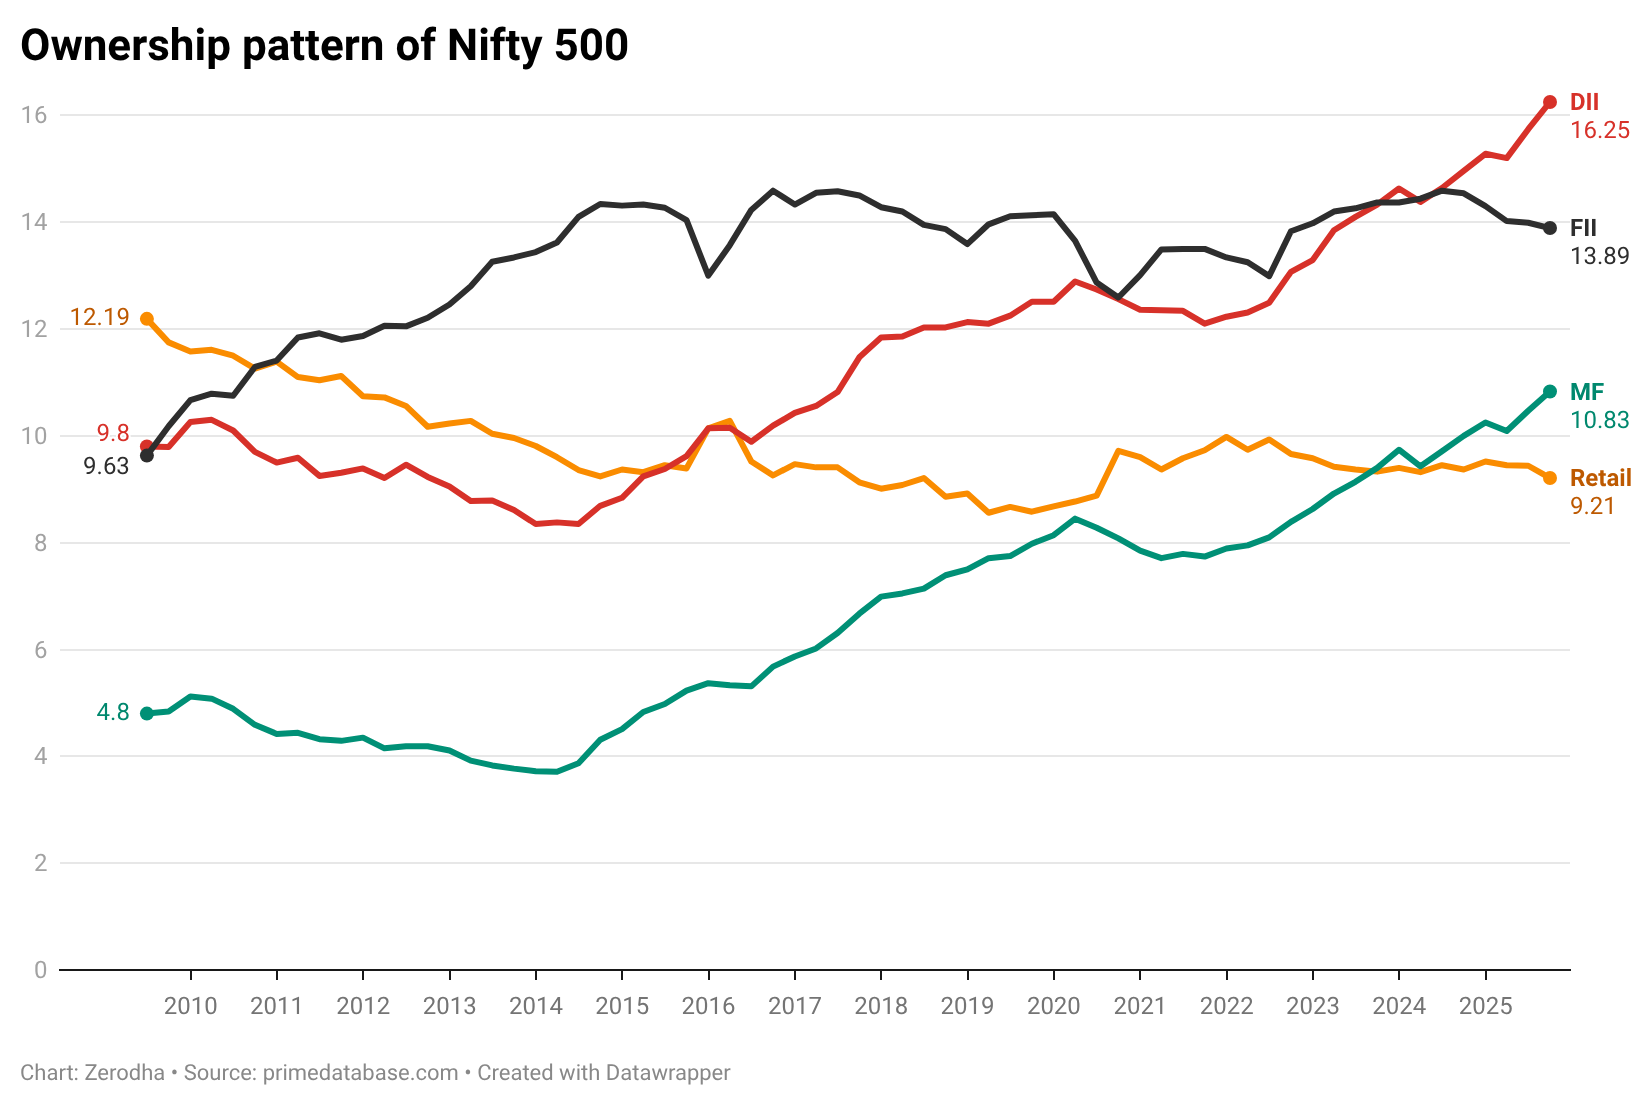
The big story isn’t retail stock-picking. It’s indirect ownership via mutual funds. Household participation has become meaningfully institutionalized. Mutual fund ownership of Indian equities has risen from low single digits to around 10%. That’s a structural shift, not just a bull market artifact. This also shows up in the ownership pattern of Indian equities. DIIs now hold more than FIIs.
The “Exit” Debate
One narrative I keep hearing: “All Indian households have done is give foreign investors an exit.”
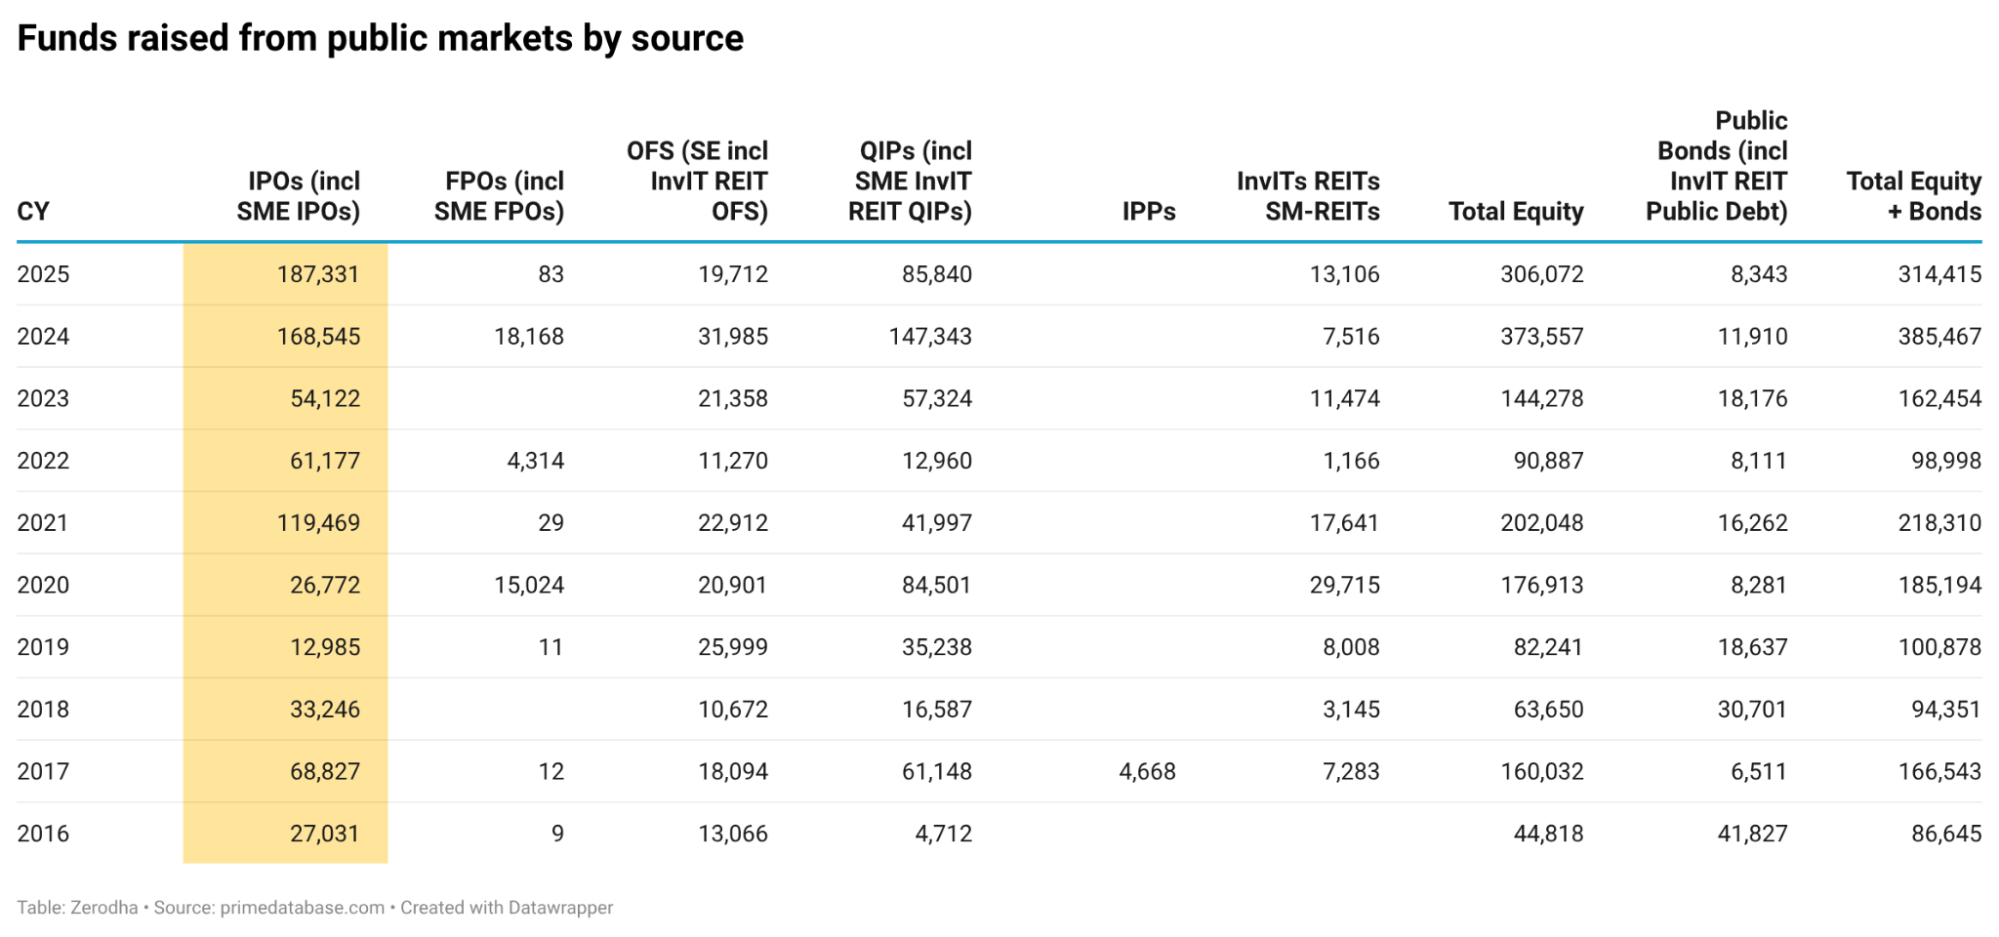
I don’t even understand what this means. That’s how markets work. Liquidity is the entire point. IPOs and secondaries exist so early risk capital can be rewarded and recycled. Last year, companies raised something like ₹1.87 lakh crore through IPOs, including SME listings. FY25 is on track to potentially cross ₹3 lakh crore in total equity fundraising across all instruments.
You can debate valuations. You can debate whether retail should chase IPO listing gains. But “giving exits” isn’t some moral failure. VCs and PEs took risks on Indian companies early, and they deserve to get paid. That’s how capital formation works.
Zooming Out
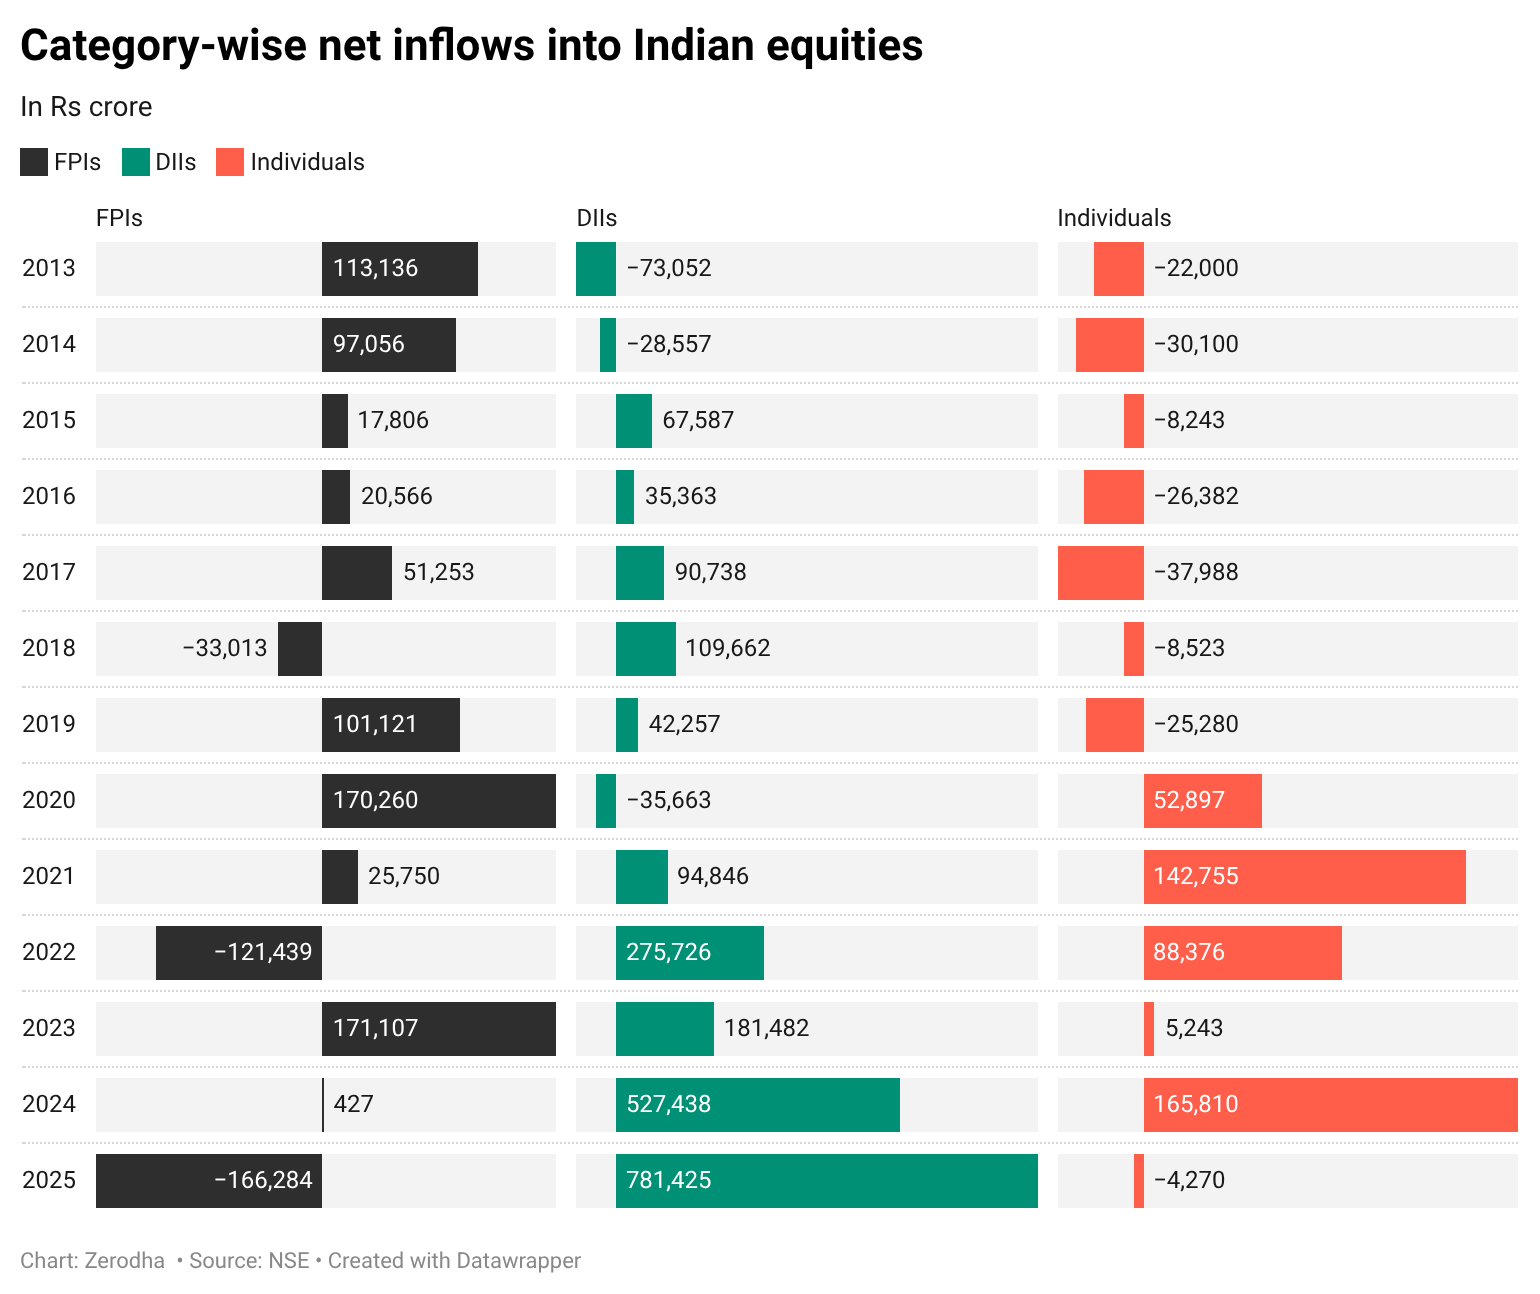
This doesn’t mean there are no challenges. The corporate bond markets are still underdeveloped. Direct equity participation has more or less been flat. Historically, direct individual equity flows were negative for years and turned positive post-COVID, and they seem to be reversing again.
But zoom out. If you told me in 2018-19 that we’d have 11 crore unique investors in a handful of years, I’d have guessed it would take 10-20 years. We got there far faster.
And context matters. This isn’t some blanket “FDs bad, gold bad, real estate bad” take. These are good products in the right context and bad in the wrong one. Also, if you look at gold returns over long stretches, Indian moms buying gold have often outperformed most equity investors.
But as a country, it’s undeniably a good sign when household savings gradually move from only FDs and real estate toward instruments that fund businesses. The Economic Survey charts show just that.
The question now is whether this survives the next proper bear market. It looks like the start of a secular shift. But we won’t really know until the tourists leave for good and only the serious money remains.
For now, the charts tell a simple story: the transformation I wrote about in January wasn’t just bull market noise. The structure changed. Whether it lasts is a different question entirely.
true…