
It’s the economy, stupid: A tale of two growth rates, and other tales
We love India Data Hub’s weekly newsletter, ‘This Week in Data’, which neatly wraps up all major macroeconomic data stories for the week. We love it so much, in fact, that we’ve taken it upon ourselves to create a simple, digestible version of their newsletter for those of you that don’t like econ-speak. Think of us as a cover band, reproducing their ideas in our own style. Attribute all insights, here, to India Data Hub. All mistakes, of course, are our own.
Sigh. Another round of this, huh?
Yep! Last week, you said there’ll be new GDP data around!
Yes, yes. I did, didn’t I?
You did! And…?
Hey. We talk about the economy all the time. How about something fun! Like cricket! That Jaiswal kid really is something, isn’t-
Usually, I’d love to. But this looks like it’s making you hella uncomfortable and I love it. How did we do?
You see, that’s a matter of perspective.
Come again?!
Yeah. You can choose. A six quarter-high or a three quarter-low. 8.4% or 6.5%. Whatever you like.
Uhh, 8.4? I want to feel good. But what the hell?
See, this quarter, there’s a big difference between our GDP and our GVA.
Between the GDP and what?
Well, a country’s Gross Domestic Product (GDP) is the total value of all goods made and services given in an economy. And its Gross Value Added (GVA) is… well, the value added in all goods made and services given in the economy.
Listen. We’re friends, right?
I guess..?
If you’re getting high, it’s good manners to share. That’s all I’m saying.
Dear, oh dear. Let’s do this the hard way. Buckle in, this will be quite a ride.
How do you calculate a country’s GDP? How do you check what an entire economy has been up to? In theory, you look at the value of every single thing made or service delivered in the economy, add it up, and this gives you a sense of what the economy has done as a whole.
There’s a catch, though. You’ve probably made something, or done someone a service. Did you see a government babu in a safari suit taking down all your economic activity in a notepad? Unless someone is pulling an elaborate prank on you, you probably didn’t. And that’s the problem: nobody can actually know a country’s GDP. The best we can do is take a really good guess.
So how do we make these guesses? We have two ways (there are three, actually, but we’ll keep things simple). Before we get to them, though, let’s take a step back.
Imagine: Arushi runs a large organic farm in the outskirts of Bengaluru, selling her produce to premium grocery stores. Bhavya runs one such store: B-Mart. She orders some staples from Arushi – fruits, flour, milk, cream, butter, eggs, sugar – for a total of ₹1,000. One morning, Chinmayi drops by B-Mart, shelling out ₹1,250 to buy this all for her bakery. She gets home and whips it all into a rich, moist cake, layered with fresh fruits and cream, which she sells to Disha for ₹2,500. Disha cuts the cake into slices, arranges them in pretty boxes, and stocks them at her upscale café. The next day, Ekta walks in, looking for something to serve at a tea party she’s hosting that evening. She loves the bright, colourful pastries on display, so she buys them all for ₹3,500.
How much total value did they create, in total? There are two ways we can do the math:
- One, you could add all the business that took place, and then cut out the raw material costs they paid. This should give you the amount of new value created at every step. Here, there was a total of ₹8,250 of business, of which ₹4,750 (₹1,000 by Bhavya, ₹1,250 by Chinmayi, ₹2,500 by Disha) was spent on inputs. The total value they created, then, was ₹3,500.
- Alternatively, we could just look at what Ekta spent at the end of this chain. Again, that’s ₹3,500.
That is just for some pastries. Scale this up for everything happening in an economy, and you have the two ways you can use to estimate GDP:
- There’s the Production Method. You look at the data to guess the total amount of business taking place across the economy, and then subtract all input costs to get to the GVA. You then make a few modifications (which we’ll come to in a jiffy) to get to the GDP.
- Then there’s the Expenditure Method. Through some fancy data-work, you try to estimate the money spent only on ‘final products’ in the economy by all sorts of people – regular consumers, the government and businesses. Taken together, this gives you the GDP.
We publish both every quarter. (If you’re fine with butting your head against tablesful of numbers, see page 9 of this press release.)
Yeah? Which is better?
Neither! Both should, in theory, get you to the same figure.
There are reasons you might prefer one over the other, though. For instance, before you can get to calculating the GDP by the ‘expenditure method’, first, you calculate how much consumers spent and how much businesses invested over the year. These are useful data points in themselves. So, many countries – developed ones in particular – prefer this way of doing things.
On the other hand, for a country like India (and, frankly, for most developing countries), our data is far better in giving us a number for the GVA. So we have usually taken the ‘production method’ to get to our GDP. And sometimes, the GVA can tell us something that GDP numbers don’t – as, we’ll soon see, is the case right now.
All caught up. I think. Maybe. I mean, that was a lot. Anyway, what happened?
Our GDP between October and December last year was 8.4% higher than it was in the same three months last year. That’s a massive spike; the highest we’ve seen in 6 quarters. We’ve also bumped up our estimates for the two quarters that came before.
We saw some heavy distortion in our yearly GDP growth during the pandemic. In its first year, the economy stopped still in its tracks. Compared to this unfortunate period, next year, the economy looked like it saw incredible yearly growth – simply because things were moving again. If you ignore this oddity, however, this is the fastest we’ve grown in almost six years.
Alas, that’s not true of our GVA. The value our economy added between October and December – at 6.5% – grew at its slowest pace in three quarters.
That’s the weird thing: a large, sudden gap has appeared between the two. See this chart:
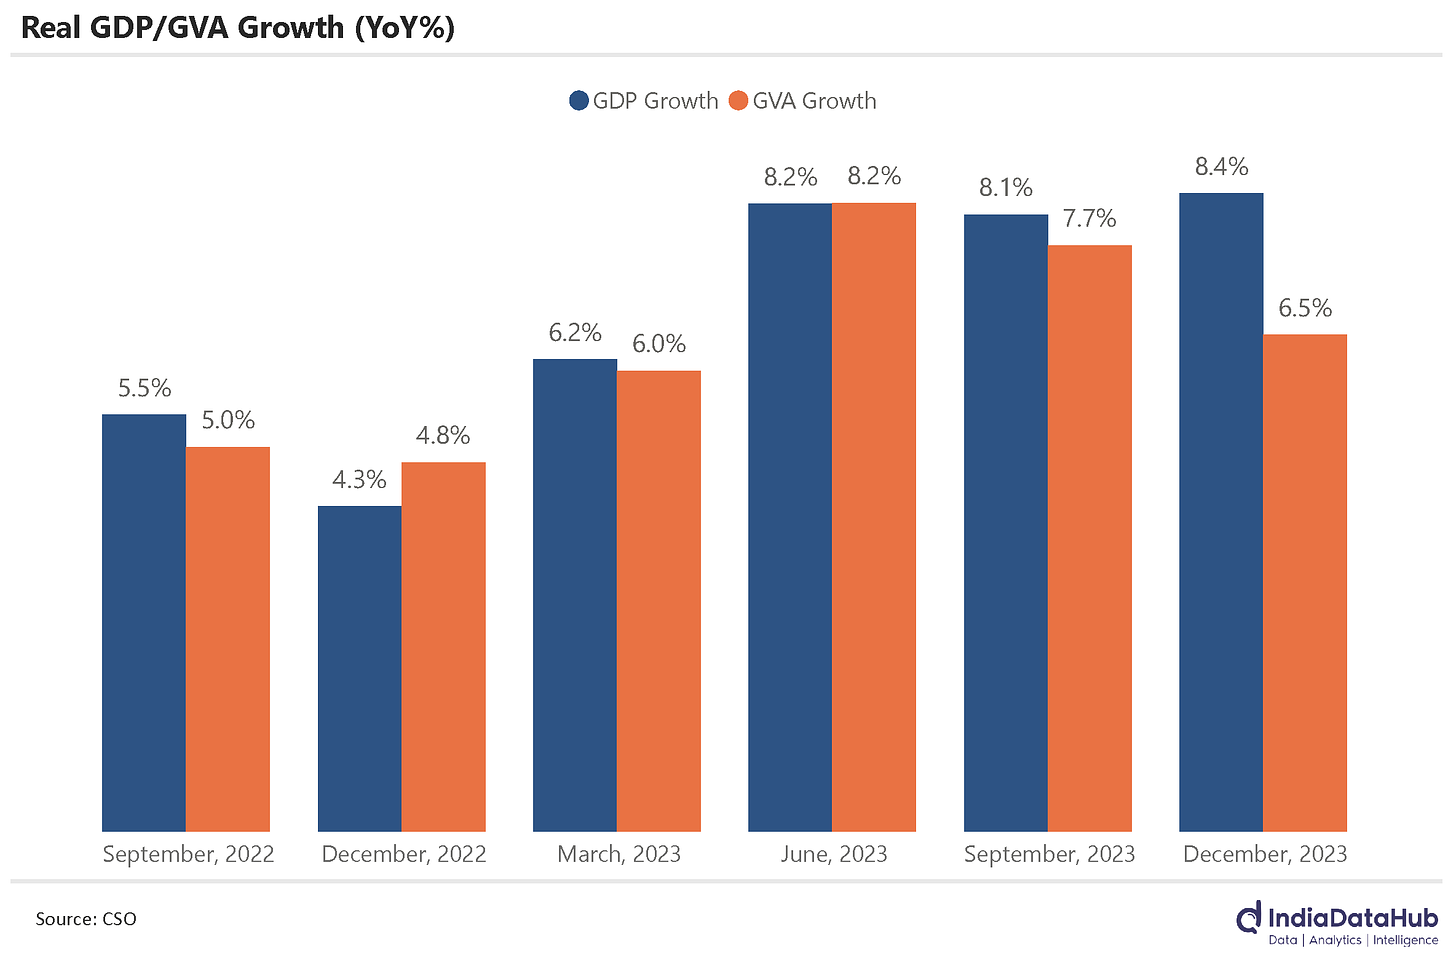 Oh wow. That’s certainly quite a gap. You did mention the GVA’s modified a bit to get to the GDP, though. Is that it?
Yeah. Hence the gap.
Think about it: does a seller get every single rupee you pay for something? Isn’t there someone else in the background, taking a cut?
Uhh.. The government?
Precisely!
When you look at someone’s expenditure, you’re also looking at the (indirect) taxes they pay. Equally, sometimes, you don’t pay the full price for something – because the government subsidises your costs. This creates a small mismatch between the value that businesses create, and what one finally spends.
It’s the latter that we take as the GDP figure. If you have the year’s GVA, add all indirect taxes, remove all subsidies, and you’ll get to the GDP.
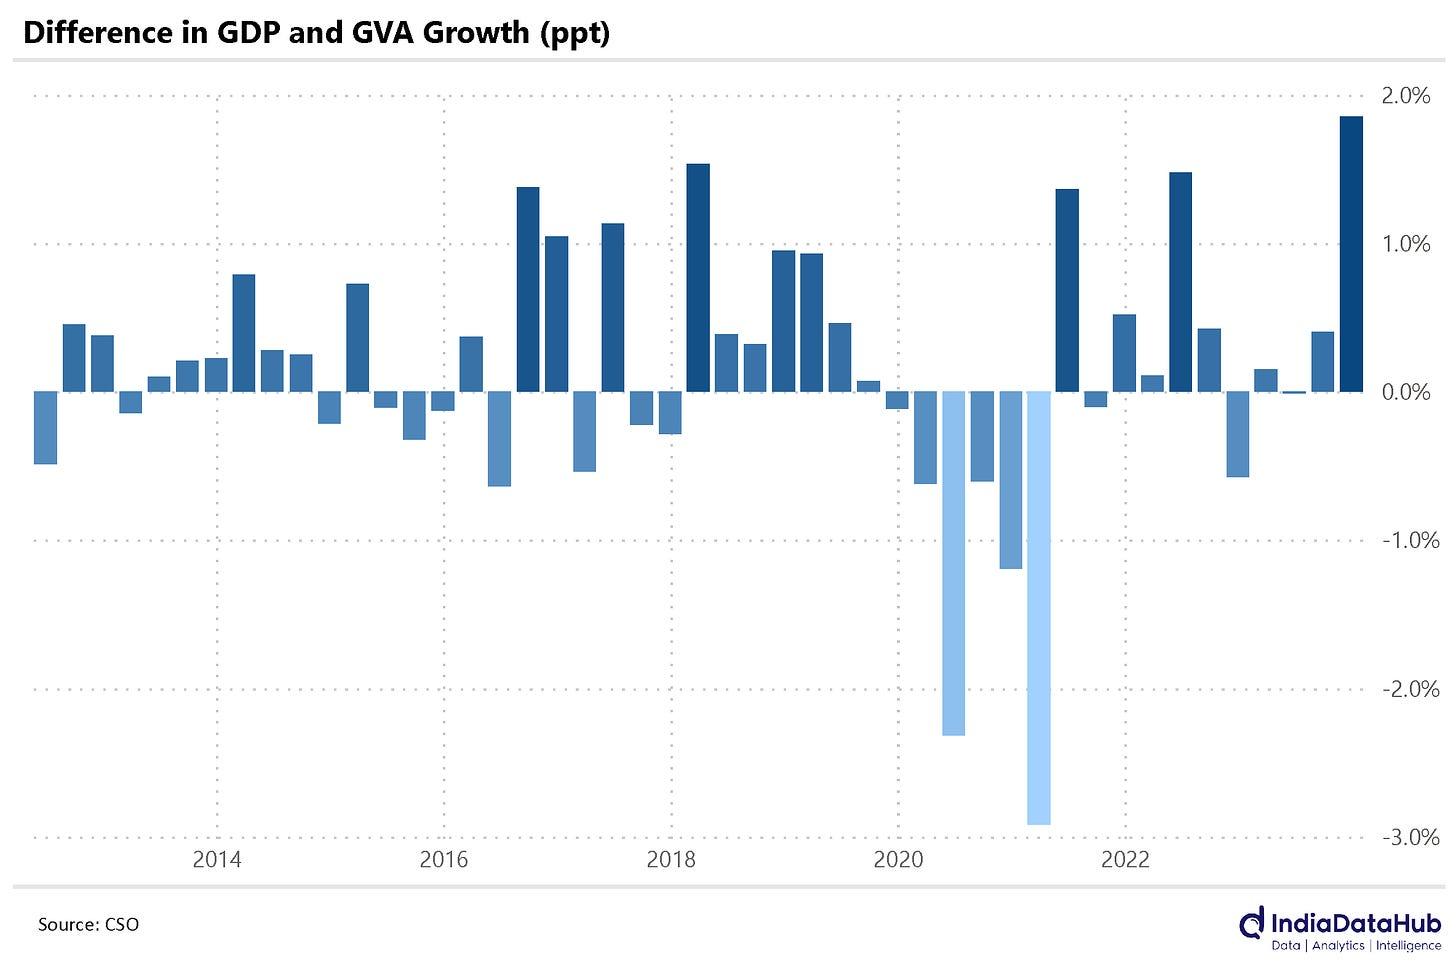
This chart tells you how much the growth rates of the two have historically diverged. The quarter gone by is the furthest our GDP has outstripped our GVA in a decade.
I’m confused. So we use the GDP to track how the economy is doing, but… there’s another metric that does this more directly?
The world doesn’t always make sense, huh? How about that.
Abey. That’s a cop out. Aren’t you, like, the econ guy?
Hey, I’m just your garden-variety nerd! Not the friggin’ IMF.
But look. The thing is, it doesn’t usually matter. There isn’t generally a big difference in how they grow.
But it did matter!
Sigh. Yeah. The government’s indirect tax collections spiked, and it also paid out far less in subsidies – fertiliser subsidies in particular. Together, these opened up a big gap between our GVA and our GDP.
It’s like this: Back when I was in school, there was this measuring tape they’d plastered on the wall of the PT room to record all our heights. Once every year, the PT Sir would parade us all to the PT room, stick us against the measuring tape, and then press a notebook against our heads to see precisely where we reached on the tape. It was rough, but it worked. One year, though, this kid had slathered his hair with gel until he had spikes that seemed like they were made of concrete. His hair refused to give way to the notebook the PT Sir was mushing against his head. So the PT Sir eventually gave up, and simply declared that he was an inch taller than he actually was.
It’s sort of the same with the GVA and the GDP. It’s rough, but it usually works – until you have a quarter like this one.
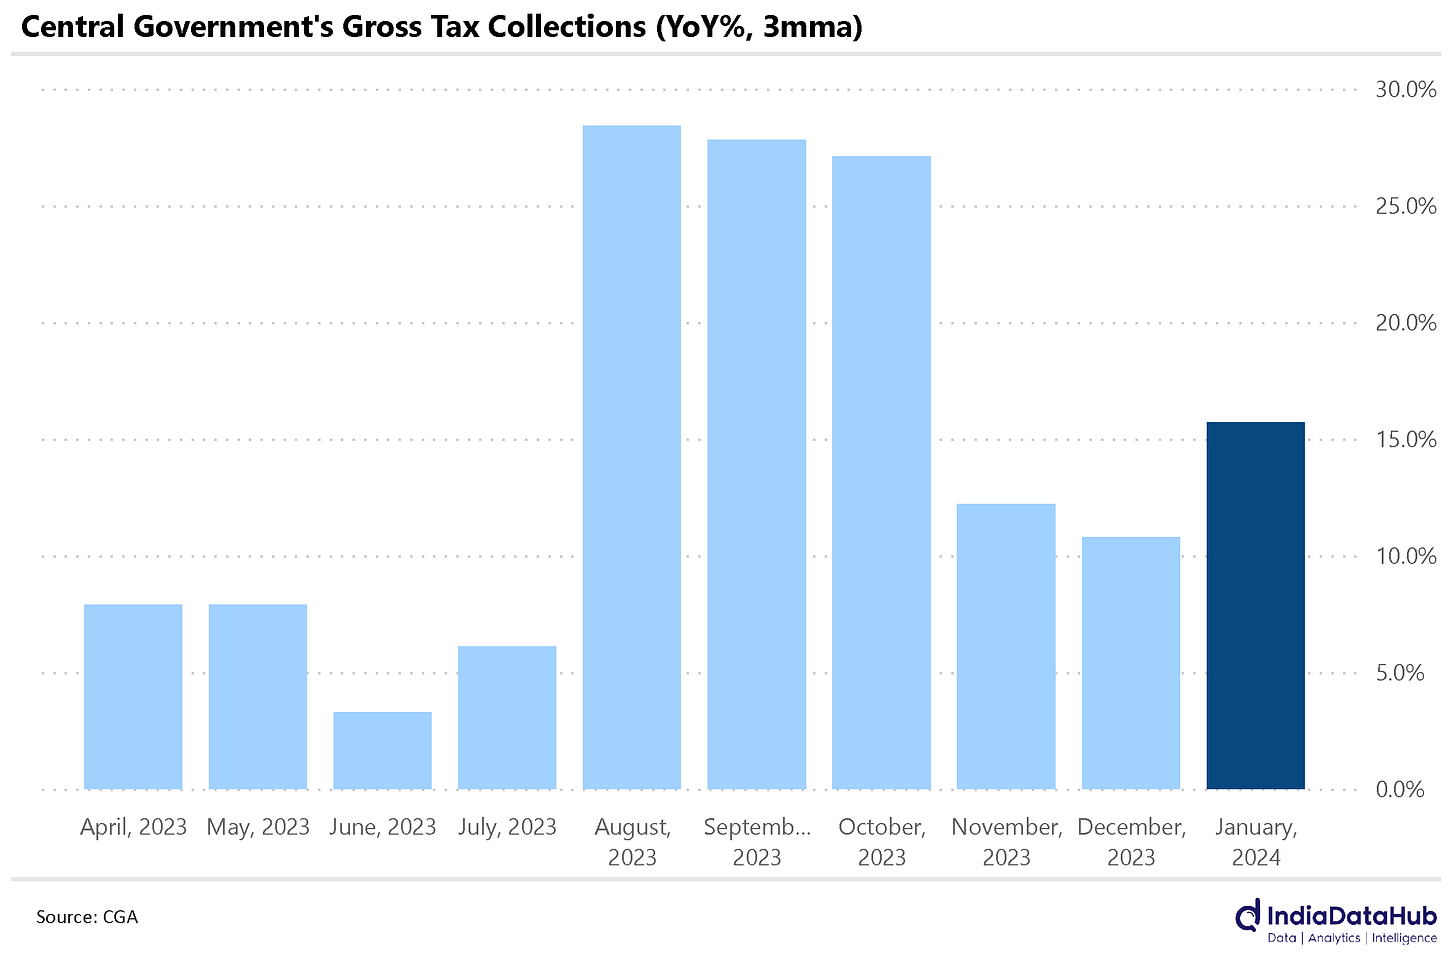
In other news, the government’s raking in some serious tax revenue.
NO! There’s even more news?! Why?!
A few quick pointers, I promise:
- The Central Government’s total tax revenue grew by more than 15% this January, when compared to the last. And really, it’s been growing this fast for a while. See the chart below for more.
- GST collections saw double-digit growth.
- Direct taxes have grown by more than 20%, compared to last January.
That’s quite a war-chest. What’s the plan, spend it all before the elections?
I don’t know. Maybe. Funny thing, though: in January, at least, the government spent less than it did last year. Its capital expenditure (which we talked about a few weeks ago, if you need a primer), in particular, dropped by a whole 40%.
Now, before you panic, our capex has still increased this year. This isn’t a trend – not yet, anyway. Looking between April and January, this year, our capex has been 26% higher than last year.
Even so. If you were to just see the month of January, our government has earned a lot more money while spending a lot less.
There’s something more interesting, though.
More interesting than tax collections? No way. My heart might explode with excitement.
Ha-ha.
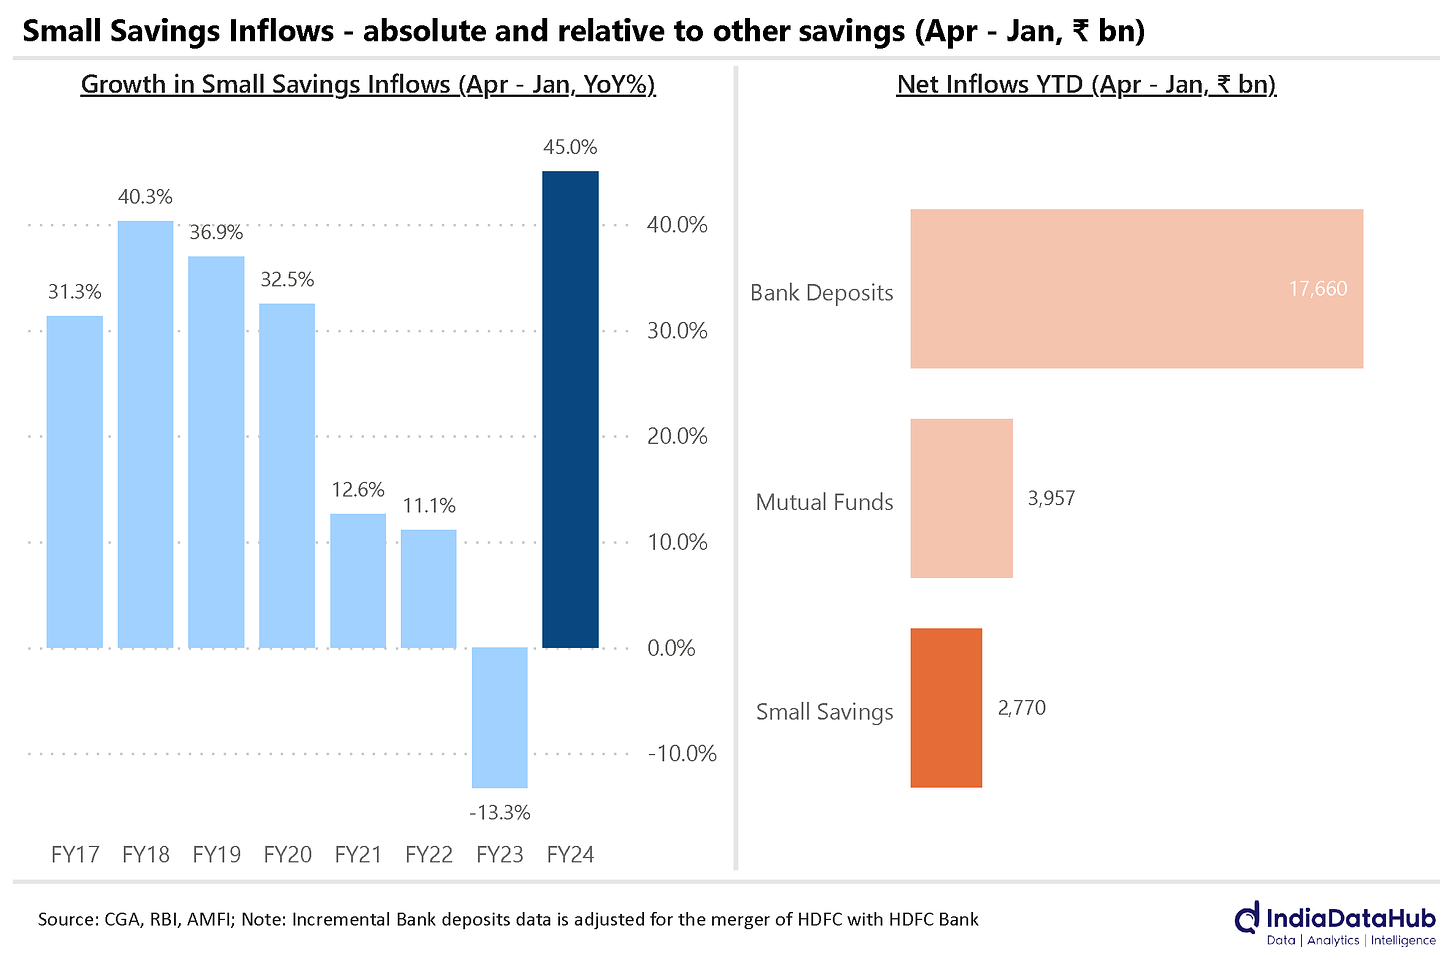
Anyway, small savings schemes are receiving a lot of money. To the tune of ₹2.8 lakh crore between April and January – 45% more than last year. That’s 15% of India’s total bank deposits over the year. Or 70% of all the money that’s gone into mutual funds.
See this chart for more:
Could you tell me what the word “interesting” means?
Yeah, sure! Something interesting is something that holds… wait, you’re still messing with me.
Of course. Remind me, why should I care about something so insignificant that it’s got “small” in its very name?
Well, we are talking about lakhs of crores of Rupees. But that isn’t the only reason this data is important.
See, most people – especially in India – don’t have too much money. They eke out whatever minor savings they can, whenever they can. This money is really not meant for risk and speculation. When you don’t have much in the first place, a loss of capital really could ruin your life, or worse, the lives of your entire family. It has to be absolutely secure.
These are the people that small savings schemes cater to. They offer clean, fixed, risk-free returns. Nothing that’ll beat the market, but enough that you’ll make a tidy sum while keeping your money safe.
Now, because this cohort – less affluent people, usually from smaller towns and cities – invests in small savings schemes, any story about movements in small savings schemes, really, is a story about all their lives. When there’s a spike in inflows into small savings schemes, that’s just detail. The actual tale is that millions of less affluent Indians are now finding money to save.
Isn’t that something worth caring about?
Finally-
God, that word sounds so sweet!
Hey, let me finish! Finally, we turn to Europe.
After a long, long time when prices seemed untamable, Europe’s finally bringing inflation under control. Some pointers:
- Prices were 2.6% higher this February, compared to February last year. That’s a smidge lower than inflation in January – which was at 2.8%. For some perspective, last February, inflation was somewhere around 8.5%.
- Energy was actually cheaper this February than last – declining by 3.7%. Food was 4% more expensive.
- Major individual European economies have also brought inflation under control. Germany saw inflation come down to 2.7%, from 3.1% in January. France’s inflation, too, dropped from 3.4% to 3.1%.
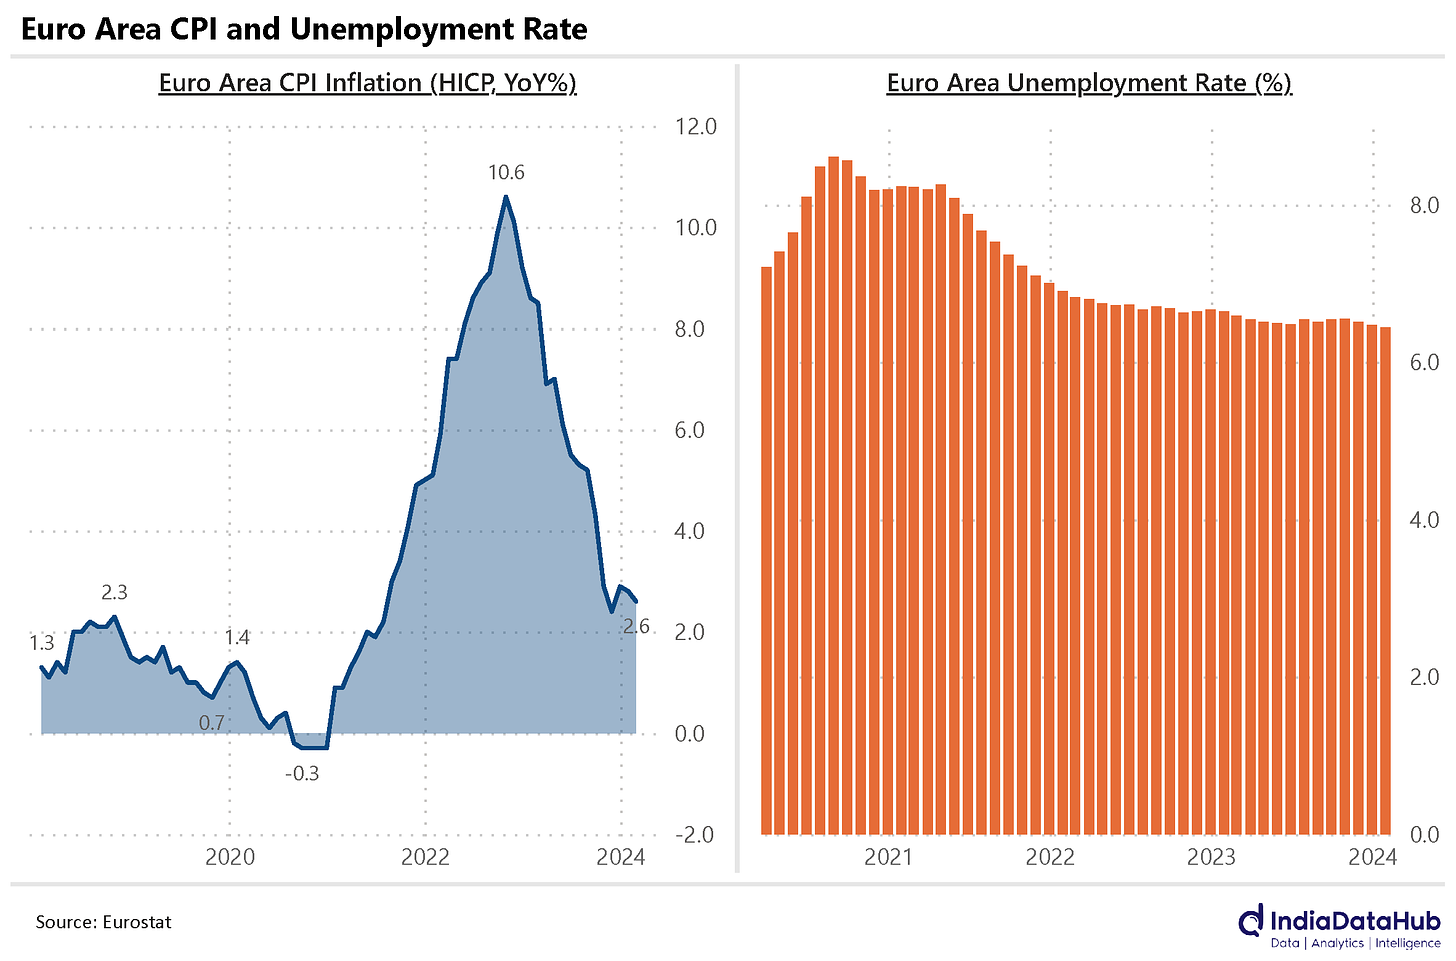
Good news from Europe? That’s a rarity these days.
That’s fair, they’ve definitely seen some problems.
Those problems aren’t over just yet, though. They’ve also seen a lot of unemployment of late. And it isn’t going away. Their unemployment rate has hung around 6.5% for a couple of years now, almost, with little to indicate that it’ll come back down.
That’s it for the week, folks. Thanks for reading!