
16.1 Confession
“This is the longest a Varsity module has taken to complete,” said Karthik. It is true. The previous chapter, Retail, was really long ago. Such a long break is not good. So, my 2026 resolution is to add at least five more sectors. I hope I can do that.
The reason I chose Real Estate for this chapter is that we were already working on the sector for our YouTube series, T Minus One. And most of the things we covered there were fresh on my mind. Hence, this chapter.
16.2 India’s real estate landscape
Real estate can be residential or commercial. While you need land and a building to develop both, the demand and supply factors can differ widely. For example, during Covid, working from home became the norm. So, people suddenly wanted larger homes. A family of four needed about a 3-bedroom apartment so that each member could have a dedicated room to work out of.
Working from home also meant that offices suddenly became empty. Businesses suddenly wanted smaller offices. Many scaled down, while many gave up their office leases. The same trigger of Covid had a completely opposite impact on the two types of real estate. Higher demand for residences and lower demand for offices.
Hotels, hospitals, schools, and malls are also commercial real estate. Even they witnessed a demand slowdown around Covid.
But as Covid passed, both residential and commercial real estate saw a rise in demand. It could be India’s growth story, MNCs opting for a China+1 policy, new GCCs being set up in India, etc., that were perhaps some of the triggers that led to the buoyancy in India’s real estate sector. From before Covid until FY25, residential sales in India’s top cities grew 77%.
However, as I am writing this chapter in February 2026, residential real estate is seeing a slowdown in price growth and new project launches. Within that, the share of new affordable housing launches has been shrinking.
The RBI defines affordable houses in metro cities as those measuring up to 60 square meters and priced at up to ₹65 lakhs. But if you look around in metro cities, you are unlikely to find houses priced at ₹65 lakh or less. You could safely say that sub-₹1 crore residences actually fall in the affordable housing category, at least in the metro cities.
The higher-priced houses have, in fact, been in higher demand. That is where most organised listed real estate players are also focusing these days. But not all of them have the same growth path. The region where they focus more of their business also has a bearing on how they perform.
You know each city has its own unique economic composition. Technological advancements, IPOs, foreign investments, etc., are all triggers that impact cities unevenly. So, a real estate player’s presence in those cities also matters.
The crux is that when you analyse a real estate stock, you will have to study its portfolio: which segments it serves, which cities it is present in, the composition of its residential and non-residential offerings, etc. That will help you identify which external factors to look at when analysing their business.
16.3 The parameters for residential real estate
In India, most residential real estate is built to sell, while most commercial real estate is built to rent out. Developers further classify retail real estate assets (malls) separately. Retail real estate has its own demand and supply patterns, and running it requires different competencies. By virtue of that, the parameters to study the three sectors should also differ. However, you will see that most listed players are primarily residential players with a decent interest in commercial or retail operations. We will focus this chapter on the parameters you must consider for residential real estate businesses. And then, we will touch upon a few parameters for commercial and retail real estate.
16.3.1 Project Updates – You will usually find this information in the press releases or conference calls. Within project updates, look for three sets of information.
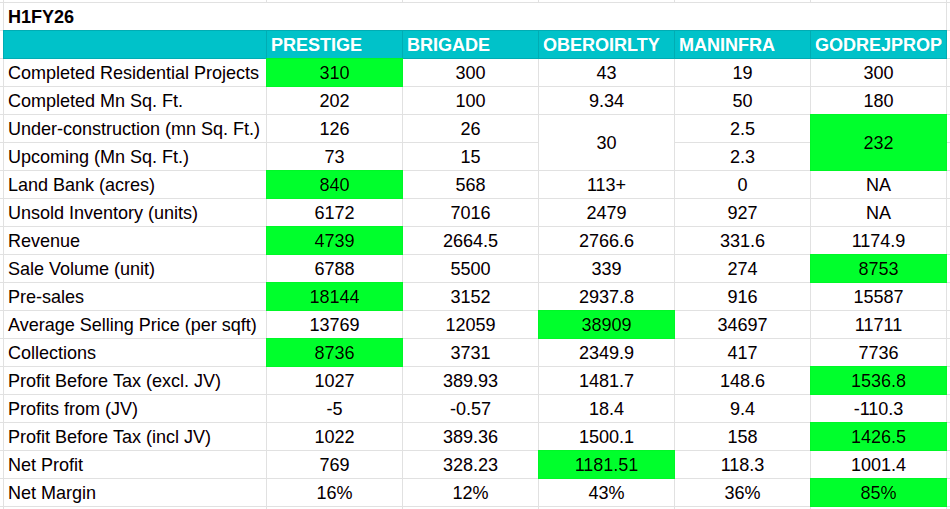
- Completed projects – Mostly found in investor presentations and company websites, look for how many projects the developer has completed, how many years they have been in the business, and what their execution capabilities are. Look for cues on how they have grown in the size or location of their projects, or what kind of real estate projects they have been more successful with.
- Underconstruction projects – This will give you an idea of the scale of current operations. Usually, project construction can take years. Compare their current completion level with where they were last year. See if their construction pace is on time or delayed.
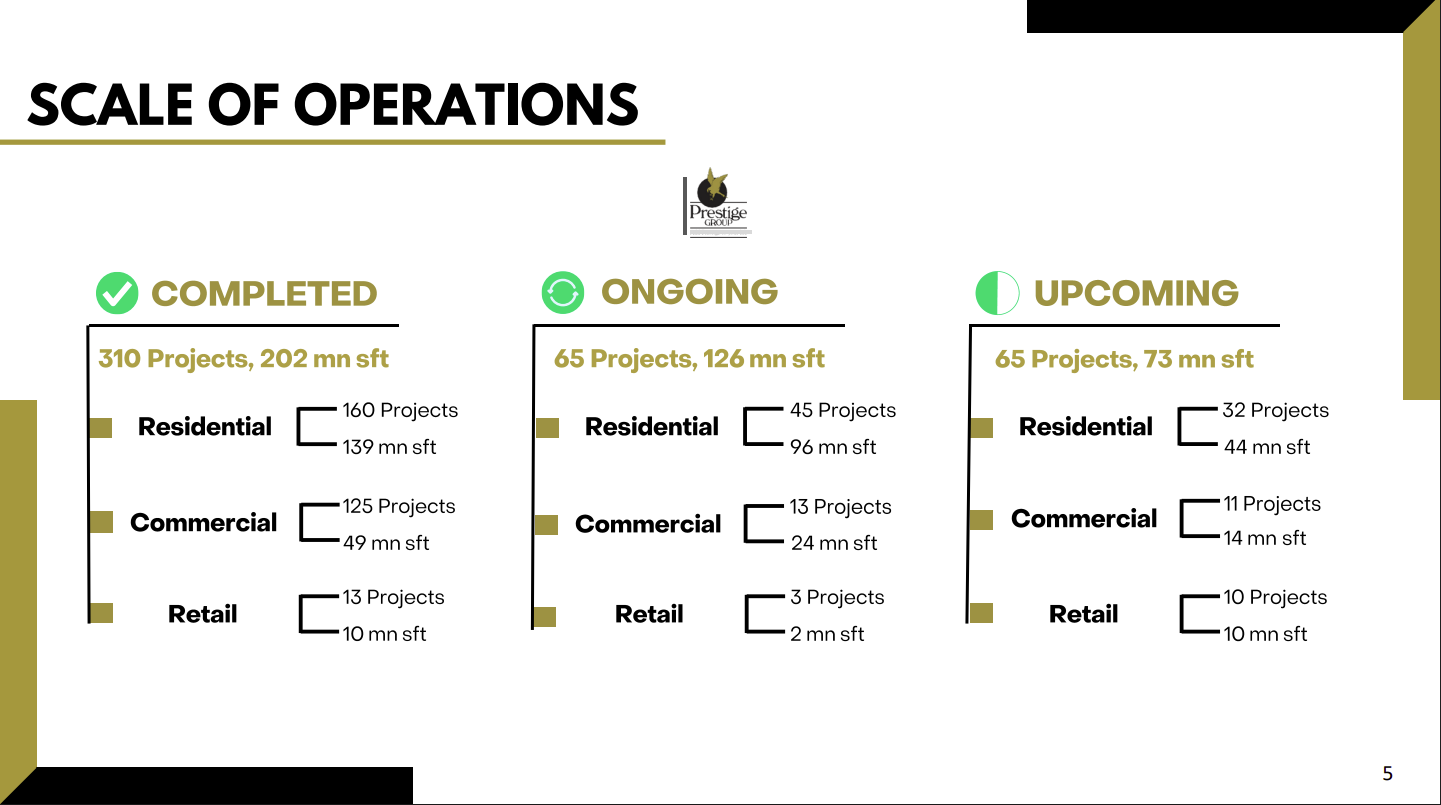 Land banks – This will give you an idea on how far into future the developer can continue introducing and developing new projects without having to worry about land prices. However, some players might not have any land banks. Their business model is to get into a joint development agreement with the landowners. Theirs is more like an asset-light model. So, they don’t have to keep too much capital tied up in relatively illiquid assets. Their ROE must also be better in that case. For such players, not having land banks is not a negative, but it also limits the visibility of their distant future. There also might be players with a massive land bank, but they won’t disclose it.
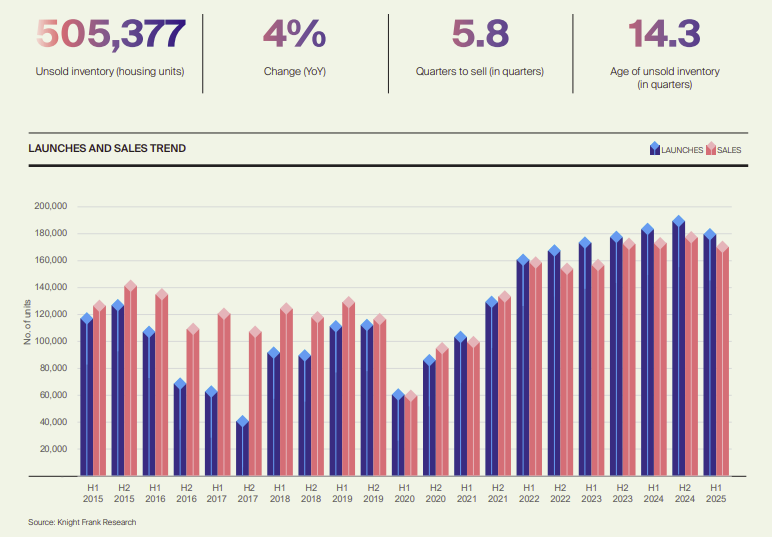
16.3.2 Unsold inventory – The number of units available for sale but not sold is the unsold inventory. This could include completed projects and even under-construction ones. A higher or growing number of unsold inventory is seen as a sign of stress – perhaps people are not buying houses. A continuously declining figure of unsold inventory could also be a concern – it could mean that there is demand, but builders are not introducing new projects.
16.3.3 Quarters to Sell (QTS) or Inventory Overhang – Unsold inventory in itself gives you little information. QTS and inventory overhang put unsold inventory in perspective.
QTS shows how many quarters it would take to sell the existing inventory. Let’s say, a developer has an unsold inventory of 2200 units, while the average sale over the last year has been 500 units per quarter. So, it would take 4.4 quarters to sell the existing inventory. Here, the QTS is 4.4.
Inventory overhang shows the same picture as QTS, just that it is in months. Let’s say the developer has an unsold inventory of 2200 units, and sells an average of 150 units per month, it would take 14.67 months to sell the existing inventory. Here, the inventory overhand is 14.67 months.
Which one should you use – QTS or Inventory Overhang? Actually, both are equally good, and you can use either. But the reason you should know both is this – let’s say one developer reports QTS and another reports Inventory overhang, if you know both terms, you can convert one into the other.
A QTS of 4.4 translates into an inventory overhang of 13.2 (4.4 * 3 months of a quarter), and an inventory overhang of 14.67 translates into a QTS of 4.89 (14.67 / 3 months of a quarter).
You will find some industry-level data on QTS or inventory overhang. Developers usually won’t publish this information. But if a developer publishes data on unsold inventory and units sold every quarter, you can compute QTS on your own.
Just look at the number of units sold in the past six to eight quarters. Sum them up and get their average. This is the average number of units the developer sells in a quarter. Divide the unsold inventory volume by that average number to arrive at QTS.
16.4 Take a break
There are many more metrics to consider, some even technical ones like revenues, margins, etc. Then you have some metrics specific to commercial real estate, too. To keep the chapter digestible, we will look at the rest of the metrics in the next one. We also look at what could be the right valuation method for real estate stocks.
Key takeaways
- Residential, commercial, and retail real estate sectors behave differently. Their demand and supply factors are different. The competency required to run each type of business also differs.
- To assess a real estate business’s track record, you must look at the number or volume of completed, ongoing, and upcoming projects.
- Unsold inventory shows you how many of a developer’s housing units are unsold. It includes completed and ongoing projects. Quarters-to-sell or inventory overhang can give an idea of how long it would take for the developer to sell the unsold stock.