
22.1 Trade from charts
If you are familiar with Zerodha’s trading terminal, Kite, you probably know that you can choose to analyze stock/index charts either on Tradingview or on ChartIQ. These two charting platforms are probably the most powerful charting engines to analyze charts. As a customer of Zerodha, you have access to both these platforms without having to pay for it.
ChartIQ recently had an update, and with this update, there are many cool indicators and studies that you can use. Let me list a few –
- Candlestick Patterns
- Stochastic RSI
- RSI divergence
- MACD divergence
- Stochastic divergence
- Central pivot range (CPR)
- Trade from chart
I particularly find the candle pattern, CRP, and the trade from chart quite useful, hence this quick supplementary note to bring you up to speed.
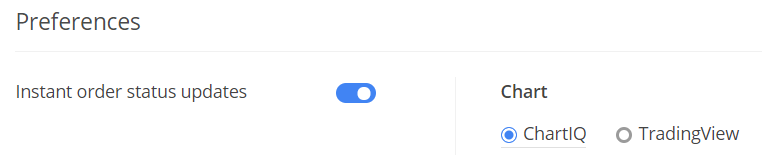
Ensure you have opted to look at charts from ChartIQ. You can do this by clicking on the profile section in Kite.
Now, open any chart from your market watch –
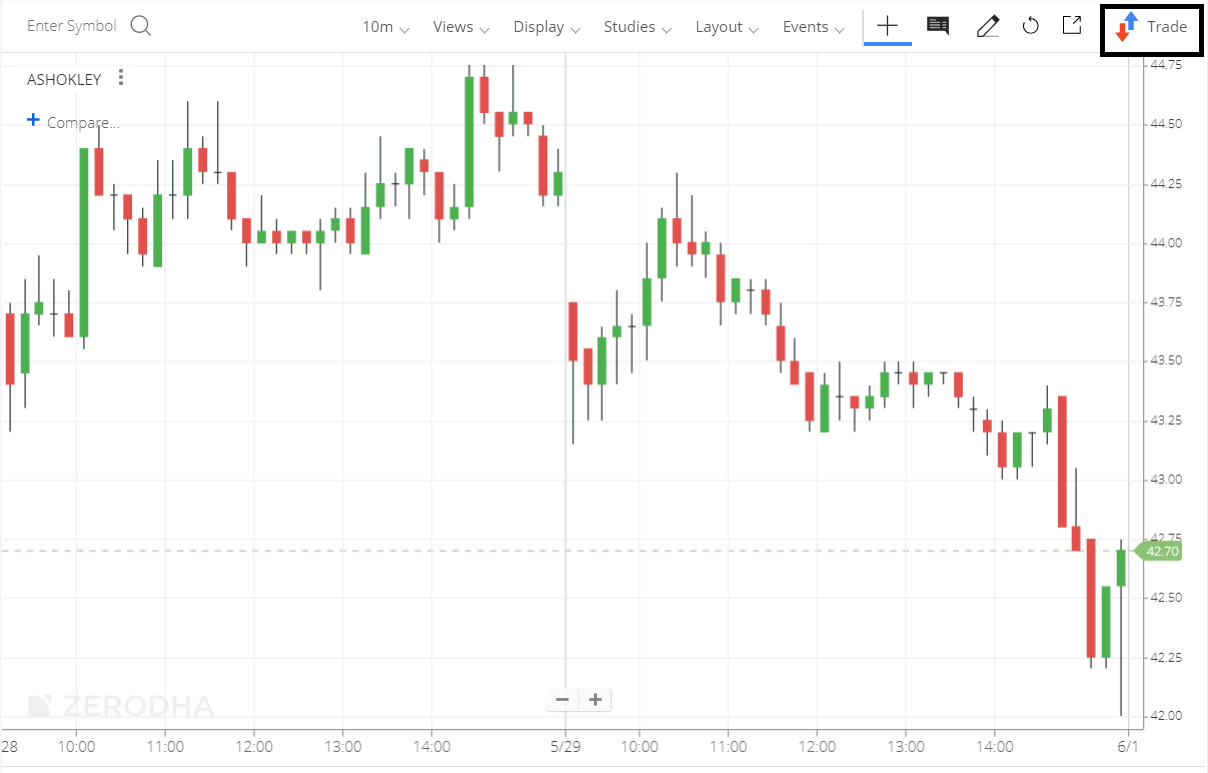
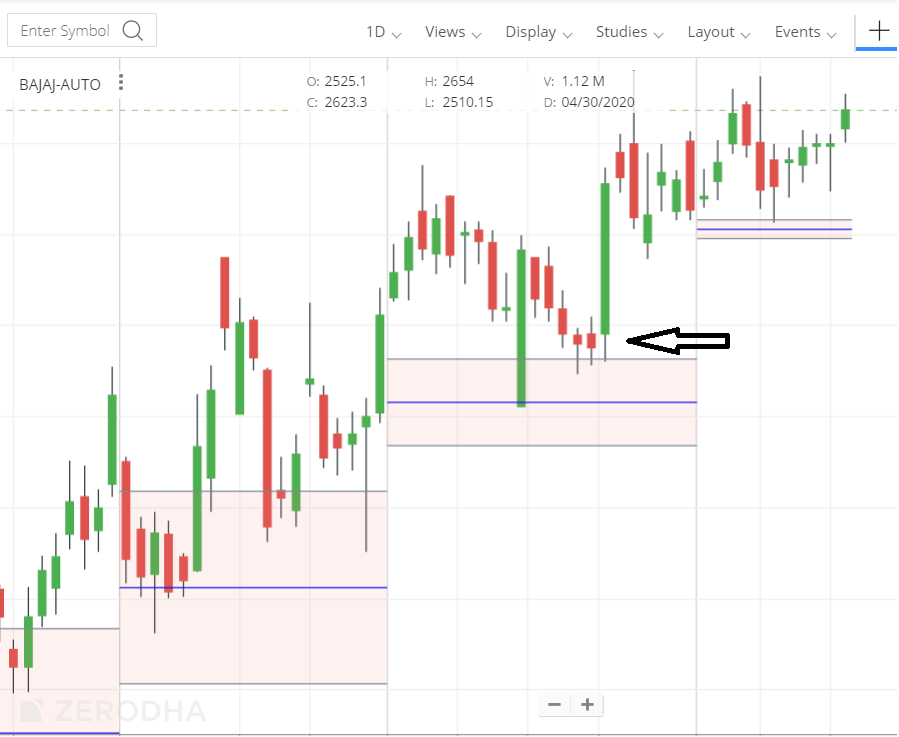
On the top right, you can now see a Trade button. Click on the trade button to invoke the quick order window.
This is a floating order window and helps me drag the order window to key price points and fire order from the chart itself. For example, when I look at this Ashok Leyland chart, I know the stock is moving sideways from the last couple of trading sessions. I may consider a buy position if the stocks break out from the trading range.
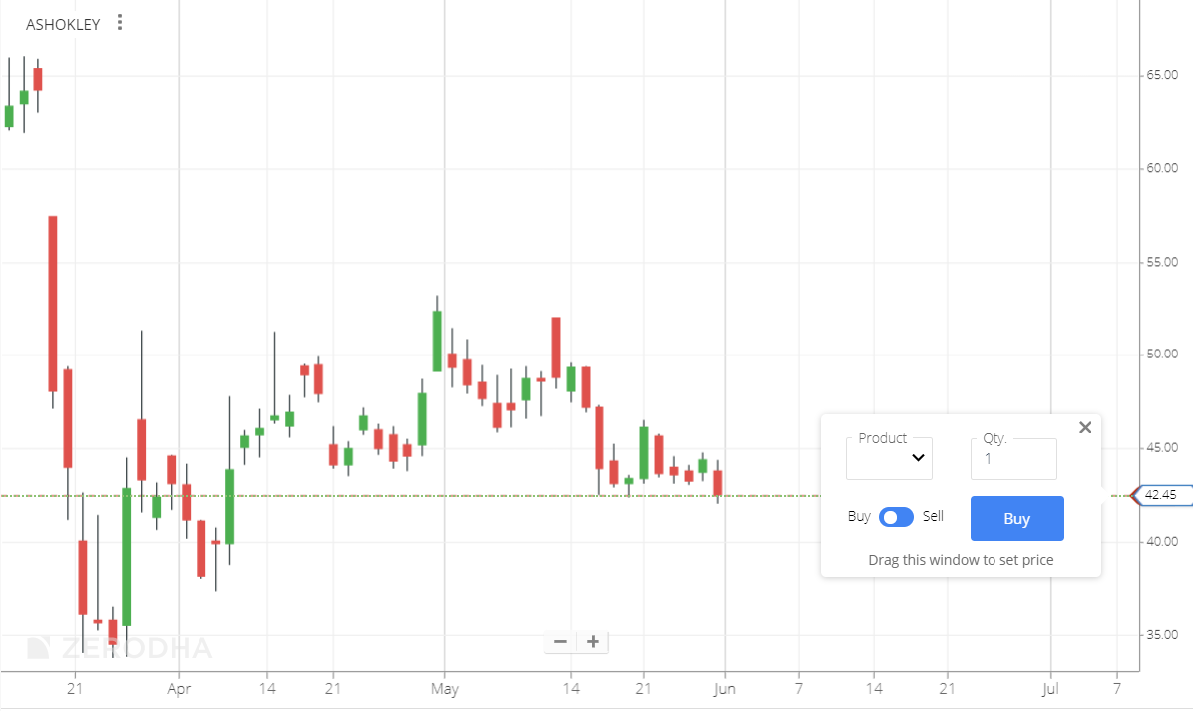
From the chart, I know the break out point is around 45 or thereabouts. All I have to do is click, drag the order window, and drop it in a place that I think is relevant on the chart. Once I do, I can place an order to either buy or sell. I can even choose between a delivery/CNC and MIS for intraday.
In Ashok Leyland’s case, I want to be a buyer at around 45.40, a price I think is crucial for momentum to pick up.
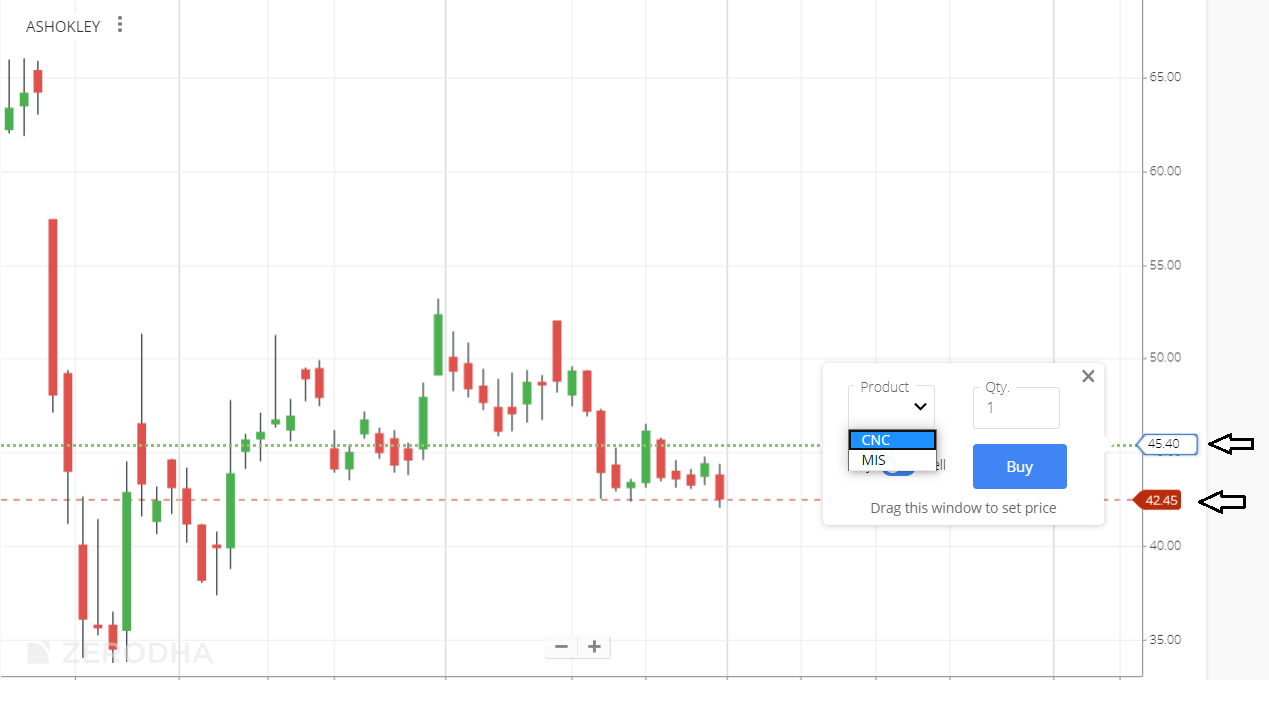
As you can see, I’ve dragged the order window up to 45.40, and I can fire an order within the charts without going back to the marketwatch and getting distracted with other quotes. The current market price, i.e. 42.45, is seen with the red background.
Please use this feature; I think this is a great way to isolate yourself from the information clutter and focus purely on the price action.
22.2 – Candlestick Pattern
Candlestick pattern is an interesting addition in the recent update. The candlestick pattern study helps you identify the candlestick formation from the charts. The candlestick pattern identification is a great way to validate the patterns. However, I was hoping you could use this with some caution.
To load a candlestick pattern, select the same from studies –

Once you load from studies, you can see that the system automatically identifies the candlestick patterns.
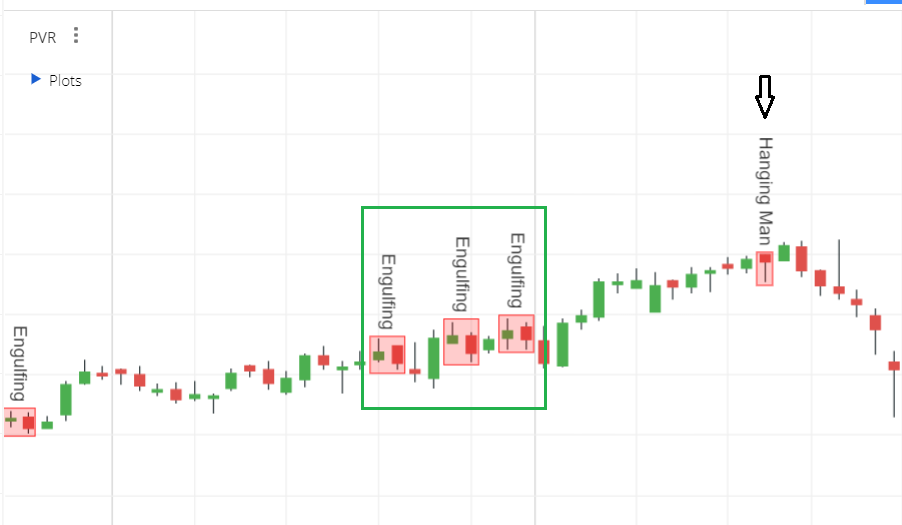
ChartIQ identifies candlestick patterns on the chart. I’m looking at the EOD chart here, but you can do this on intraday charts as well.
While this is a great way to validate the candlestick pattern, there is one problem with this. The identification process does not consider the ‘prior trend’, rule that is critical to candlestick pattern.
For example, the three engulfing patterns are accurate, but one should not trade based on this, given the fact that the prior trend is missing. However, look at the hanging man pattern; this is one makes sense.
So how should one use this?
Well, I’d suggest you carry out your analysis as usual, and once you are convinced that there is a trading opportunity based on a candlestick pattern, then switch on the candlestick pattern studies and validate the pattern. The pattern you have in mind and the one ChartIQ should match.
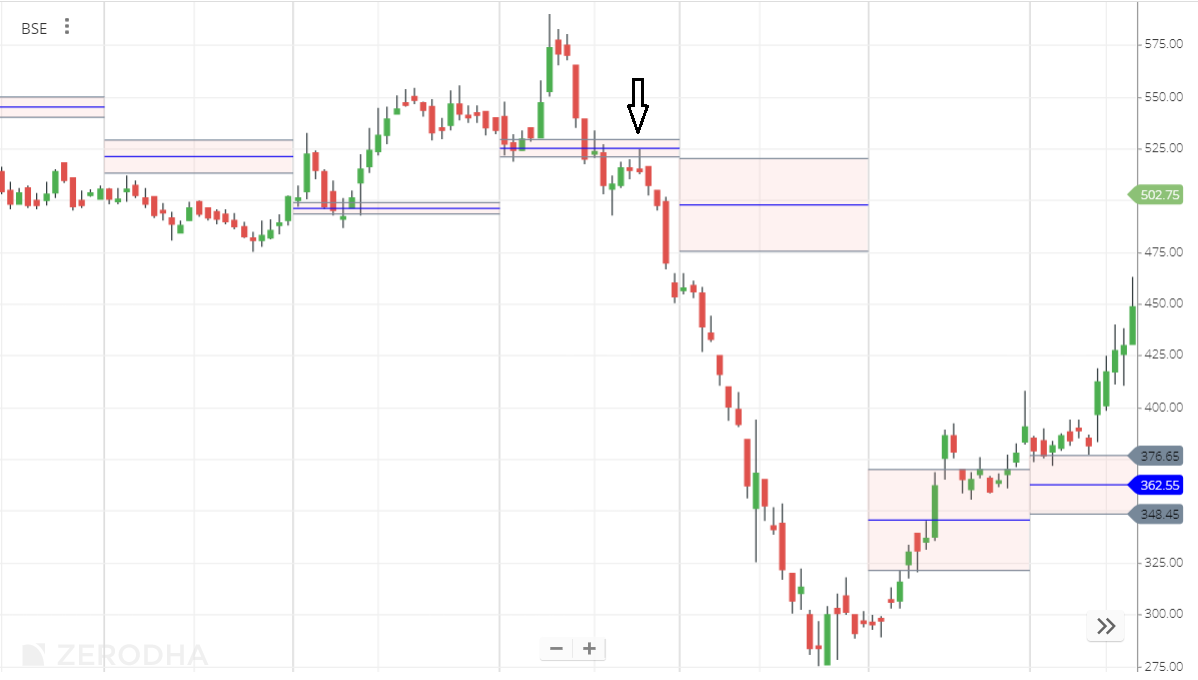
For example, here is the chart of DCB Bank. Pay attention to the encircled part here.

There are a couple of things that are happening –
- Stock is in a downtrend
- P1 formed a long bearish candle
- P2, after a gap down, forms a spinning top
- P3, after a gap up, forms a long bullish candle
- P1, P2, and P3 together appears to be forming a morning start
A trader would probably go long based on the above. However, before placing the order, I’d now want to switch on the candlestick pattern in studies to validate the pattern –
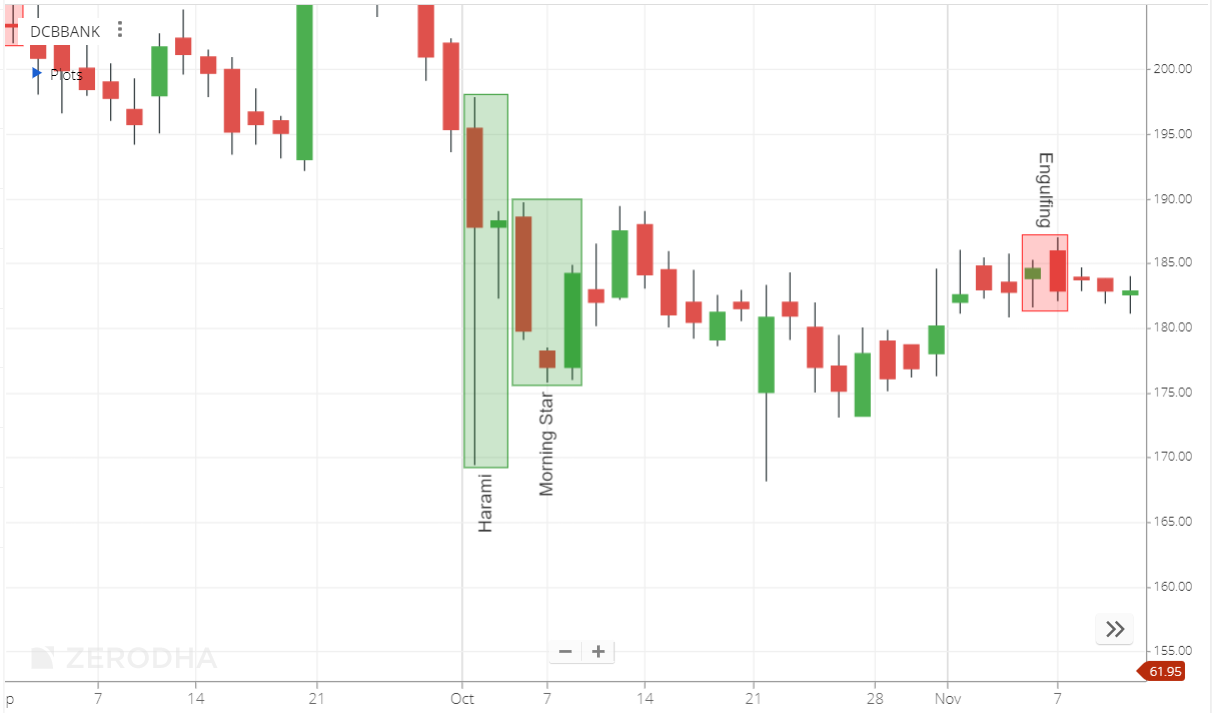
I get the confirmation of the pattern; hence I’d be more confident in placing my buy trade here.
22.3 – Central Pivot Range
The Central Pivot Range (CPR) is an indicator to identify key price points to set up trades. CPR is beneficial for intraday trading.
Before you understand the CPR, it is important for you to know the Support and Resistance; I’d suggest you read through this chapter to know what more about Support and Resistance before proceeding further.
The CPR consists of three components –
- Pivot
- Bottom Central Pivot (BC)
- Top Central Pivot (TC)
These are derived out of the underlying’s High, Low, and Close calculations –
Pivot = (High + Low + Close)/3
Bottom CPR = (High + Low)/ 2
Top CPR = (Pivot – BC) + Pivot
Spend a minute to understand the formula. These are simple averages and manipulation to the averages. In any technical indicator, the moment you see averages, you need to associate the indicator to the underlying trend.
The CPR does just this, i.e. helps the trader identify key price points and the associated trend around these price points.
Today’s CPR values act as the reference for tomorrow’s trading. We will get back to this in a bit.
On Kite search for ‘Pivot’ in studies, and you’ll find the CPR indicator –
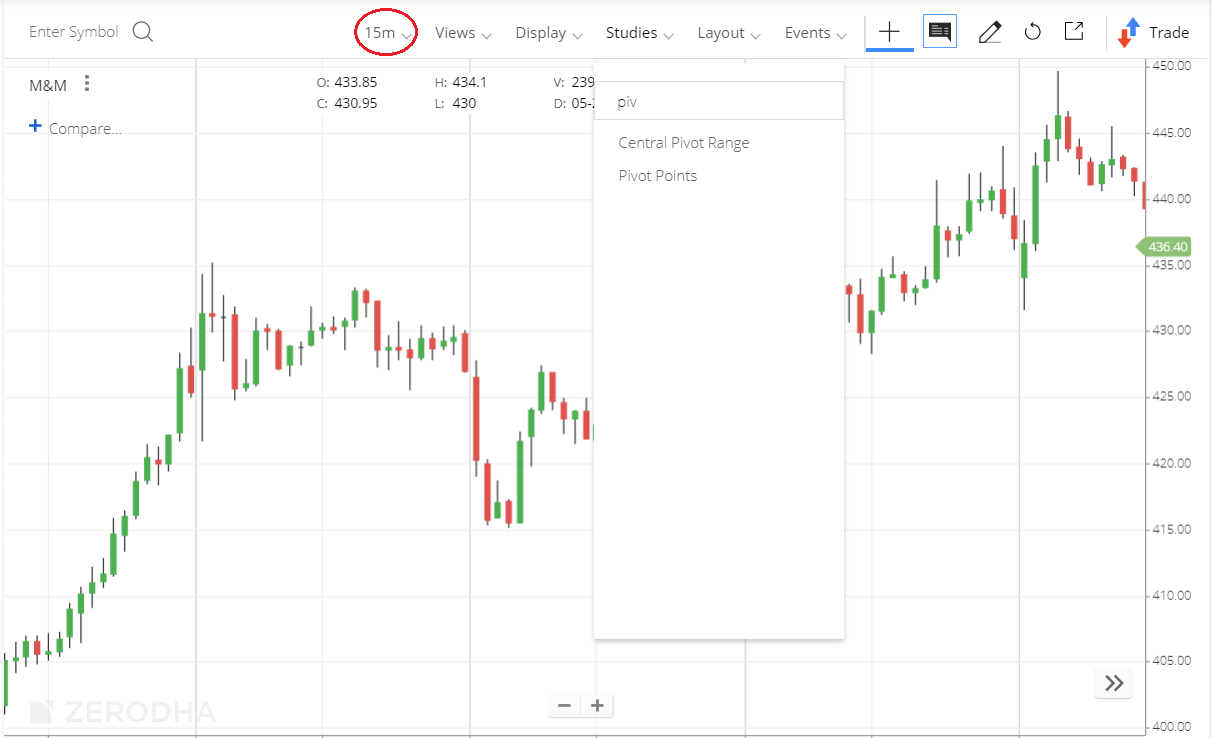
I’m looking 15-minute chart of M&M here. Once you load the CPR, the CPR loads as three horizontal lines, as seen below.
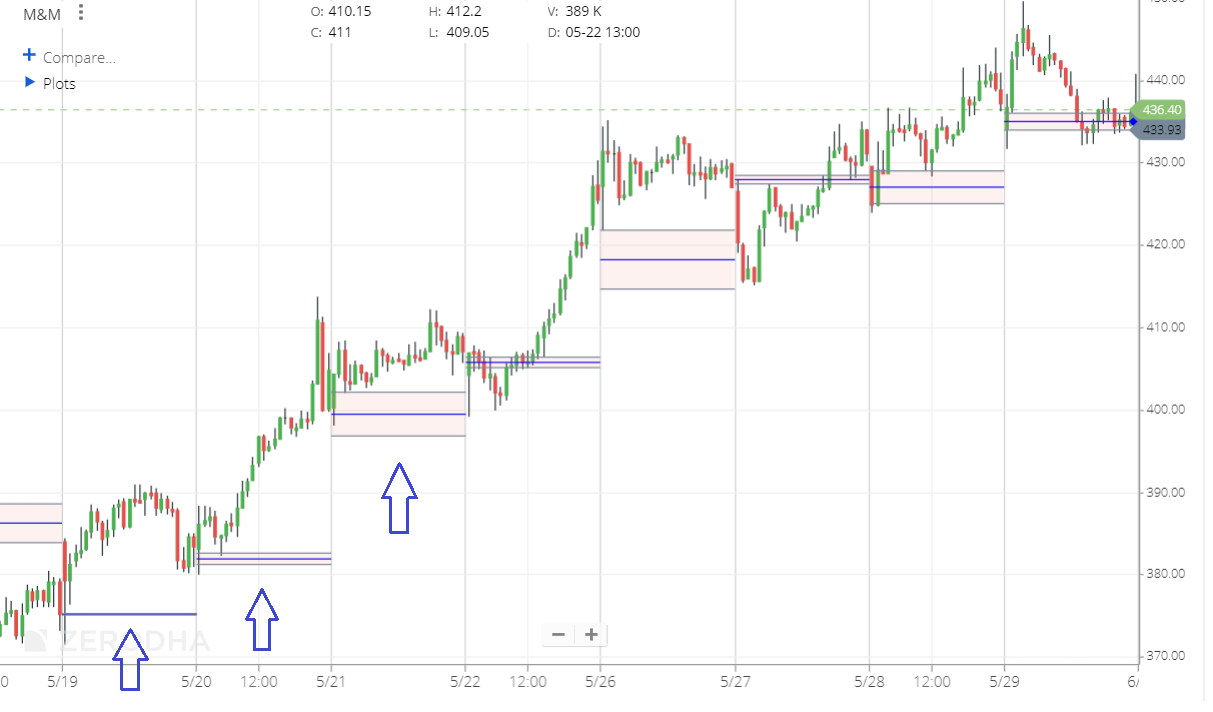
One thing that stands out is the varying width of the CPR. I’ve marked three points on the chart to discuss this.
I want you to look at the first arrow starting from left, ignore the CPR but look at the price action itself. Remember this is the 15-minute chart, and it is quite clear that the day started with a small green candle with not much movement through the day. The open and close were close to each other.
Whenever, we have a sideways movement, the next day’s CPR narrow ranged, this is exactly what we observe on the next day. Now the 2nd day itself was trending day. Hence the CPR for 3rd day was a wide-ranged one.
So the point is –
- If today is a narrow range day, tomorrow’s CPR will be a narrow ranged CPR.
- If today is a trending day, tomorrow’s CPR is a wide-ranged one. Higher the trend, wider is the CPR.
Alright, so how do we use the CPR? Well, this is quite straightforward –
Bullish outlook, look for buying opportunities when the current market price is higher than ‘Top central pivot’ (TC).
Let me elaborate. Assume a stock has rallied for a bit. The current market price is higher than the TC, and you are looking for an opportunity to set up a buy trade.
You can now wait till the stock arrests its rally and retraces back to the TC line.
I’ve highlighted a possible opportunity here –
From a price action perspective, when the current market price is higher than the TC, it indicates that the traders are willing to buy even though the average price is higher. Hence, it would help if you are looking for buying opportunities. Remember, when CMP is higher than TC, the TC now acts as a support line.
Likewise, when the stock or the index is trading lesser than the “Bottom Central Pivot’ (BC). When the current market price is less than that BC, it implies that there is bearishness in the market, hence look for selling opportunities.
Again, look for a price pull back to the BC line before initiating a fresh short.
You can even trade the stock while it is within the CPR. Trading while the stock price is within the CPR is like a range trade.
You buy when the stock is at BC, with TC as a target and sell (fresh short) when the stock is at the TC with an expectation that the price declines to BC soon.
Of course, I know many traders who prefer not to trade the range and prefer to trade only the pullbacks. I too would prefer to use CPR only to trade the pullbacks.
Lastly, here is something that you need to be aware of when trading the CPR.
- When you plot the EOD CPR, the previous month’s OHLC is referenced.
- Previous week’s OHLC is a reference when you plot CPR for 30mins and 1-hour candles.
- Previous day’s OHLC is referenced when you plot CPR for 1, 3, 5, 10, and 15 minutes candles.
Happy trading.
Key Takeaways from this chapter
- You can trade from the chart by selecting the trade button.
- The trade button is a floating window which you can place anywhere on the chart.
- The candle pattern helps identify the candlestick patterns, use this to reconfirm the pattern.
- CPR helps you identify the S&R pattern
- It is considered bullish if the current market price is higher than the TC line.
- It is considered bearish if the current market price below the BC line.
Hi Karthik,
Just wanted to say a huge thank you for the Technical Analysis module on Varsity! This whole experience has been absolutely awesome. Your explanations helped me clear up my doubts and made complex topics so much easier to understand. Thanks for sharing such valuable information!
Sir I\’m reading as much as I can and discussing charts with others but when should I start trading or investing. After reading everything or should start and learn by doing
I mean at the end what matters is paisa kitna bnaya
You can start in parallel. But please dont risk a lot of money, you will have to assume that this money is experimentation and its risk capital.
Yes, I don\’t buy a lot of shares i just buy 4 to 5 shares as trails with controlled risk or reward.
And one more thing can u suggest some other sources from where I can learn more things. This contant is very good to start my journey but If I want to scale my work I will need some more guidance and help .
Have you checked out our Youtube series? Else I\’d suggest you take a look at that as well 🙂
I have heard many people saying that if u want to be good in stock market u should start reading old charts on different time frames atlist 10 charts daily. How should I read chat that is already formed every reaction is old . I mean how should I read the old charts and how will that help. I don\’t know how to do that can u elaborate that .
I dont think thats needed in this day and age. Market conditions have changed and so has the market landscape.
I\’m sorry I\’m asking so many odd questions but the more I\’m reading and thinking about it rhe more questions pop up in my mind
Now my new confusion is about day trading or intraday trading. My brain is telling me that if I can\’t make money in day or intraday trading then I can\’t understand the long game and can\’t make money in through stock market because if I\’m a good day trader it means I understand the market properly my concepts are clear etc. is it true or I\’m Just over thinking
Its not true at all. Personally, I\’ve had very little success with day trading, but have been fairly consistent with long term investments.
Thankyou sir for the guidance.
I\’m able to read the candles the graph the indicators everything but still somehow I miss the breakouts. How and when will I be able to get the breakouts
I mean I can\’t time my entry and exit in a breakout.
Yeah, it comes with practice and observation.
The most likely times a breakout happens is when the stock is stuck in a trading range for a long time, forming double and triple tops and bottoms. Look for these patterns, and most likely you will spot these breakouts.
I\’m trying to make my own system
Please tell me if what I am thinking is right or wrong
Intraday system
Buy on 15 min candle if
Price is above 9 ema 9 ema above 25 ema
BB bounce near middle line higher high higher lows or s/r
Rsi above or bounce on 40
Volume above avg line
This is just for intraday I\’m figuring out for my own system for every time frame but I feel making a system for a high time frame is easier then making for a lower time frame or intraday
One more thing if I\’m using lower ema crossover for lower time frame then do I have to make changes in the other indicates too like in BB or in MACD etc. and if yes then what should be the ratio or the number
Yup, please factor in all these things and figure if it makes sense to take the strategy live. Dont take it live without backtesting. Saying it from experience 🙂
Yes, on paper everything appears to make sense, but you will know the proof of the pudding only when you backtest it. I\’d suggest you do so, maybe you can use streak.tech to do this.
Hi Karthik,
Is my understanding correct when you say this \”When you plot the EOD CPR, the previous month’s OHLC is referenced\”?
a. If today is 8th May, then it will take the data from 8th April-8th May?
b. If tomorrow is 9th May, then it will take the data from 9th April-9th May?
Is it moving averages? Similarly, does it work for the same way for others(Weekly & EOD OHLC)?
Yes, all these indicators are backward looking when it comes to data.
ok Thanks
Happy learning, ROhan.
The CPR is not available in Kite , Can you guide to find this indicator.
I think its available on ChartIQ. Please do check, else you can also check with the support desk, they will help you with this.
Why CPR is not working like horizontal lines in trading view it always plots like moving averages
I\’d suggest you call the support desk for this.
Is there anyone who is taking some trades and are in profit by only learning this TA concepts from the varsity.
I just wanna see how many peoples are making profit and I am making a little bit from learning TA by the varsity.
That will be hard to figure. Varsity is a good place to get started, at least you wont be misguided in the market. Profitability depends on many other factors like capital, your risk tolerance etc.
Is there anyone who has same condition as mine e.i. profitable after learning TA from Varsity.
I hope there are many 🙂
Hi Karthik,
Firt of all Thanks for this wonderful material.
I have took the final assessment for Module 2. Is there a key available? I want to know what I marked wrong.
Ah, unfortunately there is no answer key I guess. Let me check though.
Dear sir , please explain the following line u have said in the context–
\”While this is a great way to validate the candlestick pattern, there is one problem with this. The identification process does not consider the ‘prior trend’, rule that is critical to candlestick pattern.\” Please explain this. I am unable to understand this line how priority trend is missing? On the chart , we can see the chart as long as I want
Prior trend is basically shows the movement of the stock before the pattern occurs. Its important to figure whats happening with the price before you can take any action or trade. In short – if you are looking at a bullish trade, then the prior trend should be bearish, and vice versa.
Hello sir,
First thank you for writing this grand compendium. Have been studying from it like I used to, in school/college. Loved every line of it. Excellent knowledge and it\’s free. (Feels like you\’ve created Linux in trading,haha)
I just had one small query. I’ve recently completed the Technical Analysis module and have been actively trading in options for the past few weeks. Since I’m focused on options trading, I was wondering — should I skip the Fundamental Analysis module for now and jump straight into the Options Theory and Strategies module? Or would you recommend following the modules in the given order?
Thanks so much for the kind words, and I\’m glad Varsity is of help to you 🙂
You can skip FA and move straight to Options if thats what you want. No problem with that.
Hello Karthik sir!
As a 24-year-old beginner, I have a few questions:
#1. What should be the minimum capital to start stock trading?
#2. What are the requirements to become a pro trader?
#3. Is it a good approach to start with F&O as a beginner?
1) There is nothing like a minimum required. You can start with as small as 1000 too 🙂
2) Good understanding of markets, human behavior, risk management, and discipline
3) Nope, start small and slow before you take on F&O and leverage trades.
Okay sir. Btw I want to start paper trading before jumping straight into real trading. Is TradingView a good platform for that? Can you suggest some more terminals?
Yes, you can look into that 🙂
Ok. Thanks for your guidance 🙂
sir, I have some queries
1. what is streak? For what purpose can I use it?
2. what does the meaning of these lines mentioned in CPR topic -\”when EOD CPR is calculated, previous month\’s OHLC is referenced and so on\” Is it means that if I see today\’s CPR range, its data is of previous month.
3. I did not find floating order tab to buy or sell while using chartiq?
1) Its a back testing platform
2) The line explains what it means, not sure if I get your query fully
3) I\’d request you to call the support desk for this.
(1) Sir, do you think that retail traders don\’t have any kind of edge when it comes to intraday/Positional trading in F&O, people like jane street and other prop traders are using algorithms and High frequency trading and all.
(2) You views on EMH ( Efficient Market Hypothesis) theory.
1) Edge comes from your intellect in markets, and it plays out well when it comes positions that can be held for longer periods. Scalping, HFTs etc latency matters, and there systems and execution matters. Retail does not have much chance there in my opinion.
2) Well, all public information is easily factored in by the prices, but I think there is still scope for superior analysis stemming from deep domain understanding.
Sir, really keen to learn how to use Kite APIs to automate trading.
(1) Will you teach non tech folks like me who want to benefit from this. You simplifying it through varsity would be bliss.
(2) If not you, please ask someone from your team to make videos on how to use Kite APIs to automate trading. Really need of time.
Please keep a track here – https://varsitylive.zerodha.com/home we may announce something soon 🙂
Hello Kartik sir Aditya here, i am 18 yrs told ( just finished my 12th ), i finished reading the technical analysis
module 2 weeks ago and since 1 week i was seeing all the nifty 50 companies and according to the checklist that u had given , i was trying to find trading options ,( so sir for a beginner like my what i am doing is right or there something else i can do ) ,i have not started investing real money yet i just do paper trading , i mean i wanted to know sir for a beginner have i started in the right way like directly jumping into paper trading or is there some more theory or smtg that i need to learn
Happy to note that Aditya. I\’d not suggest you to get into options right now. Please take time to paper trade, get better with basic buy and hold and then figure other things. Tune your mind to think long term and not short term trades. Short term can happen at a much later stage in your life. Good luck.
Ohk sir, actaully by trading options i meant trading opportunities,but sir i was reading the futures trading module now ,so sir should i stop reading this module and read it in future and was trading like a techincal analyst so sir ur saying its better for me to focus completely on fundamental analysis rather than TA at this stage in my life ( btw i am science student 😀)
Yes, focus on FA, learn TA, and mix a bit of both and develop long term thinking in markets. This mind set will help you get better in the long run. Good luck!
Thank you so much sir for your valuable time ,
Happy learning, Aditya. Good luck.
Happy learning, Aditya. Keep the curiosity going 🙂
Hello kartik sir , Aditya here again, sir i was finding it difficult to identify the price action zones while finding the support and resistance level . The first problem was , you had told sir that where prices hesitate to move up or down that region can also be classified as a price action zone but sir how many candles should be in that range or for how many trading session stock should trade in that region . Secondly, sir also u had said if price either moves up or down after hitting a certain level that price range can also be called price action zone , sir so if just 1 or 2 candles hit a price and suddenly stock price drops after that is it still a price action zone or there should be a few candles , i am getting confused on how to properly identify price action zones like are there some numeric factors on that , and also sir one last question about setting targets while trading, is using resistance and fib retracements enough for that i am not confident on setting target either sir, Please could u help me
How many candles = while there is no prescribed number of candles, look for at least 5-8. Thumbrule is that you want the price to hit a certain price point as many times as possible. This is like a validation for that price to be called a support or resistance.
I\’d pay more attention to regular S&R levels rather than fib retracements, but this is my personal opinion though 🙂
Hello kartik sir aditya here , i had a doubt , for example in a engulfing pattern or a harami pattern is it neccesry that the candle on P-2 should cover the entire candle on P-1 ( by entire i mean including the shadows) or is just covering the body of the candle good enough ?sorry if u had already mentioned this and i missed it sir ,
Just the real body is good enough, Aditya.
thank you sir
Most welcome! Happy learning 🙂
Hello kartik sir aditya here , sir recently the Q1 earning of this year of various companies has been announced bcz of this there is a huge dip or increase in prices so sir in such a situation is better to not sell or buy stocks for few sessions ?
It all depends on how well you understand the business and how convinced you are about the future prospects 🙂
Hello kartik sir aditya here, i have read botht the modules of TA and FA , so sir i have a doubt when in some candlestick pattern like bullish engulfing patttern we say its foun on top of a uptrend sir so how many candles before that are enough to say that its in a uptrend , for day trading candles, like are 4 to 5 trading sessions of upward trend enough to stay that the stock is in uptrend?
I\’d suggest you look for at least 2 weeks of data, that means 10-14 candles at least.
thank you sir, sir if the trend only last for smtg less than 4 candles (ie the market is moving sideways with the trend changing every 3 to 4 days ) then it would be better not to invest right sir
Yes, you are better off waiting for a proper trend to emerge and basing your trading decision on that.
thank you so much sir for your valuable time
Happy learning!
Hi Sir,
Is CPR is removed from kite . Its NOT Available in chart.
Not sure, request you to please speak to the support team for this.
hello kartik sir adity here , in the initial few chapters i rembered u had told us to avoid trading candles tht are les than 1% and greater than 10percent of the range , is this applicable to all candlestick pattern or just the marubozu
I\’d extend this to all CS patterns and not just Marubozu.
Hello Kartik sir Aditya here, \”Previous week’s OHLC is a reference when you plot CPR for 30mins and 1-hour candles.\” sir i didn\’t understand this statement what is the meaning of reference here like do thee previous weeks high , low ,close define CPR for 30 mins or 1hours candles , is it smething like this or what ,sir ?
Does Zerodha provide the ATR indicator using which we can find the stop loss value based on volatility. It does provide ATR band indicator but not ATR value alone.
ATR value also allow to measure volatility also
ATR is there right? on both ChartIQ and TV?
Is it possible to add add Previous Day High and Low points in CPR on ChartIQ?
Ah, we can pass this as feedback to the ChartIQ team. Thanks.
sir,
1.today is 2nd may and axis bank spot chart has formed a shooting star.i was looking for support level which i identified is at 1110.am i correct?
2.when i asked chat gpt about support for swing trading it mentioned weekly support at 1160 and monthly at 1110.and suggested me to use weekly one.but according to the method of finding support we look at 9-10months trend in swing trading.so if the support i chose was right then what to go with???
Maybe you should also ask Chatgpt what technique it is using to identify the support level.
Sir,i have read your every module till marcket stratergies.i want to do swing trading initially.I have thoroughly read your technical analysis module.but please tell me how to start like-
1.initially i was thinking to use trading view free version for analysis.is it right?or any better option is available
2.i dont know which stocks to look for initially everyday.can you pls tell me a way to choose stocks for analysis.
Glad you have read the modules, hope you found them useful.
1) Yes, you can even use the version on Kite
2) You can start with the Nifty 50 stocks.
Sir,i wanted to ask
1.if a price is in uptrend and we see a bearish candlestick pattern emerging.volumes are also in favour but we cant find the resistance as the price was above the point it had ever reached.then what to do in this situation and how to find resistance.
2.i am not finding trading view that helpful due to lavk of some basic features.can kite be used fkr technical trading?
1) You can think of exiting the position if you already had one or maybe reduce the qyantity
2) Yes, Kite has a version of TV that you can use.
HEY!! I wanna ask is that possible to be the TC line below the PP and if yes… then what\’s that mean cause as I go with the formula in one stock i calculate TC line above PP and BC line below PP but in other stock, I calculate it as the TC line below PP and BC line above PP. plis help me in that…
Madhav, since these are at broad-level average, they can technically be above or below.
When we able to sell or by in direct from charts
Please add CPR ( central pivot range) indicator in zerodha individual section
Individual section as in? Sorry, can you pls share more context?
Sir,
I mean to convey something different. Trying below:
Suppose a script, for example Infy.
Last 1 year CAGR say- 5
Last 3 year CAGR say- 8
Last 10 years CAGR say-10.
Since, its inception, say the CAGR – 14.
So, in this context, can one predict its normal CAGR which one can expect from Infy, going forward say in the upcoming 3-5 years? Any suggestion on how to look this type of situation.
N.B: Assume fundamentals of the company is good, no catastrophe in economy occurs in any form from anywhere.
Again, it depends on your investment time horizon. If say it is 3 years, then you can keep 8% as a reference.
Sir,
Is there any way to understand the natural CAGR (approx.) that a particular stock possess? Any idea/way to gain atleast some insight on it?
CAGR is the average, so that is the natural CAGR…of sorts 🙂
Sir, i can see, we can able to drag the floating order window to buy or sell anything from chartiq. And sir, I assume we cannot set target price or stop loss while trading using charts.
Let\’s say I have bought reliance shares through the floating order window and let\’s say I manually set target price and stop loss from the order tab.
Will my stoploss and target price which I set manually will be reflected in the chart? so that I can able to drag my stop-loss and target price accordingly as I make any profits?
Even manually placed orders (aka without using the floating order window from chart) will show up on the chart.
1. Sir, if i have to use floating window to buy bank nifty options, can i use the CE or PE chart? will this be recommended?
2. As i am gonna use CE OR PE chart for buy and sell bank nifty options, can i use the CPR of same rather than bank nifty spot chart? so that it is easy to set target price to exit my existing buy position?
1) You can use the chart of the underlying itself right?
2) Yes, but please back test before you proceed.
Karthik, are there modules for Stochastic divergence and Stochastic RSI?
I dont think I\’ve covered that.
What\’s the difference btw CPR and S&R?
S&R is a place of demand and supply coming in for the stock. CPR is a price base indicator, identifying the same.
Plz provide CPR indicator in kite mobile app.
Sharing this feedback.
The article says:
-> When you plot the EOD CPR, the previous month’s OHLC is referenced.
-> Previous week’s OHLC is a reference when you plot CPR for 30mins and 1-hour candles.
-> Previous day’s OHLC is referenced when you plot CPR for 1, 3, 5, 10, and 15 minutes candles.
Which OHLC values do I use for Weekly, monthly, Quarterly and Yearly CPR plotting?
Sorry, not sure if I get your query fully. Do you want to calculate CPR across all these time period? If you are trading short term, maybe stick to Weekly?
when i want to plot the End of Week CPR or End of MOnth CPR then what period\’s OHLC is reference? Yearly?
No Rahul, check for monthly OHLC, not yearly.
I tried to find out CPR with given formulas but for tomorrow that is 20 August 2024 the Top Centre is less than Bottom and Pivot hws that possible….I tried many times.
High 50728
Low 50283
Clos 50368
Vineet, I think you need to double check your formula once, especially if you are doing this on excel. Pls also compare it with ChartIQ\’s formula.
Hi Karthik
The scan on … feature to find the stock for CASH segment is not available in Streak. Will you please let us know when it will be added or whether it will not be added?
I\’d request you to pls reach out to support desk for this 🙂
Great module sir.
I have one request. If time permits to you and your team, kindly dedicate a separate module for QUANTITATIVE ANALYSIS as well. Kindly suggest books or sources as well to deep dive into it.
Thank You.
Best Regards,
Gautam
Some of the modules are quantitative in nature – https://zerodha.com/varsity/module/risk-management/ and this – https://zerodha.com/varsity/module/trading-systems/
Thank U zerodha for giving such a wonderful tool like CPR its better to see in zerodha trading view version also
Glad to know, happy learning Jyothi.
Sir,
Please take my kind regards.
Learning through the whole zerodha material and studying the markets on daily basis since the last 1 year 5 months, I could do the below two things with good accuracy:
(i) Buy good companies at cheapest prices through fundamental research. However, I could not guarantee when the prices will shoot up.
(ii) Buy companies at such a timing that it can fetch me 12-15% average profit in upcoming 4-6 months time.
The above two has considerably helped me grow.
But after understanding the whole market, I am now daring to take the following:
(i) Trade with stoploss and exit.
(ii) Regarding F&O, I am finding myself averse with regular trades and finding to bet only when markets are giving good opportunity. (May be 3-4 times yearly).
Before coming to the market, I had the desire to be good with trading which I am finding difficult to commensurate with my mind. Could you kindly suggest how to march from this point?
Anirban, I\’m glad you are doing well. Yes, please do keep the stoploss and its ok to trade once in a way, only when your conviction is high on the trade.
Sir,
Any update on when the CPR indicator would be available in Zerodha on Trading View Charts please? Its been long pending since July 2020 as seen in the comments. This is available in ChartIQ, but I find TV is much better aesthetically. Not sure it would take 4 years to develop 1 indicator after so many requests 😉
While calculating CPR range, which closing value do we consider??
Day before close value, or means of previous and today\’s closing value, or post market closing value..??!!
Jignesh, for this, please go through the documentation provided by the charting engine. You will get the exact formula they use.
Thanks a lot!!
Happy learning 🙂
Hi There,
I\’m unable to put CPR in the trading view platform. When I searched in indicators for CPR it is not showing.
Only I can get in the Trading IQ version 2, but not in the trading view platform.
Please let me know anyone what to do.
I\’d suggest you speak to a support executive for this, they will help you with it.
Will be great if you can help/provide formulae for CPR Width calculation.
Anil, I think ChartIQ platform has a documents that explains how CPR is calculated, with all the relevant formulas. Request you to check.
Hi Karthik,
Thank you for all the great work, sir.
I have a question. Based on your experience, which is the best performance indicator for option trading? You have suggested some of these in the Technical Analysis chapter. Could you please provide three or four strong indicator names that work well?
There is no best or worst indicator. They all depend on the market conditions 🙂
Hey @Kartik, while the module for Technical analysis has all the required knowledge for understanding about the trade, can course be added how to set up a trade using all the knowledge here in the trading platform and backtest it? it will be of great help as implementing in real with all the theories mentioned here is always difficult considering only <30% is absorbed from what is read/heard/seen.
You can enrol here for a live class – https://varsitylive.zerodha.com/home
calculated cpr vs charts cpr are different why??
Ah, not sure about that. Even I\’ll have to google it 🙂
Central pivot range is very good indicator. Dont know if the formula is actually correct or not
You can use the indicator directly, without having to worry about the formula 🙂
This is so cool
Happy learning 🙂
yes sir,few of them like trend line,continuos,channel have understood and found very helpful.Some more like elliott wave,time cycle,volume profile,regression line,or anything that could help to analyse charts ,would like to learn and use it.
Sure, we will try and do that Pallavi. More on videos, so please do subscribe to Varsity Youtube channel 🙂
Thanks a lot karthik sir,wld also like to learn different drawing tools in chart iq.I guess even this might be very helpful but dont know their purpose and how to use them.So request you to provide some knowledge about this too.
Thanks, Pallavi. Is there anything specific you\’d like to know about?
CPR indicator not available in trading veiw charts…please update with CPR indicator…and in IQ charts there in S1 And R1…so without these Indicator useless… Please update this indicator in trading veiw charts also… please please…1000 times please…
Sharing the feedback with the charting team, thanks.
Dear Sir,
Is there any source from which I can receive quarterly results of the companies which are publishing results on the same day along with stating whether it is meeting analysts expectations or not.
If it is so, it will be helpful if you could kindly share the link.
Check out BSE XRBL filings for result information, but that wont give you opinions on meeting analysts expectations. Maybe you can check Tijori for that.
It is considered bullish if the current market price is higher than the TC line.
It is considered bearish if the current market price below the BC line.
for this statement which time frame should be referred?
You can use end of day frequency, Amar.
All discount brokers are providing CPR indicator in trading view charts. why zerodha trading view charts not providing. Request to include and also elder impulse indicator
I\’ll pass the feedback. But there is CPR is ChartIQ.
Sir plz refer some books to understand more about technical analysis
You can check out the book on Japanese Candlestick pattern by Steve Nison.
Hi Kartik Rangappa,
The downloadable PDF link on the module doesn\’t include the 21st & 22nd Chapters. Kindly update it.
Checking on this, Ashok.
KYA CPR NIFTY/BANKNIFTY KE SPOT CHART MEIN USE KARNA CHAHIYE YA PHIR FUTURE CHART MEIN ?
When Pivot (h+l+c)/3 is lesser than BC (h+l)/2,then how to calculate TC… As value of TC is less than BC..
But why do you want to make this calculation when these points are readily available to you in the charting engine?
Kindly update cpr on charts..Thanks
When will this indicator be available in Zerodha mobile app ?
It is still not available.
Hopefully soon, Kishor.
Please remove this last \’t\’ in above article:
Thank you.
Checking, will do.
Why doesn\’t the calculated CPR align with the indicator displayed on the charts? I attempted to plot it using the High, Low, and Close of the day, generating CPR for the next day. However, upon activating the indicator, the results diverged significantly from the expected outcome based on the formula. Additionally, there\’s a curiosity about the TC formula—shouldn\’t it be 2xP-BC instead of (P-BC)+P? This is essentially same to the Central Pivot, with a marginal difference. Could you please confirm?
The difference as you said is basis the formula used by the charting engine. You can check the documentation provided by th charting engine company to see their exact expression along with the explanation. Additionally, small differences can also come up based on the closing prices.
Will there be more content in the video series or that\’s it ?
Yes, we are constantly updating the content on our channel – https://www.youtube.com/@varsitybyzerodha
Reg. Central Pivot Range:
In 2020 is was said \”Soon it will be updated on mobile as well.\”. Its 2023, the Company should look into it.
Kya pivot Point indicator ko support and resistance ke liye faydemand mana ja shkta hai
Kya isko use kar shkte hai intraday trading me
HOW TO TRACK ALL THE COMMON STOCKS IN NSE & BSE WITH THEIR RESPECTIVE PRICES IN EXCEL/SMOETHING AND TRACK LIVE OTHER THAN TRADING TERMINAL. IS IT POSSIBLE? LIKE:
COMPANY NAME NSE PRICE BSE PRICE AND SO ON
IS IT POSSIBLEL LIKE THAT TO LIVE TRACK IT?ANYWHERE
Yes, please load the stocks in your Marketwatch.
I want to add all the Common stocks from NSE & BSE in my watchlist and also their prices respectively, Is it possible?
Sir,
Since I begin the first module, my vision on capital market was different and more I keep on going forward (Now in Personal finance), my vision is getting changed every time. Meanwhile, I am stuck with one rather dearth of understanding, as below:
i) Is there way (Technical/ Fundamental) to time market regarding entry & exit?
If yes, I would request if sometime you could kindly float some material on the approach. It would be more a practical thing for newbie like me. Thanks.
1) There are techniques, but none of them are perfect. They all come with their own strengths and weakness 🙂
Hi, I am viwing Trading view for charts on zerodha. I do not see indicator Swing CPR available here. Also Do not see any drawing tool available to draw trendlines.Please help me if i am missing something. Please send copy of reply to my mail as well. Thanks – Shridhar
Can you check ChartIQ once?
Bringing the CPR in mobile is bliss to me…Thank you
Happy trading!
I can see the chart now in kite indicator ?? Is it removed now ???
No Arun, its not.
Hello sir, do you think the pivot points indicator gives accurate S&R levels?
These are all approximates, anyway 🙂
Remember, S&R levels are not exact price points, these are ranges.
Hi just completed the 2nd module and it was as great as the 1st one.
Since I am into trading.. can I skip the 3rd module and directly get into the 4th one i.e. Futures?
Glad you enjoyed reading through both modules. Yes, you can 🙂
Sir,
I have long some shares under CNC for long term investment. However, recently, I noticed that few of the stocks are reflecting under \”Auction\” tab. Why is it so? I am a bit panicked.
Check this – https://support.zerodha.com/category/trading-and-markets/kite-features/auctions/articles/participation-in-the-auction
In trading view chart :
when the CPR will be added?
Sir, I would like to know more on intraday trades. Can you suggest some good sources/ material/book on it?
All the patterns that we discussed here can actually be used for intrday also.
Sir pls put study material for using draw tool for average line, volume profile , Tireoneline, regress line
This is the study material, Usha.
Best lag raha he
Hi Karthik,
I love the article but, i have one question.
Why the TC position is changing with times. Some times BC is on top and some times TC is on top. This really confusing me. Could you please provide more detail on this please.
With moving prices, these are bound to change. However, the rate of change of TC and BC varies.
When will these feature available in phone?
On line 16 it’s written CRP I/o CPR
Checking on this.
very detailed and simple language and well illustrated. Summary of points /check list is very good
Happy learning!
When will this be made available on TradingView charts?
No timelines for this, Shiva.
Can I use this standard CPR indicator in Tradingview platform in Zerodha?
CPR is available in ChartIQ, not Tradingview.
We need CPR indicater….in kite app it\’s a request from users
Noted, I will share the feedback with the team.
sir,i completed learning technical analysis that you taught us very well.Its been 6 months i\’ve been trading with indicators.Now i\’m using chart patterns , price action methods like supply and demand,that is more interesting to learn also.i\’m not good at price action because i didn\’t learnt it from any where rather than some youtube videos.So i kindly request you to make learning sessions about price action that will let everyone including me to read the charts properly by drawing trendlines and all those stuff.
Arijith, do check this video once 🙂
https://www.youtube.com/watch?v=z0Rwoz6PduM&list=PLX2SHiKfualEyD05J9JsklEq1JFGbG6qJ&index=3
The pattern at the DCB bank chart cannot be a morning star cause the P3 candle\’s CMP is below the P1 candle\’s opening, also P3 doesn\’t open on a gap-up.Neither does P2 look like a spinning top. Doesn\’t this violate almost all the rules of being a morning star that you mentioned, Karthik sir ??
Mrinal, you will have to look at this from a price action perspective. Do check this – https://www.youtube.com/watch?v=z0Rwoz6PduM&list=PLX2SHiKfualEyD05J9JsklEq1JFGbG6qJ&index=3
Could you check this please……If today is a narrow range day, tomorrow’s CPR will be a narrow ranged CPR…
If today is narrow range day than Tomorrow\’s cpr will be wide right
Supar
Can you publish pivot point concept . I mean pivot point indicator in Zerodha Chart IQ
Making a note, will try and update.
Cpr not available in kite
Yes, it is. This chapter is about that right?
CAN TC AND BC CHANGE THEIR POSITION? SOMETIMES TC IS BELOW AND BC IS ABOVE AND SOMETIMES BC IS BELOW AND TC IS ABOVE.
They are averages right? The change with prices.
thank u 🙂
Sir, where can I learn tread lines, breakouts, types of trends, eg. Cup n handle and all, please add the reference.
I\’d suggest you pick up any book on dow theory, that will give you all the information.
Hey Kartik
The CPR indicator on Zerodha doesn\’t seem to indicate the correct levels. I matched it with CPR indicators from many charting softwares.
Can you cross verify if the CPR levels are accurate in Zerodha, and that it is consistent with all the indicators generated by others?
Thanks
I guess you are referring to intraday values? It\’s mainly to do with the way you consider OHLC.
Hi Karthik sir,
I verified the data and it is fine, only doubt is Can the Bottom CPR value be above the top CPR ?
if closing price is near to low, I am getting top CPR line below the CPR line and bottom CPR line is above the CPR.
I couldn\’t find the answer on the internet, please clarify this.
Thanks
Satya
It maybe be possible, although I need to double-check this once.
Sir, the CPR is not available. Pls could you advise how to get.
Check ChartIQ for this.
Hello Karthik sir,
I need your small help to understand the CRP. if the prices are High: 109 Low 100 and Close is 102, then
Pivot = (109+ 100+ 102)/3 = 103.66
Bottom CPR = (109+ 102)/ 2 = 105.50
Top CPR = (103.66– 105.50) + 103.66 =101.82.
If closing price is near to low, then bottom CPR is higher than the top CPR. Can the Bottom CPR value be above the top CPR. Am I missing some thing here ?
Thanks
Satya
Satya, I\’m not sure..maybe you are missing some point here. Maybe in calculation. Can you recheck the data once?
Very informative…
Need more in depth.
Sure, in which area do you need more coverage?
CPR – R1,R2,R3 & S1,S2,S3 are not showing in ChartIQ
Please do check with support for this.
what is formula for camarilla pivot and woodie pivot in zerodha latest version
Not sure. If you are looking at tradingview then search Camarilla formula + trading view formula and you will get the document.
Why there are difference in value of TC & BC in zerodha and tradingview. Sometimes there is narrow CPR in zerodha and wide CPR in trading view and viseversa.
Can you check with the support for this?
When cpr will come on mobile app
Not sure at this point, but hopefully soon.
Great work i have to say. Enjoyed reading this stock market educative Chapters. Hats off to the Author.
Happy learning, Sathya!
Candle stick indicator is not available to me in kites iq chart
Not sure why, please call the support desk, they will guide you on this.
Why Now CPR Indicator not in Zerodha Kite Platform…Please add
I am not getting CPR Indicator
You must be looking at Tradingview; try ChartIQ instead.
sir can you tell which specific area are you talking about
now I can trade by using technical analysis or I should wait till i complete read all modules
Why dont you start paper trading with whatever you\’ve learnt and evaluate and improve on specific areas.
How to add Money Zone Pivot Levels and Camarilla Pivot Levels
I did googled but i cant find these important things
Please do check with the support team once. Thanks.
Zerodha ki ak badi gandi Kami h Trading view jysa chart nahi h … trading view me koi bhi setting apne aap auto save ho jati h baad me kabhi bhi koi bhi stock ho wahi setting milti h template ki lakin zerodha me nahi yahi sabse gandha kaam h zerodha ka …
Excellant chapter
Happy reading!
Please tell me how to draw a circle(not ellipse) on the zerodha trading view chart.
I\’d suggest you call the support desk and get help on this.
sir please tell me regarding the lookback period for intraday ,swing trading ,and also for scalping.
For intraday, I\’d suggest 15 mins chart for at least 3 months. For positional, I\’d look at EOD charts for at least 1 year.
Very useful indicator for intraday trading.
Regards,
http://www.TractorJobs.in
For beginners like me it\’s great lerning
Happy learning.
When it will be present in TradingView charts ?
No timelines on that, Sandeep.
Hello !! I want to learn about advanced technical analysis and I have completed this module. Can you please suggest me some best books\’ names that can help me in this ?
Shubham, I\’d suggest before you read anything more, practice what you have learned for a few months. You will then know which areas you\’d need improvement in.
cpr is not avilable in indicator list. please add
Its available on ChartIQ right?
In mobile kite doesn\’t show CPR and total OI chart plz include it
Noted, Sagitha.
The candlestick pattern is not loading in mobile app i guess.I tried it in chart iQ.😔
Ah ok. Try it on web 🙂
How to apply charts in CPR?
Sorry, as in?
Hi, why don\’t you accommodate CPR in trading view charting, bit useful to us
Will pass this as a feedback to the team.
CPR option is not there when I try to use the split screen with 2 charts. Could you please resolve this.
Passing this as a feedback to team.
Sir so far could not find CPR on mobile kite pls do it will be helpful for many of us .
It is not available on Kite mobile.
so which to follow , which is better any idea ?
I\’d always prefer simple S&R levels and moving averages.
sir , why there is two different level of pivot points levels , as in chart Iq as compared to trading view . THE cpr is the middle value of pivot point in chart iq not in trading view why ? pls tell .
Anukool, the way these are calculated is different. Hence the final values are different as well.
why CPR is not available on tradingview chart software
Because that indicator is not supported in the version we have. ChartIQ is great though.
Will we ever add Visible Range Volume Profile? https://www.youtube.com/watch?v=i1xjh79XC4U
Its about time premium version of Trading view can be added at a fee on Zerodha
what if the stock breaks CPR ?
Then the expectation is that the stock price will continue to decline.
If the current market price of a stock is at 50 and its upper circuit value is 10% i.e, 55
A-If I place a buy order at 54 and at the same time my friend places an order for 54 then will the order be executed,
B -Even if the both orders (mine and my friend\’s) wont get matched but can someone buy a stock at a price higher than the latest trading price and if there are sellers on that price then will the order get executed
If the order will get executed at 54 then will it show in the candlestick chart (closing price may be near 50 as it was at that demand zone but will the candlestick show the high price as 54?
1) Yes, provided 54 is within the execution range
2) Yes, this is how the best bid and sell get built
3) Yes, if 54 is the high price, then the candle will have an upper shadow marking the high as 54.
In the year 2020 you told it CPR will be updated in mobile app, still it is not deployed…
This CPR is static CPR. is there any Developing Pivot Range(CPR) available in study of zerodha chart? it would be helpful if added.
Not sure, need to check.
Hello Karthik,
Warm Greetings 🌹
I hope you are doing well 😊.
I would like to ask you if the technical analysis works in any situation? With the war between Russia and Ukraine the market looks highly volatile and I am not sure if it is good for trading (price action).
How should a trader behave under such circumstances. Is it advisable to take new positions based on price action if all the criteria in your checklist are met. Or, is it best avoided to trade under such circumstances as the market looks highly volatile. Can you please shed some light on this.
This particular phase should be very interesting for traders (especially those who are new and learning) to observe how the market behaves under such situations.
Thank You
I\’d generally suggest you decrease your positions when trading the market in such situations. There is too much volatility in the market right now, and you don\’t want to expose your capital to such volatility.
In kite
How can we check the candlestick patterns in chart using chart IQ
There is an indicator called candle patterns from the drop-down menu, please click on that and load the indicator.
Sir, you say you trade only the pullbacks. What\’s really the logic behind this?
In case you missed the original rally, then pullbacks give you another chance to enter the trade.
Candlestickpatterns ko identify karane wala point
Sir where I will find the candlestick pattern point
Pattern point? Not sure what that is Keshav.
hey ! do you have any plans on teaching about Elliot wave anytime.
if no, then where can I learn best about it the way you teach
Not really, Shivansh.
P3 opening should be a gap up, plus the current market price at 3:20 PM should be higher than the opening of P1
In the above candlestick pattern CMP is not more that p1 opening price then how it would be morning star candlestick pattern?
Its the close price on P3 we are referring to, Keshav.
What if the current price is below the CPR and trend is bullish. Also the CPR is Wider ranged .
Naveen, I\’d suggest you place your decisions mainly based on candlesticks patterns (bullish trend) and look at the indicators as a supplement study.
Understood Sir 🙂
Karthik Sir, i have read TA module fully, worth sir thanks a ton and sir i came cross one indicator which quite famous which \”super trend indicator\” yours views on this Sir?
Muthu, most of these indicators are systems developed by someone else. I personally don\’t like to rely on it much. The bulk of my trading decisions is based on candlestick patterns themselves. Indicators are a good supplemental tools for helping me make my decision, but not the main one.
Thank you for your reply Karthik. I am amazed how you are able to reply to our comments and that too well with in a day. There are many other modules and I can see you there as well. I am spellbound 🙏🏻
I guess you are really enjoying & loving what you are doing. That\’s some character you have showing the upbringing of you by your parents🧡
I mean LBP is the Look Back Period. All the questions I am asking are relating to Chapter 19, I am unable to post a comment over there (not sure why), so posting here.
For you reference I am posting my query again here:
1 & 2) Referring to Chapter 19, 19.3 – Look Back Period: Look back period is simply the number of candles you wish to view before taking a trading decision.
What is that we are exactly viewing in the candles in this LBP? Can you please specifically mention few things (at least 1 or 2 points) that we are looking in the candles in this LBP. Like if prior trend can be determined, S&R can be plotted etc.
4) Prior Trend – This is where I am getting a bit confused – if I can make out the prior trend for my particular trading decision based on prior 8-10 trading sessions, then what is the Look back period of 6months – 1year is for in swing trading?
Referring to Chapter 19, 19.3 – Look Back Period: Look back period is simply the number of candles you wish to view before taking a trading decision.
What is that we are exactly viewing in the candles in this LBP? Can you please specifically mention few things (at least 1 or 2 points) that we are looking in the candles in this Look Back Period. Like if prior trend can be determined, S&R can be plotted etc.
If Prior trend can be determined from Look Back Period, doesn’t this trend differ from the prior trend that we make out viewing prior 8-10 candles? If so how should our trading decision be made?
Thanks for the kind words, Jidugu. Yes, I love markets and helping people find their way through this 🙂
I should have guessed what LBP means, don\’t know how I missed that 🙂
1&2) When you look back at the candles, you are simply trying to gauge the market sentiment for a given period. For example, if I\’m doing a swing trade, I\’ll look at the market from say 10-15 sessions prior to get a sense of how the market is moving. If I\’m planning a long trade, and the candle suggests a reversal, then the look-back period should suggest a bearish trend.
4) For 6 to 1 year kind of trades, look at least 1 year of data (end of day data) to get a sense of how the market is doing. YOu want to see momentum driving the stock prices for the last year and you should be buying in during a short-term correction.
I hope this gives a perspective to your other queries as well 🙂
Hello Karthik,
Last couple of days, I have been asking few questions in different chapters of this TA module and am receiving your reply for all of them. I wholeheartedly Thank you for solving my queries.
I have a couple of queries in this chapter as well- (I am asking these from Swing trading perspective)
1) LBP of 6m-1y for swing trading – What is that we are exactly viewing in the candles in this LBP? Can you please specifically mention few things (at least 1 or 2 points) that we can look in or make out of LBP. Like if prior trend can be determined etc.
2) LBP for S&R at least 2years: Please let me know if my understanding is right – Say today in Feb 2022 I identified Bullish Engulfing pattern, if I plot the S&R levels, will the S&R lines look like they run from Feb 2020 to Feb 2022. Is this what the LBP mean in this context?
3) BTST – To avoid the risks involved in BTST you advised us to trade highly liquid stocks. How high the liquidity has to be? Can you please quote a number? May be 30,00,000? Because in general you asked us to look at stocks with volume of at least 5,00,000.
4) Prior Trend – How many previous candles should be looked at to determine the prior trend? There could be at least two prior trends isn’t it? If I look the previous 20-30 candles it could give us most recent short term prior trend and we use the LBP of 6m-1y, it could give us prior trend from longer perspective. Should both the trends be same when making a trading decision? As in the above example, if the short prior trend (previous 20-30 candles) is downtrend for a bullish Engulfing pattern but the longer prior trend (based on LBP 6m-1y) is not downtrend. Should this trade be avoided/skipped? Or can we say that it need not be avoided, but if the long prior trend is also the same, that could be a double confirmation to our trading decision?
5) Time Frame – Can we use the same EOD charts for:
a) Identifying candlestick patterns,
b) Identifying Prior Trend,
c) Plotting S&R levels etc.
For what other purposes we may use the EOD time frame for?
Is there any time when we may be required to use Weekly time frame or other time frame for swing trading?
6) Referring to 19.5, part 2, point 7: “If the steps 1 to 5 are satisfactory, I proceed to calculate the risk to reward ratio (RRR)”:
There are actually 6 steps mentioned over there and the 6th step being Dow patterns confirmation. Is this a typo error or only following the first 5 steps is enough for calculating the RRR.
Can I take the trade without confirming the trend with Dow patterns? What could be the chance of successful trade ignoring Dow Patterns.
Thanks a ton for reading through our long queries and addressing all our concerns. Thanks a lot.
Can we use emojis in our comments? Because when I use emojis the comment is not getting posted.
Glad you found my comments helpful 🙂
1 & 2) LBP, not sure what this means, can you please share some context?
3) To get a sense of liquidity, see the difference between the bid and offer price. The lower the difference (spread), the higher the liquidity. Nifty/Reliance/Infy/TCS Futures is highly liquid, see the spread on these and then compare that with the stock you are looking at.
4) Again, I\’m unable to figure what LBP is, but to get a sense of prior trend, evaluate your trading time period. If its say for swing positions, then at least 8-10 trading sessions will help
5) I personally end up using EOD almost always 🙂
6) Must be a typo 🙂
There are no guarantee in markets and TA, just that these things enhance your odds of making a profitable trade, keep that in perspective 🙂
Emoji – I always use this \’ 🙂 \’
Thank you for the reply.
I posted another query in Chapter 19-The Finale – Helping you get started, but I dont see the question over there. It took good one hour to put my question in the right way to hep you understand what I intended to ask, But alas, I think I need to do it all over again.
Is there is possibility to check if the question I asked reached you.
Thank You.
Ah sorry about that, I don\’t know why the post got missed. Did it include a URL?
Hello Karthik,
Warm Greetings,
The candle stick pattern on the Chart IQ is a brilliant feature. Its a boon for beginner like me who can use it for learning purpose. I think it would best suit us to first identify patterns and cross check it with this feature to check if are on the right path. That\’s just brilliant. Thank you for bringing such a fantastic feature.
Can you tell me if there is any such feature that identifies S&R levels. That would be a cherry on the cake.
Thank You 🙂
YOu can try using the pivot points to get a sense on S&R, but from my experience, I think plotting them manually is better 🙂
I am not able to use Central Pivot Range indicator in my Kite mobile app.Why?
Its not available on Kite mobile yet, Gurpreet.
There is a diff in the CPR values for the 5, 15 min time frame when compared to the Trading view. Can it please be fixed so that there is no confusion. No sure how much reliable CPR values are in Kite.
Kanhu, please check this – https://tradingqna.com/t/why-does-two-charts-of-the-same-timeframe-look-different-on-the-same-platform/4715
Yet to get this feature in mobile app 🙁
Sir,cannot find CPR in kite!
Please switch to chartIQ, you will find CPR.
I have observed that on Daily chart CPR changes after one month and on hourly chart CPR changes after a week. What is the logic behind this and how do I calculate CPR for daily, weekly and monthly charts?
Thats because of the way how OHLC is considered for the different time periods. Check this thread – https://tradingqna.com/t/why-does-the-same-technical-charts-for-the-same-stock-from-nse-tame-google-finance-yahoo-finance-amibroker-not-match/1688
I am unable to use CPR in zerodha\’s mobile app
Its not available on mobile yet, Gurpreet.
I got problem regarding Certification test at varsity app.
In instructions it shows that you can give 3 attempts to qualify the test but it didn\’t gave me second chance for the test.I get 170/250 in first attempt and didn\’t get in the passing criteria. (75%).
Kindly guide me how will I get second attempt for the exam.
Checking this, Amit.
Super 💯 & very simple tell you thank u very much
Happy learning 🙂
In Tradingview chart Please do avilable facility of chart layout save in cloud. so we can use it at any laptop with login, At present its only save in current session.
Noted, will pass this as a feedback.
hey, I want to use a trading view of yours, but there I haven\’t found CPR indicator can you guys please do so which is very useful.
CPR is available only on ChartIQ for now.
How to add central pivot range on zerodha charts? It doesn\’t show in the indicator list
I\’d suggest you call the support desk for this, they will guide you easily.
Dear Sir,
It is noted that sometimes in options, even though the underlying is moving well, the option is not moving and stuck at one place.
Why is this so? And how can we avoid this?
I generally buy ATM calls.
Thanks and Regards,
Satish NL
Its because option premium is a function of many different variables, not just the movement in price.
Is it possible that BC is higher than Pivot point??
That is unlikely.
In 22.3, Top CPR = (Pivot – BC) + Pivot ie, Top CPR = BC
Right?
In my tools there is not cpr I\’m mobile
CPR is not yet available on mobile, Manoj.
I cannot find central pivot range in my app please help !!
Renu, switch to ChartIQ in Kite web and you\’ll find CPR.
Calculation of Central Pivot Points is incorrect. Please check.
It\’s not the standard calculation due to the way ticks are streamed. There will be some differences with respect to standard CPR math.
Unable to find cpr in study section
How to find cpr in zerodha?
Manish, please switch to ChartIQ in Kite to get CPR.
Where is Central pivot range in kite , it\’s not showing there
Try ChartIQ.
I am using Zerodha kite since last one year over my SmarPhone..But I am not getting CPR…STOCHASTICRSI…Other additional indicator in CHART IQ…As mentioned by you.
To get those additional Indicators in my chartIQ..What shd I do..Plz advice
CPR is not yet available on mobile, hopefully soon.
thank you so much Karthik sir & team varsity. All modules are very simple & understandable, not get bored for a single minute while studying. Very useful study material. Thank you again.
Glad to know you liked the content, Vicky! Happy learning 🙂
Sir
Updated in mobile as well..
Is CPR available for Kite mobile now?
Not yet, Venki.
Do not see CPR indicator in the current Kite( Oct 21) has it been removed?
Nope, it is still available in ChartIQ.
When is CPR and Anchored VWAP coming kite mobile app?
Thank you foe the information. but i am not able to select the CPR when i select the trading view options in settings
CPR is in chartIQ, please check there. Thanks.
When this feature is available on kite mobile
Can you throw some light on this confusion for traders. With respect to Technical analysis tools, what do we decide when different indicators are indicating contradicting outlook. For e.g., if RSI is giving a buy whereas Pivot is giving a bearish signal, then in such cases how do we go about taking a decision. In general, 1) what are some important technical tools that we can rely on ? 2) how important is the tool itself for a buy/sell decision. This is all in the context of swing trading.
I\’d always suggest you base your decision on candlestick patterns, and not really on indicators. Indicators can be confusing. In fact, I\’d suggest you stick to just 1 or 2 indicators that you know really well and stick to it.
Why study option is not available on trading view? I prefer trading but it has less indicators than chartiq.
In flag pattern we keep pole of the flag as target from breakout point
Should one avoid even if there is any previous resistance
And if there is bearish engulfing in a uptrend and target is not achieved should one wait till target is achieved or exit
Sir I asked lot of questions..I\’m really confused no friend or person is there to discuss
Thank you
Bharath, once you initiate the trade, you need to ensure that you stay invested either till target or SL is triggered. Btw, feel free to discuss here, don\’t hesitate 🙂
I\’m implementing what I learnt..just keeping low of the candle my sl gets hit and moves
Which method should I follow.. just follow current one
Any advice
Good luck, Bharath!
Sir stock as given breakout but RSI is above 75-80 levels should one enter
Or avoid..it\’s overbought
75-80 suggests an oversold region, have explained this in the chapter 🙂
Thank you!
Happy learning!
Pls update cpr in kite mobile version
I am not able to insert CPR in 2 split windows (ex. i need cpr setup for nifty and bank nifty )
Got it. Thank you.
I don\’t have this menu (view, display, studies, layout, events). i have these lists (compare, indicators and templets). not able to include CPR as per your notes.
Please check chartIQ, not trading view.
Please add the cpr indicator
Hello sir there\’s another question linked up from the same chart that there are two trend lines-
i) The trendline from the head and shoulders pattern
ii) The most tested trendline
which one should be considered as important here and please tell the reasoning also, it would be a great help to me:)
https://www.tradingview.com/x/FHSbmTCN/
1) Not convincing for me
2) The first line, because there are more price action zones touching the trend line.
Hello sir, can this be considered as a possible inverted head & shoulders pattern reversing the trend.
If yes then, should we trade this pattern when the price retests the resistance line(earlier a support) or the monday\’s closing price?
https://www.tradingview.com/x/JhOyJjZ0/
Hmm, I dont see how, Mohit. Not too convincing for me I guess 🙂
But how do we fix stop loss in quick trade window?
You cant, please use the main order window.
Happy Teachers day Sir
Thanks, Sriram!
Please add settings for cpr line style(dotted)
Sir,
How to trade with stocks which are trading at all time high.
There is no Resistance.
I do swing trading in CNC.
Please let me know what are things one must see while stock price is trading at all time high?
Thank you.
It is best to swing trade these with a tight trailing SL.
CONGRAT, kartik. The discussion is lively, useful . Your in-depth knowledge in intraday trading and efficiency in handling multitude of queries is what makes you unique and indispensable to Zerodha. Continue like a TREND, thank you, Kartik.
Thanks for the kind words, Anjum. Happy learning!
How to use CPR in kite app
It\’s not available yet, Paresh.
Hi Karthik,
Would you please suggest filter to find Institutional buying stocks in Nifty. I mean by volume and price filter or something else as per your experience.
Hmm, not really sure, Haresh. Maybe you should check screener for this?
Ah, yes sir. I have read it sir. I have been trading consistently for 3 years now.
If I google, there are n number suggestions, so I thought of asking you.
Sure, good luck Mani. I hope you have the best trading experience 🙂
Hello sir, can you suggest books on price action trading.
This module on candlesticks is about price action 🙂
Allright, but atleast create a seperate module for intraday trading strategies, which should have topics on how to select stocks for intraday, etc.
If you have above topics covered then please let me know where.
Noted, Haresh.
CPR seems to be not available when using multiple charts in Kite.Is there anyway to get it added
We will be adding this soon.
Hi Karthik,
I am customer of Zerodha, I oberserved few topics are missing in Versity mobile application. It\’s been a while you commented to cover this topics. However, we are still missing it in Versity app.
Further, I would like to encourage you to conduct a training classes from scratch to advance, because majority of retail traders can\’t \”Trade\” in Market by just reading. Because, I believe there are still certain \”Secrets\” of trading yet to disclose atleast to us as a customer, to be loyal on how a HNI/Institutions Trade is something different I hope you are getting my point. So, I would like to request you to start a initiative to provide training to customers.
Training courses may not be possible, Haresh. We have shared whatever we know here and we will continue to do that 🙂
We are updating the app almost on a regular basis.
Sir when this feature will came on mobile??
We are looking for it.
Please sir do as possible as early
We are waiting on mobile…
Hopefully soon Sir.
When it will be available for mobile?
Also it is not available for multichart setup in Kite Web
Its on the list of things to do, Devdatta.
now remove this chart in zerodha kite why this Central Pivot Range remove pls tell me why this remove in zerodha
Its not removed, still available in Kite (ChartIQ).
Why the CPR is not available in the Trading view chart?
Trading view has not made it available yet.
Will there be any updates on candlestick pattern for trading view
Nothing in the near future.
Hi Karthik,
If a stock is trading at all time high, then what could be the Target price while trading ?
Its tough to set targets, best if you keep tight stop loss and trail the position.
Sir,
Your work is phenomenal and I am vary grateful. It would be better if you throw some light on Elliott Waves and Gann Theories. In this regard, it is requested to cover these in the way as you have done others.
Thank You.
Thanks for the kind words, Chandan. I\’ve not used these theories myself, hence I don\’t have any experience to share 🙂
when is this feature coming to mobile?
The team has this on the list of things to do.
How to add CPR indicator in kite app in mobile. Not getting the CPR indicator itself when tried on mobile.
Its not available on the app yet, Mahesh.
What the correct bottom CPR
If the market price is very high from the cpr so should we take a long trade or should we wait to let the price come down to cpr
I\’d suggest you wait. See how it goes on a paper trade and then develop your logic.
In kite app, full cpr not able to see. Means CPR 3 line,TC,BC and central pivot. Pls provide solution.
Hmm, not sure why. Maybe you should look at this again.
Dear Sir,
I have observed that the CPR calculation value in the KITE is different from the Trading view application, could you please explain which one to be considered.
Regards
Srikanth
Thats because of the way OHLC is treated, I think the chapter has this explanation I suppose.
When it will be available in Mobile?
Why didnt u give full info of CPR consisting S1,S2, S3 and R1,R2 and R3?
I\’ve shared whatever I know about it.
Why CPR indicator is different in zerodha kite mobile application ..
CPR is not available in Kite yet, Sandeep.
Please provide R1 ,R2 ,R3 AND S1 S2 S3 in CPR
Why didn\’t zerodha added some last chapters in PDF?
I Will have this checked, thanks, Aditya.
When compared to trading view and chariq there is lot of difference in the cpr points.same foemula is used to derive in tradeiq but the lines are totally differnt in chartiq.this is mislead the trading analysis.
Every engine used a slightly different formula, hence the minor difference. You need to see which works better for you.
i use this strategy in crypto trading works most of the time
Ah ok. I\’ve never looked at Crypto 🙂
how to trade with quarterly results ? sometimes even after posting expected estimates price sharply fall for 2-3% & vice versa
Yup, it depends on what the street expects versus the actual results.
Hi Team,
Not able to save multiple charts window with new Save name.
daily we need to set multiple charts(2/4) as per our study/style of trade requirements, it consumes more time to do daily.
in multiple charts section have only to save individual charts to save option.
Ex – Need Reliance, HDFC, SBI, Kotak on one window (zerodha have multiple charts options to view these in one window using 2/4 multiple charts option under display section)
but not able to save this whole window and next day again we need to add all 2/4 stocks using multiple charts.
Checked in all the way dint get any information regarding multiple charts save steps it consumes more time to do daily.
could you please help me on the above or i missing any content.
Laxman, I\’d suggest you speak to the support desk about this. Easier to help over the phone.
When i plot 2 charts in the same tab and try to put the CPR study on it , it doesn\’t work out
Please do call the support desk for this, Prashant.
Hi,
Is this cpr introduced in kite or not?I\’m not able to find it.
Yes, its available. Check chartIQ.
why is this feature not in mobile.?
Hello – not able to find candle study pattern in kite. Is name changed ?
No Sir, it is the same. Thanks.
Unable to update CPR
Is there an option on Trading View where if I use a drawing tool(trend line/ Fibonacci etc) on a particular stock and after reopening the same I do not need to redraw the same?
Also kindly please an alert feature on TradingView if possible, that would be of huge help.
Thank you.
Yes, you can save it as a template. Check this – https://support.zerodha.com/category/trading-and-markets/kite-web-and-mobile/charts/articles/tvlayout
How save trendlines in chart
Yes, please.
Please add more indicators(Candlestick Pattern, Pivot range, etc) on Trading view.
Noted.
Also, it is requested to keep updating the pdf in case new chapters are incorporated in future.
Sir,
The pdf provided for the technical analysis module contains only 20 chapters whereas the module contains 22 chapters. It is requested to add the remaining chapters as well.
Noted.
Thank You
Good luck!
Please update one more indicator.
\”Relative strength compare to Index\”
I\’m not sure, need to look it up myself 🙂
Hello Sir,
Back in the day when you actively traded did you work from home or had to go to an office?
Why did you stop if you were profitable? Was joining Zerodha\’s education team a more profitable venture to make you stop trading?
Was working out of the office with the Zerodha team 🙂
Dint really plan anything in life, just went with the flow.
Hi, I\’m not able to find cpr indicator in mobile app. Is it removed?
Its not enabled yet.
Hello Sir,
What was you basic set up back then? Did you use multiple screens or only used a single screen?
Also doesn\’t Nikhil Kamath trade, is he allowed to?
Single screen…but later had a dual-screen for a while. Nikhil is the only exception, he runs a hedge fund 🙂
Central pivot range indicator is not available in zerodha ChartIQ chart when you use multicharts. Please look into the matter so that trader can use cpr with chartIQ multichart layout
Checking.
Hello Sir,
What exactly is your trading set up?
What indicators do you generally use?
Do you use different indicators for different time frame and different for F/O and Delivery and Intraday cash?
I\’ve stopped trading, Harmen. No one at Zerodha is permitted to trade.
Hi Karthik, I couldn\’t find a reference in the chapter or in the comments where it explained why it was directional downtrend even though CPR width was wider. Can you please guide me to it.
The stock\’s general direction is in a downtrend, that\’s what I mean.
it is really helpful for many beginners sir so pls make more and make many happy traders sir
ps:
thank you so much sir
Good luck, Aravind.
In the graph for section \”current market price is less than that BC\”, the market trended downwards even more than previous day, even though the CPR width is greater than previous day. Would appreciate your view on this.
Hmm, I\’ve tried to explain this bit in the chapter and in the comments Prabhat. Please do check. Thanks.
After nearly one year CPR is not provided for mobile
Sir,
Why is there no option for CPR and candlestick patterns in TV? Why are the indicators not saved on TV?
It will take time, Manash.
Sir,
The candlestick identification and CPR is not being found in the mobile app. How can it be found??
It will take some time to show up in the app.
While calculating pivot points for EOD or swing trades shoul we take weekly or monthly H,L,C
And number of pivots back,should I leave it as default
EOD data is fine, Bharath.
Ghatiya site hai ekdum
Hi Team,
Could you please make CPR tool available for \”trading view\” type of charts? only pivot points standard is available.
Thanks,
Umashankar
It is on the list, but will take a bit longer.
Karthik Sir, can you please confirm; whether Candlestick Pattern feature shows Dow formations, or not? Thanks.
No, these two are different. However, the more experience you gain, you can start to notice Dow behaviour in candles as well.
Kb aayega CPR and OrB
I can\’t find this on kite search.
Please look at this in ChartIQ.
How to set targets for swing trading?
You can look at the support and resistance levels to set targets.
CPR, Stockchastic RSI etc these new tools are no updated in my kite app.
Or is there any procedure to update the new tools.
CPR is not available on the app yet.
When CPR will be working on kite mobile app?
Hopefully soon.
Hello Sir,
What is the difference between Central Pivot and Fib Pivot and Carmilla Pivots?
Could you care to explain?
I\’ve not really used Carmilla Pivots, so can\’t really comment on it.
We are not to plot cpr on chart on kite. Cpr tool not available on study tools.pl. provide us this tools.
Are you using Tradingview or ChartIQ? You need to use ChartIQ for CPR.
How do we scan stocks for this? Is there any way we can use previous close nse/bse data to identify stocks?
Can we also use this swing trader if used on a day candle/heikenashi?
thanks
Vishal, maybe you should check with Streak for this.
Please add this chapter in hindi soon
I request you to start my all indicator
Candlestick Patterns
Stochastic RSI
RSI divergence
MACD divergence
Stochastic divergence
Central pivot range (CPR)
Trade from chart
Nothing to start, it\’s available to you by default.
Dear sir please activate
Candlestick Patterns
Stochastic RSI
RSI divergence
MACD divergence
Stochastic divergence
Central pivot range (CPR)
Trade from chart
my id NT2273
Dear sir please activate pivot range
my id NT2273
Candlestick Patterns
Stochastic RSI
RSI divergence
MACD divergence
Stochastic divergence
Central pivot range (CPR)
Trade from chart
Dear sir please activate pivot range my id NT2273
It is available for all to use.
hey when are we having risk to reward position indicator [long and short position] in chart iq i think it is only there in trading view it is not in chart iq
Not sure, need to check with the team.
My kite app doesn\’t show CPR in studies, how to get it?
Its not available on the app yet.
While placing two chartes in one screen i m not able to use CPR indicator in chart iq. Can you pls fix it. Because for trading one needs to go through multiple charts.
sir in which time frame its works the best.Plzz reply
EOD if you as me.
Hello sir
I have read all the pdfs but I am still not feeling confident to enter market.
I want to learn more where will I get more material about stock market plz help
That is a never-ending quest 🙂 I\’d suggest you start with a small amount and take a few trades to see how it goes for you. Dont be afraid to make small mistakes. You can learn from this experience. Good luck 🙂
CPR is entered as CRP at the top after \”Let me list a few\”…
Ah ok, thanks for pointing 🙂
Dear Sir,
Many thanks for your tutorials.
Can we use CPR for swing trading(5-10 days )?
Thanks Rakesh. Sure, you can do that.
I tried to search CPR in indicator, but there is no CPR , like the one explained in varsity . Instead I found \”pivot points standards\”. Is it same as CPR ? Can you explain how to set up Pivot, Top CPR and Bottom CPR in Kite ( there are 15 nos. of lines R1,R2……….. S1, S2……….), which one is Pivot , TC , BC ? If I select S1,P & R1 , it becomes Top CPR , Pivot & Bottom CPR ?
Again are \”Traditional\” and \”Classic\” same ?
Did you check in Tradingview or ChartIQ. CPR is in ChartIQ.
Hi Karthik,
Requesting additional features in options trading…When buying an option ex: 14500CE trading at 145 (2 features available)
1) stop loss% 2) Target percentage%
2) Is it possible to show numbers instead of a percentage…Ex: SL 135 or Target: 145
3) if not possible to change from percentage to value in SL% & TGT%…Along with percentage, an auto calculation of percentage to numbers below stop loss percentage and target percentage
You can use the GTT OCO order, I guess that solves most of your concerns.
Is cpr indicator updated in mobile version….also idfc one click ?
Not yet.
I have an zerodha kite account .CPR indicator not shown in studies on my mobile
Yeah, its not available yet.
And sorry sir,because I don\’t no giving answers in 5 minutes. I think you give answer in one two days. Thank you for your too much support and guide. One day I meet with you sir.
Yes sir, but only one time
Sir
Can you tell me whic books I reàd .so I am great technical analyst.whic books you prefer me.
Have you read the entire TA module on Varsity?
CPR and ORB indicator are still not available on mobile app.
This feature is still missing on mobile.
SIR IS PDF FILE KO HINDI ME KAISE DOWNLOAD KRE?
Can we exit a trade using the trade from chart feature after buying?
Yup, by placing an excat opposite trade.
Hi Karthik,
I recently bought a bank nifty call option…I enabled the stop loss for the bank nifty
if the stop loss has been skipped…whose fault is that NSE or Brokers fault
if I bought a bank nifty for RS 100 and put a stop loss at 90…when the bank nifty fell to 80 and my SL didn\’t get hit (executed)
I lost good amount of money because of SL didn\’t execute
Its nobody\’s fault. SL is not guaranteed especially when there is a rapid price change.
Hi Kartik,
May I know why Karthik doesn\’t trade in stocks…..Karthik doesn\’t want to beat inflation or he has 10 or 15 digit salary
Company policy does not permit employees to trade. We can only invest, hence I\’ve invested in few stocks and mutual funds.
what type of trader you are scalper, short-term trader, long term trader…Do you earn millions or billions in the markets
I used to be a short term trader, I don\’t trade anymore 🙂
Can you ask SEBI to increase the time limit for trading…I wish it runs 24*5 🙂
How to enable CPR in Ipad and mobile?
You need to open CPR on ChartIQ. Nothing special for Ipad as such.
How to do forex or currency trading from kite?
Do check the USD INR pair, you can start from that currency.
How to get CPR in TradingView?
Not available for now.
CPR is not getting in studies on mobile
Not able to see CPR in studies . I can see only Pivots (standard) indicator
Its available in ChartIQ, not tradingview.
Hi Sir,
Why discontinued \” Central Pivot Range (CPR)\” indicator from Zerodha Kite Web as well as from Mobile app? Please add this indicator again.
Regards
Sudip Tikait
Its available on Kite web, please load chartIQ. It is not available on mobile yet.
Cpr and candlesticks pattern feature in studies on android isn\’t available?
Not the app for now.
can you please provide the cpr indicator on mobile platform, its like having car withoutsteering, we have to take trades blindly hv already put requests to your technical team but no development in this regard except a mail im response .
This is on the cards, Kiran.
i couldnt able to find \”CentralPivotRange\” in kite chart indicators. Can you guide me to get that indicator?
Please do check this on chartIQ.
Sir,can we do intraday trading by using cpr(means all ranges) or narrow range only
Sir,can we trade on the basis of cpr(any range) or only narrow day.
Yes, you can.
Sir, do you prepare trade journals? If yes can you please share the format in excel or the application you use for the same.
I used, not anymore 🙂
CPR indicator not showing in kite app chart iq.
Sir I use Kite application in my ipad why does the CPR not showing in \”studies\” whule using chart.
Are you using Tradingview? If yes, I\’d suggest you switch to ChartIQ.
Hi Karthik,
Can you please explain more in detail…if I buy any options futures and stocks and get some profits…it won\’t be coming from NSE cash reserves or company cash reserves right?…the other investor or trader is loosing money?
How the system works?
Thats right, Harsha.
Hi Karthik,
In the near future soon the water, electricity, gas, petrol, diesel will be traded as commodities and they become like gold and silver which can\’t be affordable for common people
What is your thoughts
Its quite possible Harsha. These are traded commodities in a few of the developed countries.
Hi Karthik,
Many of the investors or traders use stock markets to beat inflation..to get good returns
What if 1 person gaining is other person loosing…1 person loosing money.? am I right
For the loosing person they may pump more money from interests etc etc or invest in there savings
If the loosing person recovers some losses and previously gaining person brings some more money to recover his losses
This is like a chain…I don\’t see any person being rich except stock brockers
How does they beat inflation when they loose so much money
Thats not true, if it were, we would not have any market legends 🙂
Cpr concept is good..thanks for that especially.. 🙂
Happy reading!
But these are not available in their Mobile platform. When will they be available?
Hopefully soon.
Where can I choose 22.2 – Candlestick Pattern.. I am not seeing that option available..where exactly we need to look for it in KITE.
For this, you need to choose ChartIQ as your default chart option. You can do that in the profile section, check this – https://support.zerodha.com/category/trading-and-markets/kite-web-and-mobile/charts/articles/how-do-i-switch-to-tradingview-charts
CPR, RSI divergence, Stochastic divergence indicators to name a few are available in chart IQ only when we use a single chart. However, when we use multiple chart options like 2/4 charts, they cannot be loaded on to the chart.
Are you sure, Deepak. Do call the support desk once for this.
Hi Karthik,
I see in the future a big stock market bubble coming…Are we depending too much on the global markets for Indian markets direction….Europe, China, Japan, America, Australia, Japan…Brexit etc, etc
Why do we have to track China Job markets, Production data, American Jobs?.
What is your opinion
Because Indian markets are dependent on global inflows and btw, all markets are interconnected. None of the markets operate in isolation, they are all interconnected at some level.
In kite mobile app CPR not available not on chart iq not on tradingview.
Yeah, please check the previous comments. Thanks.
Hi Karthik,
After studying most of the comments…50% of questions are cpr on mobile when it will be available
For introducing 1 new feature on mobile how hard it is?
How big companies like what\’s app or Facebook or Instagram brings new feature with in weeks or days..?
Yeah, I understand. But we operate on limited bandwidth and the team is brimful with a list of tasks with priorities. So have to be done accordingly 🙂
Hi Karthik,
Any plans for launching the kite app in tv screens.. I would like to trade in large tv screen:) charts, moving averages, cpr, Bollinger bands etc etc will be more clear in tv\’s
Smart watch trading
Zerodha should come forward…what do you say
I hope I can join your team and motivate zerodha
You can always use the TV screen as your main monitor and open Kite there right 🙂
How can I use CPR in tradingview chart? sir
Not available for now, its only on CHartIQ.
Hello Karthik,
After Studying all the patterns for trading Intraday, So much noise, and can\’t guarantee whether if I have taken a position it will be successful or not (Not Sure?)
I understand all these are important topics and patterns….May be Long time investing is more profitable than intraday trades
I\’d like to believe that as well 🙂
Still awaiting CPR to be added to Kite mobile. Any update on this?
No sir, hopefully soon.
Cpr is removed, I am not able to see today
Can CPR be used for positional trades?
Yes, you can.
CPR is used for long trade? Or is it just for intraday trading?
Best for swing positions.
Hindi me update nahi hua yeh wala chapter
We are working on it, we will update it soon.
when did demand and supply zone module release waiting for it in technical analysis module
The entire candlestick pattern is in a sense about demand and supply, right?
Hello Karthik,
We request you to provide screeners in zerodha.
pease provide stock recommendations for short term & long term perspective
YouTube live webinars on trading
Why most of the stock market books are in hindi, English
What about regional languages!?.
We dont provide tips, we rather prefer educating our clients. Converting the content to regional languages is a very elaborate and expensive affair, given our bandwidth, this is the best we can do.
Thanks Karthik.
CPR will be calculated based on the previous day close, low & high right ?
Rakesh, the input will be based on the previous month\’s OHLC for the EOD candle.
CPR showing in Kite is not correct. date-16-Feb-2021 (Bank Nifty)
Details:
Pivot = (High + Low + Close)/3 = (37449.9
+36405.1+37306.25)/3=37053.75 — Values used of 15-Feb-2021 to calculate the CP of 16-Feb-2021
But in Chart IQ it is showing -37110 and it is varying with 5 min and 15 min candle. CPR should be same for any time frame for the day right ?
Please correct me if my understanding is not right.
Rakesh, you need to ensure you are taking the correct period data. Do check my note on the same.
Still this feature is not available to mobile users. When it will be extended to traders/inv
Esters using mobile.
Understand, this is on the list of things to do for the team. Hopefully soon.
I hv just completed reading and found the information very useful, but at the end I m confused between duration n Timeframe on charts. Under S&R duration is 2 years, under positional is 6- 12 months. what duration we should take for weekly n Intraday ?
For duration of 1year if we change time frame like 1 week , or 1Day or 1Hour the candlestick pattern changes altogether , however the duration is same . What are the time frame to choose while checking for patterns in charts of particular duration ?
YOu can look at EOD chart for weekly and 15 mins chart for 3-4 days for intraday.
I am not finding the central pivot range indicator in kite chart . Please advise
Please check that in ChartIQ (within Kite).
When will CPR be available on mobile?
The team is looking into it, Viren.
Yes sir,other checklist to confirmed
Listened to your podcast sir,very inspiring and motivating🙏
Thanks, Chandu. Glad you liked it 🙂
https://drive.google.com/file/d/1D3UxW5kpUWVpMc57dB9lAM65xOjEGQPe/view?usp=drivesdk
In the above pic which I\’ve shared,it is bullish harami right sir I\’ve marked the candle
But to confirm I used in built function in trading view which identifies candelstick pattern,but it\’s not showing the candle where I thought it is harami
Please confirm whether I\’m wrong or app function
Yeah, that looks like a bullish harami pattern.
When will the CPR feature be available on mobile as its very essential.
The team is aware of this, its on the list to things to do.
Please provide filter for narrow cpr
Trade now button not available in TV chart mode, kindly update
Checking this.
Still not showing CPR tool on mobile version
Its not there on mobile yet.
I am unable to find the \”Studies\” or the \”Central Pivot Range\” on my Kite…. Please help.
Not available on mobile for now.
Mobile app please update cpr indicator are not valid
Is it possible to add previous time frames high and low along with pivot points ? it would be very useful .
Not possible I guess. We get these from the charting engine providers, this will have to come from them.
Sir
Which time frame is best for trading CPR for intraday
EOD if you were to ask me.
Normal candle or heikin ashi candle which is more suitable for trading CPR
I\’d suggest normal candles.
Is this feature available on mobile yet?
Not yet, Deeksha.
CPR is not available on Zerodha now, why?
On Kite web, it is available (ChartIQ), not yet on mobile.
CPR along with pivot points has proved to be quite an effective indicator for trading. Have been making fruitful trades for the past couple of weeks. Thank you team Zerodha
Happy trading, Rajesh!
Please publish a book on Zerodha Varsity
Why cpr is not show in chart on my phone please answer
Working on making it available.
hai sir iam mujahid pls tell me correct calculation for bottom range pivot point
Excellent
Please mail CPR Rules
Thanking you
This chapter explains whatever there is to CPR.
When will CPR come to mobile application?
Waiting for it☹️
The team is aware of it. Its on the list of things to do.
I am not able to see CPR in KITE web or mobile or even in pi
Has CPR feature updated in mobile.
If yes than how to use it?
Not yet, once updated, the usage will be the same.
Please help me calculate the CPR
High- 80.05
Low- 77.15
Close-77.85
Please help me to calculate the CPR
High- 80.05
Low- 77.15
Close- 77.85
Still waiting for CPR on kite mobile android app.
When is it coming?
Not able to see CPR indicator in zerodha. Can you help me please?
Are you checking ChartIQ? Can you please confirm?
Central pivot range (CPR) chart not showing plz provide chart
Please use ChartIQ.
Please provide the feature in mobile asap. Waiting since 6 months after taking confirmation from customer care.
Its on the list of things to do, Prasad.
Hello Karthik,
Every stock has its own movement style.
If I do research in 3-4 stock thoroughly but the thing is Nifty 50 stocks not much volatile if I make entry then its difficult to maintain 1:1 R:R. only out of 7 days one day we can catch big move rest are range bound or SL hits.
& Banknifty movement is based on major banks like HDFC,ICICI etc. so if one down & other up finally its neutral. Only sometimes its observed that all banks up/down then we get unidirectional movement that is also very low probability
I am stuck in creating strategy so at least 1:1 can achieve
Please guide.
Janesh, do check the top ten stocks from the mid-cap universe.
i didn\’t see cpr in recent zerodha chart view. when you are gonna add?
Sir, the team is aware of this. It is on the list of things to do.
Hi Karthik Rangappa, the varsity has given me a good view of the markets, a suggestion I want to seek from you, I would like to know more in detail about Technical Analysis and Intraday Trading. Would you let me know an individual from whom I can learn or learning from a book is ultimate?
I\’m not sure about individuals, Amith. What else apart from the things we have discussed here you are looking for?
Also, if yes then while plotting CPR and pivot points, the CPR gets automatically plotted for month and no option to edit to for a week. Is it because using weekly CPR for swing trading is not advisable and hence the same hasn\’t been developed by the zerodha dev team. Any help would be much appreciated. Thanks
Ah no, this is because of how the CPR formula is structured.
Hi,
Can we use CPR tool for swing trading? i.e. using 1d time frame with CPR being plotted weekly or monthly along with pivot points?
Thanks
Can we use CPR for swing trading ? i.e. using 1day time frame and use CPR tool for a week or month maybe?
Thanks
Yes, you can.
Waiting for the feature to be available on mobile
The team is aware of this, Jigar. They are looking into this.
Why CPR option is not available on mobile???? Help me
Working on it, soon.
Happy new year sir!
Wishing you the same. Hope you have a great year ahead 🙂
CPR INDICATOR IS NOT AVAILABLE IN KITE PLATEFORM. I SEARCH AS A CPR.
Its available on ChartIQ.
Sir, for a weekly trade trend should be found in which timeframe?
YOu can use EOD charts for weekly also, Mohit.
Pls upload the cpr in mobile app as soon as
Noted.
Hello sir, for an intraday trade, the Higher time frame(HTF) is daily chart where we find the trend, volumes, candlesticks, indicators? and under the Lower time frame(LTF) we mark the support & resistance and the RRR?
YOu can plot all, across all the timeframe. No need to restrict to a particular timeframe!
CPR is not available in TradingView yet. Any idea when will this feature be introduced?
Not sure, we are talking to TV about this.
According to me varasity is too good aap. It will be great help if it is made available in all major indian languages like Hindi, Tamil, Marathi,Gujarati,bengali, punjabi,telugu, kannada and malayalam🙏
It may not be feasible to have the content in multiple Indian languages, but we will try 🙂
Why i cant set cpr in zerodha???
You can, its available on Chart IQ.
Sometimes as per formula tc will be below bc and bc will be above tc
Yeah.
Hi sir,
I have huge respect for you for providing us the platform for learn through your varsity I started my learning journey in stock market from this platform. After spending 2 year I am able to select stock for doing trade but now I am facing similar problem of can\’t able to hold for longer time and book my profit very quickly and later on when I see the stock which I left is at much higher position. so, sir please suggest me how I over come from these problem.
Mantu, I understand this. Have been there myself. One of the things you can do is to sell 50% of your holdings and hold the rest. In this way you get to participate in any upmove if there is any left.
When will tradingview chart support CPR ?
Please check the comments above.
Why you don\’t you provide CPR in trading view charts? What the use of having CPR in IQ charts where we can\’t watch multi time frame charts?
When is CPR going to be available in Mobile? You have given good features recently but are of least use due to this limitations!!
We are looking at CPR on TV and mobile. Hopefully soon.
Hi,
Please introduce CPR indicator even in mobile software.
Noted.
If trade is placed from the quick trade button then how to place SL or SL-M?
Quick trade button is to place mkts orders. If you intend to use SL and SL-M, then it is best if you can invoke the regular market order.
Why zerodha does not provide CPR in Tradingview?
Not for now.
I got a pop-up message on my Zerodha kite about changing margins for intraday from Dec 1, 2020
Can you say clearly what impact on intraday traders? I didn\’t understand it
Kindly reply to me, sir
Hoping so
Please check this thread – https://tradingqna.com/t/peak-margin-requirements-from-dec-1st-2020-its-effects/95864/2
Hello Sir,
I am new to trading, so please do not mind if my doubt appears to be very dumb.
First of all, on kite only pivot points is available but no central pivot range.
Secondly, if I plot pivot points on daily chart, a single pivot line is plotted for whole month. How could this the possible if the price changes daily?
According to formula, pivot line for Nifty 50 on 19th Nov 2020 should be 12,826.8167, but the pivot line plotted on daily chart is at 11674. However if I change to 5 min chart, the calculated pivot line and plotted pivot line matches.
Please can you clarify?
CPR is available on chartIQ, please do check that. Yes, that right, that\’s how the CRP and pivot lines are designed. Also, S&R once formed are likely to remain the same for a long time.
Okay sir just checked my Zerodha Account and they deduct 10000 approx.
Ok. Do check the ledger report for detailed narration.
I will pay Zerodha, I just have a few doubts like the amount I paid on 17th i.e Rs17000 it becomes nil?
Depends on how the underlying has moved and therefore your P&L.
Hey karthik sir, sorry for asking this question here but actually a situation of \’Short Delivery\’ arisen.
On 17th I Shorted IIFL stock of 600 qty @ 110 intraday with 17000 amount approx and due to upper circuit i wasn\’t able to bought them. Now today i got Zerodha notice that those share were bought @123.95 and \’\’Total Amount due to us\’ – 74364. I want to ask if i dont have that much amount in my zerodha account then what will happen?
There will be a debit balance posted on your account and you\’d be liable to pay us that amount.
Thanks Karthik, Please confirm once CPR and pivot points available in multiple charts (2&4).
Yes, will do.
Sir when we get CPR indicator in the Kite for mobile users
Work is on, hopefully soon.
CPR is not available when i select 2/4 multiple charts. Could you please add to multiple charts aswell.
Checking on this.
Which chart is better for analysis ChartIQ or TradingView?
I like both equally. But yeah, TV has a slightly better appeal for me.
Thanks sir.
Good luck, Ankit.
Okay, Karthik sir, Technical analysis is done though I am not able to make money through this, its fine money-making is secondary but I learnt a lot from your lessons thankyou for all of this. Want some book recommendation from your side. I have been doing this for 3.5 years (i am 24 BCom graduate and
CA dropout) maybe somewhere I am doing it wrong I mean trendline or reading patterns etc. If possible guide me how should I pursue my passion for the stock market? I have also tried to get a job in a few financial companies but no one is hiring right now. That\’s all I wanted to ask sir, reply me sir here or you have my email id too.
Ankit, if you are serious about a career in finance and something like asset management interest you, then you should look at CFA certification, it is globally recognised and it opens up many avenues for you.
In calculating the Pivot points, in a day graph, the previous month OHLC is referenced. Is there any specific reason. Further will it be advisable to trade on the basis of the previous month OHLC. Pl clarify
If you don\’t take that way then you wont have a smooth graph and will be highly distorted. Yeah, it is ok to take previous month OHLC.
Hi Karthik,
Greetings. I really like your content and the way you explain it in simpler terms.
I do not find candlestick patterns in studies in kite app. Is it discontinued? Or is it available only in kite web?
Thanks Bharath, will soon be updated.
What is the formula to calculate 15 Min CPR Value ?
The formula is the same across all time frames, have described it in the chapter.
In my Zerodha Account
Didn\’t see CPR
Why ?
Its avaialble in chartIQ and not TV.
Please make CPR available on Trading View Chart [or pivot points – camarilla (H3, H4, H5…) on ChartIQ].
PLEASE CONSIDER THIS TO BE AND FUTURE ENHANCEMENT AT THE EARLIEST. Thanks in Advance!
Either one should suffice as of now…as I\’d like (in fact, most of the flock that I know) study combining CPR & Camarilla Pivot for intraday day breakouts.
Noted.
I am unable to get CPR in my mobile app.. what to do.. how to get it.. please help
How soon is it coming? Any tentative dates to expect this?
Unfortunately, we cannot specify the timelines.
Hi Sir,
I am using web version of zerodha in chrome browser. I can find candle stick pattern in studies and manage to load it. However it does nothing. I was expecting that by just by hovering mouse it will show pattern as depicted in the pic. but it doesn\’t. Am i missing any step?
The patterns are loaded automatically, did you check the historical data?
Thank you so much for your Guidance and help .
1. If there is a series of Narrow Range CPR (at least for 2-3 days ) , can we expect a big move in either side ?
2. Can we initiate Long Strangle/ Straddle in weekly index option? (because the premium will be in lower side ? )
3. Is there any other Indicator/Price action / Set Up by which one can predict a big move before hand?
Regards.
1) Not really, the narrow range can continue for weeks 🙂
2) Hard to time since the range can extent for a while
3) No indicator as such, but CS pattern helps to some extent.
Hello Kartik,
Thanks for the course. I have started to take calls. But most of my calls are going wrong. I understand that it is only 2 days ago I completed the course. And I am obviously making a lot of wrong calls. Please suggest me something about how should I go about practicing before entering the market. Thanks a ton in advance.
Aditya, it takes years of consistent practice to get the orientation right. So you just have to trust the process and continue to do what\’s right 🙂
Kindly ignore the above query!!
Sir
I couldn\’t find CPR or unable to locate CPR on Tradingview but just only standard pivot point (which i could do in ChartIQ). And when pivot point is added then it kind of compresses the entire chart view and making it difficult to read the charts.
Could you please help?
Thanks
Hello sir, is there any trading community groups of zerodha or any other source through which we can join and meet several other traders and learn from them. Or any place you would suggest where i could watch trading setups and strategies of different people.
You can join us on Tradingqna – https://tradingqna.com/ , lots os active conversations here.
The new chart features like \”Central Pivot Range\”, \”Multi timeframe settings\”, \”CPR -Stochastics\”, \”RSI Divergence\”, \”CPR -Stochastics\” can not be added from studies. I would kindly request you to check the same and revert back to me. This is of paramount importance to me as I am a beginner in the Stock market and now decided to invest in the Zerodha platform. Before that, I want to check all these indicators for my own understandings. Hope that I hear back from you soon.
Thanks,
Subir Dey
For now, it can be added from the web, chrtIQ only. Not on the app yet, team is working on it.
Dear Rangappa Sir,
We need developed CPR (Next Day) Level today only after completion of todays market session.
Kindly add in the next Updates, so that we can plan & Prepare for tomorrow in a effective way,,
Passing this feedback to the team.
Does this CPR works for Monthly time frame as well?
Yup, you can use it across all time frames.
Why there\’s no CPR tool included in Trading view charts in Kite?
Need to check with TA team. For now, it is working fine on chartIQ.
I wonder, how you had made all this sir. You don\’t even place ads to earn in the site. I kindly want to know, what made you to do this kind of great gesture?
For the love of doing good and helping people, and growing the markets 🙂
Sir, plz include the CPR on kite mobile application. It is very useful tool. Moreover CPR followers have to calculate and draw CPR manually on daily basis, which is somehow time consuming. Also the biggest problem is that we have to remove those manually drawn lines, after day\’s session (As can\’t keep so many lines mingling with each other). So previous day CPR is not available for reference.
One kind suggestion from me is that –
CPR for tomorrow should be available just after today\’s closing session. So that we can plan the tomorrow\’s trade, and can trade the panned strategy. If tomorrow\’s CPR is not available today then again I\’ve to plot is manually after today\’s closing to plan my tomorrow trade, which is again hectic.
Hoping an optimistic response at your end
Regards and thanks,
I agree I\’ll share the feedback with the team about the updates.
When will your kite app be able to display CPR indicator?Sir,Please let us know. we are eagerly waiting for it.Till now I am not able to see it in my kite app. If it already exists, please tell me the way to find it.
We working on making it happen, Benu.
https://www.tradingview.com/x/gjJO3NHS/
Sir, in the above trade my stoploss is at 170, And the price is around the stoploss but i am queit confident that the price will move up within few trading sessions. So, if the price hits my stoploss should i square off my position or wait for the price to move up.
Well, if you are following a strategy and the strategy requires you to sell if SL hits, then you should.
When cpr will reflect in mobile kite? Under INDICATOR section
Soon.
Can we set cpr in mobile kite app
Soon it will be available.
when comparing the charts, it shows the price as percentage.
please guide is this % plotted
% represents the change in price.
Sir, whether cpr pivot point is available in dekstop & if available whether can I use both the strategy Pivot point & Cpr pivot point , plz guide I am new to this market
It is available on Kite, which is a browser-based application.
hello sir
a few questions and suggestions
1- what is the difference in sgx nifty and cnx nifty(what is cnx)?
according to my understanding sgx is \’Singapore exchange\’ in which Indian stocks are traded.
i- why Indian stocks/derivatives are traded in Singapore?
ii- why are they traded there for 16 hours a day.
iii- can\’t we use this somehow to drastically gain profits?
2- i- I know regarding mails as notification for comments in varsity you have said that many times that mail option for the replies would result in a lot of mails. But can\’t just notifications for the replies to our comments be turned on via mail or message.
I often forget where I had posted and comment and then later on I have to go through every article\’s comments.
ii- if possible reorder comments as the latest first so that one doesn\’t have to click \”View all comments\” every time to visit the latest comments.
1) The index is called just Nifty 50 now, SGX is Nifty 50 listed in Singapore. Not all stocks, just the index
2) Any index can trade in any exchange as long the local exchange enables it. I suppose many FPIs operate out of SG, so it becomes easy for them to track, trade, and hedge. Number of trading hours is also dependent on the exchange
3) I completely understand, we are trying to find a fix for this
4) Noted.
Sir, as you said that-
Buy on a bullish day and sell on a bearish day and not to break this rule, my question is-
1) My target was hit on a bullish and the shares were sold, what do i consider in this situation?
2) I was trading on a range and there was a small bearish candle at the support level with low volumes, so should i buy it on a bearish day near the support zone, or wait for the next day for a bullish candle?
1) That\’s ok. This is a case where you are booking profits
2) Its best if you can wait for confirmation. However, if the support level has been tested multiple times, then you may want to go ahead and take a punt on it.
1. CPR (and pivots also ) on intraday charts are printed bar by bar whereas the value of pivot is constant for entire day (unless chosen option \”continuous\”). If printed for entire day at the beginning of the day it will give an better visual feeling.
2. Option may be provided to print CPR & pivots for last x days only. It will save the chart from cluttering when we take a bigger view of the chart
CPR works a little differently. I\’ll take your feedback and share it with the team.
Hi, I cannot find it from the indicator list ?? Is it removed from the list?
Not really, are you sure you are looking under chartIQ?
kartik sir,
i really thank u for taking me into the depth of stock markets & also educating me to trade. i m not a zerodha client but still i read your varsity. i really appreciate the way u have presented it. sir i would like to know if at all i need any assistance in future will u guide me. can i have your wats app no.
once again thank you very much
Varsity is for all, does not matter if you are a client of Zerodha or not 🙂
I\’m available on this platform, please do leave your queries and I will respond to your queries.
Can\’t Find CPR indicator in Kite. please Help
Please load ChartIQ and look for it under studies.
CPR is not yet provided kite. It will be good to understand the stock movement if it is provided please provide as the earliest.
It is available on ChartIQ, hence this chapter.
CPR is for daily… I suggest you to introduce CPR for hourly also. We get about 7 CPRs, in hourly.
Noted.
Sir zerodha CPR levels only TC Pivot Bc pls add R1 R2 R3 &S1 S2 S3 levels and chart background setting option
Sorry, din\’t get that.
We need CPR in mobile app at the earliest. Please bring as early as possible
Soon, working on it.
Sir Hindi language bhi add Kijiye 🙏🏼
cannot Find CPR indicator in kite , please help
Check the ChartIQ charts please.
Hi, Is it possible to add Weekly Pivot in Daily chart ? if yes, would you please show it ?
Nope, that may not be possible.
Why CPR for current day gets printed candle-wise? Since the data is constant for entire day, It can be printed in advance for the entire day like pivots. It will be a better visualisation.
Current day is based on monthly data right? So it is in advance.
sir,how do we change cpr settings as it is showing only cpr of month\’s?
You change the time frame and CPR will change accordingly.
CREATE CPR SCREENER
Please check with streak.tech for this.
Use ful.
But I don’t get CPR in iOS. Y!??
Please add much needed CPR indicator to trading view charting platform of kite.
Noted.
Hey Karthik,
Is it advisable to use CPR in Swing Trade ?
Regards
Yup, you can use CPR for swing trades.
Hi, Is this available on mobile app?
YEs.
it\’s good. but Available only in ChartIQ. Bring it to TradingView.
Sure. Its on the list of things for us to do.
Thanks Karthik, it is helpful
Happy trading!
Hi,
Is there any option to see pattern of stock from same industry in same plot.
Thanks
Karan
Yes, you can use the compare stock option in Kite, do check this – https://tradingqna.com/t/compare-option-on-kite/6739
Is cpr available on zerodha tradingview charts?
Not for now.
Sir central pivot still not load chart when will get it
Sorry, dint get that question. Can you add more context please?
Is correct line can be used in mobile app? When searching in fx it\’s not found.
CPR is coming soon on the app.
CPR indicator is not available now? Please let me know how to add to my chart
Where are you checking for this? It is available in ChartIQ.
Sir,
If your Pivot Point and Central Pivot Range Calculation is right. Then why your zerodha kite IQ chat and Zerodha trading-view chat is showing different value of Pivot and CPR. According to your calculation your pivot value and CPR value is not match with your indicator value. So please reply which one is right.
I don\’t think CPR is there on TV right?
Please incorporate CPR in tradingview chart type also.
Noted. Our chart team is aware of this.
Is there CPR in tradingview chart type?
Not yet.
Hi Karthik,
I want to select stocks on certain criteria like when any stocks listed only in FNO hits any particular criteria in terms of any technical indicators like moving average/vwap/rsi/…. in any particular time frame, I may get alert. For this I tried Zerodha smallcase screener but didn\’t find anything which may fulfill my requirement. Do Zerodha provide any screener like this? If yes, please let me know how to access it and whether it is free or paid.
Thanks
Have you tried streak.tech?
CPR isn\’t showing up on multiple charts. Could you please look into it? Also, it would be great to have CPR and volume profile (session volume and also fixed range like in chartiq) to TV as well. Kindly consider this request. Great job otherwise. Thanks.
Sure, checking with the chart team for this.
Thank you very much Zerodha for taking this intiative to increse financial literacy in India.
I really enjoy studying through varsity. Recently after studying technical analysis and futures thoroughly I did research on two stocks for intraday trading and the other ones for swing trading.
I studied the market trend of last 20 sessions and did five trades in two weeks on only those two stocks – TCS, bajaj finsev.
Even after the stocks had crossed their resistanced levels, and the MACD, RSI indicators pointed in the overbought stock direction I intiated a short trade on these stocks.After the day I traded thestock corrected its price and the price went down .Still after too much reflection I cannot understand what went wrog.
I want to know if there is any book or anything where we get case studies of succesful and unsuccesful trades where there is content on what went right and why it went that way and in what went wrong with unsuccesful trades.
Parul, at one point, especially after learning the basics, the next set of learnings will have to come from the market. No matter how much you read, nothing beats the experience of real markets. For example, in this case, you need to ask if all the checklist items were followed. If yes, then this is sheer bad luck, else figure out what did you miss out on and if that factor working against you. End of the day, be ready to learn from the market and pay a fee for it. The trick is to ensure the fee is small and the lessons you learn are big.
Good luck!
Hi Karthik,
Another set of valuable information on varisity, cheers to all your efforts!
I have been through all the chapters in this module and learned a lot. Here are few points which will be great if you will help me out with (Please answer with what is your perspective/decision):
1) For Intraday, what time frame do you trace through out the trading hours? (If multiple windows, then do specify)
2) What indicators do you put/prefer when u do intraday?
3) According to you what is the best time for intraday ? (As most people suggest the price fluctuation is more at the 1st and last 20 mins)
4) Any particular thing to watch out apart from indicators and charts and news (For intraday)?
P.S: Apologies for long typing. I want to trace how an institute like you gauge the market/stock and take you the call wrt the charts and indicator. Awaiting for your response! ( Please respond in the order i have marked)
Lastly, (A bit off topic): Will Zerodha introduce something like \”watch the expert\” ? (This is something like, an experience person who does his/her trading and other can mimic it if they want. This is very common in Europe and America.)
1) I prefer looking at EOD chart even for intraday. However, you can consider 15 mins chart as well
2) I prefer simple ones like MA, Bollinger Bands, and the ATR
3) Whenever the opportunity comes by
4) Nothing that I can point at.
The trick is to keep it really simple plus assess the market from both TA and FA perspective. About the watch the expert bit, I\’m not sure 🙂
5. Also, every time when I load the chart, trading view not letting me load the default layout (but this is not an issue with ChartIQ). It goes back to some other layout. Every time, I have to click and select my saved layout when toggling between tabs. Please check this issue as well.
Hi Karthik, Appreciate the work. Please bring this setup to trading view ASAP.
1. Also, in trading view while using Heiken Ashi candles, their original website has facility to display actual closing price on the axis instead of HA close. But this is missing in the chart provided in Kite.
2. Please bring feature to highlight previous day\’s high/low (similar to pivots) on current day candles
3. The \”Trade\” facility is not letting me trade when I select HA candles..While I understand the price points in HA are not actuals, letting me Trade shouldn\’t be an issue. Please look into this limitations immediately.
4. When can we expect script writing (like pine trader in trading view) to setup derived indicators and patterns?
1) Noted, passing this query to our chart team
In fact, I\’m sharing the entire query with them 🙂
Amazing Explanation Sir.
Thanks A Lot.
I have a Query.
Does ChartIQ Provide Multiple Chart Feature?
If it does, how to enable it?
Thanks.
Yes, I\’d suggest you speak to support, they will explain this to you.
hello sir
is CPR a reliable indicator for short term trade lets say a few months ? if yes how reliable? how to use it in a sideways market? also in your experience is this indicator used more for intraday trading or swing or scalping ? is there any chance CPR can be used for long term trading?
THANK YOU
Personally I dont like to rely upon any indicator. I have more faith in candlesticks, which is a manifestation of price action.
nice to read the contents..varsity is very helpful for learning… I really appreciate it… I like everything but… I mean but it will more beautiful if you facilitate cpr indicator in tradingview chart, so many traders are familiar and comfortable with tradingview, now its the situation is like this we should open the same stock in tradingview website as our strategy is having cpr have a good role….if you add cpr in tradingview why should we pay for tradingview website or find another broker………? hope it will be okay very soon
I understand Salil, we are trying to look into this. Hopefully soon.
Tried looking into the Nifty50 stocks since last 3 days,but was not able to identify any stocks that met the criteria as per the checklist.
Can you please make a video on the technical analysis module for stock identification to build more confidence for the beginners?
Thanks Kunal, will try and do that sometime.
Would really like CPR indicator in Trading view.
Noted, hopefully soon.
How can we keep auto select order type as Intraday?
I am a regular intraday trader. Frankly speaking, I don\’t know how to do delivery trading (CNC)
Whenever we try to order it showing autoselect at CNC type only
Today Accidentally I placed CNC order
Kindly reply how to auto select ar MIS order only
Hoping for reply
Thank you
Raju, when you login first time in the day, change it to MIS, it will continue to remain MIS till you logout. Once you logout and login again it will become CNC.
Sir ZERODHA has revolutionized trading which has benefited retail trader like me.
Please introduce Composite Indicator (Constance Brown originator) which can be used along with RSI for timing the market.
Also give 25 min and 75 min candle option
Thanks! Will share your feedback with the charting team.
Please make a chapter on Trendline and Chart Pattern. Please.
Will do sometime soon.
Mr. Kartik,
In reference with yesterday\’s question
Yes sir, I did save them as LAYOUT —-> SAVE PREFERENCES. Kite still deletes my drawings. I do not understand why is this happening. I have made quite some drawings on some charts and I am sure I made the same drawing on couple of charts at least 2-3 times yesterday. I hope you understand that its quite frustrating this way to have your drawings deleted again and again. Also, not all, just some get deleted. Please suggest what to do?
Ansh, can you please reach out to the support desk for this? They will guide you through this.
Sir,
2. Is CPR better for a 15min chart than the EOD chart? Or as a rule of thumb \”higher the time frame higher is the reliability\” works in this case as well?
3. What is the reason behind trading the pullbacks? Why is it not advisable to trade right after the stock price crosses the Top Central Pivot (TC)?
One more question Sir,
4. How long have you been trading? When did you change your perspective from short term trading to long term investing (as you have mentioned in an interview)? Do you still trade? HaHa.
2) For intraday, use 1o mins. EOD can be a bit dated in case of CPR
3) With the pullback, there is a test of support and hopefully buying activity kicks in leading to a bounce in prices
4) I started roughly in 2004-5. Changed my perspective about 6 years ago.
I have learned about CPR recently and after you added this to the TA module, I became confident that this concept is worth it.
1. Sir, is CPR alone reliable? Or should all the other points of the final checklist be intact?
The priority should be candlesticks, all other indicators, including CPR is a supplementary study.
By spotting a patter you mean, first we look if there\’s a pattern in the recent 3-4 days, a candlestick pattern that we know of. And then we look if it aligns with a support/resistance respectively. Right?
Yes, its best of the pattern aligns with the S&R levels. Btw, the pattern you wish to trade on should be as of today.
Hello Mr. Kartik,
I had an issue regarding drawings. I kept drawing trend lines/horizontals/ellipses on charts of a few stocks (about 20 of them) and I expected them to be saved but then when I finished and revisited my first stock, drawings had vanished. Is there a maximum number of drawings or maximum number of stocks that I can have saved. If yes, then how many and how can I increase this maximum number?
Did you try saving them as layouts? If not please do try that, it will work. Thanks.
Sir I have completed TA, futures and options theory module. I appreciate your
hardwork and consistent support to us and an innovative way to teach so that even a layman is also able to understand. Here it was easy to study but today when I started analysing the charts for the very first time I was not able to understand which stock or index should be traded also sir it was very difficult to plot the S&R as in the month of march 2020 almost most of the stocks and index have seen a good downmove due to the corona pandemic. So sir what would be your advice to begginers like me so that I can also atleast start taking positions in the market.
Surya, I understand. The initial few attempts will be difficult. Look at as many charts as possible with a single point agenda i.e. to spot one pattern. Next, match that pattern with S&R, build on it one by one and I\’m sure you will get comfortable with it.
Hello, Karthik
I try to trade on intraday but still I\’m not able to trade, I have very fearful while trading and cannot take quick decisions. I have face big problem while taking trades based on ema crossover. If their is a buying signal or selling signal I feel very unconfident.
Then dont force yourself, try a slower approach of swing trading. End of the day, it does not matter how you make money, as long as you make 🙂
I am using zorodha kite mobile app.But there is not showing the CPR indicator any where.plz help me
Will be updated on the app soon.
Sir
I already know the time frame factor please check with the technical team. Calculations are wrong .
Sure.
Sir
You want me to write down the formula to calculate CPR and Pivot Points ?
Please check zerodha\’s Trading view charts Where pivot point levels are accurate but CPR is not available.
Kindly correct the CPR and Pivot points indicator in Chart IQ.
Kapil, I\’d suggest you read this as well – https://tradingqna.com/t/why-do-pivot-points-differ-on-kite-and-pi-how-is-this-calculated/15780
Totally wrong calculation of CPR and Pivot Points. People will trap it trade on those lavels.
Sure, then please point us in the right direction.
hi, when relative strength against nifty indicator will be available in ZERODHA. Like in trading view RS NIFTY.
Not sure, need to check with the charts team.
Hi Karthik,
Is there any module regarding price action trading strategies?
The entire discussion on candlestick is actually price action. Remember, price action is what manifests into a candle.
Well explained. Looks like a very good tool for intraday. Hopefully it comes to mobile soon. Btw need to know the factors traders need to be vary of while trading cpr. If you could explain the disadvantages also, it would be wonderful to trade with caution. Thanks.
Thanks, Anand. CPR will be made available on mobile soon. There are no disadvantages worth mentioning. Like always, your trading should not depend on this one indicator only.
Hi, whether price alert facility is available with zerodha. If yes, whether it is free or paid and how to use it.
Thanks
Yes, do check this – https://sentinel.zerodha.com/ and its free.
Although these new features are on ChartIQ, is there any possibility to obtain in trading view platform?
Need to check that. For now this is available only on ChartIQ.
I see number of people on YouTube opening number of charts with all the drawings everyday and updating. How they are able to do this is not known? TV has facility for 10 views only. Can you guide me please.
It could be different charting engines. But trust me, its not required. 8 out of 10 times, you just need to concentrate on one or 2 chart to set up trade.
Is there any possibility to view public Library Or making our own script using iq view from trading view, I saw many peers using that
I\’m not sure if they have something like pine script. Need to check.
Sar all chapter in hindi available which date.
Soon this will be updated.
how to change default white background into black in new chart.
Because Every login need to change background chart into black.
Like I said, make the changes and save as layouts.
how to save theme in new chart.
Because Every login need to change background chart into black
Use layouts for this Kumar.
Given a call or tip on bank nifty
The only tip you need to know – trade-in instruments which you fully understand.
Where to find Fibonacci ratios level in kite sir?
Check under the drawing tools.
Kite charts, please check under studies.
Please add the facility of savings multiple chart layout in ChartIQ as it is in TradingView. It is very difficult and time consuming to setup multiple chart layout every day by searching and adding stocks, time frames.
Also I observed that, Account automatically logged out after some time in Kite Web. This is an additional headache as I have to setup the chart layouts for multiple stocks again at the middle of the session. This is really very very disgusting.
There is no auto-logout. Have you shared your password with someone? If yes, change your password immediately. For charts, try saving the charts under layouts.
By day trade I mean intraday trading and scalping. Are ATM contracts best for these type of trading? I know this maybe off topic but there was no other way to reach you.
Thanks!
Yup, stick to ATM options.
Hey Karthik,
I wanted to ask you this.. as you explained about the options in the options module. You said that the ATM contracts are the most sensitive to price changes. So my question to you is are ATM contracts best to day trade?
Yes, they are usually the best bet. However, if there is an excessive movement in the market then OTM options are better, but one wouldn\’t know that 🙂
Last zerodha team added this and removed within a day. I am using cpr from tradingview. I hope this time it is but free and you don\’t revert new updates. Good work guys. 👌
We don\’t intend to, happy trading 🙂
Opening chart is very slow. It takes 15 to 25 second.
Seems to work really fast here. Do check your broadband speed.
Excellent upgrade.
Happy trading!
Sir mobile pe Kab start hoga cpr s divergation. Co oder bhi start kijiye
We will have it soon.
Pivot Boss mentions BC = (High +Low)/ 2. Here it says BC = (High + Close)/2. Please double check.
Ah, yes. Inadvertent typo 🙂
Hi How can i add monthly and weekly pivot points in 15 mins chart
May not be possible in the current setup, Richa.
Sir, we need the order window in chart page facility in Kite App
Will be updated soon.
A good addition, Thank you
Welcome!
Please check CPR formula listed on page. Bottom CPR formula is incorrect.
Thanks, guess the division sign was missing. Fixed it.
Ye chapter bhi hindi me uplabdha karaiye
Yes, soon.
Zerodha is so far excellent with the charts and should provide tools on the charts to draw trend lines and support lines.
Trendlines and support lines are there, please check the drawing tools.
when is this feature coming to mobile?
Soon it will be updated on mobile as well.
Good