
17.1 Introduction
I had to cut the previous chapter short because it was becoming too technical and lengthy. There, we glanced over India’s real estate market and a few parameters to consider when studying a real estate stock. We understood project updates in terms of completed projects, ongoing projects, and upcoming projects. We also learned about unsold inventory and its limitations, which were covered up by the concept of quarters-to-sell.

Now, let’s look at the rest of the parameters to consider when analyzing a real estate stock.
17.2 The parameters for residential real estate
17.2.1 Revenue – Revenue, in general, is a commonly understood term. But you need to look at real estate firms’ revenues with more nuance.
Picture this scenario. There is a newly launched housing project that you really like. Its construction began only last month, and will be ready only 2 years later. You like the project, so you book an apartment. You will pay a booking amount today, some partial payments over the next two years, and the final amount at the time of possession. Now, here’s the question for you – when will the developer record your payments as revenue? As and when you make the payment, or in the end, upon completion?
Let’s say your friend has also booked an apartment in the same project as you did. However, she pays the full price upfront. If the real estate firm records revenues as and when you make payments, your friend’s payment will be recorded as revenue right away, while revenues from you will be recorded over 2 years. It would be a very inconsistent form of reporting.
If the firm records revenues only upon completion of the project, all the payments will keep coming in, but revenues will be recorded 2 years later. But the value is not transferred only upon completion. An apartment’s value keeps getting added and transferred to the buyer on an ongoing basis. I mean, think of it this way: if you want to sell that apartment only after one year, that is, before completion, you will probably be able to sell it even at a higher price. So, there was value generation even in a half-done project.
What is the way out? Real estate firms use the Percentage-Of-Completion method to report revenues. Infrastructure companies also use this method.
If the project is 50% completed in one year after you booked the apartment, the developer will report 50% in revenues. If you have paid only 40% until then, it will still report 50% as revenues, and the rest as trade receivables under current assets. If you have paid 60% by then, it will report only 50% as revenue and the rest as unearned revenue under current liabilities.
What if there is an unsold apartment that is 50% complete? Well, there is no buyer, so there was no sale. That is why it cannot report revenues. So, the percentage-of-completion method is predicated on an actual sale contract.
But the problem with real estate revenues is also that they may not show the full picture. Say, there are two projects and both will be ready in two years. So, their revenues will be reported over two years. However, one gets sold out within one month of launch, and the other takes one year. The revenues just won’t differentiate between the two. And that is why you need to look at a few more revenue-related figures for real estate firms.
17.2.2 Sales volumes (Bookings) – This is the number of housing units sold or million square feet of area sold during a quarter or year. “Housing unit” makes sense for residential real estate. So, if a developer has launched 200 apartments in a new project, and 50 were sold in the last quarter, sales volume will be 50. Volume is a useful metric mainly in residential real estate, and not so much in commercial or retail real estate. However, not all players report unit volume sales. So you will have to rely on “million square feet”.
As far as commercial real estate is concerned, “million square feet” leased or sold is the most appropriate metric. Not all commercial real estate is sold. A lot of it is leased out. So, sales volume may not be a helpful metric. The lease rentals are reflected directly in the revenues. A sale would result in the “percentage-of-completion” method of revenue recognition. Then you also have retail real estate, mostly malls. Again, mall spaces are rented or leased out.
17.2.3 Sales / Pre-sales – This is the value of the number of units sold or the million square feet of area sold. We will continue with the example of a project with 200 apartments that sold 50 units in the last quarter. If the average value of every unit sold is 1.5 crores, sales are worth 75 crores (50 units * 1.5 crores).
17.2.4 Average selling price – This isn’t the selling price per unit. This is the price a developer gets per square foot. When a 1000 square foot apartment is sold for 1 crore, the selling price per square foot is 10000. So, if those 50 units collectively had 60000 square feet of area, and they were sold for 75 crores, the average selling price per square foot is 12,500. Comparing the average selling price across developers may not be useful, but comparing it with the developer’s past average selling price can give you an idea of whether the developer is growing. And then you could compare this growth number across developers to identify which cities are growing or which segments, like luxury, premium, etc, are growing.
By the way, if any developer is reporting their figures in per square meter, you can just multiply that number by 10.76 to get square footage. And, you can divide square footage by 10.76 to get square meters.
Some developers may not report their average selling price, but they will most likely report the “million square foot” area they sold and the pre-sales made during that period. So, you can divide Sales (or pre-sales) by million square foot area to arrive at average selling price.
17.2.5 Collections – This is the most important number one should look at. In the example of the 50 units sold, we know the sales value is 75 crores. But has the developer really received the entire 75 crores? You can know that from collections. Assume you paid only 10% of 75 crores as the booking amount. So, the actual collection is 7.5 crores.
Collections grow as the projects near completion. But if collections remain low, it could be a sign that maybe buyers are unable to honor their dues or the builder has been struggling to complete the project.
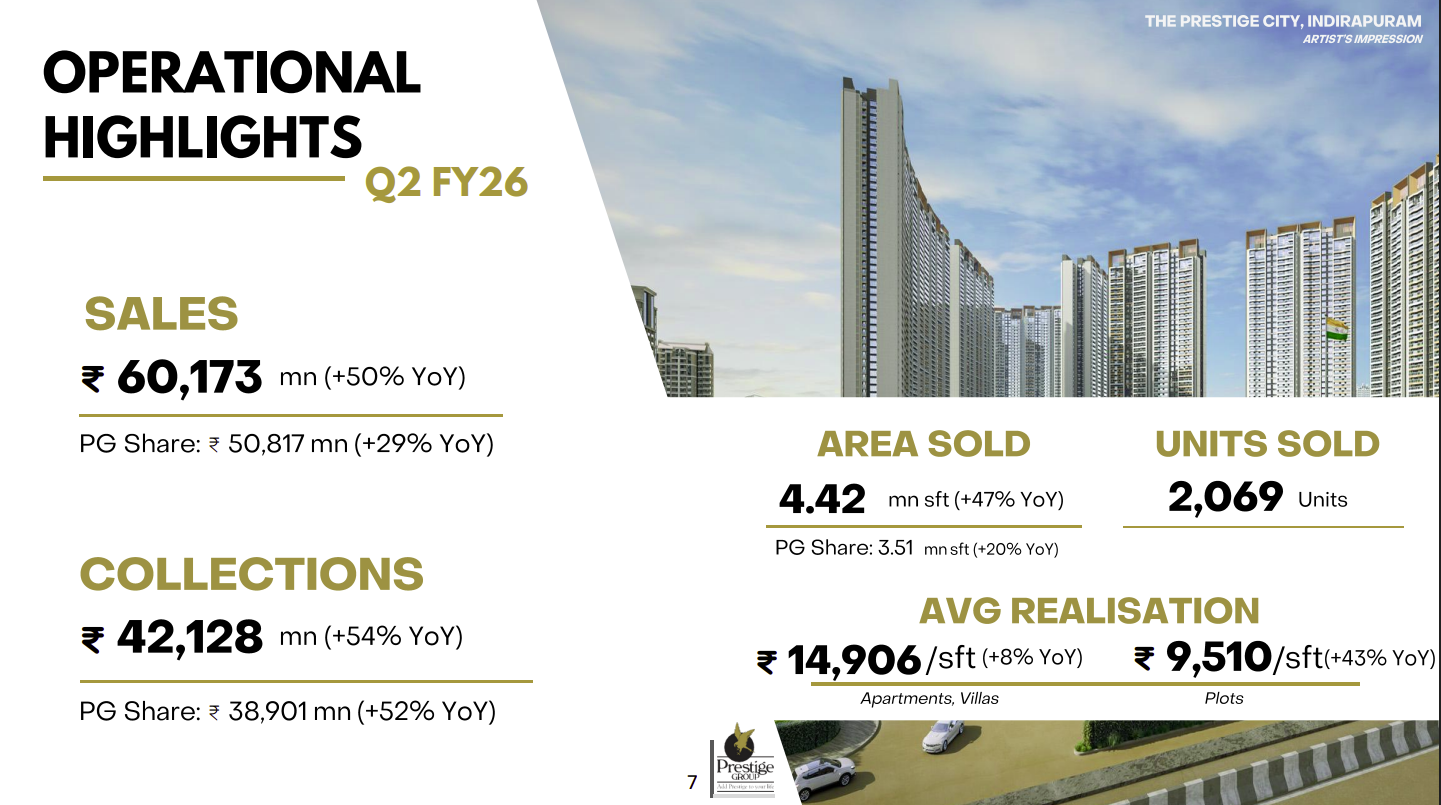
The snapshot below shows Prestige Group’s sales and collections figures. In this case, sales are a much bigger number than collections, because Prestige continues to add more projects, and demand is strong.
17.2.6 Margins – Net profit margin or operating profit margin is easy to compute. It is part of fundamental analysis. So why do we need to mention it separately? Because, like revenues, you need to look at margins with nuance.
You will see that some real estate players have a net margin of 14-15% while others have 35% margin. That is a vast difference. Why so? Is one developer relatively so poor at execution than the other? Possible. But there could also be the case when a developer has done a lot of joint development projects where its share is less than 50%. The developer will have to use the equity accounting method to report the business from such JD projects.
Let’s understand what that means. Under the equity accounting method, revenues and expenses are not consolidated in the developer’s P&L. Only profits from such a business are added directly to profit before tax. So, if you don’t record those revenues, but their profits, net margin will look stronger.
For example, let’s say the developer has two projects, A and B. Both made revenues of 100 crores each. Profit was 20 crores each. So, margin on each project is 20%. The developer has complete ownership of A, but B is in a joint development with a 45% stake. So, the developer will report only A’s revenues in the P&L, i.e., 100 crores. But in profits, it will report 29 crores (20 crores from A, and 9 crores for its 45% share in B’s profits). So, profit margin at the organization level is 29%. And that is because the developer could not report B’s revenues.
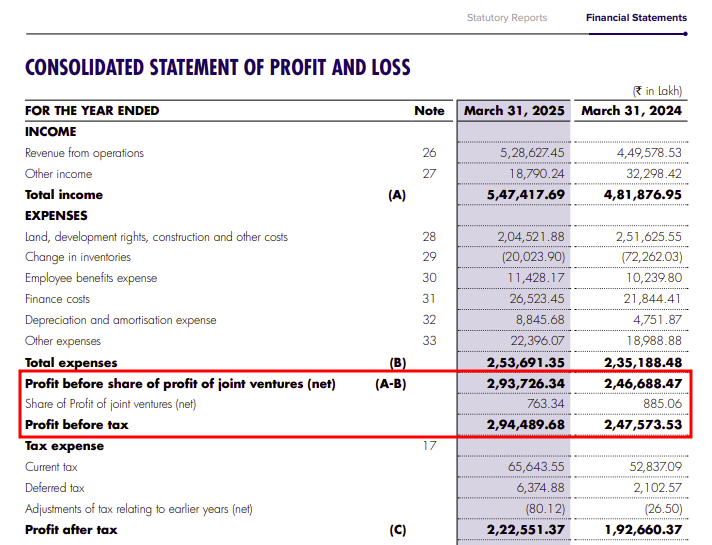
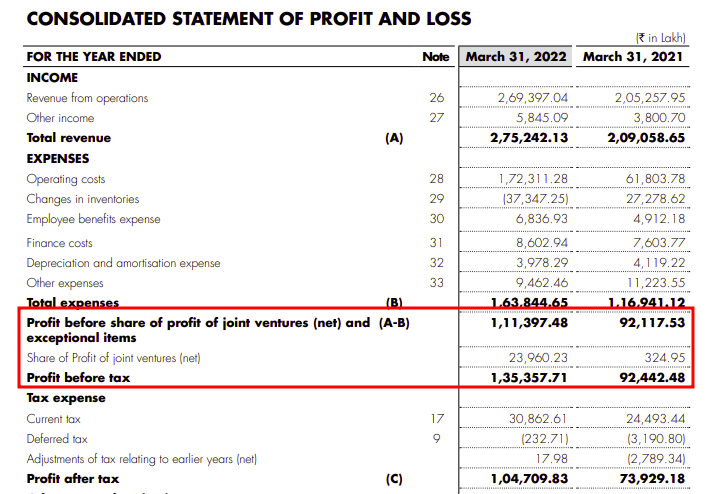
You can see Oberoi Realty’s FY25 P&L. Share of profits from JVs is a small number of 7 crores, or just 0.26%. But if you look at its FY22 annual report, share of profit from JVs was almost 18%. So, just for the FY22 revenues, PBT margin was 41%, but if you add profits from the JV, PBT margin goes up to 50%.
You see, each parameter throws light on a different aspect of the real estate business. You might want to look at each of them collectively to get a holistic perspective.
17.3 The parameters for commercial real estate
17.3.1 Annuity portfolio – Many residential real estate companies usually have some commercial buildings, malls, or hotels in their portfolio. Some also offer facilities management services, which is basically maintenance of some projects. A facilities management company will take care of a building’s security, cleaning, landscaping, pantries, maintenance, and repair work. The commercial buildings portfolio provides consistent rental revenue for the business. It’s the annuity portfolio — when a builder rents out spaces in a mall or a commercial center, the lease rentals provide some stable consistent cash flows to the business.
Leasing is a substantial portion of the revenues of most listed players. Brigade makes 23% of its revenues from leasing, Prestige makes 20%, Godrej makes about 13-15%, and Oberoi makes 15-16%. The idea is that if there is a slowdown in the residential real estate market, the annuity portfolio of commercial real estate will help sustain some cash flows.
So, having these diverse streams, even if they contribute a small portion of the overall revenues, helps reduce revenue- and cash flow-volatility, which is high for residential real estate.
17.3.2 Occupancy rate – In India, this metric is most applicable only to commercial real estate. It could be applicable to residential buildings, too, if they were made not for sale but only to rent out. A few western countries have that concept.
So, let’s say a developer has built 1 million square feet of office space, and 700 thousand square feet out of that is leased out. That means the developer has a 70% occupancy rate. An increasing occupancy rate is perceived well. It also helps to compare a developer’s occupancy rate with its peers. If it enjoys a higher occupancy rate than its peers in the same locality, perhaps it offers a better product and enjoys a stronger brand. An occupancy rate lower than peers might suggest a weak standing of the business and the brand.
17.3.3 Gross Leasing Value and Net Absorption Rate – This is a good measure to know the health of commercial real estate in a city. You would usually get these reports from Real Estate specialists such as JLL or Cushman & Wakefield.
If 15 million square feet of office space was leased out in the last quarter in Mumbai, that would be called the Gross Leasing Volume. However, not all of it was new office space, right? There is a good chance that some existing capacity, which was vacated by one tenant, was leased out to another one. This new leasing agreement will also make it to the counting of Gross Leasing Volume.
What you should really be looking at is the Net Absorption Rate. It shows how much of the leased-out space in a quarter was new. As long as the net absorption rate is positive, new spaces are being added and occupied. The sector is said to be demonstrating strength. A negative absorption rate suggests that more spaces were vacated and fewer were leased. Since business clients occupy commercial real estate, a negative net absorption rate suggests a dull business sentiment, and not just a dull real estate sentiment.
17.4 How to value a real estate business?
We know, by now, that residential real estate behaves differently from commercial and retail real estate. So, when a developer operates in all segments, you must value each segment separately, as separate business units. And once you have valued each segment, you can add them all up to arrive at the overall business value. This is called the sum-of-the-parts (SOTP) valuation method.
SOTP allows you the flexibility to value each segment using a different valuation model. You might choose to value the residential segment using the Relative Valuation Method and the commercial segment using the Discounted Cash Flow (DCF) Method.
In fact, I might choose to apply a DCF valuation method on all segments, but I would still value them separately. The cash flow growth, visibility into the future, terminal value, and discount rate will all be based on different assumptions for each segment. Therefore, SOTP is the most suitable method.
In fact, you might have a business unit contributing only 10% to the revenues, but your valuation analysis sees more potential in it than the rest of the business. So you might see it contributing more value to the business in the Sum of the Parts valuation method.
17.5 Parting thoughts
While there are many standard parameters you can look at when studying a real estate business, the sector itself is highly non-standardised. No two real estate projects have identical size, space, and shape. Proximity to a railway station, airport, or other public infrastructure also has a bearing on the price a project can command. In fact, whether a property overlooks a road or garden also impacts it price and profitability.
In short, beyond the parameters, a lot of qualitative judgement also goes into the process of analyzing real estate stocks. And that is exactly what we did when we covered India’s real estate sector in late 2025: we spoke to industry veterans, observers, and analysts, and then formed our views.
Key Takeaways
- Looking at revenue alone may not be enough. You should look at the developer’s sales volumes, pre-sales, average selling price, and collections to get a proper idea of the full business.
- The net profit might show a misleading picture of a developer’s performance if it has a large number of projects with less than 50% stake.
- Each parameter throws light on a different aspect of the real estate business. You might want to look at each of them collectively to get a holistic perspective.
- Look at a developer’s annuity portfolio to assess how the volatility in residential real estate is being dealt with.
- Occupancy rate, gross leasing volume, and net absorption rates show the health of the commercial real estate business.
Sir will you be adding sectors like pharma/healthcare, Energy, industrial (Engineering, construction, machinery), Telecom/communication, Aviation, Defence etc.
Not sure Prinkesh. Maybe we can make some sector specific videos.
Hai. Iam new to Equity research. What sector will you recommend as a beginner to begin with? Should I go for complex bfsi or any other like automobile or IT. Which gives me a more chance of getting hired?
This is purely a personal suggestion – If you are new, you should pick a very easy sector to work with. This will make you like EQ research more, once you progress through, you will automatically try to analyse more complex once 🙂