Latest Pi update – 18th July 2016
Traders,
Updated 21th Sep 2016
We have the latest release of Pi (version 1.0.0.6 7/18/2016) available for update directly from Pi if you click on Help > Check for Updates. If you are installing for the first time, download the Pi installation file from here.
Here are some of the latest features:
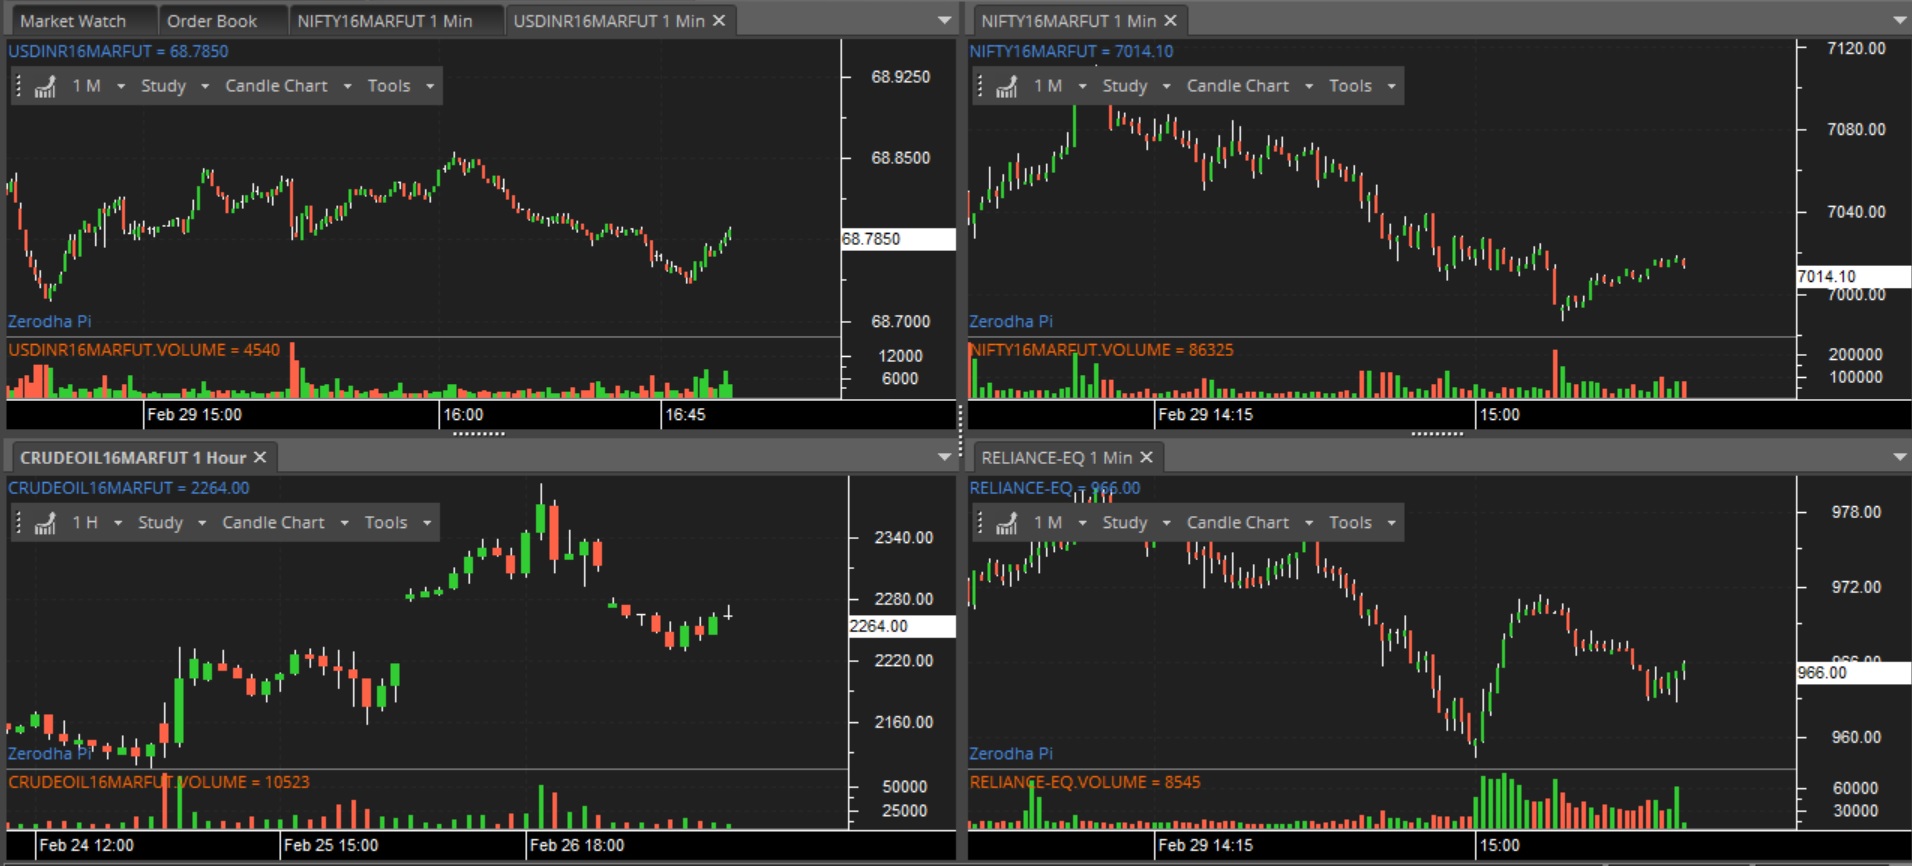
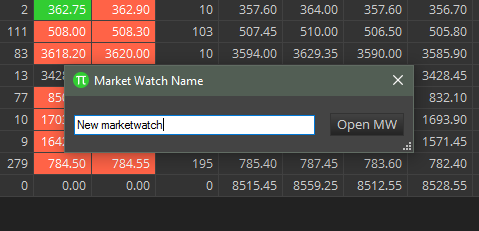
Multiple marketwatches
Create a new marketwatch using the shortcut key Ctrl+W. You can create upto 5 marketwatches with 50 scrips in each. You can use Ctrl+Tab to alternate between marketwatches.
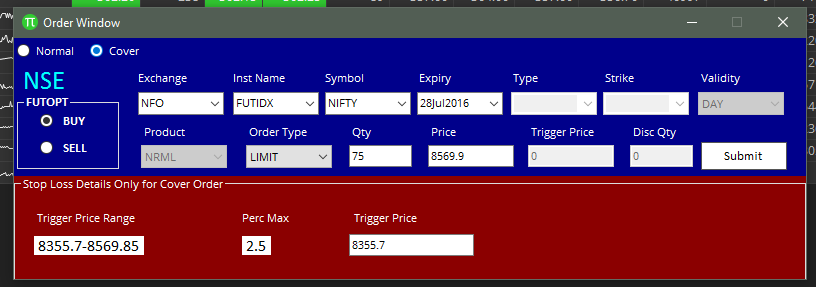
Cover order with limit entry option
You can now place limit orders for cover orders so you can enter at your desired price instead of letting market forces decide the price for you.
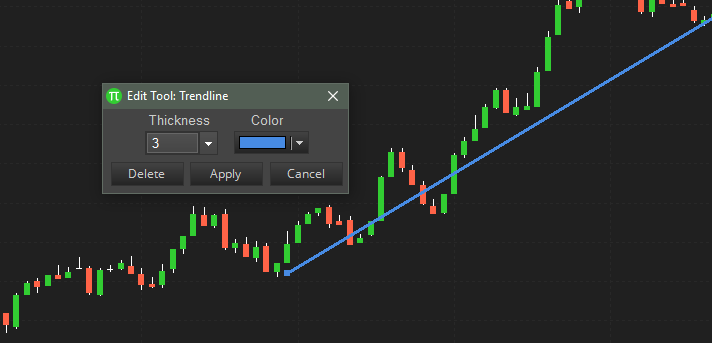
Edit chart tools
Edit chart tools on double and right click (colour/thickness).
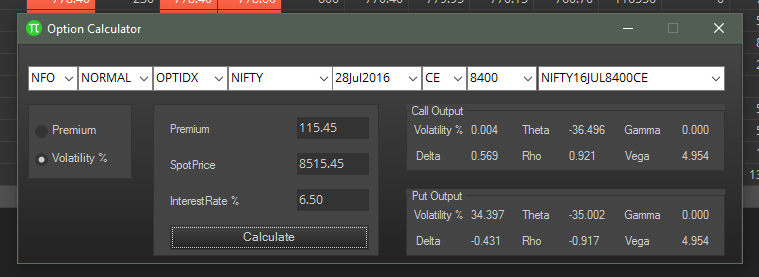
Option Calculator
Invoke the option calculator by pressing Ctrl+O to calculate the theoretical price of an option on the go.
More…
- Find Symbol to add multiple scrips on the marketwatch (Shortcut Ctrl+F).
- Chart Toolbar changes
a)Change Time frame to any periodicity (Min<->Hour<->Daily).
b)Duration added in Chart Toolbar (Days for Min/Hr and Years for Daily). - New indicators introduced:
a) Supertrend Indicator
b) Donchian Channel Indicator
c) Average True Range (ATR) - Add scrips from default workspaces and marketwatch in scanner.
- Hide/show connection logs on default marketwatch (Ctrl+Shift+W).
Latest update 20th Sep 2016
Along with a few bug fixes, below are new features on the latest release.
- Overbought/Oversold Levels added in indicators such as RSI, CCI, and etc.
- New indicators: a. Hull moving average b. Volume weighted moving average
- Pivot lines added: a. Camarilla b. Fibonacci c. Woodies
- Marketwatch link to Excel (Windows 7 or later, XP not supported). Right click on the marketwatch and select link to excel option or use shortcut Ctrl + E.
- Horizontal Lines on charts – exact values can be entered in edit box (for candles panel)
- Saving charts to disk or templates saves horizontal/vertical lines as well
- Vertical Scale Adjustment (PageUp / PageDown)
- Auto re-sync of charts in case of re-connection
- Default marketwatch can be popped out provided total scrips is less than 50.
- All keyboard shortcuts listed under the help menu.
- Intel Dual Core Processor or Higher.
- Windows XP/7/8/10.
- RAM required is 4 GB.
- Display Resolution greater than 1024 X 768
- HDD required is 2 GB free space in the installation directory.
- Internet Connection >=512Kbps and should be seamless.
Visit this help doc as a quick reference guide for everything you need to know about Pi. Click here to visit the dedicated blogpost on Pi being run by Tradelab with videos on various hacks.
Happy Trading,
exception from hresult 0x800ac472 – Getting this error when tried link to excel. pls help with a solution.
how to handle this issue in excel 2013
Error; “Exception from HRESULT : 0x800AC472,
Why cant we add 3rd Future month in Zerodha Pi? Cannot add Nov Future of anything currently as only options displayed are Aug (still). Sep and Oct in drop down menu. Can we manually add Nov Fut in Market wtch in Pi? Help
I have Tried to Link Pi to Excel, how ever after Excel Opens it doesnt show any Symbol or any Value/Number, it only shows ”N.A.”
Second time when i tried to re-link Pi to Excel it started showing an Error; “Exception from HRESULT : 0x800AC472, please try again.”
What please resolve i am not able to get live feed to my Excel?
Arun Mitra says:
August 16, 2020 at 6:30 pm
Sir/Madam
Zerodha
I request you to provide a TradeScript to be used by me in Zerodha Pi for trading breakout of day’s 5 th 15 minute candle of a stock.
Arun Mitra
Sir/Madam
Zerodha
I request you to provide a TradeScript to be used by me in Zerodha Pi for trading breakout of day’s 5 th candle of a stock.
Arun Mitra
how to load all fno stocks in market watch?
please give fno list in ” PREDEFINED WORKSPACE ”.
While saving marketwatch, the lines which i draw in any chart is not saving. How to do it? I mean Can we have marketwatch with lines saved on the chart of the equity?
unable to install latest zerodha pi
Below error show.
”module C:ZerodhaPiTradeScript.dll failed to register. HRESULT -2147024770. Contact your support personnel.”
Can i link the MW to Microsoft Excel so that i can see the LTP in realtime on Excel?
Sir,
OHL Scanner is not working in PI. Scripts can’t be loaded.
So, pl. do the needful immediately.
Thanks,
Best create a ticket on our Support Portal.
Can you please add a pop out or a sound alert for scanner like you have for other alerts.
Hello Zerodha,
How do I add more than 50 Scripts in Watchlist plz Explain, Bcoz there are more than 150 scripts in FnO and I can’t waste all my time making 3 Different Watchlist. Plz Help me with this Problem.
Thank You
Hey Monish, I’m afraid adding more than 50 scrips wouldn’t be possible.
Sir, In the previous version we can able to add more than 50 scripts in the market watch list.
But now only 50 stocks are allowed to add per watchlist.
Please increase the limit or put the option to add more.
Thank you…
Sir
IRCTC symbol is not available in zerodha Pi
Sir kindly add this symbol in Pi too
Thanking you
Tarun
Hey Tarun, all scrips available on Kite should and are available on Pi. This seems to be a system-specific issue. Please create a ticket on our Support Portal, and someone will be in touch to help.
Pi Software has a problem, it showing already expired contracts of Nifty Futures and Options, Not Showing Next month and Far month contracts. Please do the needful.
Same problem With me also any solution ???
Hi,
It has been a really long time, over three years that Zerodha customers have been requesting for VWAP on Zerodha Pi but this has still not come through. This is one of the most fundamental tools for intraday trading and is very unfortunate that it has not been addressed. Can we expect this to be installed any time soon?
Pi being a third-party platform built and maintained by a different company (TradeLab) we cannot comment on the timeline for addition of new features. We are constantly making upgrades to our web platform, Kite, which is maintained by us. I suggest you check it out.
SIR I TRY TO LOGIN PI SOFTWARE BUT CANT OPEN,ERROR MESSAGE COMMING
ERROR : UNABLE OPEN TO THE REMOTE SERVER
Best create a ticket on our Support Portal. Someone will get in touch with you to help.
Please try to ad trading from chart in pie so that we can place horizontal buy or sell line on map directly and when price touches that range order gets executed and all plus try to add stopploss and target as well.
Thank you
While trying to login PI, I am getting an error as “Remote server returned an error: (503) server unavailable”. Request you to please help on this issue.
Uninstall Pi and install the latest version from here.
hello,
While trying to login PI, it is showing error as ”Remote server returned an error: (503) server unavailable”. Please assist on this issue
Please uninstall your current installation of Pi, and download the latest version from here and install.
Dear Sir
In the Pi latest updates the feature showing m2m profit or loss in the snap quote window has been removed. it causes lot of inconvenience. can it be restored please.
sharath
Will be restored in a future update.
Dear Sir,
I have updated PI. I have a problem that whenever i log out the pi the order for the scripts have changed. i need once again arrange for trading. Please Solve it.
Will get this fixed in the next release.
Hi zerodha team , is it possible to add Ichimoku clouds indicator in PI ?
While login in PI error message ”The remote server returned an error :(503) server unavailable” is coming
Hey Pramod, you’re able to login now?
No, till now. not able to login
While login in PI error message “The remote server returned an error :(503) server unavailable” is coming
pl advise, how to proceed
Even I am getting same error : :(503) server unavailable
I AM NOT ABLE TO LOGIN to zerodha Pi, PLEASE HELP.
showing : error 503 server unavailable.
Hey Nikhil, best create a ticket on our Support Portal. In the meanwhile, you can use Kite to access your account.
I AM NOT ABLE TO LOGIN to zerodha Pi, PLEASE HELP.
What is the error you’re seeing? Best create a ticket on our Support Portal and someone will get in touch with you to help.
hi nithin,
earlier i have usdinr spot price at pi, but after update my new market watch does not show usdinr spot price,
kindly help me to find symbol of spot usdinr not FUTURE
Hey why the pivot points and ticker window have been removed form Pi in its latest update??
Hey. We’ll enable these features in the coming weeks. Since the new release has a bunch of changes under the hood to enhance performance and security, some features were left out.
After new update Pivot option is not available in charts or user setting, kindly provide.
Not sure if this is the right thread and I am having trouble finding the right one as I am new to this. I am having trouble finding download links for Pi and Zerodah trader. and which one is better. I don’t see that on the official website anywhere? Are these products discontinued?
I am not seeing SL-Bracket Order in PI , I can only see BracketOrder(Limit) in PI. However Kite is having SL-BO , Can you please let me know when can I expect BO-SL in PI ?
While linking data from zerodha pi to excel 2013, it is showing error- HRESULT: 0x800AC472. I have already installed the required patch but not helped. Please help
from where to download pi software i am unable to find the download option
You can download it here.
Hi,
Today Pi updated (11th Feb 2019), but all of my backtests were gone after update.
How to bring them back?
Regards,
Manu
crosshair value not showing in right side.
selected drawing is not deleting by delete button
Does pi work on macOS?
Pi is a Windows-only platform, I’m afraid.
Sir,
Please combine the MACD and MACD Histogram so that we dont have to place this two indicators separately because by placing this two the space gets too much messy
Not able to login. Please restart again to continue…
getting above error frequently ….
In Pi, link to excel is not working. It giving error ’ Exception from HRESULT: 0x800AC472.
Please help me to resolve this issue.
I have called to Zerodha helpdesk, but they couldn’t help to solve this.
Hey Jerald,
Please raise a ticket in this support article. Someone from the tech support team will get in touch with you.
Any guidance to add ”VTC” order to avoid daily interventions on market limits?
This is on our list of things to do, Trupti.
Zerodha Pi to Excel link not working I am getting below mentioned error
When I use link to Excel, I get error “exception from HRESULT:0X800AC472, please try again”
Dear Sir,
Please Update Pi software like Sharekhan trade king software , we need option chain in Pi software we love pi because quick trade u need include supertrend strategy in expert advisor and so on update frequently full time trader are really like to trade in desktop only please consider
thanks
riyas
Why does it say that if i add more than 50 scrips i.e 250 it will only update rates for the active marketwatch. I mean like on Kite, which updates the rates on all the marketwatches, why cant i do it here. The reason i want to switch from kite to pi is first that chrome uses too much of my ram and second, pi has 1-click trade option which is very useful during price action.
Please dont take this as a hate comment, i love what you are doing and would really appreciate if you could update pi with latest features and possibly more number of market watch.
Thanks in advance.
When i try to open chart from Pi software i am getting error ”Unable to fetch historical chart data for XXX, only live data will be there”.
I have been trying from many days, could you please let me know how can i fix this.
Which stock is this for?
I am not able to trade from Pi, it not giving buy sell form once I pressed F1 or F2 or clicking on buy/sell. rest all working. I have to order from mobile and watch it on pi on computer
Banknifty quotes not available for the day 06 sep 2018. specially on expiry day the date not available for selection and if already selected data not available. for last one month I am facing the same problem.. for example I am getting data for expiry date 06 sep 2018 on 05 sep 2018. but not on 06 sep 2018. the screen is missing the date and data..l
Hey Peter, can you please explain this in more detail?
Unable to login in Pi. Kindly assist!!
Error: Unhandled exception has occurred in a component in your application. Method ”FillReport
in type ”M4.Omne.ZerodhaCbs”
When I use link to Excel, I get error ”exception from HRESULT:0X800AC472, please try again”
Dear
I am having same problem if any one have solution please update
Best create a ticket on our Support Portal. Someone from our team will get in touch with you to help.
pi problem
1.when I open candlestick chart . there is a glitch it shows very big candles . if I want a minute candle it shows very big only 5 candles.
2. please arrange for vortex tool . its very important .
Hey Tejas,
Please raise a ticket here and our support rep will get in touch with you and help you out.
Also, Vortex indicator is currently unavailable on Pi. However, it is available on Kite.
Dear Siva Sir,
Why Chart and Chart tools are disable mode? I have reloaded pi twice on my machine. but don’t work.
Please help.
sir,
is there any update in pi,
from last few days it gives message to update or to exit.
there is no update mention in z-connect .
Hi Munish, yes, Pi was updated last Monday.
Can u share the download link ??
Good morning,
in pi software , can I save the indicators by default so that when i open any chart in future indicators can be seen easily neither i have to add indicators every time
I tried to download Pi from Pi section but I can’t download Pi, please give me link.
Hey Ameet, you can download the latest version here.
plzz alow more than 50 script limit to 100 in Pi software. Tough to trade with such a small amount of script….
Hi Manish, this wouldn’t be possible.
4TH REMINDER……
I have requested zerodha team several times to update zerodha pi with some points missing in pi
1) cant drag chart up and down like we can in kite 2) cross hair not showing price and time.3)cant put price alerts (i use different software to put price alerts) 4) when we put a bracket order it comes in different breakups so when i want to modify for e.g my sl or target price i have to modify each and every breakup order which has been executed.There should be one singel order which should modify all my breakup executed orders.
I REQUEST ZERODHA TEAM TO CONSIDER ALL THE ABOVE POINTS MENTIONED BECAUSE I THINK Pi SHOULD BE EQUIPED WITH ALL THIS ABOVE MENTIONED POINTS .
Ashish, Kite and Pi are different platforms, built differently. Expecting the same behaviour on both would be unreasonable. For price alerts, we have an altogether separate platform, Sentinel. Also, as for BO, this is how the order type was built by our vendor, Thomson Reuters, and approved by the exchange in this form. This cannot be changed.
HI,
my self Lakshmanan M and I have account in Zerodha. while installing Pi software in my laptop some error is coming.
Error showing as per below:
Component Microsoft Visual C++ 2008 Runtime Libraries (x86) has failed to install with the following error message:
”Fatal error during installation. ”
The following components were successfully installed:
– Visual C++ 2010 Runtime Libraries (x86)
The following components failed to install:
– Microsoft Visual C++ 2008 Runtime Libraries (x86)
See the setup log file located at ’C:UsersLAKSHM~1AppDataLocalTempVSDA0F7.tmpinstall.log’ for more information.
please guide asap.
Regards,
Lakshmanan M
8860136184
Hello,
Have you got any solution? I’m facing the same issue.
Regards,
Naresh K
Chart is not opening in Pi since last two days. Please help.
What is the error you’re seeing, Methun?
I have requested zerodha team several times to update zerodha pi with some points missing in pi
1) cant drag chart up and down like we can in kite 2) cross hair not showing price and time.3)cant put price alerts (i use different software to put price alerts) 4) when we put a bracket order it comes in different breakups so when i want to modify for e.g my sl or target price i have to modify each and every breakup order which has been executed.There should be one singel order which should modify all my breakup executed orders.
I REQUEST ZERODHA TEAM TO CONSIDER ALL THE ABOVE POINTS MENTIONED BECAUSE I THINK Pi SHOULD BE EQUIPED WITH ALL THIS ABOVE MENTIONED POINTS.
Hi
In Pi, i want to see the hourly chart for previous 2 to 3 years like it is in Kite. But i see it is restricted to previous 60 days in Pi. How do i overcome this ?
Hi Krishnakant, this wouldn’t be possible on Pi.
Are you guys anytime planning to extend this period ?
Not as of now.
dear sir
unable to open chart in PI software… please help
What is the error you’re seeing?
dear sir,
i am using zerodha pi.
intrest to use renko chart.
please help me to use proper way.
thanks,
angayerkanni
Hi, At present I use basket order in NEST for placing multiple orders at once. I would like to place the basket order at a particular time without my intervention. For example I would like to place the basket order to be executed at 11 AM. Is there a way to get this done? If not can you take this as my request and add this an option?
Thanks for your support
Hello Nitin,
Why is Pi not available in linux, just compile the source code of pi in Debian and fedora and we are good to go in most of the linux operating system, I have been waiting for this for a long time.
Please make it available in Linux.
Thanks & Regards,
Gaurav
I have requested zerodha team several times to update zerodha pi with some points missing in pi
1) cant drag chart up and down like we can in kite 2) cross hair not showing price and time.3)cant put price alerts (i use different software to put price alerts) 4) when we put a bracket order it comes in different breakups so when i want to modify for e.g my sl or target price i have to modify each and every breakup order which has been executed.There should be one singel order which should modify all my breakup executed orders.
I REQUEST ZERODHA TEAM TO CONSIDER ALL THE ABOVE POINTS MENTIONED BECAUSE I THINK Pi SHOULD BE EQUIPED WITH ALL THIS ABOVE MENTIONED POINTS
Kindly introduce multiple snap quote….
Could you please add Pivot Points but there should be an option to select ”DAILY” ”WEEKLY” ”MONTHLY” and as well as there should be an option to select and deselect all the Supports and Resistance, so that we should be able add only one pivot line as per our choice.
And one more tool I would like to see in charts i.e. CROSS LINES for mouse pointer same as we have in Kite. whenever we hover the mouse over chart so we get that CROSS LINE in place of cursor pointer. Actually it helps a lot to track mouse pointer. May be its just bcoz I’m used to it due to Kite.
hello
1)can i save a market watch created in pi,if yes how?
2)earlier i used to hear a computer generated voice after an order is executed ,and messaage gets displayed at the bottom of pi window,but since last two months both things are absent ,pls explain?
zerodha team,
At present link to excel on PI creates an excel file with .xlsx format for these we cannot apply vba codes or macro and save them to xlsx (macro free format) so please do something on this so that the page created by default is macro enabled like xlsm or xlsb.
how to see 52weeks high and low on pi ?
Double click on any scrip in the market watch and you’ll see the Year’s high and low.
how can download Pi
Log into q.zerodha.com and you can download Pi from q.zerodha.com/pi
Is there any one in zerodha who knows about complete or full update instead of incremental updates……. ? i opened zerodha pi after few months and my full day got invested in updating this application… what kind of logic is applied ? cant there be a update which covers all earlier versions? after having so much of technical integration in zerodha business, such kind of things puzzle me!!!! on one hand zerodha guys are so much advanced in technology and on another, update management is taking 6/7 updates one after another… instead of getting installed in one go.
Dear Zerodha,
Kindly look after about Pi chart. Regarding Pi; Charting is not difficult but its take time to open particularly on every script so we’ve to open chart on every time. Add some features like chart sync from marketwatch or drag and drop and also timeframe sync.
Thanking you.
WHY YOU DONT IMPROVE THE DRAWING TOOLS INSTEAD OF ADDING NUMEROS INDICATORS WHICH ARE HARDLY USEFULL.TO DRAW THE TREND LINE AND TO LIFT THAT LINE UP AND DOWN IS SO DIFFICULT.WAITING FOR YOUR REPLY?????
WHY YOU DONT IMPROVE THE DRAWING TOOLS INSTEAD OF ADDING NUMEROS INDICATORS WHICH ARE HARDLY USEFULL.TO DRAW THE TREND LINE AND TO LIFT THAT LINE UP AND DOWN IS SO DIFFICULT.
pi is free or chargable app
There are no charges to use Pi, Ranjeet.
Can you guys add ”Trend Intensity Index” oscillator to Pi please?
Hello sir,
I am trying to export data of NIFTY50 stocks to excel but in excel sheet all values are showing NA how to fix it please help me.
Thank you
Hi,
The Money Flow Index indicator seemed to be malfunctioning today in Pi at the 3 minute frame. It dropped from over 80 to 0 for 1-2 bars and then shot back up again. I doubted it so I crossed checked in Kite, and there the chart was as I expected (it was without the sudden drop). I can send all the parameters I used, with a screenshot through mail if you wish, please let me know where to send it.
Would appreciate it if you look into it, thanks.
I am not able to use Pi software…. When I install Pi software its shows an error message.
Hello sir,
is there any way that i can install zerodha pi without administrator access
please if available then please shere
Mayur
My antivirus software detects it as a virus and removes them. I couldnt install it.
I am unable to login my pi software. Because of this i am unable to enter my proxy for using my internet which is proxy restricted.
I have a kite account. I want to have pi on my MAC. Do you have a MAC version? if yes, Please provide link to download. Thanks in advance.
Hey Prem. I’m afraid Pi is a Windows only platform.
1- Recently, the option to login Q Backoffice when Pi/ Kite is running is removed and if Q Backoffice is required to be accessed, it asks Kite credentials which logs off trading platforms. This is undesired. Please revoke the previous system of simultaneous Q backoffice and terminal login.
2- Please include shortcut key for chart data directly from Market watch.
3- When the update on Pi is expected so as to get bug free updated system.
Also, please increase default No of scrips from 50 to 100 which can get Active MW ticked or provision to include Predefined Market Watch scrips to Default MW also on double click.
Chart Maximise/ Minimise by double click on Title Tabs.
Buy Sell order line on chart and modification of orders by dragging these lines
The number of scrips is limited in the interest of bandwidth and I doubt this would be lifted. We’ll share the rest of your feedback with the Pi dev team so they try to incorporate this in coming releases.
1. Kite and Q can be logged into simultaneously even now. We’re working on making it possible to have Pi logged in in parallel as well.
2. Yes, this should be done in the coming releases.
3. I wouldn’t be able to give you a concrete timeline here.
Please add all indicators in Pi that are currently available in Kite 3.0 . In Kite 3.0 Accumulation/Distribution is there but not in Pi. We cannot login both the platforms simultaneously to overcome the shortcomings in Pi. Suppose I create a derivative indicator in Pi and want to armour it with A/D. That neither possible in Kite nor in Pi. The situation sometimes become frustrating…
Hey Shovan, we’re adding indicators to both platforms as and when possible. The charting on both platforms is powered by different engines. Pi uses something called Modulus, while Kite charts are powered by ChartIQ. The indicators available are what are offered by these engines.
Then make it possible for traders to login to both Kite & Pi simultaneously.
Yes, we’re working on this as we speak.
hi can you please address my issue!!
hi, i downloaded pi just now and after installing when i tried to log in it said ” Error the underlying connection was closed: An unexpected error occurred on a send. i tried re installing but no luck. i think after installing i did deny firewall permission but then i allowed firewall to pi but still didn’t work.
facing same issue…………..did u solve it by any chance?
Hit ”Win key + R” %localappdata%Pi and find the file user.config and delete it. This should fix this.
HI, can youplease clearly suggeswt the path as i can not find the file user.conf in the C Drive-> Zerodha ->
Hello. Recently since Jan my Pi is slow to load and crashes way more frequently than before. I upgraded my internet connection but that has not helped. Now there is complete failure to load Pi, telling me that ’Not able to login, Please restart again to continue’. It is very frustrating and has locked me out of my investments at a very crucial time. I have even changed laptop but there are issues in installation on win 10. Please provide me with immediate support, and if anyone else has faced a similar problem please share solutions.
Thank you.
charts not getting open in Pi
Sir Add indicator 2 indicators in Pi derived from Bollinger Bands: %b and Bandwith. These indicators are in Kite3.0 but not available in Pi.
When you are bringing the next upgraded version of Pi? No doubt it is far better than Kite at least regarding plotting derivative indicators choosing different source fields.
Hi,
Is the fast and slow stochastic oscillator implemented in pi. i searched but could not find.
Rgds
is zerodha charging any type of yearly, monthly, weekly or anyhow for using Pi or Q?? please tell me as early as possible.
No charges for using Pi or Q Vijay.
sir add indicator DEMA AND VWAP in zerodha pi
Hi,
I have an issue with pi platform.
I created a new MARKETWATCH, I choose the columns and added scrips which I need. The columns & scrips were arranged accordingly to my comfort. While exiting the application, I save the workspace and also save the marketwatch which popup on exit.
On next login, my marketwatch is scrambled and I has to rearrange the columns & scrips line of order every time. But on ”default marketwatch” the problem is quite less. Only the columns has to be rearranged, but the scrips are in the order I saved. User Settings is set to save everything on exit.
Is there any options to retrieve the saved marketwatch as it was at exit?
Expecting a solution.
Go to View>User Settings>Marketwatch and check ’Save layout on exit’. Should work.
kindly add the blank line in between two scripts and buy sell shortcut +,- key feature.
hi,
How can i reached Nithin Kamath. The main reason is that i use Pi as a trading platform, while i can see many developments going on for kite, Pi is underdeveloped.
Main things that can be added to pi are:
1. BO
2. Pi crashes more often at times when you want to view cash positions/when you wish to load certain nifty50 list etc.
3. Range bars can be added. Lack of visual appeal in case of indicators. I am not asking for anything fancy.
Now, i want to ask why Pi is severely underdeveloped as compared to kite. Do the developing team knows that bugs exist but they simply wish to ignore.
I love pi and there may be many others who has the same concern.
Hello Zerodha!
Pi is frequently crashing when trying to check Cash Margins available. This is creating huge problems while pushing orders, as I am not able to see, with how much I can trade.
This problem has also been highlighted above by
Sriram says:
July 28, 2016 at 11:22 am
What is the immediate step that I can do now to solve this problem, since I frequently need to check it?
If you are trying for permanent fix, when will you be releasing it?
Hi Friends!
I am new to Pi Zerodha and I want to check the ”Previous Range Day Break Out Strategy” (PRB) with some selected Stocks like ”Reliance Industries” etc.. Can anyone please help to provide the Pi trade script for ”Previous Range Day Break Out Strategy”
your up graded pi software is not at all working on windows 10. your support people cannot solve the problem.
previous versions of pi is working fine with the same machine.
i think you have to test the same windows 10 platform and see for yourself.
there is no issue with the machine.
Dear Team Zerodha,
Pi does not generate Holding report under positions.
The holdings are listed separately under the stock holdings section. Why would this show up in positions?
Hello sir,
Can Zerodha try to add Displaced moving average indicator in PI platform ?
in Kite platform moving average off set facility is there but i can not scan in kite.
is mac version of pi available?
Not as of now Rahul.
in the next update of pi please add an by default Zero line/Horizontal line for Macd indicator.for me its very essential.
Thank you,
Hello
Can Zerodha try to add Displaced moving indicator in PI platform ?
in Kite platform moving average off set facility is there but i can not scan in kite.
I want to set default time period of 5 minutes candles for 60 days on every chart that i open on pi, can that be done?
Hello,
I happened to go through a demo of SAS Online’s Alpha platform. It seems to be an exact replica of Pi!!
I thought Pi was developed by Zerodha. Any light you can throw on this?
Thanks
Pi and Alpha were both developed by and are licensed by TradeLab, a startup we’ve incubated.
Hi… I had an query… I hope I can get a solution as always from you guys?….
Can I input 2 orders simultaneously in pi under co and Bo… For example…
Suppose Infosys is at 100rs … Can I input a limit sell order at 98 with 100 stop-loss and simultaneously input an buy order at 102 with a stop-loss at 95… Can Both the orders be inputted thru co and bo
This would nullify the position opened first.
Thank you
when opening pi, it asks for update. I have updated atleast 5 times. still it behaves the same. i have also reinstalled the software and updated already twice. PLEASE RESPOND ASAP. kindly mail if possible
Hmmm… Can you uninstall Pi and download a fresh installation from Q and install? Should solve this.
Hi, Is it possible to add two indicators : 1) Volume at price 2) Market Profile for 15 Min, 10 Min and 5 Min charts ?
That would be a great help. Thanks in advance.
PLEASE ADD PROXY SUPPORT IN PI IN OFFICES NO DIRECT INTERNET,because of this I am unable to use PI
I installed Pi in my Laptop but always throws error critical update is available , it leaving with no other option rather than update, issue is even after update its throwing the same error again and again. i am not able to use Pi in my new laptop.. Anyone faced the issue & what is the solution for the same…
Can you write to [email protected].
I faced the same update issue. i tried to uninstall and reinstall multiple times, didn’t work. Then I cleared the Windows registry errors with C Cleaner and Installed again. It fixed it. But Pi hangs so much on my laptop If I open a single chart with 1 Day x 1Y candles and apply 1 or 2 indicators. It is unusable for me. Zerodha Please Fix this soon.
I have the laptop with Core i7, 8GB RAM, 7200 RPM HDD, 2GB Graphics which is more than the minimum requirements.
Hi Team,
I know Pi is a wonderful software but for last one year I am only complaining about one thing. IT GETS STUCK ON SPLASH SCREEN!
I have raised this issue every day till last year. Your support team, always uninstalled, removed old directories that uninstaller does not remove (user specific) and then reinstalled. It works for first time but then it does not. Why are you not just dropping that splash screen? Atleast have a button to close it! I am a programmer for MAC OS X and I know it can be made non modal. Please fix this issue or provide me a solution HERE that does not disturb my settings. I am using NEST trader for Zerodha for last 1 year now and have absolutely no issues.
Subhash
Hi Matti,
Any new updates for PI. It’s been a long time, PI got some updates.
Please add VWAP indicator in PI
Thanks,
Noble
Pi does have VWAP now. Please check.
Hi Matti,
The indicator in PI is Volume weighted moving average (VWMA) and not volume-weighted average price (VWAP).
Having VWAP would be very helpful. Kite is really browser heavy and RAM consuming. PI is very light. It has quick order window and shortcuts as well and multiple charts work very well.
I have the latest update as on 8th Dec V1.0.0.6.
Please advise if I am missing something.
Thanks,
Noble
yes… still waiting for an update for bug fixes and more indicators specially vwap….
I think zerodha is not interested in their desktop app and are pushing users to the online platform.
Waiting for Ichimoku for a long time…
@ Nithin Kamath: When will you add Ichimoku Cloud to Pi…. ???
sir you have to add multichart option in kite web like upstox it is very difficult to watch charts we have to open chart one by one
Check out kite3.zerodha.com for a beta preview of the new Kite. We’ve added a multi-chart view. 🙂 Details here: https://tradingqna.com/t/kite-3-0-beta/25605
sir mera pi software me na chart bata raha hai na hi scanner load ho rha hai
Hi,
Can you please lookout for below options in your Pi software
1./ customizable hot keys to place order. for example ctrl+1 for 100 quantity trade ctrl+2 for 200 qty and similarly we can customize hot keys as per our preferences.
2./ header part of scanner should have option of hide as it takes too much space if we have to use multiple scanners at same page.
3./ Order lines at chart i.e. we should be able to place order from charts and accordingly there should be a line visible on chart for buy, sell and stop loss orders. Also we should be able to drag lines and that should result in modifications in our orders?
4./ studies needs update for example ichimoku needs to be added.(its there in kite but not in pi)
5./ additional preloaded scanners
Regards
Nitin Jain
Studies should also have VWAP (forgot to mention in earlier suggestions)
Please add zoom in function to make text and contents bigger in desktop app. in large full hd monitor, texts are too small, had to reduce monitor resolution during trade sessions to make texts and contents bigger. zoom in function in app will be very helpful.
HI PI CROSS HAIR NOT WORKING PROPERLY PLEASE UPDATE PI
hi nithin
are you had any control over your staffs ?
the Daylight Saving Time changed on last week , still your admin is not changed the pi chart plotting time in the server,,
charts stops working @ 11.30 ..
Binu, having this checked.
Most of the time, we cannot track the price by watching each tick. A basic Price alert system via email and SMS is nescessary which is already present in NEST Terminal. When the price crosses the Alert Price, SMS or Email should be received.
Thanx
hello
i installed pi software in my laptop,but when i am trying to login it is not login and showing Not responding and Pi got hanged so if there is any solution for this?
Hey Naishal, please write to tsiva[at]zerodha.com and we’ll have someone get in touch with you to figure this out.
hello is it possible to get real time updates of the portfolio holdings in pi while it can be seen in kite it is unavailable in pi everytime we have to click on get holdings to see the latest value
thanks
Any plans to roll out Pi for macOS?
Shobhit, no plans as of now.
Hi,
Could you please work on making this software available for MacOS users? Thanks!
i coudn’t be able to find undo-redo option. can you please suggest me where it is ?
sir , request of adding weekly and monthely pivots in Pi charts is pending since very long ,but you even don’t reply on that nor they added .
In almost all charting app, timing for the candle is the end time of the selected time frame.
But in Pi it’s the starting time.
Say for an ex:
Nse opens at 9:15 so for Nifty in 5 mins time frame first candle time should show 9:20
and not 9:15.
I tried saving charts (save workspace and mkt watch) with my indicators and trend line but unable to do so.
Every time I have re draw trend lines which is very annoying.
Regards,
Yogesh
Hi,
I had Nifty 50 & Nifty USD Indices on the default MW. Now unable to see them and am not able to add them back. Can someone help?
Muthu, on the market watch column, select NSE>EQ and select indices and in the next toggle select the required index and add it to your market watch. To add spot currency indices check this post.
Hi,
Thanks for the reply. In the dropdown Menu, I am getting only NFO & CDS. Unable to attach the screenshot here. Could mail if needed.
Thanks.
Sir, When does the AMC ( Annual Maintenance Charges ) fall due for zerodha trading account ? I mean at what time of year
AMC charges will be deducted at the end of each financial year.
you mean 31st march 2017 ?
That’s right.
Hi Nithin,
I am trading with zerodha for last 5 years, recently I found that my MW which I saved as workspace is not getting updated automatically when I am adding new scripts to my MW. Also I want my workspace have to load when pi starts.
The above thigs is impacting my trade.
Regards,
Kiran
Kiran, best to write to [email protected].
please provide me pi software
how to download pi
Login to Q.zerodha.com. Click on Pi, you will see it there. Check this.
@ Nithin Kamath: When will you add Ichimoku Cloud to Pi…. ???
While using Zerodha Pi software Chart for 5 min, or 15 min are not available even not available for any minute ineterval, it shows there is no previous data available for this only live data is available.
How to fix this please help.
Thank You,
Regards
RUPESH SINGH
The above reason shows up for various scenarios, will reach you on this, but from next time for these kind of support queries you can write to [email protected].
EVERY TIME I DECIDE TO USE PI IT GOES ON A HANGING MODE AFTER RUNNING FOR ABOUT 30 MINS TO AN HOUR.
THIS IS FRUSTRATING AND I LAND UP USING KITE. MY PI VERSION IS THE LATEST AND I AM USING WINDOWS 10. CAN U HELP OR DO I HAVE TO WAIT TILL A BETTER VERSION – A NON HANGING ONE IS OUT.
Pi is stable only but it’s performance is dependent upon hardware, can write to @ [email protected] on this and will get this checked.
About Pi being ”stable” thats a nice thing to note. On my system it never has. My laptop is not new, its a sony has 4gb ram and 2.2 ghz intel core 2 duo processor operating windows 10 64bit. I have a 10mbps internet connection only for this laptop. I hope this is enough. Infact have tried running Pi without anything else open still same results.
Most of the time I am using kite on Google chrome with about 8 to 10 different tabs open on browser also with MSexcel running no issues. But Pi still hangs.
May be your system specific issue as thousands of clients are using the same application, anyhow will reach you on this.
sir can we see 2 min chart as trade tiger give facility??
we are lagging here
pls
2 min charts are already available on Pi.
dear sir
when will be you are going to add weekly and monthely pivot point function in zerodha PI
like that in kite charts.
I’ll pass on your feedback, it’ll take a while.
hey there
is there some problem in pi when we use preload market space…i am trying to use nifty50 preload workspace but after loading of sometime it crash down automatically or pi gets hang.please fix this asap. and also i wanted to know as we save preferences in kite and the all settings we do in kite remains the same but in same we have to do that everytime we log in.like the cross hair we have to enable everytime we log in or data box to remove everytime we come inn…please tell me how to add preferencess like kite on pi.
thanks
Nanak
Pi is resource intensive system, while using multiple market watches it is recommended to keep a tab on other programs running parallelly and also should have good internet speed. You can drop a mail to [email protected] on this. Also to save preferences one can go to view menu–>user setting–>chart setting–> and select required options and apply, from next login the saved settings will be applied by default.
Hi Zerodha team , best wishes for your efforts , it would be appreciated if added these indicators in PI ,
1. Hurst band
2. Vwap
Also here in vwap , current days vwap in thick green line , and prev days vwap as dotted green line , day before prev vwap in dotted brown line , 2 nd day before prev vwap in dotted blue line and 3 rd day prev vwap in dotted red line . Im usig this wat vwap in one screener software , if possible please add these features in PI .As these prev 4 days vwap gives an clear idea in support resistance ,if added it willl reduce my burden to watching simultaneously in another one than with PI.
Hope will my request will be considred .
Thanks and Wishes to Zerodha team for putting their best to their clients himalayan requests.
Hello Team Zerodha,
In Pi These code is not working by me saying error of no trade though i piu both buy & sell scripts.
CANDLESTICKPATTERN() = BULLISH_ENGULFING_LINE
please guide me.
Suggest you post coding related queries on https://tradingqna.com/
250 stocks across 5 watchlists is quite useless for all the advancements in Pi. Sometimes when we need to make sector wise personal lists to track, we shud at least have 10 watchlists or 100 stocks in 5 watchlists. very inconvenient feature 🙁
Hello Nitin,
I don’t know if this the right forum, I am new to zerodah and pi. Is there a possibility in Pi or kite where we can do bracket type order and keep for a week or a month in equity trade? If ’YES’ can you tell me where it is? If ’NO’, Is it true the only way is to observe the market continuously and take profit ,say 10%, of the given share value and exit the trade?
Unfortunately such advance order types don’t exist for the Indian markets today, all orders get canceled by the Exchange on market closing, so you’ll have to place a new target order everyday. Bracket order is purely an intraday product code. You can place After market orders everyday, read more here.
Thanks Venu.
Hi,
I raised the following query earlier but no reply. Please clarify.
In the “Stock holding” position window, We have the option to square off the holdings at Market price with option to “Square off” and “Square off all”. The “Square of all” option does not work. I want to square off all holdings at a particular time but it does not work. Please help.
Regards,
Pandian
We’ve highlighted this issue to the developers at Pi. We’ll get this fixed.
also how do i copy all my stocks from different market watchlists in NEST to new watchlists in Pi?
Nest and Pi are not synced, one has to create new list on Pi again.
thanks Siva. I mean i have already downloaded Pi and opened marketwatch lists under certain names. I wan to know how to re-name a watchlist , say named ”abc” MW to ”xyz” MW
Not possible to edit, one has to create one more.
got a new lappie hence had to download Pi after using NEST all these years. How do i change a marketwatch name i.e rename marketwatch group
Once downloaded you can go to file menu and select create marketwatch.
Hi,
Is NEST better than Pi ?
in market watch can we make companies to list by alphabetical order ?? if so can anyone let me know
thanks in advance
yes. same as NEST. click on trading symbol once for Z-A, again click on trading symbol and A-Z order will come
Ah, no alphabetical sort option.
hey sir , how to find historical options data in pi or atleast charts or greeks data? please make this available to backtest my strategies. thank you.
Hi Team
Need your help to install Zerodha Pi on Mac.
Pls help.
Manjunath, Pi doesn’t work on Mac as it uses microsoft dotnet.
Hi,
How can I use PI and Kite at same time, If I log in to one the another one getting log out.
No, you can’t login simultaneously.
”Is Zerodha not focusing on Pi anymore?” pls search on ”https://tradingqna.com/”
in pi how to move chart up or down , it is very important and in pi zooming still not good need very much improvment
Hi,
In the “Stock holding” position window, We have the option to square off the holdings at Market price with option to ”Square off” and ”Square off all”. The ”Square of all” option does not work. I want to square off all holdings at a particular time but it does not work. Please help.
Thank you.
Pandian
in pi if we buy/sell for chart i.e : buy at or sell at , we can not change the value and after order we will have to double click the order and then we can change it so plz make it changeable 1st time when we trade from chart , and there is no order time in tradebook or orderbook so plz add time in tradebook and order book so that we can check it when it was traded.
Hi Team Zerodha/TradeLabs,
Zerodha + TradeLabs are doing a great job at improving Pi. Keep it up.
Is it possible to have a feature in Pi that can allow custom-coding of indicators, similar to AmiBroker’s AFL?
Thank you,
Hemant
Tough to do that, but you can bridge amibroker with Pi. Have you seen this.
nitin ji is cross currency eur/usd, gbp/usd, jpy/usd trading possible in india ?
I hve seen this video from 2015
http://economictimes.indiatimes.com/et-now/policy/rbi-issues-guidelines-for-cross-currency-futures/videoshow/50125520.cms
Not yet, exchanges haven’t launched them yet.
I have made 2 complaint about this zerodha Pi software getting freeze daily at 9:30 am, I had call many time zerodha support they promise to call back in 2 min all the time and I have not received any call yet from support team. I have sent them screen shot of the freeze software also still it is not working. my complaints number is 739902 and 228273.
Our team tried calling you on this but the calls were not answered, kindly answer the calls or revert to the mail.
what is the system requirement? will it run on windows 7?
Any good system is okay. Check this section: https://zerodha.com/z-connect/category/tradezerodha/pi-tradezerodha
Is there any alternative for AWESOME OSCILLATOR at present ?
Nitinji, I have requesting for a particular feature for nearly a year that plz add this in Pi
1. Net change column with color indicator like this https://ibb.co/jUF1jv
Also
2. Editable color and all lines of indicators like macd, donchian channel, supertrend etc becoz at present only one line color can be changed which is really not useful
3. Plz add Awesome Oscillator
Dear Sir,
can i know is it possible to inbuilt buy sell buttons for trigger price line in PI chart, if price touch that line order has to executed it means that line is like trigger price order like MT4. For example after execute the buy order if we drag that line to downwards that will be my stop loss trigger price and if i drag upwards that like will be my target price, vise versa for the short order same as MT4 on chart trading. is it possible in PI? I am requesting you trading system like MT4 is it possible?
Have you checked this.
Hi, you have put in a lot of effort in making Pi trading software. Everything is fine except the Pi time clock at the top of the software is slow by a second or two compared to IST. Due to this, the open and close of every bar looks a little different than what everyone else is seeing. Despite repeated complaints by many people, it has not been set right. I think you need to replace the Motherboard cmos battery on your Pi servers. Temporary fix would be to sync your Pi servers before the market opens every morning to IST… but during the day it might slow down by half a second or even 1 second. Hope it is permanently fixed by your system administrator.
Chetan, Last two times when you raised this even we too noticed couple of secs delay but nothing this time, it is absolutely fine, can you send me a screenshot for the delay you have noticed to [email protected].
Hi Team,
i can not select future & options stock for my technical query in PI trading.
Can you let us know why ?
Regards,
VInay
plz add awesome oscillator to pi.
sir how i can use pi . i m using zerodha kite for trading . now i wanna use pi how i can use it
Check this section: https://zerodha.com/z-connect/category/tradezerodha/pi-tradezerodha and videos on Pi here: https://zerodha.com/z-connect/category/tradezerodha/pi-tradezerodha
I would request Zerodha to Provide 2 Very Important Things in next Pi update…1) In MACD & MACD Histogram, we must have Zero Line (or Signal Line) which is very essantial and 2) In RSI (Relative Strength index) Pi only provides 1 parameter instead it must have 2 Parameters in Same RSI settings as a) Average period & b) the Selected RSI Period which will Show relative Strength…as the name suggests Relative Strength Index, we examine first against the Average Period, then the Relative Strength to Price movement…Thank You.
Hi,
In the ”Stock holding” position window, We have the option to square off the holdings at Market price but not the ”Square off at LTP”. Can we have this option on Stock holding window? We have this option on ”Admin Position” widow.
Adding to our list.
when we draw some tools like mostly rectangle ,when shift from higher time frame to lower time,,, they are not visible in lower time frame.Please fix it.
Tough to make drawing tools stick when you change timeframe technically.
dear sir
one feature which is very interesting and helpfull of pivot point present in kite charts is not present in Pi charts as such in form as present in kite charts . what i mean to say that – when we open 15 min or below time frame chart in kite pivot s are intraday calculated , while open 30 min or hourly chart pivot points are weekly calculated and when we open daily chart pivot points monthely calculated
this is an awsome feature which i like most ,and request you to include this feature to Pi charts ( which shows only intraday pivot points )
2) also recommend you to add channel fill and shading option for various studies
i think it will not be more tricky these 2 points for your people /partners which develop such wonderfull things ( kite & Pi)
waiting for your update
thanks
Hi Team,
I am new user to trading and want to know about PI application and guidelines to use it and how it is different from KITE i which i am using it right now.
is their any monthly amount associated with it if i plan to use it in future.
hoping for prompt reply.
Regards,
Vinay
Check the videos on Pi here. No costs for using this.
thank you for the link.
I have one question regarding the Queries used for scanner.
i used CLOSE > 300 to find stocks in NSE whose last close is greater than 300 but it seems not working…. i can see stocks below 300 rs.
Can you help on this ?
Regards,
Vinay
Can you post all coding related queries in algos section on tradingqna.
plz add awesome oscillator to pi and also is there any alternative for AO available right now pls do tell me.
again the Pi chart clock is slow by 4 seconds. i had posted on july 14 regarding the same and it was corrected but it only lasted for a day. again your clock has slowed down. i think it is slowing down a second per day. due to this, it will mess up the real time open and close of every bar. either the battery on your server’s motherboard is weak or might be some other issue. hoping it would get fixed permanently.
I have been observing the same for the past two months and have reported it too. The delay varies from 1-6 seconds on different days. Today its 4 seconds.This delay is causing slippage in market orders for options. Need a permanent fix for this problem.
@ Hariharan, It can’t be everyday from two months as every week we sync our servers with IST, also this time is used to just form charts and has nothing to do with broadcast or order placing, it won’t be any reason for slippage because the orders get time -stamped at exchange level.You can relogin and check now.
Can you relogin and check now.
the time is correct now. but i think it might again slow down by a second every day from tomorrow. and again when you sync your servers by the end of the week everything will be alright. on july 17th monday i observed the clock was slow by a second, and by thursday today it was slow by 4 seconds. you need to give this a permanent fix.
Will take care of this, Thanks.
Please release a version compatible with Mac OS.
Thanks.
sir what should be the box size of RENKO CHARTS in PI for forex trading in kite it was 0.5390 and it worked but when I put 0.5390/ 1/ 10 /100 every time its blank I dont know whats wrong with it. Pls guide me regarding this
Currency tick size is .0025 so if one gives box size of 1/10/100 it will come blank only. Open data for more number of days and give boxsize as few multiples of .0025 like 5 paisa , 10 paisa etc. It should be fine. In last couple of months USDINR was traded in range of 80 paisa so there won’t be enough boxes to plot if box size is given a big value. Boxsize is specific to the underlying on which we are applying so we should consider it’s price range also before plotting.
plz add awesome oscillator to pi
I have also seen in pi that most of the indicators are not editable from their line color point of view some of the lines are pre colored which cannot be changed like Donchian channel where only on line color can be edited and this happens to be true for most of the indicators. pls do something to make them fully editable otherwise its of no use all the other platform have this option.
Point noted.
What are the new features added in the latest Pi update (18 July)?
Implemented some exchange related checks(compliance), not added any additional front-end feature after july 4th release.
i have been telling since one year that plz add 0 line in MACD but i think zerodha is not interested in it as well 0 line is must in macd , and also zoom facility till not now good will have to more improvement in pi , one can not do intraday trading while watching chart in PI , if wanna compare with PI then just check SHAREKHAN TRADTIGER software , u will fine the diffrence
Yes, regrets for missing MACD zero line but will be added in next release. I believe zoom in and out on pi is as good as any other platform, can you write to me @ [email protected] about the shortcomings of zooming option on pi.
Sir,
I have updated Pi software yesterday. I am unable to add future and option stocks in to marketwatch list.
Because there is no NFO option is available in Exchange list. only NSE, BSE, CDS and MCX are available.
kindly provide me solution.
Best to send such account specific queries to [email protected]
sir,
i have a problem regarding pi, it is not running, actually not responding. It was working when i installed it first time, but next day when i try to login, it didn,t open. I reinstalled pi but again same problem.
Will reach you on this but from next time for support related queries can write to [email protected].
Hi, From the last few days i am observing the time which is displayed at the top in Pi is slow by 7 seconds. Due to this the shape of the 5 min candles is different from what it should be. Please look into this.
contd…. the close for the current bar is wrong and the open for the next bar is wrong. In the EOD intraday chart it looks right but in real time it is messed up for the above mentioned reason which is, your server clock is slow by 7 seconds.
Will check on this and if any delay will get it rectified.Thanks.
PI chart is chargeable or not and how to use it please let me know.
It is free,select scrip on market watch and right click on it to select chart option, for more help on this can call to 080-40402020.
Sir
how can I add 250 script in single market watch.??
please help … as i want to add all F&O stock in single list rather than 5 different market watch.
PLEASE REPLY ON THIS
Not possible Dipesh.
Dear Nithin Sir,
The Q backoffice is showing a PI update on 04/07/2017. I have updated the same through PI check for updates option also. But nothing is new here. The continuous future chart was introduced in the last PI update only. Can you please throw some light on what’s there in this update which was not there earlier.
Regards
Bhushan K.
Not added any front end features as only backend changes have implemented, will be announcing it out in a day or two.
Sir
how can I add 250 script in single market watch.??
please help … as i want to add all F&O stock in single list rather than 5 different market watch.
1.Please provide VWAP indicator in Pi.
2. In Kite intraday charts Supertrend indicator doesn’t flip in real time when there is trend change. Need to close and reload the chart.
hi nitin i have an request for next update in pi please include the charting option for watch list as separately now we have to search for individual stock going through search table. i would like trade in limited stock list it will help me lot thank you sir
I am getting error in Zeroda Pie from last two weeks. Whenever i am opening Zerodha Pie the chart is not properly loading and the scipts is not adding. Most of the times the Pie freezes at the opening.
Will reach you on this but from next time for support related queries kindly address to [email protected].
sir please update to new version by selection update in pi software i was also facing the same problem for many day now it working very much smoothly after updating
it is showing ’’We ran out of invitations, next set of invitations will be added soon. Please come back later’’. How much time does it will take so that i can use it.
its been 2 weeks and till now it is not available.
Can you email [email protected], shouldn’t take so long.
We have mailed you, can you check now.
yes i have received your mail,thank you:)
1. Is there any plan to add Ichimoku clouds in Pi ? (available in Kite)
2. How do I see the volume information in Kite marketwatch ? (available in Pi)
1. will take time.
2. this will come soon.
Hi,
In the latest version of PI I could not find the following (not sure if they are already there & I missed spotting them!!):
1. Moving average indicator not provided!!! Pls include them as they are the basic indicators…
2. No weekly and monthly pivot points available – only daily pivot point provided. Pls include both weekly & monthly pivots ”with the option of plotting them both”.
3. MACD has the option of only changing the main line color. Pls enable changing of both lines for clarity and also the ”ZERO line highlighting”.
Thanks……..
No Ichimoku Cloud trading stragedy in PI. Please add one click chart feature from the list of watchlist like in Kite
Hello Team,
I would like to know if we have any trade setup to get real time updates that’s useful for option trading. For example, good strike to enter long or short covering is going on or long unwinding is seen and so which can be easier for traders to pick them. It can be similar to fingertips, but yet in your way.
Thanks,
Jay
please sir send a link of pi also
https://q.zerodha.com/pi/
Hey Sunil,
Go here – ”https://zerodha.com/resources” then look at the ”Tools” section PI is there and you will be taken to a dropbox link with latest version of pi may 2017 release. But you still would have to login to Zerodha-Q to get your license for PI.
Sir, I want to know you any extra charge on bracket order,cover order and short order
No, our brokerage remains the same. If your ’entry’ BO order gets placed in multiple trades, the resulting SL and target trades will also be placed multiple times. At such times, the brokerage will be charged on each of the orders.
Dear Nitin,
As I am trading in my office, I have restrictions and not allowed to install any softwares.
I tried copying Pi from another PC to my PC, but am getting some errors while creating a chart or Create scripted alert etc.
Hence I would request you to please allow a Copy Paste version of the Pi software so that we can work in any PC without installation.
Please help resolve.
hmm.. donno if that would be possible. Btw, 90% of our clients now use Kite. https://www.youtube.com/playlist?list=PLkxTRam6E2V-okv6gwQlt6dLTsn0v6CD1
It’s almost there. It’s working fine except 1-2 important features. Would be very happy if that is fixed.
However if you are concentrating on Kite, please add ’’Creating scripted alerts’’.
Hi
When we can expect % change in open interest column in terminal. Missing it very badly. Any other way to compute it manually?
Thanks,
This will come, but do you know this: https://tradingqna.com/t/is-the-live-open-interest-oi-data-being-provided-by-exchanges-correct/7208
PI download is not available.
from where can i get the software.
Thanks,
Harsh
Check this section.
Go here – “https://zerodha.com/resources” then look at the “Tools” section PI is there and you will be taken to a dropbox link with latest version of pi may 2017 release. But you still would have to login to Zerodha-Q to get your license for PI.
Pi as well as Kite does not have the ability to adjust hourly candles to market hours. some other softwares like Tradetiger from SK has that option wherein I can decide if the hourly candle starts at 9 am or 9.15 am and toggle accordingly.
I have some trading strategies which explicitly requires the hourly candles to start at xx:00 hrs and not xx:15.
Is there any way possible to provide a toggle facility in upcoming updates? ( if there is any way currently available to do so that I might have overlooked then please let me know)
That option is not available with us for now but will pass it to the concerned team and based on possibility will try to implement in coming days.
1. Macd line will be available in next release.
2. VWAP on pi will take more time, but one can check the same on kite.zerodha.com.
3. One can select on chart and drag it up and down to shrink it.
4. Can you please write to [email protected] for the improvements you seek for zoom in and out on Pi.
siva u plz check sharekhan tradetiger software and check how smoothly zooming works in it , u will have to do that kind of zooming in pi too otherewise there is no use of pi , and i think in kite it is better zooming then pi
i have updated latest pi and i m already complaining for some time about macd that their should me horizental line at 0 in it its very common but no one noticing it and one thing more i already told many times that how to add vwap on chart ?? there is no option in study to add vwap it should be their so plz try to add this feature ..and how to shrink chart ?? plz also mention that and zooming till not very well still u guys have to work on zooming too
Why you Zerodha guys are not allowing Bracket order for delivery trades ? When this facility will be available to traders .
For delivery trades is a little tricky right now.
Pi chart since last Monday having issue, informed by an emai replied once to Re concile chart by press Ctr and R key, but still problemlike,
If morning open chart 9.15 am to 9.30 5 minites candele ans same after 9.30 open candle are different.unable to study chart study for intraday trading.but did not solve the issue.
l
Can you please check on this today and share the two different screenshots you are mentioning about to [email protected].
in Pi, why user strategies and other scanner study are stored at your Pi server? why it can’t be stored locally on client machine? it means you have access to traders studies as every time I click on expert advisor it pulls all data from your server only.
User strategies are stored on cloud, so as to access from any machine, also in case of Uninstall / reinstall the strategies will be intact, even the same when updated to new version.Also it is stored on server in non readable format. Nothing to worry.
Trend lines drawn on lower time signature don’t remain consistent for higher time signatures and vise versa…
May be I am doing something wrong or some setting is to be activated. pls help…
Yes, for now it work like that only, in next release will try to make trend-lines stay on all timeframes.
Would be great if Pi works cross platform (I use only Linux)
Your Pi access will be activated within 48 hours. Once activated you will get license key and Pi download link here. What I am getting now the message & not a software for last 4 – 5 days. I am new to zerodha & need a software to trade, kite is good but want to try pi.
Can you check now.
Hello,
I remember about Pi whenever I have to renew my technical analysis software. so I was reading about the latest updates on Pi and got really excited. I downloaded and installed the latest version of Pi.
1)Continuous NFO FUT daily data from 2010
how do I get this to work. I would like to see a continuous chart of the nifty futures.
Answered here.
My earlier post went unanswered, it was about trend lines disappearing from my PI platform when i try to edit them or draw new trend lines…
The same issue continues with the new Pi update as well and i am unable to save the trend lines on my chart when i restart Pi after logging off and its a pain to redraw the lines once again…..
I have tried to save the chart and the templates thru File – exit- save work spaces and save charts…. Still dosent work, i hope some one can answer me this time…..
Will reach you on this, ideally one should able to save trend-lines in template and can apply on same underlying of same timeframe in which they were saved.You can also give a try to kite.zerodha.com, which is our web based platform and on which it is very easy in using/saving trend-lines.
Guys,
Those who don’t have UNDCUR (Spot Currency) in PI latest updates Do the following :
1. backup chart template and workspace from zerodha folder in C drive or any installation directory
2. Uninstall zerodha PI with any uninstaller in order to clean the residual files of PI eg Iobit Uninstaller free
3. Delete zerodha folder from C drive C: or installation directory where you installed PI
4. Download PI from Zerodha Q and Install it for all users at say C: (C drive) and login with licence.
5. Don’t create any watchlist just go to help>Check for Updates> Update to latest version.
6. Exit zerodha after update.
7. Go to zerodha folder in C:
8. Delete all contracts.bin files ( my case was bse_cm_contract.bin, cde_fo_contract.bin, nse_cm_contract.bin)
9. Now open PI and login again.
10. Bingo you can find UNDCUR under CDS>Normal>UNDCUR
Why it is so difficult for ZERODHA to provide a standalone client of current updated version of PI instead of installing the old one and then updating to latest ?
Once we announce it to all clients will do the same, trying to incorporate couple more requests.
then please add colored net change column plz plz plz
PI version 1.0.0.6 crashes while running scanner .
update is available for the PI, while checking in update option but after downloading of update installation ending up with error saying ”Patch file not found” something like !!
Will reach you on this.
Hello,
I have installed pi on my pc. But i am unable to login, its telling plz restart to continue.
I have restarted the pc but the problem persists. PLZ help me.
I am running windows 7 service pack 1 (32 bit) on my pc.
Firewall or antivirus might be blocking,add exclusion and check, if still facing any issue you can write to [email protected].
hi
in Pi pop-out active windows , please add ” Always on top ” Windows function .
thank you
Hi,
It is indeed difficult to select stocks one by one and press the shortcut keys for each one. Is there a way to multi select the stocks(of course within the opened charts limit) and open the charts of all of them?
hi there how to edit and drag horizontal line in pi latest version 12.05.2017
Hi Shivendu, In order to drag any drawings like horizontal line and vertical line you have to disable CROSS HAIR option in CHART SETTINGS or you can enable it but before editing horizontal line just right click on chart and disable CROSS HAIR from there. Then you can Drag and Edit any drawings.
Thank You
how to view chart without indicators or with indicators in kite like in old version by clicking one button on left side
there must be horizental line at 0 in macd its a very common , after applying study in chart , chart zooming very slow , there is no atp or vwap in study its very important for chart reading and chart zooming still not good cant view chart easily in pi , still not satisfied with this update too
Manoj, Seems to be working fine, will have this checked. The zoom in and out works fine. You could also use the up and down arrows.
i dont think zooming is working properly , tell me how to shrink chart also? i can show u on teamviewer also if u can
Seems fine. Check this link on how you can shrink the chart.
Manoj,
right click on chart > disable cross hair > go to macd graph > rightclick there > select horizontal line > drag it to desired level in your case its Zero > edit its thickness and color by double clicking it > then again go to chart > right click there > enable cross hair.
Hi Team,
I am not able to update the latest version of Pi. I am using Windows 10. I used the option ”Check for Update” and clicked on Update. It downloaded patch.vbs file and opened it automatically. Thats it. It did not install any software. As Akshay mentioned above, I uninstalled the existing Pi on my computer and installed it again from Q. Even Q has the old version which is as of 2016. I sent an email to support team. But I did not get proper response from them. Can you please detailed steps here. So that everyone can go through it.
This could have probably been due to any antivirus or firewall blocking the application or if using any restricted (office) network, you can add an exclusion in firewall or antivirus for Pi. If the issue is persisting, please write to [email protected].
Nitin Ji or anyone
How to add spot currency in zerodha pi new update 12.05.2017. I have updated but there is no UNDCUR option in my CDS section
Select CDS on adding scrips to market watch menu bar -> Normal -> UNDCUR -> select the required underlying currency pair and add on to market watch.
Akshay.A, plz read the post carefully before making any silly comment I have already written that there is no UNDCUR option in my CDS section. If it was available then I would not have made such unnecessary post.
Debojyoty, Click on View -> User Settings -> Reconcile and check. Should show-up after that.
If the latest patch is updated then it should show, on market watch menu bar it follows as CDS-Normal- FUTCUR so instead of FUTCUR change it to UNDCUR and add required spot currency pair, if still not able to add please write to [email protected].
Sir, I have uninstalled old version then cleared all zerodha files from C:/ drive, restarted machine, then installed available version 1.0.0.6 on 18.11.2016 from zerodha Q, then updated the same to latest version 12th May 2017 from Zerodha PI. All the options newly implemented are available but not this UNDCUR. There is no UNDCUR under CDS>NORMAL. Also I have only CDS and EQUITY sector enable I have not Applied for NFO or Futures
Will reach you on this.
My problem still not solved I dont know whats wrong with my PI or machine
I can’t set as default 30 days chart, and After market order Tab is also not appearing.
Hi, Nitin sir how to edit horizontal line in zerodha pi like changing color and dragging to desired level
also why there is no coloured netchange coloumn in new PI version of 12.5.2017 ?
Unable to update to Pi version 1.0.0.6 7/18/2016, I can only see 1.0.0.0 as version on the Pi screen. I have tried updating from help menu as well as downloading from link in this page top and reinstalling. Kindly help. Thanks!
Gokul, Could you check when you check in >> About Pi Date reflected should be 12/05/2017;
If not then I’d recommend you to uninstall Pi and install from Q >> Check for Updates>> Help menu
If this still doesn’t happen, please write to [email protected] and we’ll have this checked.
Yes Akshay,
There it shows 12/05/2017 and 1.0.0.6, but in the main Pi screen in the header shows Pi [version1.0.0.0] So has it been updated already then?
Yes, it has been if it shows 1.0.0.6
Dear Sir,
it does not show the updated date in top left of PI. I have just send the screenshot on your email Id and support ID.
Moreover after the update the chart loading is slow.
Colour change in 52 Week H / L or Day high low is not happening.
regards
Bhushan
hi
Release note to the new update,, it Says
” 4)Spot currency pairs can be added on to MW.”
i am not able to see any spot price script in pi
Z is cheating own customers
If you’ve already updated to the new version and still unable to see then please click Ctrl+R.
Select CDS on adding scrips to market watch menu bar -> Normal -> UNDCUR -> select the required underlying currency pair and add on to market watch.
Guys,
Those who don’t have UNDCUR (Spot Currency) in PI latest updates Do the following :
1. backup chart template and workspace from zerodha folder in C drive or any installation directory
2. Uninstall zerodha PI with any uninstaller in order to clean the residual files of PI eg Iobit Uninstaller free
3. Delete zerodha folder from C drive C: or installation directory where you installed PI
4. Download PI from Zerodha Q and Install it for all users at say C: (C drive) and login with licence.
5. Don’t create any watchlist just go to help>Check for Updates> Update to latest version.
6. Exit zerodha after update.
7. Go to zerodha folder in C:
8. Delete all contracts.bin files ( my case was bse_cm_contract.bin, cde_fo_contract.bin, nse_cm_contract.bin)
9. Now open PI and login again.
10. Bingo you can find UNDCUR under CDS>Normal>UNDCUR
Dear Sir,
I have lastest version of PI installed on my machine. I have two queries.
1. Can’t I add more than 50 stocks in a single market watch?
2. Yes I can create multiple market watch but when I saved them in a workspace, logged out of PI, logged in again and load the saved workspace, I get list of stock added in ”Default Marketwatch” only and not others. Why?
Hi,
1) No, you cannot add more than 50 stock in one market watch in Pi.
2) Create multiple market watches, save it in layout, go to view->user setting->market watch->save layout on exit->apply->ok.
Does the PI software work on IOS (Macbooks)
No, Kunal it does not. As Pi is solely based on dot-net framework it is supported only on windows OS.
hi there, are we getting a color changing like green and orange net change column in this upcoming update?
Also when will be the next update release?
Nidhi,
Thanks for the feedback. We’ll try to incorporate this in coming releases.
SIR WHERE IS UPDATE FILE
Dear Siva .
One more issue is that i am unable to fill colors to any triangles or rectangles to mark zones, your help will be appreciated.
Dear Siva
With reference to your earlier post, you have mentioned that the templates for certain stocks can be saved from the user setting and save ….. And you also mentioned to exit from the file and not to foreclose Pi.
The issue is it still dosent save the trend lines or any other symbols and the worst part is in my Pi platform , tend lines keep disappearing on a live chart and i have tried multiple time frames also…. Thanks in advance.
When I press the arrow keys, the bars are not moving in as per the keys i.e if I press arrow key i doesn’t move one bar, but if i press the arrow key second time, two bars will move at a time. Please solve this and make a single bar movement for single pressing the arrow key
Stock Holding tab is not showing any value of Price, Total P&L NSE and Total P&L BSE though I am having Stocks
hi
can we have option to change type of moving average in stochastic oscillator like its there in SMI indicator in KITE and PI UPDATE . Its usefull to change moving average in stochastic oscillator for better signals
thanks
It will be really helpful if you guys Add Ichimoku cloud and pivot point indicator to the Pi.
it is really important to me, currently i am using sharekhan chart to study the trades but, using zerodha to trade. so, it will be very helpful if you add those indicators and make pi chart more flexible like sharekhan’s chart.
Thank you
if Pi is compatible for MAC OS ? if yes send me a download link.
No, it doesn’t work on MAC
Any plans of MAC client?
dear sir
you had changed the look and layout of KITE- WEB , sir i am not able to find popout option in current version . please help if i am missing something.
Hey Vinesh, please clear your browser cache and try again. You should be able to see the pop-out option.
sir, when will be the next update of PI available ?
Soon.
nitin ji
whenever PI updates happen , pl see if you can reduce by one point the font headers for admin position and order book. will be very helpful in accommodating the screen size .
pi is available for macbook please?
Pi is on microsoft dotnet, won’t work on mac.
I forgot to add to the above that I have to save individual workspaces everyday because I’ve noticed that the ’Save’ option when exitting the program doesn’t necessarily save all of them in the correct way as noted above. When ’Save’ option is selected, ideally it should save ALL workspaces, all the share lines and the columns within individual workspaces in the order in which they were created. Upon restarting Pi, all workspaces and the charts ideally should come up exactly as saved the day before. That means whatever tools and drawings that were applied to the charts as well. Thank you.
As mentioned above select layout on exit and the new release which we are giving this week should make it more efficient.
Sir,
I have been using Pi for a few months now on my Windows 7 Home Premium laptop. I have three workspaces with customised columns. The following are my observations on the software:
(1) The workspaces don’t get ’saved’ properly. Everyday when I start Pi, all three workspaces come up with share lines mixed up (sometimes), and also columns are mixed up (always). So I have to rearrange the share lines and the columns as I like. This is a time-consuming exercise during trading hours.
(2) Pi hangs up suddenly once or twice during trading hours which is frustrating. The only recourse is to then close the program and restart it all over again. My laptop runs on Intel i5 core processor, 64 bit OS, 4GB RAM, and plenty of HD space – which I feel is more than adequate for the purpose.
(3) Pi is one of the better trading software I’ve seen, and I’ve used many platforms from different brokerages.
When you implement these fixes, it’ll become better still 🙂
Best Regards,
Paresh
To save layouts and columns
goto view-> user settting->market watch-> select save layout on exit->apply->ok.
Arrange the layout accordingly and logout by going to file-> exit, instead force closing the application.
Will give new update this week with some more added features.
select that order in admin position window and you can notice convert positions option on bottom of that window and you have to click that and convert.
In Pi, how we can convert MIS order into CNC?
Pi needs to update time to time on monthly basis.
because there are so many issue rises and only fixes once in 3 months.
see, last update was given in November 2016, since then no updates from zerodha.
I also use shaerkhan’s Trade tiger, they always update their trading terminal time to time.
and if someone raises bug issue, they personally talks and solves that issue within a 48hrs.
of course they charge for their trading terminal.
i request zerodha to charge us for trading terminal.
so this way we will expect that zerodha will give us better service in trading terminal than any brokers.
I hope traders will not question on charged service
because every traders of zerodha now want a stable and better pi application now.
and dont want to complain always that this feature is given on kite but not on pi.
so this way it will stop and we will get a better service from zerodha technical team also.
Think on it.
Thank you
We will do this from hereon.
Also,
We can change indicator’s line colors like donachain, Ketlner, Macd, Stocastic etc etc’s 2nd & 3rd line color on kite web and on Kite app but not on Pi.
Its difficult to analyze.
if we add dona-chain channel to chart, we can only change 1st line color but we are not allowed to change mid line and bottom line color. and if we add moving average to chart. It really really confuses.
Should be allow user to change its color.
As i know, these indicators are not in house indicators.
But we can re-code and allow user to repaint it.
Will check on this possibility.
To Nitin Sir,
When we open chart of any time-frame in Pi application.
Did you notice anything?
95% of chart will show you yesterday’s data.
Current time candle will show you at the end of chart, very near to Y axis scale.
Why Can’t we scroll it to center like we do on Kite web or on Kite App?
X-Y axis scale should be user friendly like Kite web and Kite app,
so we can move or shift last candle of the chart to any where to chart or to center or as per user want.
Thank you
To mention we use two different charting libraries on kite and pi so it is not practically possible to make them look alike. Also the number of candles of today’s data is dependent on time-frame one is selecting and also on what time one is checking. For ex even if one selects 15 min time frame and checking in 1st hour of trading there will be only max 4 candles of today’s data and rest is all previous days.
To check the timeframe of latest candle one can move databox freely and can stick anywhere on chart window.Also one can select and drag chart horizontally and vertically.
Hi Sir , for a long time we are asking for VWAP to be included in our zerodha PI software , told that it is in do list , when will bw done ? it is already available in kite but not in pi ! , we feel pi is much comfortable than kite ,so it would be great if done , Thanks.
Ok Sir, Thanks for. Clarification.
Sir,
Is it possible to square off our stocks bought in CNC at. 3.40 to 4 Pm, by ourselves.
In post market session between 3.40 to 4pm, you can place either CNC sell or buy order at closing price and hope that it trades.
Dear Sir,
Please also release pi for Mac OS.
Once I login to Pi, I would love to have 5 market watches with however much scrips in each of them. Your limit is max 50 in each and I get to monitor 250 in total which is great. However the most frustrating part is, once I exit and login back to Pi, I can see only the default MW with the 50 scrips that I added. The remaining 4 don’t retain anything.
I arrange scrips sector wise and really want to monitor different scrips across sectors. How annoying it is to login to Pi everyday and spend 1 hour or more to just add scrips to the 4 MWs.
PLEASE PLEASE make the 4 extra MWs that I create to save everything on exit just like the default MW.
I’ll pass on your feedback.
For scalp traders, it is really important to be able to go through charts as quickly as possible. There’s a trading platform called Speed Trader in the US, which lets you able to go through charts just by clicking arrow keys over the market watch. How about it?
Jumped my question?
Trading platforms around the world have evolved, this hasn’t been the case in India. We’re trying ohttp://zerodha.com/z-connect/wp-admin/edit-comments.php?paged=3#comments-formur best to give you the best of technology but it’s hard to accommodate all of such features that are available in the platforms traded internationally. Nonetheless, I’ll pass your feedback to the developers, we’ll do our best.
dropbox link removed, cant download
Can anyone tell me pi will run/install on windows server 2016
Should run.
With all these services which are not provided by any broker , there should be some manual help.
People like me who just know to trade from ready software that buy and sale only are not able to update the trading software.
Now I want to down load your pi but could not do it in spite of all the efforts. What to do .
Similarly I put some studies on the charts but now I am not able to delete them .
I’ll arrange a demo from one of our Sales managers. You can ask him all your queries.
Sir, can we use our own AFL codes in Pi?….if yes then what are the steps …please guide me
Please add Ichimoku indicator to the Pi
Our team is working on getting this done. Meanwhile, Ichimoku is available on Kite for now.
Zerodha,
Could you please add line chart in Zerodha Pi as well?
Regards,
Atheeq
We’re looking at making including this in the next release on Pi. Will keep you posted.
Thanks. When is the next Pi release scheduled?
Hi
I have downloaded pi. Not able to instal. Getting an error
”Not able to login. Please restart again to continue.”
What should I do?
Also let me know how can i reinstall my Pi software because when i try to use the .exe file from the https://zerodha.com/products site , it get redirected to dropbox site but gives 404 error , my version of Pi is been showed 1.0.0.0 where as the latest version in 1.0.0.6 but when try to go to Help>check for updates> it shows that this version is latest one.
an any one help me with this?
Mailed you the setup, anyhow for the latest version one should check in About zerodha pi under help menu, it should show dated 28/11/2016.
I can’t find pi installable. Can you pls send it to me as well . Thx
You can download it from: https://q.zerodha.com/pi/
I am having issues in getting the chart displayed. Right after I right-click a scrip and select chart, it would display a small dialog box ’Quick Limit Order’ and then I can’t click anywhere and have to use the Task Manager to kill Pi process. Support asked me to reinstall on a different drive than C: which I did and it seemed to resolve the issue but then started happening again.
Thanks Venu for calling so quick and fixing this issue.
This can be really frustrating. I’m having the same issue again where selecting ’chart’ will render the app unresponsive. Deleting the ’user’ file not helping either.
Is Data Box customizable ? Can I make it show close-open of a bar for example?
You can’t customize it, it already shows the open, high, low and close.
OK what I meant was the range (close minus open or high minus low). For example if I add the ’True Range’ study to the chart and hover the mouse over a bar it would be nice for Data Box to show the True Range value.
Ok, that you can’t.
As i have posted this earlier but i dont see my message , any way my Pi software gets closed by showing the error message when ever i try to open a chart or try use scanner or try to back test any strategy.
Please let me know how can i overcome this problem.
Will reach you on this, from next time for any technical queries you can write to [email protected].
Unable to download Pi software exe file. It is showing that the file is not present in dropbox link you have put!
could you please check.
https://www.dropbox.com/s/7xnzs7mdm4omlh8/pi.zip?raw=1
That file isn’t here anymore
Someone might’ve deleted the file or disabled the link.
-Shekhil
Mailed you the setup.
Dear Fellows,
I can`t seem to find a way to split Pi on multiple screens or putting different charts on different screens/monitors, is that not supported yet? One can move windows within Pi`s main window but not outside of it. Help please.
Thanks
Regards
Check this post, search for popout windows.
got it , Thanks
Now a days, When. I put/modify orders, it takes more than 30 seconds sometimes minutes to update. That too after 3.15 pm, I face this problem many times. It affects my trading. I think server bandwidth is not sufficient to accommodate all orders and it has been queued and it takes time, due to growing clientele base of zerodha. Please upgrade, as you know very well that delay even in seconds will affect marginally.
Hmm.. shouldn’t happen. What is this, equity or F&O trades?
I am doing equity trades only, Sir
Hi
I downloaded pi and installed it but I am unable to get access. I assume the client iD and password is the same as I use for kite
This is error I am getting
”Not able to login. Please restart again to continue”
Please help
Ya, same ID and password for both Pi and kite. Antivirus or firewall might be blocking pi, add it in exclusion list. Also if it is restricted network try to use in other private network. For further assistance on this you can write to [email protected].
Nitin sir, when will be the next update of PI its already April running plz do tell me
In the next few days.
sir, today i downloaded pi from q.. it installed successfully but when i opened it first time it didn’t asked for licence key and dialogue box of only login id and password was opened.. and when i tried to log in it is showing this msg ”no response from server.”
i reinstalled pi 2 times but it is showing that same msg..
please help me on this issue ..
That error will throw up when any antivirus or firewall is blocking the application or if one is using any restricted (office) network, you can add exclusion in firewall or antivirus for pi, or can use other private network, if still the issue is persisting you can drop a mail to [email protected].
Nitin Sir, Can you tell me the difference between PI vs ZERODHA TRADER vs NOW ?
Pi is the most advanced version. They are all built on a similar underlying infra. NOW is provided by NSE, hence you can trade only on NSE.
Hello
I wanted to scan for example a doji or a hammer or any other patterns but not minute wise. I wanted to check it day wise. Pi doesnt have option of a day . It just has a minute or hour tabs. Please add day patterns as well in the next update. As i need to take call afte 3.30 pm based on what patten is the index/stock forming the previous day. Or is there any other method i can do this? AI will give me runtime data but i wanted data after the close of the day.
Please help!
Scanning for daily candles is not possible but there is a way to scan patterns for daily candles but more work is needed around this. Open any daily chart, go to artificial intelligence, select pattern recognition, choose the required one.
Thanks for the reply sir.
What more I need to know is if I apply scripted alerts and tick for an option that says ’Alert at the end of the candle’ while choosing a days’ periodicity. Will the alerts arrive after 0330PM? Also what if I do not have Pi open at that moment. Will the alerts display all at once whenever I open the Pi software because I have applied many chart patterns to most liquid stocks(REL,INFY,TCS,ETC.). I do not want to look manually everyday for the chart patterns that’s why I am kind of automating it so that I get what patterns are formed at the end of the day to take positions for the next day. I hope you understood the queries. Please help!
This way of automating for chart patterns is not possible on Pi.
Scanning for daily candles is not possible but there is a way to scan patterns for daily candles but more work is needed around this. Open any daily chart, go to artificial intelligence, select pattern recognition, choose the required one.
By patterns I mean the candlestick patterns(doji,morning star,etc.)
Yes, patterns only, but only those which are available in drop down.
Scanning for daily candles is not possible but there is a way to scan patterns for daily candles but more work is needed around this. Open any daily chart, go to artificial intelligence, select pattern recognition, choose the required one.
By patterns I mean the candlestick patterns(doji,morning star,etc.). Please help in the both the queries. TIA.
Sir I am confused now. Do scripted alerts work only on runtime data? It doesn’t seem to be of any use after the markets have closed. When I click on the option ’alert at end of the candle’ and save the profile. Close the alert script tab and again open it and reload the saved profile. The tick on ’alert at end of the candle’ unticks automatically. Is it some kind of bug? or it can be just used for the runtime data that is when the market is open. So that means we need to open the scripts daily and run the alerts daily manually. Also then whats the use of the Day periodicity and having the option of ’alert at the end of the candle’ if scripted alerts only work on run time data. Please have a look on the above questions and try to understand my objective in asking all these stuff. Thank You.
Yes, scripted alert works only during market hours, only once alert needs to be created after that just apply that on required stock. Can ignore day option in scripted alerts window.
Nitin Sir,
Sir, Why I am not able to see JPY/INR July 17 , August 17 & September 17 future although I am able to see rest of the Currency Pairs like USD/INR, GBP/INR & EUR/INR . Attaching image plz help.
Direct Link- http://i66.tinypic.com/e9hnoy.png
Because there are no open positions for jpyinr for those particular months as they are very far away contracts. You can cross check the same in below NSE link.
https://www.nseindia.com/live_market/dynaContent/live_watch/curr_der_stock_watch.htm
can you include basing candles (boring candles) in blue colour in pi
Not possible for now.
Bhaiya, is it possible to make PI available for Linux and Mac ? & when will be the next release of PI ?
Ah, no. Pi is built on dotnet, so only microsoft. Next release will take time.
Sir, Please provide indicator for net change column like orange green etc it becomes very difficult to keep track of increasing and declining stock.
Will check on this possibility.
Sir,
All the data specially (net change) in equity sector vanishes and becomes zero after few minutes of market hours end which does not occur to currency sector and they remain until next market day. So please make some arrangement in equity sector too that no data becomes zero after market end.
Thank You
Hi Nithin Sir,
In Kite Web and Android app, At present there is no bifurcation to view position on daywise and netwise (same is available in PI). If i take a position yesterday and also other position today then both are seen in same tab.
Can we have a radio tab scenario so that the positions can be classified as day position and overnight position.
With regards,
bhushan
On kite web one can check the day’s positions on bottom panel of positions window called as day’s history.
In the kite web app, in positions u can see days history, which is essentially the daywise position. I am guessing it is also on android (have an ios can’t recall).
Hi , how can i save my markings in pi charts permanently ? previously i draw support ,resistance trendlines in some equity script charts and also marked some trend analysis like HH_HL and LH_LL manually but after somedays , say 3,4 days when price range changes to higher or lower range , my markings were changed to latest prices which looks totally spoiled my hard works ,please help me in regarding save my analysis .Thanks in advance
Can save it as template and reload the same on the same script, it will be saved. If not please write to [email protected].
Sir , i saved it as template and reloaded as earlier told but when price ranges changes again markings changed irrelevantly to candles , i written mail to [email protected] with snapshot . Is any options existing there in pi market watch which would shows option greeks delta, vega, theta in seperate columns like showing for price bids ,qty etc.?
( like option greeks shown in optons oracle )
If your issue is not yet solved then can you mention the ticket number.
As of now option greeks as market columns are not possible, but we are working something similar, it will take some more time.
Hello siva sir ,here given the support ticket number 984367.
Whenever any stock hits day’s low or day’s high………there should be some colour change in background of scrip in the marketwatch…..this feature is already present in nest software….n quite helpful for me during trading hours….as it will highlight those scrips in marketwatch which are making fresh day’ high or low….so kindly check on this possibility n plzz ensure this in your list of things to provide
will check on this possibility.
Please make arrangements to run pi on Android and ios. Now days running software in PC is not helpful for moving persons. Please think on this.
Please use the Kite app, Pi is a system intensive app which cannot run on a mobile phone.
HI,
When i increase the font size to 11 in pi, the text does not remain as sharp as before. The text is much clearer in nest compared to pi. Pls ensure that when font size is increased, the text remains clear.
Will check with our team but can you also check with increasing the width of market watch columns.
Add Ichimoku study in PI. It is avaialble in your kite mobile app. This will be very helpful for investors and traders to make a better decision.
In our list of things to provide.
In the Pi Screen, when the LTP hits the High and Low, there is no indication by colour change in High and Low column.
This will be very much useful to understand when a counter hits the High and Low during the day.
Kindly include it. If its already there, kindly guide me, the way to activate it.
Regards.
RamC.
will check on this possibility.
Thanks Siva for your prompt reply.
Kindly organise to show the green and red colour in 1. Net Change Column, 2. High Column and 3. Low Column
in addition to the current LTP column of Market Watch.
Early action is requested. To understand better, kindly refer to IIFL Trading Terminal Site or ICICI eMarket Watch.
Regards.
RamC.
Hi Siva,
I prefer to include the nifty and bank nifty as part of my market watch screen.
Why ”Net Change” is not appearing for the indices.
Can you please look into this also.
Regards.
RamC.
On market watch column select NSE, instead eq go for Indices and next to that column select the required index and add to market watch.
Net change will be displayed for all during trading hours, if not can you write to [email protected] with a screen shot.
I need to tell that in market watch, I am aligning the stocks which I really doing trading. Also,. I made aligning like stock name, bid. Rate, ask rate and so on to my convenience. But, if I close PI and open next time, thee alignments changed on its own and every time I have to change as per my taste taste, even though I have given the option of ’save market watch on exit.’
This problem may please be resolved. My No.RB1790.
Select layout on exit and apply, also make sure to exit from pi instead forcefully closing the application.
I am doing so. But the problem exists from beginning. Please resolve.
Thank you.
will reach you tomorrow on this.
Dear Sir,
In Pi, If possible please add the screen of gold rate and rupee Rate like Sensex and Nifty Live. Tech stocks have impact with INR/Sterling/USD.
Also, the Live screen of Sensex/Nifty May be. little bolder. To easily view without Strain to eye.
I hope you include these things in your next updates of Pi.
Thank you.
Will check on this possibility.
why don’t we have latest Supertrend version. In pi we are using supertrend version 1.0 and there is AFL we can have supertrend 5.0 which is far better in accuracy. I requesting you for the update of same. We can have many more trading signal provider in PI and which can make PI unbeatable and more powerful software. We can have sqeeze momentum indicator and many more. This is feature request for new update of PI. thanks.
zerodha is always doing creative things. Very appreciable.
Crucial Feature Request for After Market Research and During Trading
Right now what I have notices is a problem in after market research. I have to rely on third party softwares for after market research before the start of the next day. Its not with zerodha but with every broker i have been with.
I have a set of scips lets say all FNO. After the market closes, I want to apply some specific indicators and then with my eyes need to reasearch all the scrips under my scanner. Lets say 150+. These 150+ i also scan during the normal market timings. Now out of 2000+ scrips in NSE i have to select a stock and add it to market watch. And to see its chart, everytime I have to do Shift+C or right click and chart and then chart settings everytime. Which is waste of time.
I want a system where I have added indicators, added scips, set the time frame and now all I need to do with my keyboard I have to keep scrolling with my arrow keys up or down to and scan the trades.
In current setup at PI it is very difficult. Plus I have to bear extra cost of Charting Tools plus its Data. Please see if any thing can be done regarding it.
You can add all indicators and save it as template and apply a default template, if you open any chart it will come with all added indicators.
Also can you let us know the name of current charting application you are using.
can u please add feature of weekly charts.. dire need of it
will be available in next release.
When will be next update of PI available also the blank space in market watch getting saved or not in that release.
In another 2 to 3 weeks, blank spaces also addressed in that release.
Sir , As we as traders are very much grateful for providing Pi and features in it . I have a request that you kindly add
line chart also . thanking you.
Will be available in next release.
Zerodha Team,
I am new to Financial Market. I have started using Zerodha Pi terminal, but I see there are many fields in PI terminal (Admin Position, Cash Position, Stock Holding etc) which I do not know what they mean, what information they display, how those field values are derived and when values will be displayed in them (fields) etc.
I have checked http://tradelab.in/pidoc/ and also googled, but no help. Few of my other friends and relatives also have same issue.
Could you let me know whom to contact who can explain or share document if already exists? If there is no documentation, then I think it will be helpful to provide a documentation which explain all the fields in the terminal.
Thanks.
Sir following things are missing, which I think essential for traders-
1. Monthly and weekly charts, with an option of adjusting corporate events. kite also does not have an option of adjusting corporate events.
2. Predefine Marketwatch of stock with high margin.
3. The scanner doesn’t have an option of scanning daily chart.
1. All charts are adjusted by corporate actions from our side. If you see any stock which isn’t, let me know. Monthly/weekly charts will take time.
2/3. Will bounce this off our team.
hi
in PI ” HMA” indicator had a bug , it is quashing the pi , if the program runs longer time ,
thank you
Can you please write to [email protected] with a screenshot with more details?
hi Venu
Screen shot of what ,, ” not working PI software ” or the `bug` ,, I am not that much intelligent as you ,
i dont know how to take screen shot of working pi.exe file ,,
Nb ;- Mr venu you are not provided source code of pi to your clients, & your support team does not have that much capability to understand this problem ,, if they can they will report this thing long back ,, HMA is not introduced yesterday..
Nithin Ji, when will be the next update of PI available and if the following features will be available or not ?
i. net change column with orange/green indicator
ii. space in market watch getting saved
iii. ichimoku kinko hyo in charts
iv. short column like volume ( volume traded today), TBQ(total buy quantity), TAQ(total ask quantity), change(net change)
hi
in pi new study features like `super trend, donchian channel HMA etc … are added long back i appreciate that work
But you are not updated the `’’ TRADE SCRIPT ’’ for those updates,,
Mr Nithin i am seen several times you are saying about ’in house product’ of ’’ Artificial intelligence’’ and its brain Dr Kailash nadh ,,,
If your Dr:- dose not have that much intelligent to add the script code to help content
or you are thinking your customers have to code them self
thank you.
Nb;- (*_*)
Binu, firstly Pi is not ”an in house product” and its brain is not Kailash. I have never said this. Pi is built by a company called Tradelab, they are also limited in all that can be done on tradescript. Tradescript is not their proprietary coding language.
Hi All,
I am facing two issues.
1. Unable to export data from Pi to excel. When I use “Link to Excel” option an excel file opens with N.A. in all the cells.
2. After market hours, the net change and %percentage change columns in Pi are showing “0” for all the scrips. Values were visible in these columns until two days back even after market hours.
I have reninstalled Pi but both the issues remain. Please help.
Thanks.
Hi Kamal,
Did you found the solution for the above problem of na values in excel? If yes can you please post it here. I am facing the same problem.
Cheers,
Ravi
N.A will appear after market hours, I mean values will be changing only during trading hours. Also make sure ms excel is of 32 bit version and not 64 bit.
i want Atp or vwap in Pi chart plz add that feature , it is very important.
Guess Siva just replied, To add ATP ->Right click on column header and select choose columns, tick ATP.
VWAP is not available on Pi yet.
how to add Vwap/Atp in Chart in Pi ????
To add ATP ->Right click on column header and select choose columns, tick ATP.
VWAP is not available on Pi yet.
so when is the new PI version being launched , will it be a new version or some minor changes ? i hope you place the horizontal and drawings – lock feature to keep it in place
also hope you would explore to reduce the font size of the headers to help accommodate more charts
Sooner with minor changes.
that is very unfortunate . I was hoping PI would have changes that would take it to the next level and eliminate the need for multiple external software’s
is there any 64bit PI version?
No, pi is only 32 bit version but it is compatible with 64 bit OS.
when i am opening chart in kite its coming Error fetching quote 400 and its not opening though it was working fine before how to sort it
thanks
Hey Rahul. This was an intermittent issue and has been fixed. If this is happening for you persistently, please write to [email protected] with more details.
plz add horizental line at 0 in MACD
Point noted.
i want ema or sma line with trend changes color means up trend with blue and downtrend with red color how to plot that color?
Not possible currently.
how to plot any moving average with HIGH or LOW like in default it is close but i want to plot with any sma or ema with HIGH OR LOW , how to plot that?
Check this post, explains. It shows up in the dropdown when you add indicator.
How to view more than one chart along with small size in pi ?
Check this.
when will ichimoku clouds support be available?
pi, new version, when ?
Maybe in the next 2 to 3 months.
Kindly send me the download link
Check this post.
Can you add a tab that gives bse and nse stocks by volume. and spurt in volume. This is available on bse website but it is delayed. Also is it possible to have a tab with my 4 charts on that tab, i.e, create a new marketwatch only for my charts?
Will be tough now, but maybe in some time.
Hi,
Can you please add a price alert in PI feature, like it is in NEST Trader. I do not intend to use scripted alert, just a right click, price alert. This is the only reason I am not using PI now.
Thank you for your understanding.
In our list of things to do but will take more time.
Dear Sir,
I am new to both trading and coding. I wanted to ask that when the buy/sell orders generate on the basis of some EA, will the alerts come only on Pi? I can not access a computer in my office and thus can not access pi. Is there any interface between pi and kite? Also my pi crashes a lot, especially when I save an EA/Exit a bracket order or load charts. My workstation conforms all the requirements. Thanks.
Yeah, alerts come only on Pi. If you are running EA, make sure to have a powerful computer and internet connection. These are usually the reasons for a crash. You can send an email to [email protected], our techsup team can call and check.
Nitin ji
when you open up ”Order Book ”in Pi , all the headers width can be adjusted like Pending qty , price , trigger , but only one header seems to have been missed out ” disclosed qty ” . hope this header width can be made adjustable .
Sure, point is noted, will be adjusted in next release.
the market watch should revert to the same view when it was last saved. When we log in now, the market watch rearranges the stock in a random way and also removes the space between two rows if created.
Goto view-> user setting->market watch and select save layout on exit. Also don’t force close the application and use logout option to close the application. Saving spaces is handled in next release.
sir
when ”add custom column” feature will be provided in Pi.
Is in our list of things but will take more time.
Seriously guys you need to build PI for different os version like mac and linux ( atleast ubuntu and linux mint ) because we all are standing in a line to enjoy this opportunity. Yes it is true that presently PI is only windows based and this truth is prevailing for more than 2 years now guys another justification is we can use kite but kite is not even upto mark with PI like no. of stocks in each market watch is very low lack of details and so on. Please I am requesting you guys on behalf of all mac and linux users do make some PI for us.
When is the new update for Zerodha Pi is coming ?
Simple question does cover order stop loss gets placed at exact price specified or their is possibilty of it getting executed at much lower price than the trigger price?thanks
As the stop loss order is a market order once the stop loss price is triggered it will be traded at best available price in the market, which can be slightly above, below or at exact trigger price.
is PI software available for non WINDOWS operating systems like MAC/ UBUNTU and other LINUX versions???
Only available for windows OS.
Doesn’t work that great.
When can we expect level 2 data for PI and KIte?
What you see now on our platforms is Level 2 data only, which is best 5 bid and offers.
Hi, I know pi is built on the dot net framework and is inherently incompatible with mac. However, i request you to start working on a desktop trading platform for mac as there are thousands of users who are shut out from using pi. Using virtual machines do not allow the user to harness the full power of his computer. The number of mac users is only going to grow relative to windows over time. Yes i know kite exists, but its simply not as feature packed as pi. You were the pioneers of the discount brokerage service. Now its time to be the pioneer of the 1st desktop trading platform for mac.
Hi,
I just tried downloading Pi software, My antivirus – Norton Security, deleted the download, saying Trojan found. Can you please check, have sent the screen shot to support as well, but posting in this forum to check if anyone else had similar issues.
Thanks
Nagraj
The probable reason may be your system got effected or antivirus will be showing trojan for all Exe setups, either you can add exclusion for Pi or can scan your pc.
hi nithin kamath
I call to your support team to get query about account , I am asked to get a MALAYALAM assistance ,, they said there is no malayalam assistance, you people only have English, Hindi, Tamil , Kannada, etc.. In Karnataka you have 6 offices and in Kerala you had 5 offices , means a strong customer base in kerala for zerodha.
Are you people are ignoring the state of Kerala or you thing All keralites are third class people?
You can write a perfectly understandable complaint in english but are still bent upon getting assistance in malayalam. I think you have issues. Dont make such petty meaningless complaints on this forum for gods sake.
hi
I have issues ,, ” Why i don`t have the right to talk in my mother tongue” ,,, every major broker in india had regional support ,, when i contact to your regional office in Kerala they even dont know anything ,,, they will say that they will contact HO & replay back .. ,, then why i can`t directly contact to HO & solve the problem directly..
NB;- Jia Roy if you think you are psychiatrist solve the above issue
@Binu
Apologies for inconvenience, I believe you got the call back and your issue is addressed.
Binu, our Bangalore support office currently has no one who can speak malyalam, we have quite a few who can speak malyalam in our sales team, our tech team, etc. The Call center team currently doesn’t have any. You can always call our Cochin office for Malyalam support.
I am your client and i like your service and pi software…i have a concern when their are huge movements due to some announcements like today’s budget,us elections etc when the price changes at a high level the pi software gets stuck and i ended up loosing a lot of money and a lot of opportunities to make money….i want to know why it happens and solution????.
If i dont get a solution i will have to change brokers as its a huge concern for me(ps – pi works fine when market is not volatile)
Hi, when markets are moving fast, a lot of ticks are sent out to the user. At that time it is also important that your internet connections are running well, if not there could be a buffer created which chokes up the feeds. Also make sure that you are not running multiple streaming platforms on the same computer.
So when is the new update to Pi coming?
It may take another 2 or 3 weeks.
Nitin Ji
Sometime back i had mentioned this .
a) is it a problem if you have a order window with both – Buy price and Sell price in the same pop up under Normal / MIS /Limit / SL . What i mean to say that i assume a buy price target in the order window and also place a sell order in the same window . When the target price approaches the window i hit the order screen .
The reason i am asking this is it helps trading in a 50 paise range for larger volumes , I dont have to go back to the default MW again again to fill in details.Valuable time is lost
I know you would say that one can place orders in advance , but you are aware that there is no guarantee that those orders could be executed in a fast moving market and it would hit the sell tgt first instead of a buy target as per sequence and would entail losses.
Would you like to consider this feedback as it would save precious time in orders.
Are you talking about Bracket Orders with Buy/Sell price, Target price and stoploss price in the same order ?
no bracket has constraints .
Why don’t you use the quick order feature on Pi?
nitin ji
i use Pi for trading only and NT8 for charts , quick order happens only ifi would be following charts on Pi . The reason being features and Horizontal line lock not being available in Pi charts and that is essential for me to decide my entry exit points . The lines keep on jumping and changing and hence i have to use NT8 for charts.
When you have multiple charts opened up ,Quick order would not help since one is looking at Market watch to move in and out . If one can have a Buy price and Sell price in the same pop up under Normal / MIS /Limit / SL one can make less mistakes and earn in a short 30-50 paise range. I have 75% accuracy in the stocks i trade but i tend to loose money since the range is short . I hope you understand my request . It would be very useful for traders who work on short price and higher volumes.
Hello,
Have 2 issues with Pi:
1) We are unable to save the drawing we do on a chart for analysis (If we cant save drawings in Pi, is there any work around for this? I need this as i save my analysis and take trades base on the drawings saved earlier)..
2) Can we expect to have a ZigZag tool/Indicator in Pi sometime soon?
Thanks
Sukesh
1. It can be done, add drawings to chart and right click on chart and save it to disk. Goto file and load chart from disk.
2. Point noted.
Zerodha should quickly provide Pi platform for apple mac users.
Many a times web based kite platform is slow and on important days kite usually has some problem.
Kite doesn’t even allow to set separate stop-loss and sell order. It only takes one order.
There are many mac users who are waiting for Pi support on mac. Please provide this asap.
As Pi is solely based on dot-net framework it is supported only on windows OS. One can use Kite on any OS, we do have ios mobile app for kite. To mention when it comes to placing of orders both Kite and Pi function the same way.
Pi works on dotnet, so won’t work on mac. Kite has everything that Pi has, you can set separate SL and sell as well. Can you check this: https://kite.trade/docs/kite/
Please give provision to —
1. Get anytime frame chart like 75 minutes, 45 minutes etc.
2. Add more than 2 nos of lines in Oscillators like RSI.
3. Intraday/Realtime Charts for atleast 01 year.
4. Fill up those data for charting software like Amibroker for Offline study use.
5. Add more type of charts atleast Line Charts.
6. Add Ray or extended Trendline.
7. Accept orders for Target and stoploss without requirement of additional amount as available with some other brokers.
1. Not possible as of now.
2. One can add any number of horizontal lines and drag on to indicators as we are already providing with default lines.
3. Intra day charts are available for 6 months, highest number of days provided by any broker in India.
4. You can do on your own, also export of data and link to excel both options are available on Pi.
5. Line charts will be available in next release.
6. Point noted.
7. One can place both target and stoploss provided account is having overall positive balance. Check the below link.
https://www.youtube.com/watch?v=Wx-U9Zt4qk0
dear sir
during trading hours – in real time – i want to know which symbol out of nifty 500 index shares( total 500) had crossed the bolinger bands in daily charts . so please tell me how Pi or any other tool of your’s can help me in filtering out my targeted stocks.
thanks
Not possible currently Vinesh.
Pi terminal support weekly and monthly charts like Kite? If not, then how soon it is planned to be provided?
It will take time.
I don’t understand why can’t Pi run behind a proxy server, my ISP runs with proxy only but Pi doesn’t support it. What’s the work around, pls don’t suggest me kite.
by the way, you’ve got worst customer support. Damn rude and of no help. ticket #638032
Siddharth, all trading platforms are constantly communicating with an external server and sending/receiving data, so most offices block trading applications from running. Our team has shared the port details with you so please get those ports unblocked in your office network and it’ll work like a charm.
Here are the ports:
5004, 64104,65000,56000
Guys, please introduce global index and Global currency rates in pi it will be really helpful
Only possible if cross currency pairs start trading on Indian exchanges.
How about Global Indices then many indian brokers already provide them.
https://tradingqna.com/784/how-can-an-indian-investor-invest-in-foreign-stocks here’s how one can invest. The rules around investment in foreign stocks are quiet complex.
I am not talking about investing in foreign stocks or markets what I want is that if it is possible to track their value so that we can determine their influence on indian market like——
1. if nasdaq or dow or dax or hangsen or sanghai is rising or falling
2. eurusd, eurgbp, gbpusd, oil price, gold price
all of these in a single place like world markets summary
To show the market summary legally, we will have to subscribe to data from these exchanges. Not really possible. Why don’t you check yahoo finance world indices, has everything in one place. http://www.marketwatch.com/ is a good place for international currency and commodity.
Can you pls make the stock holding tab in pi dynamic, i.e like it is in kite. The profit/loss should update without having to refresh each time..
Point noted, will pass the same to our tech team.
Hi, Pi does not scale properly on resolutions higher than 1920×1080. Pls make pi display properly on higher resolution monitors.
Thanks
Can you please share a screenshot to [email protected] on this.
dear sir
is there any tech-problem in providing charts of higher time frame , ie greater then 1 hour in kite web .
if ” yes” then ———— ?
if ” no” then , why are you not upgrading it to 4 hourly and daily charts ?
We do have daily, weekly and monthly options also, please check first three options on drop down window.
ok sir , got it , but 4-hourly time frame chart option is not there. plz add it also .
thanks
Will pass this feedback to our tech team.
Hi Zerodha Team,
I am not able to download Pi software. It says, its been removed from the Dropbox. Could you please provide the download link for it.
Thank you,
Regards.
Murali
Will reach you on this but from next time for any support related queries you can write to [email protected] for a quick fix.
If I buy USD/INR JAN17 currency future then
i. What will be the expiry day of any currency ? in my case its usd/inr
ii. If I don’t want to sell on that day instead I want to convert my position to USD/INR Feb17, Is it permissible if yes what criteria I have to follow in doing this ?
Check the below link
https://tradingqna.com/2177/how-is-the-settlement-price-for-currency-futures-arrived-at?show=2177#q2177
You can close jan contract and open feb contract, no criteria as such.
Hey siva , You didn’t get me there what I wanted to know is that suppose on 10.01.2017 I have entered in ”USDINR JAN17 FUT” and incurring a loss of say ₹ 200 on 27.01.2017 (expiry day Friday ) prior two working days ( Monday, Tuesday of the month), now I don’t want to book my loss or square off or exit my position instead What i want is that if it possible to convert my existing open trade to ”USDINR FEB17 FUT” from ”USDINR JAN17 FUT”. Thats what I wanted to know.
That is not possible, you have to close Jan contract and enter in to Feb contract.
1. 27th Jan is the expiry date
2. It is called a rollover, you will have to exit the Jan future and take a new position in feb future.
Hi,
i’m unable to view charts on Pi, it gives error message ”Unable to fetch historical chart data for Infy, only live data will be there”. Please help
Can you email [email protected] for account specific queries.
Plz make PI available for linux
Not possible.
My question is whether spread order will be made available on Pi anytime soon. Currently only available on Zerodha Trader (NEST) and ZT is not very stable, particularly when charts are opened using Nest Plus.
In our list of things to do but will take some more time.
I suppose even 2L/3L order would be in the same timeframe. Could you specify the timeframe please.
In our list of things to provide but can’t commit on exact time.
AP, will take time.
can I use kite web and pi both at the same time, if yes then how.
pi is quite good for charting and analysis but not as good for trading while kite is good for trading not as good for charting, so can I use both at the same time ?
Not possible.
Nitin Ji
what is India International Exchange (INX) ? are we allowed to trade there ? will zerodha be offering a link to these services .is there a website
We are not yet a member. Indian retail traders are not allowed. Check this link.
thanks , clarity at last
hi
is zerodha a trade member in India INX ?
Not yet. Check this out.
hi
can we have fib retracement and extension in same tool many software have it in one click we can have retracement and extension at same time its very usefull kindly update it in next version
Yeah on our list of things to do.
Hey there, Why the brokerage calculator is showing more than rs-20 brokerage even if the pricing chart is showing something different like 0.01% or rs 20/trade whichever is lower ” USD/INR FUTURE 27JAN2017″ bought at 68.1975 sold at 68.3825 Image
” https://s29.postimg.org/5ebve2fvr/Currency.jpg “. Plz guide me.
This is for both buy and sell orders, 20 for buying and 20 for selling, hence 40
Yup I got it sir thank you.
Is there any plans to launch desktop application of Pi for Mac? I’m a Mac user and the population is growing fast, would appreciate a version in Mac if possible.
Pi uses micrososft dotnet, so will not work on mac.
Can you add a feature which allows a user to execute multiple( bracket) orders when the market opens i.e at 9:15 am.
This feature will save lots of time and money
Thank you
shivam
Will check on this possibility.
I am notable to download PI. Request your help for the same.
Thanks
Kaushal
Can you write to [email protected].
nitin ji
sometime back i had raised this feedback on internet network disconnection / change in internet network midway and PI does not take fresh orders even after reconciliation , one has to re-login again.
can you see this as a feedback and work on making internet network seamless for Pi even if a internet network is disconnected / midway switchover to another internet network.
In our list of things but will take more time.
Hi… have been using pi… amazing experience till now..
1) can Ichimoku cloud be integrated with pi.
2) when I apply fibonacci or the camarilla pivots,the entire chart gets minimized. .. any solution for this..
3) colors of the Di lines in adx indicator as per my preference …
1. In our list of things.
2. One can click on up arrow to get to desired screen size.
3. will try to give in next release.
thanks siva
Dear Siva,
I started getting familiar with PI recently.
It will great if the color and pattern for all the lines that bet plotted for any study can be configured as per user preference.
I will give example of adding MACDand STOCH on a symbol.
You will see that the colors of STOCH and MACD are exactly opposite and also that they do not come up clearly on DARK theme.
Also the color and pattern of the ZERO line as well as boundary lines should be configurable.
Any chance of getting that in PI?
Hi i got my Kites login id and password. it was told that i would receive separate mail for Q login. but i didnt receive till now. Will it take some time?
You should have already received it, if not can you drop a mail to [email protected].
HAPPY NEW YEAR Nitin, Siva, Karthik and all the others in the zerodha team for their magnificent creation ie ZERODHA and for their excellent support in readdressing the customer grievances. Hoping the same for the upcoming years.
Thanks Guys
Happy New Year to you too. Thanks, I’ll pass on your good wishes to the entire team 🙂
dear siva sir
there is a problem with kite charts continuously irritating me , whenever i open any chart of any time frame before market open > it starts ploting tick chart on the very first minute of market open . lets assume at 9:10 am i open nifty chart of 5 min , at 9:15 in very first minute it starts ploting ticks on the chart instead of showing one candle of 5min and all price action on the same . to solve this i have to refresh charts after the 1 minute is completed , this thing divert the contentration from market at opening atleast for 5 min , because at opening i track 4-5 charts for my trade to decide .
kindely solve this problem .
thanks
vinesh kumar
Will check on this.
Hi, while iam clicking Stop backtest button, it opens another chart page for that back-tested script and iam not able to close that chart page, it says the chart is currently i use… is it something iam doing wrong? please advise.
Still the plotting might be happening on the chart you are trying to close, wait for few seconds before closing it, if still facing any issue then can write to [email protected] for further assistance.
Pi installed but unable to log in. Couldn’t find the place to register the setup with the key. Kindly help.
Log in to backoffice Q, and click on Pi on which license key will be displayed, copy and paste the same to complete one time installation process. If any assistance is required then can write to [email protected].
Does Pi terminal deliver data to us as change occurs in tick price.
Or is it using a certain interval(period) to flash data at us
whatever might be the price at that moment.
If so what is the interval rate at which Pi is flashing data at us.
Observation:-
I have Full Nifty scrips opened in MarketView. Pi shows the count of 51. but very often few of the
Scrips go updation less even for full minute! For instance even when i was tradeding in INDUSINDBK few days back
its scrip updation stopped happening in Pi for a while there was niether Red Color nor the Green color anywhere
on the row displaying INDUSINDBK. this happens with various scrips from time to time randomly. Why is that so?
Why are we not getting data consistently for the limited scrips that we have opened. These scrips are not the ones with dull activity they are quite liquid and frequent in trades.
Thanks
Regards
Data what you see on Pi is provided by Thomson reuters who is one of the top data vendor across the globe so there is no point on reviewing on data quality.What one should understand is about data transmission as there will be thousands of new ticks available for each contract on per second basis it is impossible to transmit all the ticks via internet. Check this link to know more about this. https://tradingqna.com/8843/technical-charts-google-finance-yahoo-finance-amibroker-match?show=8896#a8896
Adding to above reply, last week even though markets moved many scrips are less liquid and flat for most of the day.
I apologize if questions sounds rather obvious but i am getting confused. I am trying to track Volume change. But either Pi is not delivering consistent data or my understanding of data is wrong. There are 7 parameters i am interested in. LTP, LTQ, BidRate, AskRate, TotalAskQty, TotalBidQty, VolumeTradedToday.
Situation Starts:-
1)
LTP | LTQ | BidRate | AskRate | TotalBidQty | TotalAskQty | VolumeTradedToday |
—————————————————————————————————————————
1000 | 25 | 999.95 | 1000 | 10000 | 10500 | 1000 <– if Pi is flashing this
————————————————————————————————– at this moment
2)
LTP | LTQ | BidRate | AskRate | TotalBidQty | TotalAskQty | VolumeTradedToday |
—————————————————————————————————————————
999.95 | 10 | 999.95 | 1000 | 10000 | 10500 | 1000 <- and this the next moment
—————————————————————————————————————————
in the 2) situation i am assuming that since Last Trade happened at 999.95 ( LTP ) with Qty 10 (LTQ ).
VolumeTradedToday should increase by 10, shouldn`t it? to 1010. since LTQ is 10 it should get added to previous 1000. Or would it get updated in the next cycle of data updation by the Pi Terminal. i.e When a certain trade happens the change in VolumeTradedToday is updated simutaneously along with the trade or first the trade happens and then the value is updated for VolumeTradedToday.
Next Point:
In above 2) situation, since the trade happened at 999.95(LTP) with 10 volume(LTQ), so should it not be substracted from TotalBidQty so now TotalBidQty would become ( 10000 – 10 ) = 9990. or would it happen in next data updation cycle.
Does it make sense what i am asking! or does it need more elaboration. I have to ask more please tell me if i am
making it complicated for you to understand so i can make it lucid somehow.
Thanks
Regards
Will get back to you on this, also it would be appreciated if you can write to [email protected] or call 080-40402020 for these kind of support queries.
Will these be included in next major update :
1. Net change column with green and orange color for price up and down
2. Ichimoku in charts
3. Short header like – Prev Close (close), Total Bid Quantity (TBQ), Volume traded today (Volume) etc
4. Net change becomes 0.00 after market closes becomes very dificult to track stock prices on later time
5. Fixed index ticker at present which is floating and always on top
6. Live view limited to 50 stocks only can it be increased for another 20 or 30
7. Space getting saved in marketwatch
8. World indices like dow, nasdaq, dax etc
Thank You
Couple of them others in future releases.
Plz provide 52 weeks high 52 weeks low
Double click on the Equity scrip to open market depth where you’ll find the 52 week high/low.
Thanks Man
Hi Zerodha Team.
Can you tell how can i place cover order and bracket order on PI using API and placing orders from 3rd party application(.net c#).
Is api a paid service?
As of now, you can’t place CO/BO orders on Pi using any API.
December 26, 2016 at 11:26 pm
siva
just a recap if you can accommodate some of the feedback in the latest PI updates that you intend to do
a) right click “lock” feature for lines horizontal / vertical or drawings
b) reduce font size of headers of scrips charts panel so that more scrip charts can be accommodated or atleast reduce the headers ( example : default market watch , tatasteeldecfut 1 min ) to font size 7 or lower from current size which takes too much space
c) copy paste feature for lines , drawings etc
thanks in advance .
Feedback taken and passed on to the Pi development team.
I think nitin don’t have any reply .we know that we can put trailing stoploss which shifts automatically but market is not constant and changes its direction simultaneously and we have to change our tgt too.modifying order I a big challenge at that time.NITIN hope you reply some day or the other for this problem
As of now one has to modify each leg, will forward this to our technical team and if possible will do the necessary setting.
Aashish, what’s the backdrop to this post of yours? I’m not able to relate it to any unanswered post.
Can you please provide for support the Terminal like Pi for MAC OS X ?
Pi won’t work on Mac, you can use kite.zerodha.com any OS.
Will these be included in next major update :
1. Net change column with green and orange color for price up and down
2. Ichimoku in charts
3. Short header like – Prev Close (close), Total Bid Quantity (TBQ), Volume traded today (Volume) etc
4. Net change becomes 0.00 after market closes becomes very dificult to track stock prices on later time
5. Fixed index ticker at present which is floating and always on top
6. Live view limited to 50 stocks only can it be increased for another 20 or 30
Thank You
siva
just a recap if you can accommodate some of the feedback in the latest PI updates that you intend to do
a) right click ”lock” feature for lines horizontal / vertical or drawings
b) reduce font size of headers of scrips charts panel so that more scrip charts can be accommodated or atleast reduce the headers ( example : default market watch , tatasteeldecfut 1 min ) to font size 7 or lower from current size which takes too much space
c) copy paste feature for lines , drawings etc
thanks in advance .
When is the next update of Pi Platform?
It will be in another 3 to 4 weeks.
Background: I was able to save the chart which had SMA etc on it via ”Chart -> Save -> Save Chart on Disk” functionality in PI terminal, and it was saved as *.chart file.
Questions:
a) How can i open the *.chart file saved on Disk?
b) Does PI save the chart with all the indicators, drawings etc on it when chart is saved on disk? Thus when we open the *.chart file it displays everything it had (indicators, drawings etc).
Regards,
Atheeq
1. Go to file menu and select load chart from disk.
2. Drawings and indicators will be saved but not horizontal and vertical lines.
Siva,
I tried opening charts saved on disk via ”File -> Load Charts From Disk”, but the functionality is not listing the charts I had saved though they are present in the disk (drive), because charts were saved as ”*.chart” file extension where as dialog box to open chart from disk looks for chart files with extension *.icx. Let me know if you want me to send screen shots of this issue. Kindly assist.
Could you update or respond on my query?
That file might have got corrupted, can you create new one and try, if still you are facing any issue in loading saved chart from disk please write to [email protected] mentioning the same.
nitin pls take some to efforts to reply as you mentioned earlier that you are also a trader so explanation is expacted from you.
As of now one has to modify each leg order separately,but one can also use trailing stop-loss so that stop-loss is modified automatically.
WE WE PUT BRACKET ORDER FOR EXAPMEL TODAY I BOUGHT 100 SHARES OF AMBUJA CEMENT AT 190.35 AND SHARE CLIMED A BIT TO 191.20 MY SL WAS 190.NOW WHEN I WENT TO ORDER BOOK TO TRAIL MY STOPLOSS I SAW THE SHARES HAVE CAME IN 11 MULTIPLES OF TIME.NOW THE WORST THING I HAVE TO CLICK EACH ORDER TO MODIFY THE SL TO SHIFT IT UP.I WAS HARDLY ABEL TO MODIFY 3 SL AS IT WAS TIKING 10 SECONDS TO MODIFY EVERY SINGEL ENTRY AND THE SHARE CAME DOWN AND HITTED MY INITIAL SL OF 190.THERE SHOULD BE A SINGEL ENTRY WITH AVERAGE BUY PRICE IN ORDER BOOK SO THAT WE HAVE TO ONLY MODIFY SINGEL ENTRY OF AVERAGE BOUGHT PRICE AND ITS DONE.MY INDIABULLS SOFTWARE HAVE THE SAME AND I AM SURE THAT EACH AND EVERY BORKER ARE ALREADY HAVING THE SAME.YOU JUST THINK THE QUANTITY WAS 100 IF THE QUANTITY WAS 1000 AND THE SHARES HAD CAME IN 25 BREAKUPS THE YOU CAN THINK WHO THE WORST SITUATION HAD BEEN .
I know how bracked order works at the same time tgt and sl are placed.what I am asking is about the multipal orders exacuted .there should be one single entry of average boughg price where we can odify our bracked sl or tgt price and only by modifying the single one entry of average bought price it should be modified in all the entries .I am sure any trader successful in this field will never modify his entry 10 to 25 times just to trail his sl upper or lower.
thanks nitin ji for your valuable insights , i will want to ask you more on volumes , liquidity and amo…later.
thanks again
When will the next major release of Pi be out? Also once it is out, can you do another webinar explaining the features that have been added since the last webinar on pi.
In another 3 to 4 weeks time,sure will do.
Hi Nithin,
Can you incorporate the MIS multiplier (eg: 10x, 11x) directly into the order window as well as the margin required to buy/sell 1 contract in CNC and MIS? Also can you put an option to check the lot size of a particular scrip in pi itself instead of having to check the span website each time.
Thanks
Yes Ron, on our list of things to do.
Nitin ,
Sorry to place this question here
How does one guarantee that a shorting a stop loss order goes through , Ive tried limit and its a 50:50 chance . Is there any suggestion that shorting stop loss orders go though in most of the times.?
Didn’t get your question Chandru, as long as you are using SL-M order, it should go through 100% of times unless there is no liquidity. Check this post.
yes nitin i do agree on liquidity but how do short sellers achieve their targets ? my price trigger does execute 50% of the time since the price drops suddenly and i miss the juicy ones.
If i can sense of the price fall / rise in advance , how do i take it to my advantage .
For example i want to short 1000 shares in F&O . maybe 2 lots for example
a) Do i need to break my orders in 2 lots over a 2 sets of prices apart and place 2 plain SL stop loss orders hoping that one order gets executed.
b) place a order on market which is more dangerous and may be a partial fill
c) Or place a SL – Market orders .I read that SL – M orders get executed ticks below the trigger price would that be dangerous also ? do i need to experiment to find out the difference between trigger price and actual price is 5-10 paise or more ?
Which is better .
SL-M orders are always better since they guarantee execution. Yes, since they are market, the fill might not be great.
Hello Team,
As I understand from above comments , weekly / monthly charts will be made available soon , aside that can we have weekly monthly pivot as well ? Also most of the time traders wants to draw trend line some comments etc on chart but in pi as soon as you close the chart all vanishes ( in sharekhan trade tiger whatever you draw same is saved on bakend automatically and in future whenever you open the chart same is available ) do you guys have any plan to add such feature ? as it will really help trader to recall his analysis .
Yes,in our list of things to do.
1. In Charts through quote screen, entry option for buy / sell window there is no provision to cover order and bracket order. please provide the same as is in regular market watch.
2. How to have multiple marketwatch open. eg. one default market watch of pharma stocks and one Equity marketwatch which i am creating. I want to know is it possible to have multiple market watch open at same time.
Thanks in advance.
It is possible to have multiple market watches at same time,after creating new market watch go to view->user settings->market watch->select save layout on exit, apply,ok. From next login what ever change is done for last time it will be automatically saved.
WE WE PUT BRACKET ORDER FOR EXAPMEL TODAY I BOUGHT 100 SHARES OF AMBUJA CEMENT AT 190.35 AND SHARE CLIMED A BIT TO 191.20 MY SL WAS 190.NOW WHEN I WENT TO ORDER BOOK TO TRAIL MY STOPLOSS I SAW THE SHARES HAVE CAME IN 11 MULTIPLES OF TIME.NOW THE WORST THING I HAVE TO CLICK EACH ORDER TO MODIFY THE SL TO SHIFT IT UP.I WAS HARDLY ABEL TO MODIFY 3 SL AS IT WAS TIKING 10 SECONDS TO MODIFY EVERY SINGEL ENTRY AND THE SHARE CAME DOWN AND HITTED MY INITIAL SL OF 190.THERE SHOULD BE A SINGEL ENTRY WITH AVERAGE BUY PRICE IN ORDER BOOK SO THAT WE HAVE TO ONLY MODIFY SINGEL ENTRY OF AVERAGE BOUGHT PRICE AND ITS DONE.MY INDIABULLS SOFTWARE HAVE THE SAME AND I AM SURE THAT EACH AND EVERY BORKER ARE ALREADY HAVING THE SAME.YOU JUST THINK THE QUANTITY WAS 100 IF THE QUANTITY WAS 1000 AND THE SHARES HAD CAME IN 25 BREAKUPS THE YOU CAN THINK WHO THE WORST SITUATION HAD BEEN .
That’s the way Bracket orders work. The Stop loss and Target orders get filled in the same quantities that your initial entry order got filled in.
Hi Zerodha Team.
The following are the list of my expetations from zerodah, not sure its already in todo list.
1 . Please create separate thread to user to find the upcoming features on zerodha PI releases. currenly we dont have any idea on what is there in next version of PI
2. Need scanner for gapping stocks,based on indicators etc.
3. More charts needs,when we have multimonitor setup,using 15 charts max is not effective.
4.Charts need to be auto adjusted lime MT4 chart when tile window option is clicked.
5.connecting multiple charts using script link is needed (like tradetiger)
6.Desktop API for placing orders from 3rd party application to PI + Realtime datafeed (free of cost,as sharekhan).
7.Placing Bracket order and cover order from charts
2. Not possible on daily candles for near term.
3. Will provide.
4,5. Will check on this possibility.
6. Already available but little complicated as of now, will optimize it in coming days.
7. In our list but will take more time.
Dear Fellows,
Pi starts showing older charts data from August 28 onward only. What is happening to the older data. why is Pi not displaying the data from the time i have saved the chart from. i.e I have ICICI bank chart from 1/Jan/2016 and then with the gaps of 3 months each. but Pi cuts over previously saved data. what is the point of saving the chart to disk if earlier data is not concatenated with the new ones.
Thanks
Reagrds
As of now one can open only equity charts for any time period, for futures or options once the contract is expired the same saved chart can’t be opened. We are working on continuous futures charts and once it is implemented it shouldn’t be any problem.
I am referring to equity charts only, as of yet i don`t trade in futures. it is my previously saved equity charts that are not opening the whole scene. i have i5-4690, windows 10 x64 with 24 gb ram. i think that is enough processing power for Pi to utilize.( i.e ) if it checks the system specs before opening the charts.
Thanks
Regards
Equity charts should open, in case not can you write to [email protected] mentioning the same.
Dear Fellows,
1) Converting charts to excel/CSV is a long and tedious process in Pi and there seems no automated feature of converting the stored charts in disk to CSV files. one has to pick every file and then wait for it to get converted and then Pi pops up Excel/default CSV openener application to show the conversion.
2) I see PiChart.ocx and PiChartLib.Dll in Pi Folder. is this the library Pi is using to convert the charts to CSV files if so could a small utility be made that converts the stored charts to CSV files or tell us how are you passing chart files to these libs.
3) The new version of Pi does not open the earlier stored charts. that has made so much of downloaded data useless.
Thanks
Regards
1.If data is more it may take more time but we will look in optimizing it.
2. Your observation on this is not right, we use those for other purpose.
3. As of now only existing contract charts can be opened and not expired contract charts, we are working on continuous future contracts and once it is implemented it will be possible to open any chart saved to disk.
If you are considering optimization. I would like to humbly request you to kindly make a utility in Pi. which does the following. We should be able to open up a Folder location from which we select the saved chart files and those files. Pi should quietly converts into Csv files in a background thread that would be much more convenient. that way Pi wont have to download new data to make the chart current. ( which can be opted for if required ) just convert the already stored data. I don`t think this is a tedious task to implement as Pi is already doing it. It just has to be made more practical and user friendly.
2) i have one more problem. The market view when i open it, every morning i have to adjust few columns. even after selecting the options of saving the workspace and layout before closing. my maket view does not open in a way that i had left before. It does open the same stocks but few columns loose there location and they have to be re-calibrated.
Thanks
Regards
It will be saved the way you have left before logging out if save layout option is selected in view menu, if not you can write to [email protected] to get help on it.
Hi,
I’ve been looking for a Workspace file that has all the Equity stocks for which Zerodha provides margins on MIS, BO and CO orders. I know the limit for a Workspace is 250 stocks in Pi and there are around 300 equities for which margins are provided, but this could be done as 2 Workspaces.
Has someone made such a file? Can you please share it?
You can check the below link and add for one time and save it.
https://zerodha.com/margin-calculator/Equity/
Hi Nithin,
I know my request would sound like a broken record. It would really help if zerodha could add Ichimoku Cloud indicator to Zerodha Pi. It is already present in kite so please add it for pi also.
Zerodha why not start providing Nse Data feeds for amibroker
1: no of scrip your choice
2: per scrip 10rs per month
base on your popularity think good business idea.
Samir, this has to done through an exchange empanelled data vendor.Brokers not allowed to do this.
Isn’t there any help for small retail trader who just follows only 10 shares as for them 13000 per year too much something around 3000 will be fine. Any recommendation of such exchange empanelled data vendor who take care of small retail trader need.
As Nithin’s said, only Exchange empaneled vendors can do it. Here’s the list of authorized vendors: https://www.nseindia.com/content/press/List_data_Vendors.pdf
Can anyone tell why I am only able to see 2.5 months of candle data when I select 60 min or 240 min timeframes and choose 120D candle data? How can I increase the chart history for 60 min and 240 min?
I believe you are checking for future contracts, as futures expire for 3 months one can get the data from only the time it started trading on exchange. Also to mention if one selects 60 days it means it is 60 calendar days and not trading days alone.
Charts data for 2.5 month to make entries in 60 min or 240 minute or Daily is not enough to gauge the trend. Based on 4-6 months chart data, technical analysis on 60 min or 240 min or Daily time frame, price will probably drop quite a few points which will provide traders with bigger profits in Intraday/Swing/Positional. 3 months future expiry is not a reason to provide limited chart data as traders are free to choose to make entries on 60 min or 240 min or Daily time frames based on the trend. Trend must be clear on 60 min, 240 min, daily time frames which is why more chart data is required to gauge the trend.
Yes I understand that it is not in your hands as data is coming directly from the exchange and not from the broker.
I posted this again for a response
a)Is it possible to add ” copy ” ” paste “feature on right click to Pi charts , one can easily copy a rectangle , horizontal line or any drawings without the effort of doing it all over again
Is it possible to introduce this feature sometime in your coming updates
b) when is the new Q coming up , i am eagerly awaiting the flashback feature , are you re introducing flashback?
a. yes on our list
b. new Q will be introduced one tool after the other. Yes, flashback is coming first, hopefully before end of month.
Hi
1) There are still bugs in Pi, your support & resistance levels are still not movable after certain border. If you reached at support 1 or resistance 3, pi will not further move in up/down direction. If i want to place an order below S1 or above by seeing chart, i can not do that, as chart with Support & resistance will not move in up/down direction. Even in this case you will find LTP will not be able display if goes below S1 or R3. I hope it should be like the same as of Kite. Kite is so flexible in chart movement with support & resistance. We expect the same in Pi. Earlier I have raised the same issue with S & R. Still i would say support & resistance levels are not so flexible. This is must feature.
2) If you load historical data for 1 year / 2 years(of 1 day chart), you will not be able to see pivot points. I guess this feature should be there.
I hope zerodha team will take corrective action on these points.
Regards
Vivek
1. Will check on this.
2. Pivot points won’t show up for daily charts on Pi.
Hi Siva,
Have you checked on this? Earlier also i have raised the same thing with support team as well as on same portal, but unfortunately there was no corrective action.
If you want, i can provide you screenshot of issue. Here I can not attach image, plz share your email id so that i can share you evidence.
Regards
Vivek
Hi Nithin,
I guess, you would address issues which mentioned above.
Hi Siva,
Any progress on my points?
Hi Siva/Nithin,
Could you please respond me query.
please help,
just few days back I have installed pi,
1. It is possible to save indicators while saving charts at ”my workspace”? It is tedious to add all indicators every time after loading saved workspace.
2. Nifty and Bank nifty not showing volume in charts and in market watch no bid and ask rate.
1. Open any chart, add indicators, right click and save chart->save as template. Open any other chart after next login, right click and apply template.Also one can set a default template so that if one open any chart it will open with indicators embedded.
2. You might be checking for spot indices as spot won’t be traded no volume, bid and ask rates won’t be showing up, add nifty future or bank nifty future on to market watch to see the same.
Thank you.
You cannot directly trade the nifty and banknifty. You can however trade the nifty future and bank nifty future. If you add the either of them to your market watch, you will be able to see best 5 bids and asks.
Please Develop A mac version
Lots Of mac user waiting 🙂
Sir ji,
my pi is not working .. . . .
every time i login it says restart again
please help
[email protected]
9403592481
7218912750
Can you send an email to [email protected]
1 Hr Interval Charts don’t get updated. For Nifty Spot on 1 hr Interval last candles are for 2-Dec, BankNifty 7-Dec, Nifty Fut 7-Dec. Is this a know issue?
There is no issue as such from our end, it might be system specific and would be appreciated if you can write to [email protected] with screenshots on this.
If I have added RSI to daily chart in Pi and I want to see RSI and intraday prices in data box together, then how do I do that. Similar issue with kite.
Help would be highgly appreciated.
Add RSI and move your cursor on RSI panel, one can view both price and RSI values on databox.
Hi Siva,
Thanks for the reply.
When I am placing cursor on the RSI panel, I can view RSI close and the cursor value where it is placed in the chart.
For instance, if RSI is 45 for 16-Dec-2016, then data box shows 45 and if the cursos is placed above the close near to 47, then data bos shows price on Y as 47.
I am unable to see the intraday price data anywhere as can be seen in other websites or trading softwares (trade tiger or tradingview for instance). Also, I am unable to see intraday price and RSI together in Kite.
Hi Team,
Could I have someone to solve my concern please???
does zerodha Pi offer VPS service?.
No
Is it possible to use personal EA compatible with MT4 platform to run in zerodha Pi platform?..
not currently.
thanks
Plz enable the feature to open multiple marketwatch/ workspace in different tabs at present we have to create a new market watch and then load the workspace or we have to simply load the workspace over the default marketwatch which is very annoying if we need multiple workspace. Yes it is true that we can save layout before existing pi so that it will load with multiple workspace but it will create network usage problem ( not responding) to load multiple workspace at the very beginning during logging in.
Point is noted.
Any plans for mac or linuc version of Pi ?
Ask tradelab to build it using Electron.
No plans as of now.
Plz do make PI for linux and mac because we cant even run it in linux using WINE or any other emulator
sorry forgot to add one more request for PI
can we have a color edit feature on the right hand side price panel. the current is black / white . As we keep adding horizontal lines & markings it adds to the clutter and at times becomes difficult to differentiate. If there is an option provided to change the color one could identify the current price among the clutter. just a suggestion
Instead one can also change color of drawings and horizontal lines.
yes siva ji one can change horizontal lines color but most preffered color on a white background is blue and black , hence the thought , its just a feedback since nt7 has that option .
The ”Pi to Excel” link is great. Can we expect an ”Excel to Pi” link, where in Pi can place/ modify orders based on an excel worksheet automatically, somewhat similar to Kite API?
On our list.
It would be also nice to have a ”link to excel” feature for ”order book” for automatically updating the same.
sir
can we have relative strength scanner like in TRADE TIGER IN PI it scans strength of sectors and stocks compare it with nifty it very usefull in scanning FOR TOP DOWN approach
Will check on this possibility.
i have a feedback
In Pi the headers of the chart are taking up too much space and it becomes difficult to adjust charts ,
a)can you add something like in microsoft excel whereby the headers can be moved / slided left right to accommodate more charts in a resized window
b) or reduce the font size of the chart header
c) plz plz see if u can detach the order buy sell window from the main like in edelweiss , sometime in your coming main updates.
Points noted.
Please try to provide following features in chart to make Pi a complete charting software :—-
1. Add 180 min, weekly , monthly, quarterly ,yearly , half yearly chart option. time frame change
2. Provide RSI WITH ITS AVERAGE ie 14/9.
3. MACD AVERAGE VALUE SAME WITH SORT MOVING AVERAGE
4. Provide chart linking facility of scrips in chart, so that when we click a scrip in marketwatch then automatically same scrip is opened in all the opened charts of different time frames.
5. provide refresh option in chart.
6. provide shortcuts for chart time frame and chart type.
7. time frame change option in left hand like t/t
1. Weekly and monthly will be available soon.
2,3 Will provide in next release.
4. Is in our list of things but will take some time.
5. Changing time frame can be as good as refreshing chart and can be used for time being.
6. Not possible as many time frames are involved.
7. Will check on this possibility.
Hi ,
Just had a few requirements , don’t know if u plan to implement them
1) I think pi deserves Fibonacci extensions
2) important half way levels in rsi and Macd move or disappear when the charts are zoomed or indicator size reduced , scaling should be around the 0,50 levels
3.) if I have overlayed averages on a stock it should be carried forward to every time frame , preferably also to every stock of mine instead of having to apply template.
4)MACD HISTOGRAM needs to be on the macd and not a separate indicator as implemented on other charting software.
5) Once I choose a colour for the main line of an indicator or average my colour choice should be default and not the orange which I may need to change since all moving averages will have the same colour.
That’s all I could think of for now
Cheers !
Abhinandan
1. In our list of things to provide.
2. Will check on this.
3. One can create a template and set it as default template so that while opening any chart it will open along with those added indicators.
4. Few want them separately, but one can add it on chart, select and drag on to each other and save as template, if one applied the template both will come as one.
5. Will give option to change color in coming releases.
Even after 3 months since opening account with Zerodha, your entire team is unable to make Pi work for me.
There is so many excuses made but without resolution. I have to buy additional charting software for my needs. Can somebody look into it?
Will get someone to call you and help you with this.
Hi, I m totally new to Zerodha, also very much new to Stock trading.
Hence I m little confused. However i recently opened my Demat & Trading a/c with Zerodha.
After reading all this blogs & post, I saw most of the examples given here in Z-connect are based on PI diagram.
So I have few questions:
1. Is Pi better than Kite in any means for trading purpose?
2. Do we have an alternate of Pi, in case Pi is not working?
3. How good is to trade through Kite?
4. Can i get the full trading option in terms of intraday option & so on.
What is the issue actually is, Pi is not working in my laptop,every time I login it goes on no responding mode.
I even mailed to support@zerodha, and after sharing my laptop online, they told me that my c:/ drive is block. Yes c:/ is bit-locked as I m using my office laptop.
However I m using this laptop for installation of even big -pst/vst softwares like abletone and other music & video editing software, and they are working fine. I have never face any such issue before, I m using N no of application in this laptop, it has never blocked me or has never stopped any other application which I use for my personal use.
This is first time I’m facing such issue. How soon can I expect to get a resolution.
As I m new to this field, so m very keen to gain knowledge and very excited to pi work, as all the example give here are with pi, so its tough to understand few points.
Please help
Thank you
1. You could use either Kite/Pi. Both serve different purposes, if you’re a full time trader and are looking at features like backtesting, stock scanner, extensive use of charts you would use Pi. Kite, on the other hand gives you a minimalistic, clutter free experience. It’s upto you on what you want to use. The login id’s and passwords will remain same for accessing both Pi & Kite.
2. You can use Kite.
3. We’ll let you decide how good it is 🙂 Do give us your feedback
4. Suggest you speak to your Sales manager who will give you a demo on how to use the application. You may direct all your questions to him.
Pi being an exe, requires you to have admin privileges on your system. We suggest you install and use it on a personal machine on a private network.
Hi,
Where can I get licence key for pie software for activation? I tried to get beta access in Q but it failed and showed error message that ” Error while adding access. Please contact support”
Can you check now.
https://q.zerodha.com/pi/ You’ll get the license here.
Login using the passwords you would use for Q.
please,may i get ichimoku cloud on pi ? Thanks
It is in our list of things to do but will take some time, for time being one can check it on Kite.
I was able to create a market watch, but once I close it, then I do not see any option to open that closed market watch. Could you let me know how I can open the closed market watch if that functionality exists? else, you might want to consider providing the functionality to open closed market watch in future releases. Thanks.
Regards,
Atheeq
One can create 5 different market watches and can open the same for next login by going to
view->user setting->market watch->select layout on exit-> apply->ok.
If one is adding different scrips on default market watch and want to save different default market watches then one has to save it as workspace. Create default market watch and goto->file-> save as workspace and save it. Now one can delete scrips on it and add other scrips and can again save as different workspace. Later one can goto file menu and load the required workspace. Only default market watches are saved in workspaces and not created ones as of now.
Siva. I understand Pi supports utpo 5 market watch. But my question if you have closed the market watch ”X” by clicking ”close” icon, then how you can open that ”X” market watch?
As of now it can’t be reopened again.
Any plans to provide that in future?
Please add one column for %profit/loss and individual scrip buy value in the stock holding section.
Thank you
Sir,
PI getting not responding frequently after interim update pls help.
Thank You
Nitin Ji ,
After this issue somebody called me from 080 4040 2020 asking for userid, pin and password to solve this issue I just ignored him and haven’t give him the details plz confirm me is it legal to ask all these details from client by a customer care employee or technician or whatever he is.
You can give your system on remote to him. PIN won’t be required, password to check if it is working at our end and not system specific issue. You can change the password immediately.
I want to get Weekly Moving Average in Daily and Intraday chart. Just saw that in Angel Broking Software, It Helps to get Information Of Larger TimeFrame in Small Time Frame.
Please try to provide following features in chart to make Pi a complete charting software :—-
1. Add weekly , monthly, quarterly chart option.
2. Provide increase or decrease of thickness of different study in chart.
3. Provide dragging facility of different study in chart . So that we can do up and down, also on price line.
4. provide Line chart type option in chart.
5. Provide chart linking facility of scrips in chart, so that when we click a scrip in marketwatch then automatically same scrip is opened in all the opened charts of different time frames.
6. provide refresh option in chart.
7. provide shortcuts for chart time frame and chart type.
1. Working on this.
2. As of now only possible for drawings.
3. One can drag only if it is added on to chart.
4.Will be available for next release.
5. Point is noted.
6. One can change timeframe to get chart refreshed for time being.
7. As many timeframes are there it is not possible to give shortcut to change timeframe. Also check all shortcuts available on pi by visiting pi shortcuts under help menu.
Hi,
Please let me know why volume on nifty is not visible? Indicator like Market profile or Volume profile is not working due to that. For analysis of instrument volume plays imp role. Please look in to it ASAP.
Regards,
Dhananjay
I believe you are checking for Nifty spot, to mention Nifty spot is just an index and is not traded hence no volume is displayed. One can open nifty future chart and volume will be displayed.
hi Nithin,
isnt it really basic to have an optional very thin horizontal line on the last tick spanning the entire price chart ,y isnt it yet there.U know how useful it is for supports/resistances.
Thanks and take care.
You mean one horizontal line for LTP across chart, if not can you please explain a little bit more.
sure siva,pls check out this link below,then take the 1min chart and look at the ltp,u will see wht i mean.thanks.
let me know if the link is not working.
https://dwq4do82y8xi7.cloudfront.net/dailyfx/widgetembed/?symbol=TVC%3AUSOIL&interval=D&hidesidetoolbar=0&symboledit=1&saveimage=1&toolbarbg=f4f7f9&studies=&hideideas=1&theme=White&timezone=exchange&studies_overrides=%7B%7D&overrides=%7B%7D&enabled_features=%5B%5D&disabled_features=%5B%5D&locale=en&utmsource=www.dailyfx.com&utmmedium=www.dailyfx.com/crude-oil
Sir, I just wanted to know if the following will be included in the next final release :
1. Net change column with color indicator like orange(down) and green(up)
2. Ichimoku in charts not expert advisor
3. Blank space in market watch getting saved for next use ( at present we have to give space each time we login)
Plz Reply
Thank You
1. Will check on this.
2. This will take more time.
3. It will be implemented.
Pi Latest update is not available for download from q. It is showing file is removed
Can you please check now.
Dear sir,
pls note after so many follow up also i am unable to do trade …as reset of password every time i login..and for whatever password sent to my email is not accept by system in q.zerodha. pls advice
Can you try logging in to kite.zerodha.com as q.zerodha.com is back office and also can you write to [email protected] on this.
in your latest update released around 20-11-16 there is a problem with trend lines. When a trend line is drawn for a period of six months and the data with the same trend line is viewed for 1 month the trend line vanishes This problem was there earlier also but it was taken care in your last release before 20-11-16 release could you please take care of the problem
Nothing was changed from our end and it is the same from start.
hi
what is the new update on PI about ?
It is mostly an interim release to upgrade the performance and couple of features added.
sir
is it possible to provide delta and implied volitility for options as a column in market watch on real time basis,
On our list of things to do.
thanks sir
eagerly waiting for this.
saw a message for quant feedback .. where do we provide our feedback ?
You can fill in this form or write to [email protected].
Click here.
sir, is any charge of pi or it is free of cost.
It’s free of cost.
It is free
when will be the next update of pi with additional features
Dear Nithin Sir,
Couple of days back I have posted a feedback over here regarding the issue with PI and Kite Web not functional during the present scenario wherein market was very volatile.
However now the entire thread is deleted or hidden in the system. This means that you do not want the threads which throws the real scenario of technology and connectivity with Zerodha. Going to close all the three accounts of my family with your firm in the very near future.
Bhushan,
This is not the right forum. The idea behind Zconnect is for us to share knowledge about our products. If I start answering client/account specific customer queries, I won’t have anytime to do anything else. I also don’t want other people to look at me answering account specific queries and expect me to answer theirs as well. Hence hide them. Every business has its problems, I know ours, and am working towards fixing them. There are many negative comments you will find if you look around. Best.
Nitinji / Siva , Plz introduce world indices in pi
In our list of things to do.
Hi, Is Haikin ashi Smoothed Chat available in Pi, if yes how to access if no can u please include feature.
Heiken ashi is available based on OHLC now in pi. Smoothed heiken ashi not available. You can apply moving average on heiken ashi but it will be with OHLC
Nitin ji / Siva Ji ,
Is it possible to detach the ” ORDER WIndow ” from the main Pi window ie buy sell pop up window from the main window. This features is in Edelweiss . The reason being when you want to place an order the entire screen space blocks the view of other vendor charting software . If the pop up order window is detachhed one can view other external vendor charts and also keep the ” order window ready ” .
I sense you may say that the main window can be minimised but.. that too is a not a solution for other reasons.
Its a feedback and i hope you may consider this in future.
b) Also is it possible to increase the ” snap quote ” from 5 sellers to >10 nos so that one can see the market depth better .
This is on our list of things to do. About market depth> 10, this is possible only if we have tick by tick data feed. Not possible through the data feed that exchange gives for trading terminals.
Hello Nitin/Shiva
I like to draw attention on a problem, when i enable crosshair in pi ,horizontal line,vertical line ,trendline edit options not working,even it can not be moved,as soon as i uncheck crosshair option from chart settings,its start working, ..big big bug….i always use crosshair
Please solve this problem
this time the pi update is so worst chart hanging problem,bracket order don’t come quickly after pressing shift+f3/f4 ,disconnection so much,……frustedddddd.
Hi Aashish,
We’ve emailed you the resolution to the issue you’ve raised.
Nitinji / Siva , Plz introduce world indices in pi.
Hi,
in kite, could you please enable stochastic ”weighed” type? Pi is actually useless for trading. its good for back testing only. Appreciate if you can load indicators with all features available in professional trading platform.
Sir , I mailed the documents to your team few weeks from now , tracking id : ER214511296IN via speed post . Your team collected the same , but despite of calling again and again I didnt receive a proper feedback from u guys. Zerodha was a well known brokerage company delivered me a pathetic service .
wanted to draw the attention .
Please try resolving it asap .
Mob No. : 9549980990
Having this checked Gaurav.
I am unable to save workspace from file-> save workspace (Nothing happens)
even after doing view-> user setting->save on exit
i do not see layout being saved in workspace.
Need Pi for Mac OS. It is very surprise to see that you don’t have support for macOS
Pi is built on microsoft dotnet, won’t work with MAC. You can use kite.zerodha.com
Unable to download pi. Says download link ” 502 BAD GATEWAY ”
you can directly download the latest version of pi from the below given link
https://www.dropbox.com/s/xnqvlnpcppb7t06/pi.zip?raw=1
Today due to volatility many clients were not able to login to Kite web and mobile. In times such is the case kindly send a SMS. the message was sent around 10 am. by this time whatever low was made, people who wanted to close their trades were not able and PI was hanging very much. Also the call facility was late to respond. Please attend to the technical issues.
This type of issues have already been with Zerodha on many occasions. Please ensure that connectivity, Kite and all platforms are OK on all trading days.
Plz note, the download link for Pi is not working. Plz rectify the same ASAP.
It’s working fine from our end, anyhow will reach you on this.
Hi,
I am an Options Enthusiast, I like the they way we can create strategies in Options and leverage our knowledge to build a safe bed for our hard earned money. I request you folks to add Options Strategy into Pi/Kite soon so that We can get on it to and explore the world of possibilities.
Looking forward to consider my request in the next release.
Waht dies this error mean
INstall SQL server , primary binaries
Not able to open chart on PI software..getting the above error
For the above error follow the below given steps
1. download the microsoft fix from below link
https://download.microsoft.com/download/E/C/1/EC1B2340-67A0-4B87-85F0-74D987A27160/SSCERuntime-ENU.exe
2. extract the files on desktop and install both extracted software’s (32 & 64 bit)
also check the date & time with regional settings for that,
Go to Control Panel -> Change date, time Number Formats (under Clock, Language, and Region) and click on Additional Settings and reset numbers , time and Date Tabs
re-login to pi and check.
If you are facing any difficulty / Issues, you can drop email to [email protected]
Can you please add Horizontal/Vertical lines to tool box?
Will do if possible.
dear nitin
can you explain to me what do gaps between two candlesticks mean , for example i shorted a scrip today and had kept a order @ a particular price. unfortunately i noticed that the price at which i had placed an order was between the gap of two candlesticks . Does that mean that my order would have been skipped as the price went down too fast ?and the order did not execute .
can such a thing happen ? ( i use nt7 hence i noticed the gap )
Hmm.. not getting your query. Can you post this on tradingqna with an image.
posted with image on trading qna and on email
thanks
Login ID : AUODDP/DD0314
Dear Zerodha,
After some discussion on trading softwares with my referrals/traders/friends
who are using Zerodha…We came across few points,
I am Writing on behalf of them and request Zerodha to make following
changes/updates.
1) Pl. add 2 mins timeframe in Kite (In Pi, It’s Available)
2) Pl. enable Cover Order Limit Price Option in Kite (In Pi, It’s Available)
3) Pl. add Refresh Button for Chart in Pi (In Kite, It’s Available)
4) Pl. add Candle Countdown Timer, so a Trader will come to know when
Current/Live Candle is about to Close.
Some features are in kite but not in Pi and vice versa…
i.e. Scanner is in Pi but not in kite
It will be great if both kite and Pi offers exactly same tools/features
because one can’t use both pi and kite at the same time.
can you remove unnecessary options in Bracket order (in Pi) such as ATP/LTP & Tick/Absolute
It’s easy in kite to place BO.
Hoping The Best from Zerodha,
Thanks
Devendra Pitale
Is there any chance of flashback in quant coming back?
We are working on an all new reporting tool, yes flashback will come back. The last one had become quite buggy.
Hi Nithin,
I had requested frequently through this blog for an easy order placement and modification tool like DOM trader or Chart trader in pi. I am looking for a quick in,modify and out tool for a trade through chart or DOM. Each time either my post is got avoided or got a vague replay like ’It will take time or It is in our todo list of things’. Could you please put your list of todo features in the site with its status(Started,Not started) and expected ETA. So that we can avoid the unrealistic expectation that our favorite feature will be there in the coming release.
Major problem with zerodha pi and kite , can’t see expiry in kite of mcx scrips , all scrips show expiry of 16novfut and in zerodha pi after adding mcx scrips it does not show expiry next to scrip it shows like ex- lead16novfut or zinc16novfut , please solve this as soon as possible it is very confusing to trade and select
Hariom, the contract description won’t have expiry date. Click on the market depth on kite, you will see the expiry date. On Pi, on the marketwatch, you need to add a custom column called expiry date.
thank you for adding vwap in kite . I hope you implement the following in your coming updates for KITE.
a) BUY SELL Order similar to PI so that orders can be placed quickly in Kite
b) Buy sell order in KITE Popout window
c) Have you removed ” Q Flashback ” ?
d) For PI see if you can have a right click ”lock ” for Horizontal lines so that they dont jump up down .
thanks
Will share these with development team, yes Quant flashback is taken out.
Nitin Ji
My chart is not moving its static for very highly moving stock also like icici bank hind zinc etc windows 10 pro 64 bit
Can you please write to [email protected] or call 080-40402020 on this.
Siva Ji / Nitin Ji
Please reduce the column size in PI like
1. Volume Traded Today – Volume
2. Total Buy Quantity – TBQ
3. Total Sell Quantity – TSQ
4. Lower Circuit price – LCP
5. Upper Circuit Price – UPC
As they take a lot of space and dragging the column is also not meaningful in case of 2 and 3 because only ” Total” will be visible.
Thank You
Sure, will implement this.
Siva Ji / Nitin Ji
Is there any problem in the charts today ? they were not responding in both PI and Kite
Plz Help
everything working fine.
Nitin Ji / Siva Ji
could you add MACD & RSI as a single indicator ? It would save us a lot of space for placing other indicators.
Thank You
Not possible as few others might want it separately.
I am not asking to replace them with new one but to create a new MACDRSI indicator keeping the old ones intact.
Not sure, but will check on this possibility with our development team.
Dear Nithin,
This is regarding some additions to PI software.
Three things wud be really nice and make it really great to trade with PI.
1. Footprint charts.
2. Multiple custom range volume profiles with Value Area details.
3. Some suggestions on bracket order placement, but it wud be nice if I can write a detailed email for this third pt.
Plz guide which email id to write on.
Thanks
Aniruddha
Points noted, you can write to [email protected], the concerned team will receive it.
Hi Nithin
Latest update 20th Sep 2016 ,point no 5, how to do that…when i called technical support they said i can not be done…
You have to double click on the horizontal line to change value.
yes venu finally solve it but not fully, but customer support executive directly said to me it is not possible,then i have to send them email with proof screenshot……what are they doing there???
I like to draw attention on a problem, when i enable crosshair in pi ,horizontal line,vertical line ,trendline edit options not working,even it can not be moved,as soon as i uncheck crosshair option from chart settings,its start working, ..big big bug….i always use crosshair
Please solve this problem
Sorry for the inconvenience. We believe our agent has sent you an email and helped you resolve the query you’ve raised.
Siva Ji / Nitin Ji Plz Plz Plz add ichimoku cloud in charts i am not talking about expert advisor as i have already seen u added it in zerodha kite so whats the problem in adding it in PI. Plz sir do it ASAP.
Also i wanted to know if i can run pi and kite at the same time with same user id or not ?
Thank You
In our list of things to provide. At a time it is not possible to login to both Pi and kite with same user id.
Pi and Kite can’t be used same time. Ichimoku will come soon.
Can Pi be installed on Mac OS
Not possible, only on windows os.
Nitin ji / Siva
Just a suggestion ,
Do you think its a good idea if you hold a interaction meet in Mumbai , Delhi with your Zerodha clients . That way we can have a face to face meet and knowledge can be exchanged.
The pivot lines in chart option is not getting saved plz do something on this once i save them it vanishes from the chart on the next login
Because Pivot lines will be changing on daily basis.
There should be an option to show last 30 days pivot lines on chart.
For beginners and professionals
To learn from Pivot line trading then it will be good for study and learn from past data and pivot lines.
It shouldn’t be just daily basis.
Hope you understand.
To open 10 chart at a time on single click.
Not possible as of now.
Dear Nitin & Siva
I noticed a particular event in the charts today and i thought i wud share this feedback with you.
a) During Trading 1.35 pm SBIN futures in PI the candle touched 264.90 in 1 min , the same candle in my tick by tick data for NT7 /truedata chart touched 265.22 .
b)Post trading in the evening when i opened the charts KIte showed 265.03 and PI also displayed the same price of 265.03.
A trader who is dependant on intraday trading would have his calculations go wrong if he is solely dependant on Pi . Is there a solution to this issue ? Are you not convinced that tick by tick data for 5 /10 is better in intraday scalping
I was reading a post where someone mentioned that SL orders were placed and it got executed but they never saw it on the screen , and another one mentioned that after market hours the charts look different .
Yes the charts do look different after market hours and the basic 1 min data is a limitation . I can email you the screenshots if required.
I have explained it in detail here.
yes i had read that before thats and am aware of that ,
but my focus was on the debate as to whether 5-10 min tick data is better than NEST thomson reuters data , My internet provider is the same , my pc is the same but the difference is between two softwares ,NEST PI vs NT7 data . I believe that 5-10 min tick data is more smoother and accurate . I hope sometime in the future you may consider providing us this option
Chandru, the data quality you get from data vendors will always be better than what you get through brokers. Way exchange gives data to us and vendors is different. Hence data vendors have to be those crazy fees to the exchanges for the data.
NFO and BFO segment not showing in market watch
I am guessing you haven’t enabled F&O segment with us. Can you send an email to [email protected] with your client ID.
Hi Nithin Sir,
Today got one notification with screenshot in FB that you have added a widget in Kite Web…but some points are required.
First of all a very nice initiative that gives 1 M and 1 YR return…but few modifications requested.
1. Chart has no X and Y axis. pls add.
2. Widget not available for MW but only available for Holdings. pls add to MW scripts also.
3. Please ensure that data given is correct since data error is coming in Kite web when the market opens for previous close price.
please check the possibility and update before the market opens for trading on Monday.
1. The idea was to give uncluttered quick view.
2. It shows on marketwatch also, currently not for BSE scrips, will be fixed by monday.
3. Data is correct, it is from Thomson Reuters, probably the most genuine data out there.
Sir,
1. unless we get to know the corresponding values of X and y picture does not make sense.
2. I have checked for today, but the same is not showing. Will send you the screenshot on your email Id. Here unable to post.
3. Sir, data sometimes is not correct. particularly for previous day close price in FNO stocks. this matter is already informed to your team. In this case I have already talked with Jawaad also…He told that they are analysing the issue and will revert back on the day hey get the solution. the matter is very deep concern. since many times the login shows that the script has moved by a huge gap. but seldom is the case. on majority of occasions i have marked the email to you also. but till date no response.. 🙁
1. hmmm..the idea is to give a rough idea and not really exact prices. There is the normal chart for that.
2. will wait.
3. I am guessing you are talking about illiquid BSE scrips, we are looking for a fix for that.
3. It is about NSE FNO scripts. more than 10 times i have sent email to support. but every time the reply is we have given the matter to our technical team and they will revert back.
i have not chacked for BSE scripts illiquid bcoz i dont trade in that.please check for NSEFO scripts
@Bhushan, There is no issues with data but when one open market depth of any scrip before opening of market and kept it open during opening of market then close won’t be update on that particular market depth. To avoid this, it is advised not to kept open any market depth during the opening time of market. Also one can logout and login back to see regular data if this happens.
@ Siva Sir – If you don’t want to accept the fact then please say no we wont change. Unless this is an issue I hope your team won’t have spent so many tiring moments to reply me every time I have emailed about this to your support section.
Whether you have to change or not is the matter of choice with Zerodha and no user can force you to do modifications. In such case you can just say its Ok with our system. But would suggest please have a word with the developer in your team working on this issue, I hope would give a technical outlook.
Regards,
Bhushan
Please tell me how to see Support and Resistance lines in pi and when I click Day Separator nothing happens
Open any minute or hourly chart, right click and select required pivot points.
Dear Siva
a) I had sometime back mentioned that when i use PI through one data network and switch to another data network midway PI does not accept orders . You had mentioned that this issue will be handled in future, I hope you have this aspect on your mind.
b) is the compare feature in Kite live during market hours for example sbi compared with nifty . I was observing that there was no live update but update on refresh ?
a. I believe it is solved.
b. Currently yes.
dear siva sir
i am sending you a video file in which you can diagnose the problem , the main problem is this – when Pi is running in the mid way if data is disconnected or when we switch over to another data network, the Pi is reconnected –it is ok , quotes are refreshing , but this is not the problem the problem arises when we try to put order or want to open chart after reconnecting, Pi get hanged — YES PI GET HANGED , then we have to close Pi and relogin ,
please solve this problem .
thanks
vinesh kumar
Sure, will check on this.
Sir,
Please add at least a EOD scanner for scanning watch list with different strategies and a event tracker for tracking events such, previous day high and low breaking–etc in real time with Pi.
Will take more time for this.
Please Fix the indices bar to some place or atleast enable fixed option like you have done in chart bar and also remove always on top behaviour because its annoying when we open browser or something else and indices bar lays on top of it. I also know that we can minimise pi but still to fix that at a particular position will be great.
Point noted.
when will be the next release of pi
In couple of days will give out one update to increase efficiency as changes involved are from back-end but for added features on front end will take 3 to 4 weeks more.
Love Zerodha kite but the quotes don’t update as fast as pi. Other than that all the features are great. However, it would be great if you could implement a search bar similar to the one in kite in zerodha pi.
You can use find symbol option (ctrl+f) on Pi to search.
pi stops responding if the internet is gets disconnected and again reconnect.
please add a feature to open multiple charts by holding ctrl key so that we can open 10 to 15 charts simultaneously .
Pi automatically reconnects once internet is back, if you are having issue with this you can write to [email protected]. Even if one opens many charts at a time, symbol and timeframe need to be changed again.
Sir,
In regard to my query dt 16th Oct you asked to write to support@zerodha regarding saving of horizontal lines along MACD histogram. I got the reply as follows:
Thank you for writing to Zerodha
As per the above query horizontal and vertical lines will not be saved on the ”save chart to disk”
Do get in touch with us if you have any further questions or concerns call our support team 080-40402020.
Please guide me
Can you kindly share the ticket number.
Is there anyway in pi , I can put order through script. for example. buy NIFTY16OCTFUT==8600 qty 750.
Can you explain in detail on this?
I was going through Compare on Kite , When you place a equity + bank nifty the price of the equity does not show up on the right side of the panel . Is it possible to display the price on the panel of the equity atleast ,the reason being it helps in planning trends and risk rewards in price.
I hope you place VWAP in Pi / Kite in your future updates.
VWAP in in our list of things to do.
It is very annoying to put premium price, spot rate, and int. rate in OPTIONS CALCULATOR………… Why can’t it be like nest trader wherein it automatically calculates volatility and greeks with a click? Please work on it for the next Pi update and would also like to see options chain next time. #ilovezerodha
Will check on this possibility.
either update pi with cross hair with time and price OR update pi with day separate line with current day.when we see the chart of 60 days its very difficult to judge todays ending candel.by updating any of the upper option will help a lot……
Point noted.
Sir,
In the latest version of PI you say that Saving charts to disk or templates saves horizontal/vertical lines as well. But when I draw a horizontal line along zero of MACD and MACD histogram and save to templates , it does not show on the zero line when I again open the charts . It shows somewhere around 7 points etc. Please guide me how to save it
Horizontal lines will be saved if they are saved as template. For MACD there will be default zero horizontal line so no need to add one, even in case it is added it is getting saved. If facing any issue on this you can write to [email protected].
can you send PI download link or how to download
SIr please login to Q and then download PI…it will give you authentication key also….
Shojan, just check this: http://zerodha.com/z-connect/category/tradezerodha/pi-tradezerodha
Could you please share latest link
Hi sir ,
can anybody from your end please revert to ticket number 692881. raised at 9:21 am on 14.10.16.
Since this is the tenth time I have reported to your support and to siva sir and even to mr. jawaad khan who is looking after kite web…but no reply to my earlier ticket also….my ticker is open since a few weeks…., but still every day the story is back to square one….and a very vague reply ….please relogin….else working fine at our end…..else this time………pls clear your cache….these are basic tricks and we all try this first hand…so what would you reply at this time …..eagerly awaiting.
Sir,
The net change coloumn becomes zero after market hours instead of showing the net changes which becomes very uncomfortable for users watching their scrip position after the day plz do something and also provide color indicator for net change coloumn like orange for down and green for up in the next release
Thank You
Will check on this possibility.
Hi Nitin i am not able to keep scrips in alphabetical order, in my pi market watch.,
Just click on the Scrip name header bar, the scrips will get sorted alphabetically.
alerts generated by EA are deleted if PI is closed or system restarts for some reason.
Please make a provision to bring the alerts back.
It won’t show up on front end once the session is logged out.If one want to see previous records can go through the following path C:ZerodhaPiPiBridge.log file.
Please try adding Ichimoku indicator in Pi platform .
You need to fix a problem too . Everytime I try using screener in Pi , Pi stops responding .
try it fixing asap .
We’ll try and add Ichimoku in the next release.
About the issue, you’ve highlighted, best to call the support team to 080-40402020 and speak to one of our support agents who will help you out.
Sir,
Blank space in the market watch by pressing SPACEBAR is not getting saved when re logging in
Go to file->save workspace and after next login goto file and load the saved workspace.
Sir I am doing that but the problem is the workspace is not loading maintaining the gaps which I saved earlier
Will get it fixed in next release.
Sir pls add Gann HiLo indicator in KITE . Its a very powerful trend indicator. Presently its in Sharekhan Trade tiger
Will forward the same to our development team and based on possibility will be added.
Hello,
New update release has broken many functionalities under back testing,
1 – Chart opened with result of back testing do not represent any Date or time for each candle, it become difficult to co-relate.
2 – I can see Alert for buy or sell under testing result pane but no alerts on chart.
3 – Options for Buy, Sell with Limit / market order on chart is not working as earlier, please see if it could be marked & configured as alert, but option to execute should be pop up only on last minute if price reach to marked levels.
4 – Scanner do not have option to select a Day candle to test using script, it only have hourly and min options.
1. Once you move your cursor on that particular bar the values are visible on databox.
2. It is same as before.
3. No changes have done to trading from charts, and it will not come as alert. For more about this you can write to [email protected].
4. In near future scanner will not have daily candles but will check on this possibility.
I use Norton Internet Security. Whenever I try to open Zerodha.com/Z-Connect/ page I get the Web Attack notification on my Laptop.
Details view:-
IPS Alert Name:- Web Attack: Malicious Redirection 8
Risk:- High
Attacker URL:- zerodha.com/Z-Connect/
Details about Malicious Redirection 8 (copy from http://www.symantec.com site)
Severity: High
This attack could pose a serious security threat. You should take immediate action to stop any damage or prevent further damage from happening.
Description
This signature detects attempts to download exploits from RIG toolkit that may compromise a computer through various vendor vulnerabilities.
Additional Information
Malicious toolkits contain various exploits bundled into a single package. Victims on visiting the malicious server hosting exploit toolkit are attacked with several different exploits exploiting different vulnerabilities one by one. Exploits may include MDAC, PDF, and HCP etc.
This is happening for last 1 month. I want to know the reason behind this. Is Zerodha doing this on purpose or they are unaware of this.
Nithin Sir,
in zerodha kite i can click on holdings and get latest price ,live p&l of my portfolio but when i use pi i have to click on refresh button to get my latest price and live p&l of my holdings . why pi dont have that feature .thanks
Yes, as of now one has to click on get holdings to get latest updated values, but will try to make it auto update in coming releases.
Hi Nithin Sir,
Live date and time update in Kite Web is missing since a long time…any time frame can you commit when this will be updated on Kite Web.
This is very simple thing and should not take much time.
Regards
Bhushan
We are already working on this, soon it will be out.
Have passed on your feedback to the Kite team.
I would request you to add ’good till date order” and bracket orders in after market order.
Thanks
In our list of things to do.
Sir,
Thanks for the reply
Sir,
Showing of Avg price, LTP etc while placing cursor on the chart will not be of much use. Just by looking at the chart we should able to gauge immediately the various prices on the charts like Average Price, Previous close price, and Open price .This could be done as a horizontal line with different colors. Because this would definitely help while trading swing. Please do it and confirm.
Point is noted, will take some time.
1) If possible do facilitate with the option to change price while placing an order on the chart.
2) SL-M buy/sell option in BO without SL-M facility it’s completely useless.
We are working on BO.
Sir,
Please add in PI following modifications.
1. In Stock holding the system should show the AVG BUY PRICE, LTP , Profit / Loss one the basis of CMP. at present the system only shows CMP and profit / loss. but it should also show BUY PRICE.
2. While charting the system should pick up the script in charts from holdings / position and should show the Profit / loss against such script in the top portion.
1. It also shows it.
2. Will check on this possibility.
hellow sir,
pi not running in window 10. please help me.
Please send an email to [email protected] and someone from the support staff will help you out.
Please provide Corporate Action Adjustments on price charts in Pi. It is really essential tool for investors!
From 2014 all the corporate adjustments are done, if we miss anything can you please mail it to [email protected].
Thank You ! 🙂
sir please add Fibonacci extension ratio in the graph tools its not there , we are able to predict price target in wave theory
In our list of things to do.
Nitin ji
Please develop Kite quickly if there are limitations in Pi . My fav is Pi but the speed at which development & updation progress is going on is very frustuating . I use NT7 and i see Kite more closer to that than Pi . Pi is your premium software and its been 18 months without much big changes. So please develop Kite with better features for us to make the switch.
a) Kite needs Buy sell in Popout charts becouz the size of the charts are bigger.
b) Pl add PI type buy sell box in Kite if possible , that would be easier to switch before placing an order
c) drawing lines should be as easy as in NT7 and also dragging them around which is not as smooth in Kite and worse in Pi. There is no lock in for Lines.
d) You may agree that in some respect even Investar is better than Pi .
Will consider your suggestions.
Anonto even I am waiting for the same
”Please enable SL and SL-M buy/sell order in BO..
It will be beneficial to intraday trader who want to buy above or sell below ….”
We are working on this.
Real time Option Greeks must be there to benefit option trader….
For now one can use option calculator(ctrl+o) on Pi to calculate greeks but will check on the possibility of providing as separate columns.
Siva Sir. but at present we have to manual feed the present data. Kindly make it that the system picks up the values automatically.
VTC Order is not in Zerodha for which we have to put fresh order every day for selling delivery stocks…
Will take more time.
Please enable SL and SL-M buy/sell order in BO..
It will be beneficial to intraday trader who want to buy above or sell below ….
Thanks…
In our list of priority things to do.
hi there, pls pls pls… add fib extension and fib retracment 78.6 and 88.6 level….
1) how many times to say that your data box doesnt show the price beyond the candles and if i am not wrong trading is predicting the future and not chasing present movement.
2)up and down arrow only zoom in and zoom out the chart and if the price is at the top to the chart on 60 or 45 days then to draw(cross lines) lines is impossible
3) if the price is beyond the rang which we have ploted in zoomout chart the after zooming in it will not apper this thing it known by child also.i am talking about criss cross lines which we plot on the chart in zoomout chart and then zoom in to see .any way i have struggled for that also and found the solution that if we make the line thick ie.thickness 2 and above then the lines drawn in the zoom out chart remaines as it is after zoom in the chart to any extend.
1. we are working on this.
2. Kindly use page up and page down buttons on keyboard and not up and down arrows.
I have the latest Pi version but still cannot find the Multiple market watch option.
Open file and select create market watch (ctrl+w). If you are not able to see that option then kindly un install this version and install again from Q.
Go to view-> user settings-> market watch->scrip count and change it to 250 from 50 and apply.
Great, Thanx!!
I think there is some problem with the update settings of Pi. I checked for latest updates and it said the version is latest. I also matched the versions.
But i tried reinstalling it and it worked!!!!
what does the new indicator Volume weighted moving average calculate? How to interpret it?
I understand it is different from Vwap as when i tried to apply it, I had to input a period which is not required in Vwap.
Is there any way to calculate Vwap in the current version pi or kite?
3-Day SMA = (C1 + C2 + C3) / 3 where as 3-Day VWMA = (C1*V1 + C2*V2 + C3*V3) / (V1+ V2+ V3). Also VWAP is not yet available on Pi or kite.
some main things if possible add to pi
1) no price and time in cross hair
2) cant drag the chart up and down in pi as possible in kite
3) when we draw lines in zoomed chart of 45-60 days and when we zoom in lines dissapers
4)once the bracket order is placed and executed we cant add trailing stoploss we have to place it while placing order
5)alerts are very complicated to put in pi. I use different software for alert which popup with sound and very simple to place.
1. One can check on data box for values and move data box as required for time being.
2. Try to use page up and page down.
3. Because horizontal line indicates price level and if we zoom in and if that particular price level is not available on y axis then obviously line won’t show up.
4. Not possible for time being.
5. Will work on this.
I agree you worked on the vertical scrolling and i thank you for your efforts. but honestly, am not satisfied with overall quality of scrolling both vertical as well as horizontal. To be clear all the traders want the scrolling as used in Kite! as simple as that.
one more bug i want you to take notice of is,
when we save the template by setting the Grid color, and later when we set that template as the default, the Grids just gets disappear. Grids play important role in everyones trading so please add this bug in your top priority list.
i hope you will solve these issues as early as possible.
Plz help me out of this Nitin sir or anyone else attaching link with netframework error and marketwatch glitch
netframework error- https://s16.postimg.org/r3uz6o9xx/Netframework_error.png
market watch glitch- https://s13.postimg.org/prg1ck0tz/Pi_market_watch_error.png
the bottom 2 market watchlist is not showing full list though they have enough space just watch the scroll bar extreme right hand side and also a line which is reducing the space of two watchlists
1.go to start -> run -> %localappdata% and go to pi folder and delete user file and relogin to pi. If still the issue persists then write to [email protected].
2. go to view->user settings->market watch-> scrip count and change it to 250 from 50.
Sir, Please reply if you can do the following:
i) net change coloumn of market watch with color indicator like if net change is negative it will be red and if it is positive it will be blue
ii) ichimoku kinko hyo in chart i am not talking about expert adviser.
Thank You
1. In our list of things to do.
2, Will check on this possibility.
Dear Nithin/Siva,
As we all know Vertical screen space for charts is very important for any day trader. I have shuffled / tweaked few pi elements to extract some more vertical screen space for charts.
Request you to pls consider this. http://tinypic.com/r/15g9k49/9
or find the image here. http://oi64.tinypic.com/15g9k49.jpg
Regards
Sure, will do. Also in latest release one can use page up and page down to drag charts vertically.
@Siva,
Thats great, will wait for the next update.
Thanks & Regards
It’s already available, you can install the latest one from Q or update from Pi by selecting check for updates under help menu.
Dear Nithin Sir,
My User settings are note getting saved this time after this new update I have made in the system in PI.
Please provide a solution urgently.
Kindly write to [email protected] for support related queries,they are getting saved, anyhow will reach you on this.
Okay.
sive as you are suggtesting to contact support team I contacted them but they were not having any solution for the same and I have posted the solution so that if any other trader like me is having the same problem then after reading to my reply he /she similer problem will be solved instedly for which I have to struggle for 2 hours.
I am facing problem loading the chart with periodicity : day after updating PI, chart displayed is zoomed in and data is displayed only for 4-5 days. And when I choose link to excel, I get this error : ”Exception from HRESULT : 0x800AC472, please try again.” What should I do?
Thanks in advance 🙂
Can you recheck on the daily data part. Try to close excel and try again or select continue option. In both these cases if the issue still persists then you can write to [email protected] to get a fix.
I rechecked the charts, only 4-5 candles are displayed for day charts.
Where you able to solve this issue. I am also getting this issue.
Where you able to solve this issue. I am also getting this issue.
Dear Nithin,
No love for this thread. http://zerodha.com/z-connect/tradezerodha/kite/chrome-extension-for-kite-and-pulse
Unable to login.
Daily error. OMS Login Error.
pls. dont give a vague and unacceptable answer to clear the cookies and cache and browsing history. Also pls dont tell me to login once since the system is working fine at your end.
This much i know and we have done it…this is absolutely discouraging …..
Bhushan, today we are running some maintenance activity.
Dear Nitin,
If I move to NSE now platform, how about the stocks traded only on BSE. Can I still use NEST for trading in BSE ?
thanks
No, You cannot able to trade on Nest for only BSE.
Hi Nithin,
I am trading from long time but recently shifted to Zerodha. Just a small confusion as this thing never happened before. From last two three months I am getting all short of bogus SMS and Calls relating to share tips and trading.
I ask them how they got my name and number and know that I am a trader. They say they had some sort of list of the people who trade. So just to clear my doubt I am asking that our confidential document that are with Zerodha are safe so no chance of getting leak somehow.
Dinesh, there is no way this data is going through us. But this is generally an industry problem across brokers. The good news is SEBI is banning any such SMS/calls, so hopefully in a month from now. Also suggest you to get on DND list, and report such messages.
Dear Team,
Pls let me know about alligator indicator which in build in kite , how to create in PI?
I tried to do through using Simple moving average with period 13,8,5 and also with exponential moving average with period 13,8,5. But here the issue there is no offset option so that crossover could not be visible clearly.
Pls inclusive all studies indicator of kite in PI too. Kite is user friendly but PI is so confusing.
As kite and pi use two different charting libraries, it is not possible to match both on all features, but will get this checked with our team on the possibility of adding alligator on Pi,not guaranteed though.
For the first time this new update /patch is upsetting . Can you have this H Lines looked upon the next time PI is updated . It should hv been a better deal but it is not .
Can you describe a little more on this.
After the patch n update from Q whenever i place Horizontal lines , they disappear , They come back after i zoom in zoom out . I had this problem earlier but i has worsened since disappear even during edit
I use NT7 and the lines stay stable , the drawings stay stable . Its also easier to pick the right line if you want to move it around. In Pi its kind of tough as they tend to disappear.I hadn’t highlighted this issue since other have said about this . I hope a solution is found in the next update
The issue of disappearing lines and indicators is fixed with new patch, if still you are facing this after new update
then we will reach you and get it fixed.
Please include chart color options like Fore, Back, Grid colors in the Main Menu -> View -> user settings -> chart settings.
Because the default Grid color is not visible to me, its really time consuming to change it for each and every chart.
Please update this in the next release
Thank you
Will give in next release, for now can you try changing application style under view menu and look if its of any improvement comparatively.
What is the minimum tick for trailing stop loss in bracket order for zerodha pi ?
It is 20 ticks or 1 absolute.
in PI
1) FNO 3 new entry missing.
2) FNo Series of only october & November , December missing.
Go to pi installer location or default location C/zerodha/pi and delete all contract.bin files and then try to login.
We got few clients having similar issue-it was happening due to frequent disconnection/reconnection of internet the indicators and drawings were getting deleted as we had added a feature of auto refresh of charts. For the time being we have removed this feature,if you could do Help->Check for updates ,to have the latest version it should resolve your problem.
hi
you can add this feature as manual function
ie :- giving a refresh icon & option in settings
where some body is loosing data due to disconnection, he can click on icon and retrieve data .
NB :-
1, refresh can done on selected charts , because high time frame charts does not need refresh like daily weekly
2:-
Will give in next release, for time being one can change time frame for opened chart, it is as good as refreshing chart.
Appreciate the new version. But since it was installed, indicators don’t hold in charts. ie. After some time of loading a chart with indicators as per my template, all the indicators vanish after some time. I can re-apply. But re-applying it in all the charts is not practical. Took up the issue with the support team. Still to be fixed! Can you help to fix it?
We got few clients having similar issue-it was happening due to frequent disconnection/reconnection of internet the indicators and drawings were getting deleted as we had added a feature of auto refresh of charts. For the time being we have removed this feature,if you could do Help->Check for updates ,to have the latest version it should resolve your problem.
Hi,
Thanks for your prompt reply. My problem is fixed. Today, all the indicators held, after updating Pi.
Pi is a wonderful platform. Congrats! And keep on!
Hi Nitin,
I have observed that link to excel stops auto-updating after some time. Any insights?
If the Market watch is closed/ scrip is removed from MW,then excel update would stop.
thank you for a prompt reply. the problem is solved.
Hi, after the recently updating Pi, on clicking Link to Excel, all other open excel files are closed instantly. Any solution?
For excel 2003 and below this will happen for first time after opening link to excel option for a particular market watch,will get it fixed soon.
thank you for a prompt reply. I am using office 2013. Awaiting the fix..
hi
please introduce option chain and Implied volatility in pi
In our list of things to do.
Hi Nitin,
Why dont you come out with a PI for Mac users. The virtual box is a pain to shuffle between windows and mac OS
Pi is built using dotnet so it is not supported on any except windows,it may not be possible anytime soon to be available for mac. One can use kite web or we do have mobile ios app.
Mac uses microsoft dotnet, can’t work on apple.
very disappointed yesterday when I was facing problem while trading and requested to help me but no response .
any way thanks to the person whome I found from the net who helped me in the matter .my latest candel of five minutes was not showing me the current tick rate which I requested to help.the problem was was with the date and time which was set wrong in my pc.
You need to write to [email protected] or can call 080-40402020 to get a fix for support related queries in quick time. You can use this blog to give suggestions, feedback or ask for new feature requests etc.
In Pi we can not zoom in and zoom out properly as we can do in Kite , so plz try to make it like kite , in kite we can move whole chart anywhere up or down or left or right but in Pi we can not do that so plz try to make it like kite
One can use page up and page down to move chart vertically but will make other zooming options similar to kite soon.
Please fix the following Bugs
1. Study disappears automatically after some time
2. Zooming in automatically
3. Suddenly chart freezes (Interactive and broadcast still green) and does not respond to Ctrl+R (Reconcile) and you have to invoke a new chart window.
4. I have encountered an error message several times ”can not change time frame” while I was doing nothing on the chart.
1. You can update latest patch or install new one from Q to get this fixed.
2,3,4, should not be happening, can you write to [email protected] to get it fixed.
Hi zerodha/nithin
I wanted to inform that at times quick limit order from chart does not go though because of volatility price would have changed when we click from quick limit order.it will be nice to have a quick market order buy sell option in the chart just like quick limit order as it saves time and is quicker.
Will be implemented in coming releases.
I too see a drop in bandwidth @ zerodha pi for the last 7 days . Maybe more traffic customers or a bandwidth issue. It does not hang up but one can sense login takes longer than usual .
My internet bandwidth is more than 2 mbps and NT7 and other sites load quickly . Hope you can resolve this issue at your end.
2) Templates loading should be easy . At NT7 it takes less than 5 minutes to apply my previous Weeks templates . But at Pi even the previous Day templates do not load sometimes. Hope you take care of this issue . It takes more than 30 mins to draw lines for 4-5 equities for today and previous days before one can start trading . I hope you understand .
Sure, will look in to this.
pls reply I am hangup with the chart
For quick response you can call 080-40402020 or write to [email protected].
just now i installed windows 10 and installed pi and updated it.every thing is working buy when i opened charts the current candel is not working in all the scripes.pls help what to do
Nothing as such from our end, also can you check it the ltp is changing for the selected scrip as only if change in ltp chart will update, if still the same you can write to [email protected].
HOW TO SAVE CHART ADDED INDICATOR IN PI CHART
EVERY TIME WHEN CHERT OPEN MY ADD INDICATOR RE ADDING EVERY TIME. HOW SAVE CHART WITH INDICATOR PLEASE HELP THANKS
Add indicator,right click,save chart–> save chart as template. To apply the same added indicators open any chart–>right click–> apply template and select the saved one.
Sir,
2nd Patch Applied.
Result :
When we try to apply saved template on chart.. Not 1st time but 2nd time..
it gives ”Unable to fetch historical data” error.
As mentioned we tried calling you multiple times to fix your issues, it would be appreciated if you are available tomorrow so that all your issues can be sorted once and for all.
Some users are saying we cant delete ”free hand Drawings”.
I just want to say…
1. Make sure Cross hair is not selected.
2. Select drawing and just hit delete button on keyboard.
If you try to double click on it.
it wont show you any option to delete.. especially free hand drawing.
hi
today`s second patch is arrived
are zerodha customers beta testers or traders ?
please use in house test before upgrading the software
:= hope this patch solve the problems
To fix one corner case faced by few we have released but it’s not mandatory for all.Anyhow will try to not repeat it again.
team zerodha i want to give a suggestion when you guys release a patch or some update ex a trading holiday comes up can we expect zerodha to send a sms or email to all you clients.it will be really helpfull .
Will do.
5 days 5 minutes chart opening with 4 days with same day chart, which suppose to be 5+ Trading day.
Disappearing all study after 15 minutes auto refresh include Pivot level.
It needed to be saved after adding on charts to stay.
Siva sir.
But when we load saved template on charts ”2nd time” its giving ”Unable to load historical data” error.
Need to terminate Pi and load again.
We tried calling you multiple times but was not answered, if you can give access of your system once we can able to fix all your issues once and for all.
Siva sir,
1. All Opened Charts Automatically Loading/Refreshing on every 15mins.
After refreshing, Indicators are there but horizontal and trend lines are disappears.
2. When apply Vertical line.. Its should be apply on candle panel as well as on indicator panel also.
3. All the Oscillators indicators are missing horizontal at 0.
4. There is No internet issue but chart freezes frequently.
And its happening after applying patch.
5. Horizontal Lines – exact values can be entered in edit box (for Indicators panel).
Should be accept 4 decimal values.
Please release patch ASAP.
1. Go to check for updates and if it is saying there are no new updates and still indicators are vanishing then you can write to [email protected] to get a fix.
2. Vertical line will be applied on chart panel only, one can use cross hair to view indicator values.
3. It is not missing but we only din’t provided as it may look little clumsy if we add many indicators and may confuse traders in real time trading.
4. Can write to support.
5. Will check on this.
Siva sir,
Today i again degrade the application because of that issue. #Vanishing Indicators.
Email already sent to support team.
I hope they will solve the issue as soon as possible.
Sure, will check on this.
sir
one more thing , you have provided cover order with limit option in Pi but you do not provide any setting under USER SETTING > ORDER WINDOW , for setting default values in cover order ( by default it opens as limit order) , please look on that .
thanks
Point noted.
dear sir
i updated Pi today at 9:00 am , since then Pi charts are creating problem to me , the study and indicators which are saved as template , when i apply them on open charts they get dissappear after some time ( irregular time interval) and then i apply them again ,and they get vanished again after some time , please resolve this problem .
thanks
Go to check for updates under help menu and if it is saying as there are no new updates then you can write to [email protected] to get a fix.
in Pi Day seperator not showing properly plz select 15 days 15 min chart and then put day septrator and check each day , is it showing ok? plz check that
and plz add horizental line at 0 in MACD
plz add ATP line in chart beacuse without ATP in chart its so difficult to understand chart so plz add ATP (AVERAGE TRUE PRICE)
I added the same and is working fine.Can you kindly write to [email protected] to get a fix if you are facing any issue on this.
Zero line on MACD and addition of ATP are noted for future releases.
Can we do Option spread order ?
when it will be available ?
As of now spread orders are not available, these are in our list of things to do will take some time though.
Hi Siva Sir,
PI is getting hanged for long time and also Everyday since last 3 days I am getting the updates for download. Everytime I download the patch it shows the same release note. I think the patch is not saving properly.
Please fix the issue.
Also chart is not opening and giving error screen.
Will reach you on this.
So is there a new update to PI or just a patch , I noticed in Q that the latest update is 20/9/2016 ? any new features indicators added .
There is just a patch,just a minor fix to horizontal lines.
But the one dated 20th include few new features link link to excel option, overbought oversold levels on indicators, saving horizontal and vertical lines on templates and few other changes.
what ever study and Indicator add on chart, it is disappear after some time even it is saved.I check for updates but can`t find any.
Go to check for updates under help menu and update new patch.
still same problem
Sir, Problem still continue .I check for updates but getting massage that- thie version of pi is latest,no new updates is available!
Can you create template once again and try to apply that instead applying the older one and check.
Yes sir I do this several times even I uninstall pi and install fresh and after update I create new template then save it but problem still prevail.from last 3 days I am doing same thing again and again.
i
Can you write to [email protected] addressing to Siva, will get it fixed ASAP.
Hello,i updated Pi to latest version and created multiple marketwatch lists.After saving and exiting Pi when i re-login again there’s only default marketwatch,the other MW that I had created simply disappeared.Please help.
You need to save them, goto view-> user settings–>market watch and select save layout on exit and market watch save on confirmation exit.
Thanks Siva,problem solved 🙂
Hi I have noticed my pi crashes whenever I have a active window has been popout , so can you please look into it
Can you kindly write to [email protected] mentioning the same.
i updated new version, what ever study and Indicator add on chart, it is disappear after some time even it is saved.
From view – settings doing all my require settings”market indices’ and and kept blank and saved , but still opening after some time.
can not remove Rsi Indicator after double click on same. how to remove?
Thanks Jayesh for posting this issue.
I m also having same issue from morning.
Chart loads automatically on every 15mins and all the applied indicators, trend lines, horizontal lines gets disappear.
Irritating issue.
I just degrade the application.
Old version also has problems but its better than this as i feel now.
Can you goto help menu and update the new one and try, we have updated a fresh patch this afternoon.
Good sir,
Keep releasing patches like this. #Needed
i was thinking to suggest you this but then i saw your reply.
Thanks a lot.
Chart is not refreshing/Loading automatically as i m watching it from last 45mins-1hr.
No indicators, Horizontal line, Trend lines disappears this time.
May be because of market is closed and candles are not loading.
Will see tomorrow in live market session time and then give you reply.
In Indicators Panel, Horizontal line still has problem.
I thought its fixed.
Its still Changing its place and value when zoom in or zoom out chart.
Chart was in zoom-in mode and Tried to adjusted Horizontal Line’s place.
Horizontal line disappears.
”Apply at specific value” feature is not given yet to horizontal line for indicators panel.
Choose ”Secondary Line Color” option should be given to some indicators.
Thank You
Several time update after Reinstall by me and Zerodha It person Himansu,
still problem remain same, Kindly advice how to install previous July Version???
Hello sir,
I update Pi software.
But its still stuck at loading contracts and exchanges.
This issue not solved yet.
I re-login again..
While loading Pi..
Its showing status ”Account is ready”. ”Downloading Account Information”
And again it stuck.
Needs to kill pi application by task manger and need re-login until it successfully loads everything.
It wastes lots of time. And its really really annoying.
I hope you are working on it.
Thank you.
It should not take more than 30 seconds to login and if it is taking more than that you can write to [email protected] to get it fixed.
I email many times to srinivas sir.
He suggest me to delete *.bin file before you login.
It will solve your problem.
I tried.. it works and its working from last 45 days.
but its temporary as we all know. Need to fix it permanently.
No need to do it before every login, but only when you face this issue, try logging in normally and check if you are still facing this and if it is then it is specific to only your system.
Ok Thank you siva Sir 🙂
I hope your team is working on the problems that occurred today in new update.
Horizontal line can accept only 2 decimal values Ex: 93.25.
But in currency trading, We have 4 decimal trading price i.e 4 digit. Ex: 73.2550.
So horizontal line value should be accept 4 decimal value.
And Also for indicators panel please give Horizontal line edit feature.
It will be very useful for us.
Thank you
Hello Sir,
Its About 20th Sept 2016 Pi Update.
I update pi software, I was happy and I thought everything is fixed now but i was wrong.
1. Overbought/Oversold Levels added in indicators such as RSI, CCI, and etc.
When i apply horizontal line in indicators window.
for ex : I apply horizontal line at 50 Level of RSI.
I tried to change its thickness to 1 (By default its 2 which is not good) and clicked on apply button.
Its giving me error ”Unhandled exception has occurred in your application, If you click continue application will ignore this error and attempt to continue”
I just want to say… There is major problem with only horizontal lines.
1. When i apply horizontal line at particular price in candle panel.
It gets invisible. Old problem did not solved yet.
We Need to zoom in or zoom out to make it visible.
Its very annoying.
Same while deleting also, When i double clicked on horizontal line to delete.
it gets invisible.
And its a very old problem actually.
I already mentioned it many times.
2. In this update,
Edit section given for horizontal line Which is really good.
but only for candles panel but not in indicators panel.
THIS IS NOT FAIR.
why you blocked horizontal line ”Edit” features in indicators panel?
please i request you to give us that feature for indicators panel also.
because Not every indicators are analyses by overbought and oversold situations.
some other indicators needs to apply horizontal at particular level to understand where market is trending.
And its only worth when it applies at very perfect level (Indicators).
I again request you sir please fix all these bugs related to horizontal line.
because horizontal line is basic thing in any trading software.
and it should be perfect.
Thank you
1. It happens because you are giving value way beyond the values displayed on y axis. It is not any issue and that is how it works.
2. You can add horizontal lines on indicators also, change thickness, delete or move around freely,only thing which should be fixed is for an exception is being throwing up when trying to change thickness of horizontal lines applied only on indicators but for time being you can select continue and proceed but will get this also sorted soon.
Ok the issue solved now in candle panel.
But in indicators panel,
when chart is complete zoom out.. horizontal line applies perfectly and it wont get invisible at all and not even change its place.
But when chart is zoom in and apply horizontal line in indicators panel as a indicators level.
It gets invisible, and to make it visible again, need to zoom in chart.
and when i click on zoom in button, horizontal line changes its place.
so its really irritating.
if you think i m lying… i will post video on youtube.
Another problem i have found…
I have 5min and10min chart opened with indicators, trend lines and horizontal line applied.
Template also saved on disk.
Now on every 15min, 5min Chart and 10min chart refreshes automatically or you can say it loads automatically.
all the indicators, horizontal line and applied trend lines are gone.
first time i thought its loading or refreshing. so i ignored and apply template again.
but again in 15mins, same thing happened.
so its happening…
today i will record and post on youtube and will share a link with you here.
thank you
Another suggestions of things to do for PI
a) See if you can total advances vs declines numbers somewhere below the sensex / nifty indicator in the chart.
b) Its high time we have a slider at the bottom below to quickly move along the charts if opened for 10 days- 30 days like in Kite .
c) Locking of Horizontal lines on right click option.
Points noted.
Hi Team,
Im new to zerodha. Kindly let me know whether i have to pay any extra charge for using zerodha pi.
Thanks,
VP
No extra charges. You can login Q.zerodha.com and download pi from there. Pi bridge costs extra, which is used to connect Pi to other platforms.
Sir,
I am new to zerodha. i can’t access the chart and chart tools tab while using pi trading platform.please give me a solution to my problem…
Can you send an email to [email protected] with your client ID.
ok ..i will..Thanks
Please add supply and demand indicator
Will check on this possibility with our development team.
Oh! never knew that this thread is so active. And ”The” Nithin himself reply here. So much feedback to give at so many levels. I Should try and talk to to him one to one 🙂
Nithin Sir, Can we get some bright shiny ”Neon” color template in pi and Kite. And liberty to change the color/thickness of indicator lines and other chart element.
Thanks
Hey RK, 🙂
Yeah, allowing customization of charts is something on our list of things to do.
Thanks for the reply Nithin Sir,
I know these things will come eventually, but getting a reply on the same from someone who started it means a lot to lesser mortals like us 🙂
Eventually together we can make it a world class platform.
Regards
new Auto resync facility is giving all charts to a single time frame ,,,,,
ie if 1,5, 10 min charts are opened , when auto resync activated then those 3 charts are sync to a single time frame
sir,
’’%change in open interest’’ column in MW is still missing..
In our list of things, will be added in coming releases.
after recent update(20 sep 2016) when iam unable to open chart(intraday or historical) … showing error as ’’’’ Not a valid DateTime format, reset the region settings
Go to Control Panel -> Change date, time Number Formats (under Clock, Language, and Region) and click on Additional Settings and reset numbers , time and Date Tabs.If still facing the same you can write to [email protected].
your support team has solved my problem .. Thanks 🙂
Hi
Is there any option of uploading the scrips in scanner instead of manually selecting and adding one by one.
Yes there is, create new scanner–> add symbols—>select required market watches.
hi
there is some problem in Trend Cycle indicator when i plot it in intraday charts like crude sometime its visible sometimes not mainly in small time frame plz sort this
thanks
Sure, will sort this, for time being try to change time frames to make it visible.
I want to see moving avg. in double colour. for example when scripts are going on up then the line should be seen in green colour & for down is showing in red color. also i want pivot lines in multi colour in chart view. & thic also.
Point is noted for coming releases.
I want to see moving avg. in double colour. for example when scripts are going on up then the line should be seen in green colour & for down is showing in red color. also i want pivot lines in multi colour.
Point is noted.
dear sir
pivot points in Pi are calculated via standard formula , as they also match to my pivot points , but till now i am not able to understand which formula or method is used to calculate pivot points in kite charts as they also not match with Pi chart pivot points ,
please explain for my convineance .
will be thankful to you
thanks
There are various types of pivot points, in Pi we have four types and on kite two different models. So, there will be differences across them.If you can mention the model and send the differences with screenshots to [email protected] we will check and get back.
Hi,
I am unable to use the RSI Study in my chart. This has happened after today’s (22/09/2016) compulsory Pi Update.
Please help.
Thanks,
Harish.
Can you recheck on the inputs ie if enough number of candles are there for the study to plot, even after facing the same issue can you write to [email protected].
Pl z Plz add VWAP in the near future in PI as a indicator
Sure,will check on this possibility.
Hi Nithin Sir,
Any option to get the OPEN = HIGH or LOW concept in PI.
Else even any scanner you would suggest as code in pi script and we can scan the entire market watch for this.
Please guide.
Thanks
Bhushan
You can use the same code and scan entire market watches at a time but as of now scanner scans only during market hours and only for minute and hourly data but not daily data.
You can use Open = high or low in Pi scanner. You will have to add scrips individually to the scanner though.
Nithin Sir,
You are saying that we have to add manually stocks. However but Siva sir is saying that it can scan the entire market watch. Please clarify.
Also Please tell me when we will be able to get the scan on regular daily basis. It means that I should get the list of stocks only for which the Open = high o open = low on a daily basis and not on a minute basis.
Also please enable the scanner should scan even after market hours.
Regards
Bhushan Kela
Create new scanner–> add symbols—>select required market watches.But not possible to scan after market hours anytime soon.
sir ,
zerodha pi is a very revolutionary software in this industry , trade from charts and watching many scrips chart gives a way potential effort but the tiring part is if i open 10 charts or more then 10 i have to view each chart by clicking mouse on that , the idea is a little addon pane like amibroker in the below quick order window or in the left side , so we can select charts via keyboard or mouse like amibroker , if a option is available then how to use it and if not please add it to make more comprehensive trading software , ( general idea is to see open chart scrips on addon pane and use it like amibroker ) .
THANKS
hi ,
No answer for my question
Hi Hari, it is on our list of things to do. It will take time though.
Hi,
I am assuming that pi is providing level 2 data in the market depth window( up to 5 bid ask). Could you please provide DOM Trader (price ladder) in pi like the one in the ninjatrader. It is very difficult to get an affordable third party data feed provider with level 2 data, because of huge cost. In pi if it is already providing level 2 data why can’t it be provide the DOM trading feature so that full potential of the data feed can be utilized. Could you please consider this.
Regards,
Manoj
We are working on this but will take more time.
Yes Manoj working on this as we speak.
Hi Nithin,
When you consider the DOM in future please consider jigsaw trading DOM features also.
Regards,
Manoj
i too agree with Manoj .
sir ,
zerodha pi is a very revolutionary software in this industry , trade from charts and watching many scrips chart gives a way potential effort but the tiring part is if i open 10 charts or more then 10 i have to view each chart by clicking mouse on that , the idea is a little addon pane like amibroker in the below quick order window or in the left side , so we can select charts via keyboard or mouse like amibroker , if a option is available then how to use it and if not please add it to make more comprehensive trading software , ( general idea is to see open chart scrips on addon pane and use it like amibroker ) .
THANKS
Can use ctrl+tab and select required chart using keyboard.
Is there any window in pi which gives new high ,new low tick wise in terminal ?
Nothing as such as of now, but year high and year low can be seen on snap quote.
plz add a horizontal line line in MACD at 0 line
and one more thing how to zoom in and zoom out from keyboard shortcut key , its very difficult to third click on chart and click on zoom selected area again n again so if its not available in current pi plz update in next pi version
For zoom in and out of chart you can use up and down arrow.
Hi my account is still under process but I have a query. If an order is partially executed and if I modify that order afterwards and execute it, how will the system charge brokerage? Will it take 1 trade or consider it 2 trades? Thanks!
It will be considered as one trade only.
Hi I have a query. If I look to sell a huge chunk of stock at say 275 and if only half is sold, then can I modify my sell order for the unsold stock. Will system allow that partially executed order to be modified or will it get frozen till it gets executed?
Yes, you can modify or cancel the remaining pending order according to your wish.
Kindly add Bar Replay/Market Replay feature in next version of Pi
Not sure about the possibility but will check with our development team.
RSI Overbought Level (70) AND Oversold Level (30) are very difficult to understand very quickly. please add a horizontal line in both Levels in next Pi update
This is done and will be available in next release.
Nitin ji
Sorry to place this question here
I hv shares in Zerodha Holdings + Cash . Wont i get Inytraday MIS margins automatically against the shares i hold in Zerodha+ Cash . I get a RMS msg rejected for margins against SBIN FNO on two occasions today and on previous days.
Ideally other platforms offer Indtraday margins against holdings irrespective of cash available or not .
chandru
To get margin benefit from holding shares they need to be pledged with us. Can check the below link to know more about pledging.
http://zerodha.com/z-connect/tradezerodha/margin-requirements/online-pledging-of-stocks-for-trading-fo
PS0047 My BO is not enabled. Could you kindly enable.Thanx
Can you logout and login back and check.
Sir, is executing a cover order with limit entry similar to that of a bracket order? That is , do we have to wait till the price is above/at the desired level or can we execute it similar to a mis with slm order, where in we can place the order even if it’s 4 to 5 points away.?
Thank you.
Yes, executing cover order with limit option is similar to executing BO with limit option. One can you use limit buy option only if limit price is lesser than market trading price and as of now there is no option to enter a trade using cover order or bracket order using stop-loss option similar to mis or nrml product types.
Is there any option of heatmap window of my market watch and also if we click on stock of heatmap chart will be open of that stock.
And also how many stocks I can add in a market watch and what is the maximum numbers of market watch can be added.
No heatmap as of now. On Pi one can add 5 market watches with 50 per market watch with total 250 stocks at a time.
Hi
I want GTD order option in PI. Is this thing in your pipeline in future?
I think it will be very useful for all investors who is working full day.
Right now, I want to buy icicibank@ 250, every day I have to submit after market order, which I don’t like. If you can provide good till date order option, I just need to submit order once. This option is available in IIFL and few other brokerage platform. So please try to implement this asap. It’ll make my and other investors life easier.
Thanks
Not possible in near time but will check on this possibility.
Manu, this will take more time, but on our list of things to do.
NITHIN KAMATH
whenever i ask u to update pi for cross hair with time and price i get the reply ”For now one can see time and price in the data box when cross hair is selected. Data box can be moved freely.”
in pi cross hair only works till the last candel but if i want to see the pirce that is expected price then it doesnt work.
waiting for your reply.?????
Working on this, will take some more time.
When are the new releases scheduled for kite and Pi? Any dates?
Kite – u can only have 5 watchlists. thats quite limiting.
no predefined watch list. is it coming?
no scanners – is it coming?
no fundamental scanners too? is it coming
alerts notifications on sms, email or push on apps. coming?
Pi – I am using Kotak downloadable software and working fine. for Pi – it is installed but when try to login gives message unable to login. can login on another computer. resintalled couple of times already. no antivirus so that cannot be issue. asked support they simply suggested to use kite. lol (not sure if they are aware of huge difference in functionality of pi and kite).
Fundamental screeners are coming on Kite, maybe in next 2 to 3 weeks. Alerts will take time.
Will get our team to get in touch with you for Pi.
plz start stock advisiory service.
plz add change in Open Interest from previous day in futures script..Plus and Minus….every other terminal has it, why pi not added it till now ??? also add days top gainers and losers for the day….
In our list of things to do, will take more time but fundamental screeners will be soon available on kite.
To Nithin Kamath Sir,
I m facing problems in Pi software from last 30-45 days.
so i decided to message you here.
1. Pi software stuck on ”loading contract and exchanges”.
Need to clean *.bin file every time.
Need to re login again and again until it gets successfully loads everything.
No internet issue at all. It works fine, i have 2mbps internet connection speed.
2. Sometimes Chart freezes.
When i move my mouse pointer from one candle to another.
OHLC values in data box did not changes.
Need to minimize and maximize application to refresh.
so then it shows exact OHLC values.
3. Re code Horizontal and vertical line.
Horizontal line changes its place when we zoom in or zoom out.
There should be an option to apply at specific price level and It should be stick to that level.
Right now we can not apply it on specify price.
Vertical line cant apply through-out the indicators window.
4. Fibonacci Tool
Fibonacci extension is missing.
In fact we cant edit or add levels to Fibonacci tool.
5. Getting ”Unable to fetch historical data” error message.
Open a new chart with any time frame, Apply 2-3 indicators.
and then save it as new template.
Now open new chart of any time frame and apply that template on it.
Now try to open another chart with any time frame.
This time it will give you an error message ”Unable to fetch historical data”.
Basically when we apply saved template on chart it gives error message on loading new chart.
6. Major problem with Pi terminal is study.
As a trader or A student i believe in one thing ”First Learn Then Earn”.
Pi software does not saves drawings or it can not load as it was in previous state.
Every time we need to setup.
Think on it, When we re-login after power failures or system crashes occurs,
It will be very helpful if pi terminal loads as it was in previous state with open charts, drawings, and applied indicators.
Right now pivot point only shows on today’s/Interaday chart.
There should be an indicator ”daily pivot points” indicator to show previous days pivot lines so it will be very helpful to trader to learn from past.
There is no option to load recently closed charts.
Pi terminal does not load in offline mode.
7. Indicators levels.
There is no option to add new levels to indicator or highlight default levels of indicators.
We need to apply horizontal line on overbought and on oversold levels.
But horizontal line has problem. it does not applies on specify price.
And it changes its place when zoom In or zoom out the chart.
In indicators, Maximum and minimum level parameter is missing.
because of that indicators levels are not steady.
It changes its place along with trend line of indicators.
Indicators Levels should be fixed not floating.
8. No Forex related news are showing in news reader.
RBI will allow trader to trade in major currencies pairs soon.
so i request you to please bridge between Pi and MT4 for forex traders only.
Because MT4 is best trading terminal in the world right now.
It will helpful for forex traders to trade in major currencies pairs.
It just a request.
9. Pi software gives an error on exit.
It asks me to send an error report or quit.
Also sometimes.. It crashes.
10. Cant use Kite App, Pi Terminal, Kite Web all together at same time.
one of them get logged out.
Allow traders to use all three applications together.
Kite Web is way better than Pi software.
Only one thing is missing in Kite web is Cover order and bracket order.
Kite App is mind blowing. Quick Fast and very useful.
11. Please Merge MACD and MACD Histogram Together.
I m really frustrated with these problems,
These problems occurs on daily bases.
and there are so many trader are also facing it
and i can see so many traders are here also posting same problems from long time.
Please Nithin Sir, I personally request on behalf of all the trader.
please please please solve this issues As soon as possible.
I hope Zerodha technical team will fix this issue and will give us new update very soon.
Thank you.
1,2,5,9 Will reach you on this.
3. Will be available in next release.
4. In our list of things to do.
6. Fixed and will be available in next release.
7. Will be available in next release.
8. We cannot bridge to MT4 as it won’t allow to do so. It is the limitation from MT4.
10. Cover orders and Bracket orders are available on kite web also.Once you opened buy or sell order window select for more options.
11. Few clients want it separately, anyhow once one added two indicators on to panel one can select histogram and drag it and drop on MCAD, it should serve your request.
Thanks For Answering One By One.
I had no idea about dragging and dropping.
Anyways its worked.
Requesting you to add Awesome Oscillator Indicator Which Is Missing.
Its A Great Indicator.
Thank you
Point is noted.
dear sir
i used to track multiple stocks , for that purpose today i open 8 charts (but to need 16) after opening 8 charts and applying indicators ( M.As) the Pi gets slow down although ticks are also coming very slow , i am using i3 computer with 4 gb ram , please write to me what i am missing.
thanks
Upgrading your RAM should help. You can open a maximum of 12 charts at once.
sir
that is not possible for me ( as of now) because 4 gb is the maximum memory that can be used in my system , please provide some other solution .
thanks
If you’re opening 12 charts, you’ll have to have necessary hardware to support it.
thanks sir
i will try to upgrade
Also, everytime I load charts, the previous studies/drawings disappear.
Can this be fixed?
It will be fixed in next release.
I can create multiple market watch, but how do I load them? the next time I load PI.
The only option that I get is to save workspace, which if done only loads the default market watch every time I load PI! The newly crated market watch never seems to appear!
Pls help as this is of great inconvinience
Goto view->user settings->market watch->select save market watch on exit and market watch confirmation on exit->Apply and ok. It will save your new market watches.
REMINDER
NITIN PLS IF POSSIBEL ADD TIME AND PRICE IN CROSS HAIR IN PI.THE CROSS HAIR DOESNT SHOW ANY PRICE AND TIME WHICH IS USELESS.IN KITE IT IS POSSIBEL
For now one can see time and price in the data box when cross hair is selected. Data box can be moved freely.
please add Structural Pivot in Pi if possible
DEFINITION of ’Structural Pivot’
A price-bar formation that gives real-time price signals of support and resistance. When a series of price bars reverses direction, it is considered a structural pivot (not a calculated pivot).
The price bar has an open, high, low and close. The pivot is composed of a minimum of three bars and occurs in every time frame. The pivot lows and highs are used to draw trendlines to show support, resistance and trend direction.
For Expample
http://imgur.com/a/DQr04
Not possible in near future.
How to get ATP line (AVERAGE TRUE PRICE) in chart in Pi and Kite Both ???
As of now one has to draw manually.
plz to try to add auto atp on chart in pi on next realase it will be a very good feature
Point is noted.
yes, wish to have ATP in the chart. it helps a lot in intraday. Please add it in next release
after opening one chart from marketwatch in Pi and adding my own template in it , it perfectelly load my template but when i tried to open another chart from marketwatch i can’t open chart and getting below error messege
http://i.imgur.com/XohhIHJ.png
Hello Nikhil,
Fist of all let me thank you and your Team for bringing up such a beautiful tool,
I just had one request,
when we sort by using % column, i would like the script name to move up and down in the watch list as per the % change in the price of script.
I think this will help us a lot to spot the Surging stock.
Thanks & Regards
Chandan Thakur
One can add stocks on to market watch and can sort out the stocks based on % change by single click on that column.
in Pi I cant draw Horizontal Line IN RSI INDICATOR IN OVERBOUGHT/OVERSOLD AREA LIKE
60-40
so plz try to add it in PI
and also getting below error while opening chart in Pi
http://i.imgur.com/XohhIHJ.png
You can draw manually but in next release we will give built in lines to represent overbought and oversold levels.
Can you do ctrl+R and try opening charts, if still facing same error kindly write to [email protected].
Pi scanner is not working in off market hours it’s a big limitation of pi
Scanner scans only during market hours if the set condition is met or not, you can do back-test during off market hours.
sir today i buy tatasteel 350put as nrml order. after some time i want to put sl.but in admin position only sqare up option is avilabel. how to put sl after bying in nrml order.
Click on the same contract (the way you bought) and choose sell order and on that choose SL option. Check this post on SL.
pls fix macd zero line steady .
Can you explain it a bit more?
Hi Nithin Sir,
One request I would like to place before you.
Please add Market by Price for both the Exchanges. This will be helpful for arbitration trading purpose.
Like If i want to check the market depth of a particular stock both in NSE and BSE, then there should be a option.
At present I have to add the scripts for both exchange and then check MBP in both the scripts to check the depth.
Hope you will consider this request.
Regards
Bhushan
This is not possible in near time, one has to do it manually only.
zerodha team
first congratulations for listening clients need and updating with them in newer versions.
can you add calculaters in pi ?? its not always good for new people like me to calculate on https://zerodha.com/margin-calculator/SPAN/ to calculate
if you can pl add live pattern option .. like its giving live pattern recognition when it calculates flag or double top or downtrend in live chart. it will be very useful for newbies like me.
once again cheers for your efforts to make trading easy for people.
thanks
shantanu
Will check on the possibility.
Hi Nitin,
It’s been quite some time you have posted videos on features of kite and pi. Many enhancement s are done in both platform. I guess many new Zerodha client s got on boarded too. Thus I would request to post new series of videos elaborating it’s all features. Ideally it should be a playlist of multiple videos. Thanks
We have published a help doc for Kite: https://kite.trade/docs/kite/.
SIr, I want to open a new trading account… I am confused between Pi & Trade Tiger… But I am now going for zerodha…
Just wanted to confirm 1 thing…
Is it possible to export Intraday data in excel like allowed in Sharekhan TradeTiger. And if yes is there any restriction on the maximum time limit… If no, then is it to be introduced later?
Thanks,
Chintan
Yes possible to export on excel. We give almost 2 years of intraday data (most brokers including tradetiger offer for only 30 to 60 days) and end of day data from 2010. You can open a chart for as long as you want and export it to excel.
Is Pi only available for Windows? or is it also available for MacOS X ? Please develop Pi for macOs too.
Pi uses dotnet, so possible only on windows.
There is a need for volume indicators related to buy / sell. Volume Profile is good but a volume indicator with ratio or qty display of buy/sell on the chart is helpful . If this cannot be done in PI then please see if you can add it in Kite . I wish Kite could have a buy sell order similar to PI .It would be highly convenient to move around placing orders.
Popout charts with buy sell order in Kite is a long pending request .
I use NT7 and its been giving me good results on using Tick data and Volume indicators.I hope you incorporate some suggestions in PI or Kite .
Can you name that particular volume indicator you are looking for.
in NT7 its named as Eds Volume Price Bar it provides Buy / Sell Volumes on the chart live.
REMINDER
PLS ADD TIME AND PRICE IN CROSS HAIR IN PI .VERY IMPORTANT TOOL
As of now one can view time and price in data box window when cross hair is selected, and databox can be moved freely.
Why don’t you have Pi client for Mac ?
Pi for Mac isn’t developed yet. You’ll have to do it through a virtual machine for now.
hi in next update can we have volatility based chats i mean range bar charts
Not possible in near future on Pi but already available on kite.
I added new Marketwatch and when I relogin, that new Marketwatch was not there. Happened 2-3 times. So can I save newly created Marketwatch in PI?
Yes, you can save newly created marketwatch.
Go to View>User settings>Market Watch. Tick boxes under Save MW & Charts. Click Apply
If below features added in Pi, it can compete with international standard trading platform and sharekhan’s TradeTiger :
1. Scrip can be changed after clicking scrip name from watchlist on a single Chart Window. It will help trader to analyse multiple stocks very quickly.
2. Provision to draw distribution zone and accumulation zone
3. Entry, SL and Exit line with auto calculated RR ratio
4. Show Server Time with seconds, It will help traders to place order before closing Candle in a particular time frame.
5. Monthly & Weekly time-frame are missing from chart
I am sure, you will rock. You will give big competition to the traditional brokers.
1. Already incorporated, open chart and do ctrl+F.
2. Point noted.
3. Can use bracket orders for time being.
4. Already displayed on header with seconds.
5. Working on this.
Hi,
I am new user of Zerodha.. Kindly let me know what is the requirement to activate Pi for my account. i.e. minimum trading or fund required in account.
Nothing, you can login to Q.zerodha.com and download Pi. Check these posts.
Thanks for your reply to my previous query.
Also like to know is the renko chart based on ATR value is also available in your to do list.
hi can we have yesterdays high low close on charts
Hmm.. let me bounce this with our team.
Hi
is there any fibo expansion tool avialble in PI ? I cant find Plz
some suggestions will improve PI next release
Plse add custom fibo ratio option in PI
also please add UNDO option in PI when apply trendlines (mandatory)
Not available on pi, but you can try it on kite.zerodha.com
Whom do i send a request to for Demat shares transfer slip book so that i can transfer shares from my Edelweiss a/c to IL&FS dp a/c . I need the IL&FS slip form to transfer my shares from Edelweiss.
Can you provide me a email address to place my request for the book / slip form.
Sorry in advance for posting this here
Chandru, you need your Edelweiss DIS slip. On that slip you need to mention the Zerodha demat account details and submit it back to them.
thanks will do that
Is it Possible to get the chart sync future on PI,suppose if i open the chart (5 min of a symbol) and from then if i click the symbol on the market watch then the chart should be changed with all the indicators applied for the currently selected stock,instead of user opening the chart of every stock.can we expect this future from PI
Prabhu, on our list of things to do.
When u will launch pi next release
In a week.
Is PI is free of cost or chargeable..?
Free
Nitin
Can you add a Volume indicator which is related to price / supply demand indicator to Pi . Volume indicators on charts are very useful.
Also need a Advances to Declines numbers display
dear sir
it will be very helpful , if you provide PIVOT POINTS in the kite chart just like as in Pi charts. they are very helpful in taking trade desicision
Its already available in kite, go to studies and select pivot points.
thanks sir for your prompt reply ,
i was missing that .but it was already there.
thanks again
difficult moving data box so plse view price high-low when mouse pointer move on candle
Will work on this possibility.
Hi Nithin Kamath Sir
I have few suggestion put in front of you for better user friendly in PI
Please add custom price option in horizontal line
Add line chart on chart (must)
Add price label on right axis of cross hair
custom fibo retracement levels add option
when putting 200ema on 4hr chart ema not reading lack of backfill pls rectfiy
add weekly pivot level if possible
add candle timer to know remaining time -suggestion
add realtime data like crude inventory on chart like popup -better if
Better smooth scrolling chart
add squeezing chart option to adjust height of chart
Custom price on horizontal line will be available in next release.Few points are in our list of things to do others if possible will try to add in coming releases.
Hey, I have installed the latest version of Pi 1.0.0.6 ,but I don’t find any preloaded expert advisor as in earlier version. I don’t know how to troubleshoot this. Please help.
I made my situation worse. I deleted the user.config file from local app data folder. After that I restarted Pi and logged in following which it is asking for activation key. As I paste the key, the application shuts down and nothing happens further. Tried it many time….
Can you write to [email protected] on this as some changes need to be done in user.config file.
I have shifted trading to Zerodha..I am missing the following things..easy to introduce from your side ..can you do it?..(1) life time and day – high / low prices should flash in different colour..give option to set this colours and (2) in the market watch, one should be able to sort ”Net Change” column.
Points noted and sorting according to net change will be addressed in next release itself.
Siva, thanks for the response..I want to correct myself..not life time high / low but 52 weeks high / low..Bharat
Noted.
Hi Team,
I have some feedback to give to Technical team to incorporate under PI.
1. Basket order feature which used to be there in ZT is not available in PI.
2. Under Charts, when you select 1 HR time frame, the first candle should be from 09:15 AM to 09:59:59, 2nd should be from 10:00:00 AM to 10:59:59 and so on. For the last candle it should be from 15:00:00 to 15:30:00.
I am using other charting tools like Reliable and traderscockpit and both of them have this time frame setup. Also there is no option to remove the default studies incorporated in the charts.
Appreciate if you can incorporate the above features at the earliest as it will immensely help and make Pi at Par with other charting softwares.
Let me know if any further queries required for incorporating.
regards,
Mehool.
1. Working on it but will take more time.
2. In Pi also 1st hourly candle will start from 9.15 and so on and last will be from 3 to 3.30. One can remove any study from the charts. You can write to [email protected] or can call 080-40402020 if any guidance is needed on this. Also can write to us for any more feature requests.
Hi Siva,
In context to point 2. The first candle should end at 09:59:59 and new should start at 10:00:00. Currently the first candle ends at 10:14:59 and new starts at 10:15:00. That is the change required. Hope I am able to explain better.
Regards,
Mehool.
We follow the notation of esignal and most other popular providers also follow the same.One may want first hourly candle from 9.15 to 9.30 and last from 2.30 to 3.30 and the opinions are endless, sorry to say but nothing can be done on this.
REMINDER
PLS ARRANGE TO UPDATE TIME AND RATE IN CROSS HAIR IN PI .ANY SOFTWARE WE SEE IN YOU TUBE FOREX OR INDIAN EVERY SOFTWARE HAS THE PRICE AND TIME IN CROSS HAIR THEN WHY DONT OUR PI SHOULD ALSO HAVE IT AS KITE IS LODED WITH IT.
For time being it can be checked on databox and databox can be moved freely to any place on the window but soon will try to make it similar to kite.
dear sir
this is regarding kite charts, when i open any chart of any time frame in kite before market open (9:15am) they do not show data / do not refreshes by its own after the market open at 9:15 till i refreshes the chart manually , i open 3-4 charts at once any using chrome browser.
please resolve this issue as soon as possible because you continously upgrading kite charts but this issue is not fixed since three months .
Vinesh, works fine for me. Seems like it is specific to your system, getting someone to check and get back to you.
Do we have option to replace quick limit order with quick market order on pi charts?
Goto view->user setting->order window and set parameters as required and apply. From next time you can enter a market trade from charts just by two clicks using f1 or f2 and enter keys.
Dear Nithin Sir / Siva Sir,
Please add the Advanced EOD scan feature that will scan for various patterns without selecting any stock i.e. it will scan the entire watchlist created / pre defined watch list. If possible the feature can be used to scan the data for the entire exchange also.
Regards
Bhushan Kela
Not possible to scan daily candles in near future.But for intraday scan one can scan entire market watch or pre defined market watches in the present version itself.
By which option Sir?…unable to get the same in Pi Overview video
1.It should show, can you contact [email protected] on this.
2. In our list of things to do but will take more time.
3. You can goto view->user settings->market watch->select layout on exit and market confirmation on exit and apply.
4.Can use ctrl+tab to move across tabs.
Thanks for the quick reply
1. Have sent an email
3. Already done that weeks ago when the full market watch tab itself used to get deleted. Now problem is different, it does not load all the stocks added to a particular marketwatch
Will reach you on this.
I am using latest Pi. Few corrections and additions required in Pi:
1. Admin Position does not show LTP and MTM profit and loss for MCX deals
2. There is no compare chart feature in Pi. It was added some time back in Kite but still to come in Pi
3. Additional market watches are not stable. Many times I have to re-add stocks to the market watch
4. Each chart, market watch and admin position, order book etc opens as an additional tab in Pi. Once you reach 8/10 tabs scrolling through them is very cumbersome. Short cut keys like ”Ctrl + Page Up” ”Ctrl + Page Down” like in MS Office Excel is required.
Thanks
As per your “F&O – Futures” Brokerage Calculator STT Charge:- 0.1% instead of 0.01% . Do check……….
It is 0.01% itself. Can you double check once.
Hi
Sometimes while opening PI, I am getting the following error. Its creating big tension when it happens in market.
System.NullReferrenceException: object reference is not set to an instance of an object at (Object)
at M4.frmMain.frmMain_FormClosing( Object_sender.FormClosingEventArgs e)
at System.Windows.Forms.Form.WmClose( Message &m)
at System.Windows.Forms.Form.WndProc( Message &m)
etc.,
Its hanging not even opening PI application.
Thanks,
Ravi
For the above error follow this steps
1. Go to run (Win+R) type %localappdata%Pi and find the file user.config and delete it.
2. Re-login to pi
Hello , is there any sms alert option available, in pi for stock prices fluctuation . Also , in what stocks zerodha gives leverage for an intra day trade ?
SMS option is not available, Can check the below link for intraday leverages.
https://zerodha.com/margin-calculator/Equity/
Also, how to view diffrent market watch in different tab at same time ?
Hello Nithin,
Pi is not responding most of the day (Avg:10times/day) in last week, it’s happening more than 10 times in a day. When I place buy/sell order then order confirmation popup will display if I press ’Yes’ or ’No’ than Pi will gone to not responding state, You know re-opening Pi more than 10 times in a day isn’t good app behaviour, I think.
Zerodha is good but this tool Pi is really really make me feel bad and sad.
I’m using 40MPS internet, my machine is pretty good in performance.
Thanks,
Jinu
If still facing this issue then can you kindly write to [email protected] for a fix.
Spread orders are in our list of things to do but will take some time.
As 29th sep are normal monthly expiry contracts there is no need to mention date, just type banknifty follwed by strikeprice and it will be shown as ’banknifty sep 19500’ ce or pe.
Thank you very much Shiva.When I type the way you have mention it narrows down to all the weekly options for the same strike price for Sep Plus the Sep month option 🙂
Hi Nithin,
Can we have spread order in Pi/Kite for Options.
Also today on 26th Aug I am unable to add 29th Sep Options in the Marketwatch in Kite.The list stops at BankNifty 1st Sep 1800 strike price whereas I wanted to trade on BankNifty 19500
Here I would like express my observations related to PI.
1) This is related to charts, its not showing up all support/resistance lines drawn and saved on reload. Which requires redraw everyday morning. Please focus on this.
2) The same in case of Charts and Chart Templates. If it is not saving, there is no fun in saving them onto the disk.
3) Other SMAs/EMAs or any other Studies are disappearing when screen is redrawn.
4) Try to add Gann related things as many as you can, I think you people know much about this GANN theory.
5) Showing last five HH/LH and LL/HL lines, which is very useful for us or else try to retain those Support or Resistance lines drawn on charts.
Thanks in advance,
Ravi
Most of the points will be addressed in next release.
A little more back data & pre-saved market watches would be great (like nifty50, sensex, auto,reality,media…… etc etc)
Goto file-> predefined workspace->NSE or BSE-> select the required predefined market watch.
thanks also checked there like 120 days 1min data this just got awesome………pi just keeps getting better
Hello Sir,
I think tools like Horizontal line, vertical line, parallel line for channelling.This 3 tools are necessary & important & it should be add in Pi.
One suggestion please update Spot Nifty & Banknifty Charts for analysis.
Hope you add this tools as it is main tools i think.
Thank you.
Mentioned tools are already there on Pi. Open chart and right click or select tools.Spot charts of indices are also available.
When you will be the new release?
Could you please include Showzone option like in kite to the indicators MACD, RSI, Stochstic momemntum in PI.
Since these are existing features in Kite, i don’t it will take much time to include in PI. Since i am software developer i know how much time it takes if things are already developed.
Currently PI does not have these features, I am mailed many times, but these features are not included. since they are already available in kite, pls add them to PI.
Are you sure these features will be added in immediate next release.?
Siddu, Pi and Kite uses different charting libraries. These are 3rd party products, so making changes typically takes time.
Thanks Nithin, but is there a plan to implement in PI, are there any indicators which does similar in PI, pls suggest.
siva cross hair values are shown in the data box but only where the candles are there if i go beyond that area it is not showing.for eg.if i draw resistance line or support line and assume that the share may hit new high or low then i have to draw a horizontal line at that point to see the price will be at that point which hasent hitted till yet.in simpel words cross hair should work even that area where there are now candles.
Will check on this possibility.
some difficulties whihc i am facing i hope other traders will alos be facing in pi
1)we cant drag the chart up and down though we can drag left and right .this is possibel in kite
2)the crosshair doesnt show the price and time when we move our mouse in chart which is possible in kite
this are the two top requirements which i think pi should update .if we login to kite for the same pi is logged of as one user cant operate pi and kite simaltaneously.
1) We are working on it.
2) Cross hair values will be displayed in databox window and the box can be moved freely.If possible will try to make it similar to kite.
3) For now at a time one can login to only one platform ie either kite or Pi.
Today I opened Pi at 3.35 PM. When I opened 5 minute chart of nifty futures current month, there was data only till yesterday. No data for today. Today is not a holiday. Why I can not see today’s data. Also this thing has happened to me earlier.
Can you do ctrl+R (reconcile) and check.
please add percentage price oscillator and Histogram( PPO) on next update it better than MACD
Point is noted, if possible will add in coming releases.
Can u add stochastic oscillator separated
Slow stochastic
Fast stochastic
Full stochastic
In pi there is no oscillator like this
Will do in coming releases.
Is there any chance of adding Germany Index to Market watch and Kite as well?
hmm.. maybe in the future. No plans as of now.
Hi,
Great going on PI!
I would like to request some features ASAP:
1. Is there a way to see the entire option chain for NIFTY and place orders from within the option chain? Bringing out each and every contract is tiresome!
2. It would be good to have the option greeks as columns for the option chain of different scripts.
3. When can we expect different preloaded standard option strategies and the ability to create and test personal strategies with a click of a button – This is a very important feature as you’d agree!
We have come a long way with PI and we should ensure that it is India’s first tool at par with ’think or swim’!
1. Currently no, but working on it.
2/3. IT will take time.
Yes Please reffer think or swim for option chain, they are the best in option.
Please add ITM probability analysis
In your indicator chart list there is no (SLOW STOCHASTIC) indicator
Plzzz add slow stochastic indicator
In our list of things to do.
Hello Sir,
Can you please comment on this? http://zerodha.com/z-connect/comment/97510
Chetan, Microsoft themselves have already dropped support for XP, I don’t think we can .
could you please include Showzone option like in kite to the indicators MACD, RSI, Stochstic momemntum in PI.
Currently PI does not have these features, I am mailed many times, but these features are not included. since they are already available in kite, pls add them to PI. I am eagerly waiting for your response.
will do in coming releases.
While installing pi its throwing error @ state Visual C++ 2008 runtime libraries.. i tried to fix it but seems not supporting on windows 8.1. Please help
As per the above query you can go to control panel and uninstall vc++ 2008 and 2010 and you are requested to follow the below given steps in which links are working
install VC++ 2008
https://www.microsoft.com/en-us/download/details.aspx?id=29
install VC++ 2010
https://www.microsoft.com/en-us/download/details.aspx?id=5555
Recently reinstalled system and re downloaded pi but the newly downloaded pi is not working properly and giving lot of errors. On other hand pi is showing latest release date of 29th July 2016 whereas here latest update is 18th July.
Latest is 29th july only, can you list the errors you are getting, you can also share a screenshot of it to [email protected] to get a fix.
Hi Nitin,
If I place a market order at 9:15 am…what will be time delay between my order placement and execution on Zerodha Pi (in seconds)? If I use the algo trading platform offered by Zerodha what will be the execution time delay if I place fire my strategy at 9:15 am…I use Zerodha , but also have Symphony algo platform…On Symphony when I start my strategy at 9:15 am…the orders get placed at 9:15:10 am and get executed in that second (i.e. 9:15:10 am)…Dunno why Symphony takes so long to execute? Will this delay occur with Zerodha if I subscribe to algo platform of zerodha for trade execution. I have cleared NCFM derivatives exam…if I want to a be Authorised person. Thanks!!
Will call you tomorrow on this.
Milind, there is usually a big queue hitting the exchanges from brokers every morning. How soon it gets executed is kind of a lottery. With us also it could take upto 10 seconds or more.
Suggest you to go through this: http://kite.trade/
Hi,
I downloaded Pi and installed it. I was expecting it to prompt me for the License Key – which I had ready on the Q window. Instead, i got asked 2 security questions for which I don’t remember the answers.
is there anyway I can either reset the answers to the security questions, or bypass having to answer security questions to log into Pi…?
You can call 080-40402020 or write to [email protected] to reset 2fa, upon confirmation you can answer and login.
Dear Zerodha,
I am unable to login into my PI. It always shows ’no response from the server’
Make sure you are not using office proxy and will send a mail to you on this.
Dear sir,
Pi terminal(market watch) if you make a provision to add option greeks….would be great help……and also if you make a provision for dragging of charts by using a mouse would a great help….
Thanks,
M.Ravikumar
As of now one can check option greeks in option calculator which is available under help menu but in coming days if possible will try to provide directly in market watch. Also I believe one can drag charts by using mouse.
WHEN WE DRAG AND DROP FOUR CHARTS IN ONE SEREEN THAT IS DONE NOW WHEN WE WANT TO REMOVE THAT AND SEE INDIVIDUAL CHARTS ONE BY ONE THEN HOW TO DO IT?????
You can again drag and drop in the center of main panel.
You cannot pop out market watch but can add multiple market watches by selecting ctrl+w.
how should i pop out market watch
With the Kite 2.0 launched, we missed one important thing is Real Date and time. The same is available in Pi in top bar however there is no such option in Kite. Other brokerage houses have real time indicator with date and time on their web login also. Please check the feasibility and add the same.
I’ll let the team know about your suggestion.
Any time frame can you pls commit…since this request is very minimal trouble to your tech guys….and this is very genuine requirement.
We are adding time soon.
Even after two months almost the requested live date and time is not reflected in Kite Web. Please consider soon.
Dear Sir,
It since almost Seven months from the date of request to add the real server date and time to Kite Web version.
please consider the same as soon as possible.
Regards
Bhushan
Bhushan,
Appreciate your efforts in helping us improved our platforms through your valuable feedbacks. Sometimes things do take longer, our team is working on making this happen. We’ll let you know once this request is accommodated.
Hi Team Zerodha,
With addition of multiple market watch, we find that we may have added the same script under various tabs in Kite Web / in various market watch. In order to add more scripts we may have to search all the market watch / tabs in kite to find whether our script is already there. Can you please add a logic so that when we are adding any script it checks the redundancy in marketwatch and informs us the marketwatch tab number in kite / message in PI that the script is already available in tab no. ……This will be helpful.
Regards
Bhushan
In case if we are selecting nifty 50 stocks in one market watch and bank nifty stocks in another market watch then for ex: sbin scrip is present in both indices list then what should happen in this case? as Pi comes with pre defined market watches this feature is not feasible in Pi. Also the same logic can be applied to kite.
Thanks Sir…for the information…But Predefined workspace is a feature available in PI whereas we can define the logic for redundancy to the stocks which we add through the drop down menu below the menu bar….we can keep the option only for these stocks….other predefined workspace we can ignore through the logic.
What if one client want to add same scrip in two different market watches? as of now one can add 250 scrips at a time and in coming days if possible we will increase this limit, redundancy should not be an issue. Anyhow one cannot add same scrip twice in single market watch.
This is a little tricky, imagine if a user wants to add the same stock on multiple market watches. Eg: I could have a Nifty MW and an IT MW, and I’d want to add Infy on both these Market watches
Hey zerodha i would like to suggest some changes in the fibonacci retracement options for pi — 1. As of now when we use the fibonacci retracement option on charts its only one directional which gives us the retracement only but if an option is introduced for the fibonacci extensions also it will be much better guess.
2. In the fibonacci retracement the lines are drawn for the values of 0% 23.6% 38.2% 50% 61.8% 100% only but if we have the values such as 76.4% 88.6% and also 128%(which gives the extension)
I think Fibos should have been customised to , inorder to have 1.618 , 2.618 , 88.6 % etc retracements and extensions .. this wud be very instead of adding 1 or 2 make is changeable …
Fib extensions will be available with customized settings in next release.
Plz add ichimoku indicator in the next release of Pi ….
will be added.
Thanx BTW is the custom pattern making option not available anymore in the pi now ?
Pre defined pattern recognition is available. Open any chart and goto Artificial Intelligence,click on pattern recognition and select required pattern.
Sir , i am using pi for trading it is excellent . in upcoming releases try to add foot print charts for order flow analysis . because now ofa is more famous in world wide . so we also need to improve our levels . Adding of Foot prints charts for ofa analysis is possible for pi in near future
Will check on this and if possible will try to implement.
Thanks for your replay . From pi platform started to till now many indicators and chart tools addings are possible . Now pi also comes to compete with other famous charting softwares . If we also improve our platform in future zerodha clients no need to go for other charting software for charting they use pi only . And many traders are also attracted to zeodha for this improved charting applications thankyou
Could you please provide the Boring Candle concept which is available only in Sharekhan Ignite Tool…
MT4 very comforting for charting PI Making Simple Things Complicated BUT NICE WORKING IN ZERODHA IN INDIA BEST TRADING SYSTEMS MAKE IMPROVEMENT NEST ADDITION AS LIKE MT4 THANKS
Can you list few points where you feel improvement is necessary? will look into those in the coming releases.
Thanks for your replay . From pi platform started to till now many indicators and chart tools addings are possible . Now pi also comes to compete with other famous charting softwares . If we also improve our platform in future zerodha clients no need to go for other charting software for charting they use pi only . And many traders are also attracted to zeodha for this improved charting applications thankyou
can i trade on super trend (generated signals) with automatic order place software
On Pi, you cannot. For more details about automation you can write to [email protected].
When are you guys including Guppy MultiMoving Average Indictor? Creating it manually is not possible due to no. of Indicator limitation in Pi.
Will be available in next release.
have been trying to install pi on my new laptop. I keep getting ”gateway erro 502” on
q.zerodha.com and cant proceed further.
It would be nice if we could download and activate PI on our new Laptops etc without
requiring login as PI security is provided by Username/Password. This will reduce the time
required for a new Laptop to get up and running. And secondly, we wont be dependent on a website
to be up and functioning.
Only for one time it is required to download Pi from the backoffice Q, after that no need to depend on any site to use Pi. Let us know if still you are not able to download Pi.
we cant drag the chart up and down as it is possible in kite.suppose the price is trading at the top right of the chart then how can one draw the resistance line ahead.pls do that its very important
Yes, this is in our list of things to do.
Want the Team Zerodha to include Ichimoku Kinko Hyo in the indicator list … Gann Fann with the adjustable fanns (angles ) is a much needed thing .. Have requested u the same a dozen of times …
If possible Gann Fann will be added in next release.
Dear Sir,
Values of the horizontal line on charts cannot be edited, only colour can be. Please provide facility to edit values so that a horizontal line can be placed exactly where it is required. Placing it using mouse with initial click is not precise. Thanks…
The requested option will be available in next release, for time being one can select it and drag the line and place where it is required.
I am getting this message when i open any chart ”unable to fetch historical chart data for INFY-EQ, only live data will be there”. I downloaded and installed https://download.microsoft.com/download/E/C/1/EC1B2340-67A0-4B87-85F0-74D987A27160/SSCERuntime-ENU.exe . Now, the chart only opens immediately after login. But if i try to open charts after a while, i get the same above mentioned error ”unable to fetch historical chart data for INFY-EQ, only live data will be there”. In earlier version a month back everything was fine. The problem started only after the update. Is there any fix for this. I am using winxp with the latest servicepack.
We believe our support team called and fixed your issue.
I was asked to upgrade to Windows 7 or use Kite. Please get a word to the developers to make it compatible in Windows xp also. Because Pi was working fine last month without any error, so maybe they need to do some minor tweak to remove that error i get in Windows xp when opening the chart after a while(10 mins after logging in to Pi). Thanks.
shree
Dear sir,
we updated Pi new verision but we see old verision , he never new verision.
Thanks
Amar
9820737951
In that case you might have user access only, login your pc as admin and do the update, it should be fine then. If not uninstall this and install again from Q.
I upgraded my RAM on my HP ALL IN ONE DESKTOP from 2 GB to 10 GB (That’s 8GB + 2GB) everything is working fine but Zerodha PI stopped working, Upon clicking nothing happens.
I uninstalled, installed but still doesn’t work.
Please help.
Will reach you on this, from next time for support related queries you can write to [email protected].
Hello everyone!
is there any way out to export the worksheet from pi to excel??
If you mean chart data then open any chart and goto chart menu and select export chart to excel.
If you are asking for link to excel option for market-watch then it is not available as of now and in next release of Pi it will be available.
yeah Im asking to export the market watch to excel and I cant add more than 50 scrips to the market watch even after enabling it to 250 in the user settings.
Only 50 per market watch is allowed, but one can create 5 different market watches(ctrl+w) taking the total of scrips to 250.
thanks for the info!
Currently no.
Also cross hair does not appear in the chart.
One can right click on chart window and select for cross hair.
Sir,
Please enable 3-5 snap quotes in Pi.
If possible will do in coming releases.
by stiched in contracts, I mean continous future contracts like zincmini…where the volume comes in the month of their expiry only, which makes them tradable at that time only.
Sure, in our top list of things to do.
Please provide Continuous Contracts Charts for MCX, Zerodha is loosing clients for MCX. I want to use tradescript but is not practical since charts are not continuous charts. Please help.
Shivendra we are working on it and continuous charts for commodities should be available soon.
Nitin,
Please do something for MCX commodity futures, right now we can not use Pi since it does not offer chart functionalities for stiched in future contracts, for which we have to go with investing.com or any other ready made source. Without this feature we can not use pi for commodity contracts. Pls conisder this in your next update.
Thanks,
In Pi when we add study RSI there are no horizontal line at 30/70 or 40/60 which is very necessary to know for overbought/oversold zone. And if we add horizontal line from tools it is not coming perfect.
Will be available in next release of Pi.
Hi Zerodha Team ,
Is it possible to set alerts for change in Parabolic SAR direction using Pi .
Thanks & Regards
Darshan M
Hi Zerodha.,
Why am not able login in to PI, it is showing MSG_FAILURE error, Is this common error with PI or occasional Error ??
Regards
Rajesh G.
Can you try now.
Put order req received…….Means?
First time i face so much problem till Pi first released.
3 BO seen that masses/ 1 BO steel pending.Your support team
told It will update earlier next trading day.
Regards
Susanta Bala (DS3412)
Put order request will show if any disconnection to internet has happened. If still facing any issue on Pi, please let us know.
when i fully zoom out the chart and draw lines in pi and then i zoom in the chart for intra day or say to 5 to 6 days chart all the lines drawn in fully zoom in desapires and then when i again fully zoom out the chart the lines drawn in chart are seen .i thing this is major drawback in pi .but there is no such problem in kite.
It is not any drawback and that is how it should work, if one draws horizontal lines when it’s fully zoomed out then obviously when selected for few days those line won’t be displayed because the values on left side will be changed now, if you want more clarification on this kindly write to [email protected].
hello nitin pls arrange the pi charts to drag down and up as we can do in kite
In our list of things to do.
Can you also introduce trailing stop loss for Cover order which is presently available only for Bracket Order?
If possible will provide , one can use BO for time being.
It’s a vendor product, it’ll be difficult to accommodate this request in the immediate future. We’ll pass on your feedback though.
When my wifi internet goes down from A service provider i switch to B wifi on my laptop from the drop down list . I have noticed that post switching from A TO B — Pi does not accept BUY -SELL / display orders even after Reconcile .Is this because Pi latches on to a specific IP address and is not flexible midway . I am sure there can be a resolution to this.
This does not happen with my other 3 trading / software platforms . Can you please look into this . The reason being i have logout & relogin and i make errors in trading at crucial times.
yes. switching between networks might be causing issue
we will come up with some resolution in future Pi releases
When viering charts for 1Y or less, it does not allow to add 200/300 DMA (Moving Avg) as it says its invalid. However it should as in technical analysis any stock moving below 200 EMA is not worth a buy for medium term. Kindly remove the limitation
The moving average is plotted based on the candles on a chart. If there are less than 200 candles, it won’t be possible to show a 200 day average. Do open a higher timeframe chart for seeing a 200/300 moving average.
Please help clarify. I am sorry for placing this question here.
Bracket Order : Step 2: Place a Target/Square off by choosing either Ticks or Absolute.
Ticks, 1 Tick = 0.05 for Nifty, so 20 ticks means 1 point on Nifty, 200 ticks is 10 points on Nifty.
a)For Example If i am buying SBIN Futures @ 230 and i want to use Bracket order for Stop Loss . My question is how can i place a Stop loss order of 229.90 ? . Absoulute or Ticks ? what figure do i input in . Also need to know LTP OR ATP?
b) Will the sequence be followed ie BUY and then SELL Stop Loss in an event the price moves down ?.
If the price moves up i have to manually place a higher sell order .
1. You can mention absolute value. But on BO, minimum absolute value is 1 or 20 ticks. So if SL u want to be at 228.9, you can mention 1.1 in absolute value.
2. Yes it will. Also on a BO you can place an exit selling order. Check this.
Some observations :
a) Three Line break does not have edit function to change the time frame form 3 to 1 or 2 . One has to change allover again.Maybe some time in future you may like to work on the Edit function of Three Line break in one of your updates.
b)I am using NT7 and it makes a difference with lower than a 1 min time frame.Some indicators work best on tick / 10-20-30 seconds and not on a minute frame. I have been comparing both PI with NT on different time frames and that was my observation.
dear sir
unbiliveble sirvice..kal hi mene complen likhhi or subah subah me hi mare prob.. solve kar diya…thanks thank you very much…mera pi ka kite ka softwear ka prob. solve ho gaya he..or b bahot si jankari b mili …once again tnx……
Please add refresh of chart in PI ,close and open different bar by bar ,always need to close and open the chart for perfect chart.
Nothing as such but anyhow you can change the timeframe on tool bar and check which is as good as opening the chart again.
While Squaring off from the admin position window i am looking for three option Order their:
1.Square off at market price (Which already exist).
2.Square off at LTP (Last traded price at that point of time is executed fine otherwise it should be converted to limit order.
3.Part Square off option of the total position in a particular instrument. eg. squaring of 30 lots out of 100 lots position.
Above mentioned 3 points are already available in Admin position window of Pi.
Dear Nitin,
While trading weekly nifty on Pi i observed that even if i order for weekly expiry contract the trade takes place in monthly expiry contract (with very different price & liquidity.) Can we some how correct this. or at least dont execute the trade.
You might be using very older version of Pi, can you check in About zerodha Pi under help menu and the date should be showing as 29/07/2016.
While all other brokers complete their equities posting by 4.30pm derivatives by 5.30pm and CD by 6.15pm and we receive the Exchange messages also, where as at ZERODHA it is surprising to note that Back office is not updated until 9pm every day and contract note is sent during midnight this is not at all good practice??
hi
when a chart order is placed on chart, a ( arrow ) is showing to edit or close the orders , when the time passes this arrow is also moving towards the end . if a [ X ] is place on the vertical price bar, then it will be helpful to edit or close
thank you.
We want to display price instead time of the order placed,one has to search for that vertical bar if they want to close or modify the order after sometime. Also if many orders were placed it would be difficult to track on same chart.
Sir i forgotten transaction password so i change login password but pi is not asking for transaction password..how to solve it??
Murugesh, we have recently remove txn password requirement across all our platforms.
Sir,
I am able on Ammy Admin for following problem :-
User Id : RA0090
Whenever I apply Expert Advisor in PI software, the concerned chart freezes on a number of times. The same starts running when I click on double click on quotes . Please look into this technical error.
We will reach you but from next time please write to [email protected] for any support related queries.
Dear Nithin,
I’m an existing customer of Zerodha and I feel a great need of
1. Include Ichimoku Cloud in PI.
2. Please enable a feature like demo/practice account with zerodha (kite/PI). This will help us greatly to try our strategies before going live.
Eagerly looking for your reply & waiting for these 2 features.
1) Ichimoku Cloud will be added in next release.
2) In our list of things to do.
I want to use expert advise in Pi. I want to use super-trend indicator and EMA on five minute chart as EA in Pi.
kindly suggest me how to code them.
Supertrend indicator cannot be coded using tradescript as it is not a builtin indicator. For more on coding related you can navigate through http://tradingqna.com/.
User Id : RR3193
Whenever I apply Expert Advisor in PI software, the concerned chart freezes on a number of times. The same starts running when I click on double click on quotes . Please look into this technical error.
Can you kindly write to [email protected] on this.
Hi Zerodha Team.,
One request Zerodha, can you please implement Elliot Wave Indicator in Pi.
This request may not be accepted, anyhow my humble requesting. Thanks
It will be considered for next release.
User Id : RA0090
Whenever I apply Expert Advisor in PI software, the concerned chart freezes on a number of times. The same starts running when I click on double click on quotes . Please look into this technical error.
Will reach you on this.
Hi Zerodha Team.,
Your entire team has created an awesome trading platform for retail traders in India.
1. Is it possible to implement real time Options Greek calculations on Pi ?? i.e Delta, theta, gamma, vega at strike level.
2. SMS alert for order execution on the registered mob number.
3. Is there any way to ”connect Pi to Excel” for real time data fetcher, if it not possible when we would get this function.
1. For now you can use option calculator(ctrl+o) available on pi to check on option greeks.
2. Only if order is placed through call and trade facility.
3.Not available as of now but will be available in next release.
when will bracket order be available for currency options ?
we are not able to save the new market watch?
Currency options can be illiquid, so most likely not. Marketwatch saves automatically.
I am unable to open chart after new upgrade and showing message as Unable to fetch historical data.
Kindly provide me resolution.
Please find below link for screenshot
https://postimg.org/image/ibkewzd9j/
Please follow the below given steps
1. download the microsoft fix from below link
https://download.microsoft.com/download/E/C/1/EC1B2340-67A0-4B87-85F0-74D987A27160/SSCERuntime-ENU.exe
2. extract the files on desktop and install both extracted softwares
If still the issue is not fixed kindly write to [email protected]
Thank you, now i am able to see charts
when I try to open chart for periodicity- minute, interval- 5 min, days- 2, then it shows only intraday chart from 9.15 AM. so please solve my problem..
2 days means not two trading days but two calendar days, as previous two days were off you are getting only from this morning. You can select days as 5 instead 2.
ok.. thanks..
Hi. After the update of latest version of pi. every time i enter pi it ask for a update. plz fix this issue
Make sure you have logged in as Admin instead user and then update Pi.
I did it but app frequently freeze’s everytime i try to open a chart.
how to connect pi to excel
As of now it is not possible.
Other brokers has come up with an idea to trade from MS Excel directly which seems very easy and making fast entry. Any clue when Zerodha would start ?
This would be a great idea and profitable.
Hi Team,
I am facing an issue while using Zerodha Pi and linking live data to excel. The linking and live data flow is working fine but whenever I add a new script to the Pi window it doesn’t auto reflect in my excel. I don’t want to relink the excel repeatedly as that way I’ll get a new excel every time. Is there a way that my excel sheet automatically updates whenever I add a new script.
Hey,
Good job on bringing us newer updates so swiftly, here’s a small list of my wishes for your consideration.
– Please make charts prettier & smoother like in the Kite version
– Kindly give the option to work with stop loss and trailing stop loss once we place order (please try MT4 SL)
– Integration with MT4 via bridge (pleaaaaaaaaaseeeeeeeeeeeeeeeeeeeeeeeeeeee)
– There can be a simple password entry to log in right? why multiple choice questions even on desktop platform.. isn’t the IP address enough?
Integration with MT4 is not possible as MT4 won’t allow it.
1. Doesn’t it already look nice 🙂
2. You can use the Bracket order option to place Sl/TSL orders.
3. Isn’t possible because of the way MT is built.
4. 2FA is a SEBI requirement. We no longer ask for Transaction passwords, so that’s one less password for you to remember 🙂
Mr Nithin,
What is the following article speaking about please explain??
http://economictimes.indiatimes.com/markets/stocks/news/central-kyc-to-hit-new-equity-commodity-investors-from-august 1/articleshow/53477415.cms
CKYC was proposed by Pranab Mukherjee in the budget of 2012. The implementation seeks to bring in a common KYC to the entire BFSI sector which means that if you open a Bank account and then some days later intend to open a trading account with a broker, you need not submit the KYC documents all over again making things easier to the end client.
Like Default market watch, we may have holding and positions market watch automatically so it will be easy to monitor it in market watch way or charting way…
I don’t know this feature is already there in pi or not but want to draw attention of developers to put buy sell and sl lines on the charts if we traded in that particular script. Say sbi chart is open and i have shorted/long on sbi, my trade line should be displayed on chart so that i can visualize my trade on chart; although in past that lines should be draggable so that my target and sl can be changed just by dragging that lines !!!
Although it is there with other forex softwares where we can trade just on say any indicator say 10 period moving average, buy on close above it and sell on close below it…Just my views to be implemented and almost all does it only one will do…till then all will wage hands…
We’ll pass on your feedback to our developers. If you’ve placed an order from the charts, the buy/sell order shows up as a line on the chart.
Hi,
We can draw rectangle in pi. Can we fill rectangle with some colour. It would be helpful to draw supply and demand zones in the chart
One can increase the thickness of rectangle and give any color by double clicking on it so that to give distinct visualization.
hi zerodha team,
can we see the kite default chart type (line chart) in PI ?
Thank you.
Not currently possible.
the latest update released yesterday has removed all the additions of indicators released on 18th july
Nothing as such,can you verify the date in About zerodhaPi under help menu, it should be 29/07/2016, if still not able to find indicators can let us know.
The date is 29/07/2016. Further chart is hanging after introduction of any indicator.
I have a query, Supposr If i give zerodha the POA (Power of attorney) of other Demat account, wiill it be possible to map that account to zerodha trading account for selling the holding from that account without doing any off market transfers to zerodha demat account???
Let Mr.Nithin Kamath answer this question..
I have a query, Supposr If i give zerodha the POA (Power of attorney) of other Demat account, wiill it be possible to map that account to zerodha trading account for selling the holding from that account without doing any off market transfers to zerodha demat account???
Let Mr.Nithin Kamar answer this question..
Technically yes, but practically no. Even if you give a POA to your other demat, the other broker won’t give us an interface to debit shares.
Mr.Nithin,Why dont take the initiative and talk to Depositories and may be with SEBI also for portability of demat as well as trading accpounts,account, in order to reduce redundancy data and ease of doing bussiness..as well smooth migration of clients like we see in portability in telecom…
We have taken this up multiple times, doesn’t look like it is something that will happen soon.
Dear Sir,
Is Nest outdated now? Is pi replacement for Nest?
Thank you.
Yes Pi is our in house replacement.
Thanks, the latest release is not running. It hangs, have contacted support for the same.
a) SBIN no data after 27th in BSE ,any reasons , same for Reliance in BSE in Pi havent checked in Kite yet
Can you do ctrl+R( reconcile) and try to open chart again and check.
nope still not showing ….tried logging out . Kite is showing 29th but not in PI
happened now ok
kindly provide open intrest indicator and OI % change in marcket watch .
In our list of things to do.
Hello,
Two factor authentication to login will continue, as it is mandated by the exchanges.
One of my friend have ICICI trading account.. and there is no Two factor authentication to login.
Any clue, how ICICI have achieved this.
They might be asking for DOB or PAN while logging in, instead of these questions.
After the new updates installation nifty chart data’s are not updating properly.
For eg) In the evening if i am opening the chart its getting plotted till yesterday only(Today’s data is missing) and sometimes yesterday’s data is missing. Kindly check & fix the issue.
Can you do ctrl+R( reconcile) and try to open chart again and check.
Vasanth we have released a new update yesterday evening, can u try now. Click on check for updates under help on Pi. If still facing issue, can you email [email protected]
I’ve been using Pi , but today I see an isssue. All the buy and sell option are not working. Buy, Sell, CO and BO are not responding. I’m using latest version of Pi v 1.0.0.6
please help me to trace the issue
Thanks,
Jinu
Can you update to new version dated 29/07/2016 and check.
PLZ ADD camarillapivot lines. LINE CHART IN PI
Points were noted.
sir, plz give intraday open,high,low,p close,n %of change on chart.is it possible (it is available now in data box)
If possible will try to give this as an option.
I am unable to find “Supertrend” indicator in latest version of Pi.
Can you check in About Zerodha Pi under help menu for the date, it should be 18/07/2016. Then goto study and type s and you can see supertrend indicator.
Hi zerodha team,
Good day,
Nice updates. One small problem on this updated release on snapquote window. %change open interest indicate always ”0” not changing. Please rectify the error.
Thanks in advance.
Will look in to it.
one more question . pi is not responding after authentication ,when i log in.i have installed and uninstalled it for 3-4 times.what could be the problem?
It can be of any reason, if you can write to [email protected] you can get a quick fix.
Can you try running the application as Admin? Right click on Pi and select ’Run as Admin’.
sir , when i download my contract note(combined), nothing is displayed on the first page.only second page with charges is displayed.why so?
Are you viewing the contract note on Adobe reader?
yes…I am viewing it on Adobe reader..
There is not any improvement in RENKO type charts, still studies ate not showing fine. Not expected. Each update ignore about RENKO.
We have prioritized working on popular requests but soon will be working around RENKO also.
Even an ordinary desktop trading software NSE NOW offering basket order facility and you guys call your pi software based on nest platform as the comprehensive software but their is way one can do basket trading…
Whereas lot of promises are made on this blog about the future releases please be very carefull before promising them..on a public forum…
It is in our list of things to do, but will take more time.
How can i adjust time frame i.e. if i want 30 min candle in which 1st candle should be between 09:15 to 09:30 and rest all from 09:30-10:00 and like wise till 03:30.
Currently you can’t adjust this.
hi
when can we expect a very important feature (which a lot of trading platforms offer) which is having a real time box showing us our open positions profit and loss tick by tick(with/without brokerage added) as we execute orders.
donovan
With out adjustment for any brokerages you can check your m2m now in admin positions(F11).
Dear sir,
Ref: client id PR1241.
I am using kite software for my trading. First, I thank you for removing the transaction password, which affects the very first order entry.
In the kite dashboard, I like to mention 2 suggestions.
Currently, for every tick, both the script name & LTP change colors simultaneously. Except LTP, the script name must show, either red or green permanently, in relation to its corresponding P.CLOSE. The existing system creates confusion, at a very first look.
Secondly, the percentage difference can be change to price difference, which gives a quick and clear idea about the trend. In relation to its corresponding P.CLOSE.
Hoping, a change in the dash board shortly,
With regards,
Ramesh kumar
Hi,
There is problem with ”Price Relative” technical indicator, it does not work.
There is no such indicator yet on Pi.
It is on kite
Please add Regression channel indicator to Pi / Kite .It works amazing in Live trading to make good decisions.
NTrader+Zerodha+TrueData is a good combination. I hope PI/ Kite could consider adding some Volume Profile Indicators.
Could you also consider adding Candlestick pattern recognition Indicator like in NTrader . i know its there in PI Scanner but in Live trading it would work amazing as a indicator . Morning Star / Evening Star to begin with.
If possible will add in coming releases.
Hi Zerodha team
Thank you so much for adding the feature of multiple marketwatch. This completes Pi for me.
Fonts of Price, Data window, Date/Time etc on CHARTS are very small and there is no facility to change it please make little bigger fonts for CHARTS, its very trouble for peoples with specks like me.
Will give option in coming releases.
Pi stops responding while opening Snap Quote sometimes. Have to force close software and restart to make it work. Please resolve it asap.
Are you using this latest version? Am using 1.0.0.6 (30May16), that doesn’t freeze on clicking SQuote but on Cash positions only. Probably, if at all you prefer, you can use that prior version till they fix it, as we use SQ more often than Cash Position
I have already mentioned. I am using latest version 1.0.06 (07/18/2016).
It doesn’t freeze always but sometimes while opening SnapQoute.
K, Cool. Then i will skip the latest version (18Jul16) till fixes are avlbl for above reported issues esp freezes!
Tool like Trendline, vertical line, etc. disappear from the charts on exit and we have plot the same again every time we exit, actually one the tools applied should stay there unless user delete the same from the chart. Please do some thing so that they stay there.
Hi Paresh,
I am also a client of Z but till the time you get to hear, let me try to address your concerns
1) Guess you mean channels drawn for trend analysis? – If Yes, it will be good to have but did you chk if it’s already incorporated part of ”Save chart template” or ”Save Chart” option to rework later, i will also check it now. -> This they might have ignored for storage space needs but i guess they can consider storing them in client side to overcome this issue (as in trading view++)…
2) One of the cool features is ”tech indicators” used regularly can be stored part of ”Save Chart Template” option which is a big time saver. Yes 1) is a good to have feature, time saver again
You’re right, Just tried to see if ”Save Chart” option has it but seems NOT there as of now!
Appreciate inclusion of ATR& Limit Option for Cover order buy/sell!
Yeah, agree with Durai on some critical issues faced! Here are some of the issues that needs quick fix!
1) Charts don’t load at all, this is now happening very often after prior 2 updates! (Major issue-P1)
2) Also, can’t include 100EMAs or above, popup cribs pointing can’t do even though you have selected option 6 months on daily chart! Really cumbersome as we get the need to verify for bigger periods but not able to go beyond just 50. -> ((Major issue/P2 or P1 as this will have to bug or enhancement, will need some time to fix).
3) Freezes way often on clicking ”Cash Position” option to know the margins available, before/after completed trades! – Only option is to restart the application or wait for too long, by when new good trade chances are lost. – (Critical-P1 issue,, show stopper)
4) Stochastic shows different values on tick (min) chart (same instance of it kept opened) but on zoom in /zoom out of charts for clarity since def is small, it will show different values (irrelevant massive wrong values too like %D = 19520 & %k=-70.59 BUT on putting it to default on same instance of chart opened the same moment will show %D=400 %K=46.98 – making it cumbersome for any decisions
5) OBV is not drawn on the Chart as in PSAR (P3 -Enhancement/bug as you want to classify)
6) Pls provide ISCHIMOKU cloud too in forthcoming releases! (P3/P4 – Enhancement)
7) Brokers (discount) of my friends are providing Bracket Order Option, pls check as MCX seems allowing it already as they are using it regularly (P3/P4 – Enhancement)
8) Sell volume showing up on buy and buy volume shown on Sell but at times ( i have snapshots of the same, can share over email if needed) -(P1 Show stopper)
Adding two more
9) Market order gets executed with delay of 30secs to 1min aft placement of order …By then, the prices change drastically leading to considerable losses/wait time to recover..It happened yesterday too.. pls check and fix it to reduce latency (am using ACT with ”uber cool” bandwidth)
10)
Adding two more
9) Market order gets executed with delay of 30secs to 1min aft placement of order …By then, the prices change drastically leading to considerable losses/wait time to recover..It happened yesterday too.. pls check and fix it to reduce latency (am using ACT with ”uber cool” bandwidth) – (P1/Major issue)
10) Include feature to change individual parameter settings for top/bottom Bollinger bands
Will reach you for points 1 and 3 as there might be because of some issue while updation.
Point 2 can be resolved if you can open data for more than 6 months,as there might be no enough candles for the indicators to be drawn.
OBV is normally applied as a separate indicator but not as an overlay.
Bracket orders are not provided by anyone in India for MCX on retail platforms as it is not allowed, but few might be offering only call and trade service.
Adding Ischimoku cloud is our list of things to do.
Sell volume, buy volume by this you mean volume on red candle and volume on green candle, if you find any difference you can write to me @ [email protected], as per my knowledge there is no such difference but if you can share the screen shot we will work to fix it.
In my office, Internet connection is via a proxy. PI tool doesn’t connect, from office.
Could you please enable proxy connection support, in PI tool?
You can write to [email protected] asking for required ports for Pi and you can add them in your proxy settings.
Also please add Fibonacci projection tool.
Will do.
Why you are not adding Ichimoku indicator in Pi, the same is available in Kite? It is so useful.
In our list of things to do.
Need fibonacci extension tool with retracement + editable fibs value.
In our list of things to do.
sir,
we are eagerly waiting for ichimoku indicator in pi…
Will be added in coming releases.
Hi,
Recently , I have upgraded my O.S. from windows 7 to windows 10. After upgradation , I am unable to run Pi. Pls. guide me to run Pi .
Thanks
Ideally it shouldn’t be a problem, can you please write to [email protected] on this.
in this latest version why can I do MW window as pop out. it was one of the best feture pi had. please include it again
Will definitely consider your point, for time being you can drag it and arrange where-ever you want, also can add 5 market watches at a time.
Even an ordinary desktop trading software NSE NOW offering basket order facility and you guys call your pi software based on nest platform as the comprehensive software but their is way one can do basket trading…
Whereas lot of promises are made on this blog about the future releases please be very carefull before promising them..on a public forum…
Hi Siva,
As you guys start fixing the problems in Pi, kindly take a note of the following …nothing earth shattering but need to be fixed.
1) There is some inconsistency in the way multiple MW screens load –
a) the MW I have created always loads as ”Default MW” …but the name I have given is ws1 (as it appears in the workspace folder. No issues on the the naming, but quite frequently it does not accept any any inputs, like addition/deletion of scrips, rearrange of columns and even placement of buy/sell orders. But screen is getting refreshed with the latest prices, volume etc. I think this happens when multiple MWs are open. But when I open a new MW and load the same ”ws1” from the workspace folder, it behaves fine.
b) This Default MW, I am not able to close whereas all other MWs I can open / close as desired.
c) As I have indicated earlier, the layouts are not the same as what have stored in workspace. The columns get jumbled up needing to rearrange once again. Here again there is some inconsistency – when previously saved MWs – eg. 3 of them were open when I logged out of Pi, the same 3 open on next log in but the layouts are changed.
I think I can find some more issues like this…will continue later today as I have to go now. In the mean time if you want me clarify, give more inputs to substantiate the problems etc., pl let me know.
I may need few clarifications on this, will call you tomorrow on this.
Hi,
It seems there is bug in Pi. We can not add Nifty/Bank Nifty indices in latest Pi version. There is only Nifty PSE indices exists, no drgdown option available.
Also I have already raised flaws in Pi – We can not move charts up/down side.
Major bug in Support & Resistance, actually it should be flexible with charts.
When you apply M.A (ex. simple) and you want to change it to exponential or Weighted M.A, you can change it but the description will be the same M.A i.e – Simple
In last conversation, Nithin replied these things are on to do list.
I hope you will address these concerns asap .
Can you write to [email protected] on this as we can add nifty and banknifty indices on Pi, you can get a fix on that.
We provide support and resistance points based on previous day values only.
Other things are in our list of things to do and will take sometime.
Not again Siva, to write [email protected], is quite hectic. 2 months ago, I raised same points to support team and the agreed these flaws , i dont think so these is corrective action on this, to encounter this, I wrote on Pi platform and it was addressed by Nithin. but still same result.
For Support & resistance, am trying to say – as per the Kite, Charts can be moved in up/down, right/left direction with movable S & R in Pi, which we can not see S3 levels until it breaks S2. Its difficult to take positions on S3 levels as you can not see it.
I hope you understand, what am trying to say…
Thanks….
I am asking to write to support for the issue you are facing for not able to add nifty and banknifty.
You can also try uninstalling it and installing again from Q to get your issue fixed.
Hi, I have updated Pi yesterday( 26.07.16). After updating I have change the setting for marketwatch script from 50 to 250 . But still now, I can’t add more than 50 scripts in a single market watch .
Pleae help .
In single market watch only 50 can be added, you can open new market watch by going to file-> create new market watch or by doing ctrl+w and add another 50, and upto 5 market watches are allowed.
Hi,
Why limit the market watch to only 5,both in kite and pI?.Please add more marketwatch
Sir pls add Bracket Order SL Buy, SL Sell options..
If possible will try to add, but will take more time.
hi sir..
forget transaction password how to reset transaction password in pi…
We have taken out transaction password on Pi and on all our platforms, if you are using Pi kindly make sure the used version is dated 18/07/2016, if not goto check for updates under help menu and update to latest version.
THANX……SOLVED…
I have updated to the latest version, yet when I place an order, the software opens up the Transaction Password window.
I’ve uninstalled PI, re-downloaded and still the same problem
Hi Nithin,
Could you please provide more features in trading from the chart section. What I am asking is when we invoke floating order window from a chart by pressing F1or F2 , it would be helpful if that order window can show additional info like order details, position details ,P&L of the scrip that is opened in the chart. In this way it will be helpful for scalpers so that they can buy,sell, modify order and view P&L in real time without leaving the chart.
Thanks,
Manoj
Point is noted,if possible will try to provide in coming releases of Pi.
hi,
latest PI update looks superb, but i got a little problem. I used to watch the market during opening hours (say 9-10) and take my position,set stop loss and log off. later after some hours i will logon again and follow up with my position. my problem is that after the update if i logoff at 9.45 and login again at 11 and open 5 minute chart i will get the current bar and previous bar of 9.45 . all the bars in between is missing. this happens all the time. could you please check in to this and suggest a solution. thanks in advance,
with regards,
SHAFIN B P
Ideally it should not happen, can you uninstall and install again from Q, even after that the same issue persists you can message here or can write to [email protected].
HI,
Tried reinstalling PI from Q, but no change. Today when i opened RCOM 5 minute chart till now the last bar is from yesterday (3.25 PM). Whatever change happens today is shown in a single bar. Its really annoying as i trade based on chart patterns. hope to get a solution soon.
with regards,
SHAFIN B P
The same is happening in my Office computer and my home PC.
Will reach you on this.
When Pi hangs (not responding). CTRL+R (as suggested by you y’day) also does not work,
I have opened 3 Market Watch screens with a total of less than 50 scrips. I was trying to add another Market Watch screen and that is when the problem happened.
If you need any other details pl let me know.
Will reach you on this.
Can have pre calculated Implied Volatility, Delta, Vega, Gamma column. Calculating Greek using option calculator it’s time consumption matter.
In our list of things to do.
hi,
latest PI update looks superb, but i got a little problem. I used to watch the market during opening hours (say 9-10) and take my position,set stop loss and log off. later after some hours i will logon again and follow up with my position. my problem is that after the update if i logoff at 9.45 and login again at 11 and open 5 minute chart i will get the current bar and previous bar of 9.45 . all the bars in between is missing. this happens all the time. could you please check in to this and suggest a solution. thanks in advance,
with regards,
SHAFIN B P
Dear Nitin,
Do you have tie-up with Globalfeed who hold monopoly in the market or do you know any other player providing real-time data feed?
There are brokers who have alliance with them and provide cost benefit to their customers.
Regards
Ananda Krishnan
You can try truedata.in, they also have a special deal for Zerodha clients.
Nitin ,
I have just subscribed to True Data and the feed is good and affordable . The sense i get is data feed / tick by tick without a good front end is of no use , But yes i think seconds timeframe is a good feature. Do you think it would be a good idea to introduce 30 seconds and above timeframe charts in PI ?
We already provide one minute time interval and above in our platforms, unless one is doing high frequency trading seconds data is of not much use for retailers as it consists of more noise.
Hmm.. these requirements are endless. If we do 30, someone will want 20. Keeping OHLC for these candles does put a stress on the database.
Nitin / Siva
I have always said good things come at premium . See if you consider starting a premium service within Pi/Kite as a option where you can provide your customers with indicators / Seconds time frame only for a extra fee. We anyways are paying for other software’s in addition to PI so why not have everything in one place.
Thanks for the reply.
Anand
Is TrueData.in an authorized data vendor of NSE? I do not see their name in the list – https://www.nseindia.com/content/press/List_data_Vendors.pdf?
Dear Nitin,
Kindly introduce on screen value manipulation e.g. moving the stop loss line once the SL or SL-M has been fired. Appreciate your attention to this.
Regards
Ananda Krishnan
Dear Nitin,
Is there a way to adapt amibroker afl into pi. This will greatly solve our problems of going for additional datafeeds from the market which are not at all reliable or are too costly.
Appreciate if you can look at it.
Regards
Ananda Krishnan
If it is complex strategies, Pi can’t handle it.
Thanks for the reply.
Anand
Hi,
I have a problem in me that I am able to notice only down trends (may be I am a pessimist, expecting market to fall). I think, (as a special function for people who are able to notice only downward lines) you could show uptrend as down trend, and down trend as uptrend (like a toggle) (when the medium to long term cycle is uptrend) so that we pessimist in viewing the lines, can also capture uptrends.
This request might look absurd. But still please have a thought about it.
Thanks.
Sure, will look in to it.
Hi Nithin
Issue regarding viewing Indicies in Market Watch.
Support says client can view the indicies in Market watch only if we have demat a/c.
I am allowed to do intraday equity, but am not allowed to add spot indicies in market watch, which anyway cannot be traded. Kindly rectify the issue.
Sriram
Nse doesn’t allow us to show spot Indices with only trading account, demat is needed.
But I was able to view spot indices before this update.
Hi,
Congratulations and thanks a pile for the new release of Pi with multiple Market watch panels.
Some issues with the new Pi version:
a) Looks a little unstable, like… On a Pentium Dual Core 2.6 GHz CPU with 2 GB Memory, running WIn 7 Ultimate (legal) version, when I open 3-4 Market watch panels (each having not more than 15 entries (Scrips and F&O data), when I move out of Pi to visit Moneycontrol, ET etc and come back, I get a Pi ”not responding” message (on top of the screen) and many times it hangs and sometimes after 5 mins or so it responds with a refresh. This was not the case with the earlier version though I have simultaneously used Sharekhan & IIFL along with Pi.
b) When I have created multiple panels of Market Watch and stored then with different labels and have used, let me say, 3 out of 5 panels in a day, when I open it the next day those 3 panels stay, which is ok. But when I want to load a different panel (out of what I have already stored), I have to create a new panel (Ctrl+M) it is asking for name for the new panel, then it creates a panel on to which I can load the panel I have stored. Frankly I think you should change the implementation by providing a Drop Box of already saved panels..it will be less cumbersome.
c) The Indices displayed in Market Watch tend to Stay On…. When I move out of Pi then hang on to the screen which is quite irksome.
d) When format the Market Watch panels by re-arranging columns and even after saving them on exiting Pi, I don;t get them in the same order. It is so haphazard there seems to be no pattern there. Apart from fixing this, provision for a universal layout for multiple panels could be very useful,
Hope this is taken positively and attempts made to fix these ASAP.
Thanks & Regards……… Rajan
1) Can you check tomorrow also and if the same repeats kindly let us know during the market hours, will reach you and look into the issue, you can message here itself or write to [email protected].
2) If possible will try to provide this in coming releases.
3) You can minimize Pi, by doing so index bar will also be minimized.
4) You can goto view->user setting->market watch-> and select save layout on exit and apply, it should fix your issue.
Thanks for the response and the follow-up call…really appreciate the gesture.
Yes, Minimizing Pi, Index bar also gets minimized…But just on switch over out of Pi (without minimizing Pi) would be very helpful.
About the layout…I have given Save on Exit. It is getting saved and next time when I log into Pi again, there is a need to Load from Workspace to get the layout I have saved. Though Pi opens with all the multiple Market Watch screens that were open earlier, the layouts are not the one I have saved…small manual effort needed…would be better to have been fixed thru the software.
When Pi hangs (not responding). CTRL+R (as suggested by you y’day) also does not work,
I have opened 3 Market Watch screens with a total of less than 50 scrips. I was trying to add another Market Watch screen and that is when the problem happened.
If you need any other details pl let me know.
ORDER BOOK SHORTCUTS WORKING ONLY WHEN THE CURSOR ON THE ORDERBOOK TAB.
We believe that is how it should be,there is no issue with that.
if i want to modify, cancel or exit the order what the use of this shortcuts.i go for search order tab or press f3
whats the use of shortcut keys
If one has more than 1 pending order, for example take 3 and if one uses shortcut to modify then which order window should open? One has to select that particular order which is needed any change.
YES! ! THNQ FOR QUICK RESPONCE
sir, set indices in one line(toolbar), is any chance to change INDICES FONT SIZE AND COLOR.
Will give option in next release.
hi
can we see pivot lines for today and last 2 days on charts at a time in future its useful in trading pivots
thanks
It is not possible.
Sir,
can you pls. add relative strength comparative indicator. It is present in Metastock.
In our list of things to do.
is it done (Relative strength comparative).
kindly provide candlestick time frame in multiple of 1 minutes just like in falcon, Iris, Trade Tiger and Orion lite.
We do provide candlesticks of 1 min interval. One can do sfift+c on selected scrip and select minute and interval as 1.
currently Zerodha is providing default time frames like 1,2,5,15,30,60 minutes in intra day. If i want to open 40 or 180 minutes time frame candlestick,currently is not available on Pi.
What is the main differences between NOW, ZT, NEST PLUS and PI standalo trading softwares???
Do Zerodha provide them all???
NOW, ZT, NEST are essentially all the same. NOW is offered by NSE. We have stopped supporting NOW. ZT/NEST available.
Pi is a much more advanced desktop version.
Want to find if your PI standalone exe based trading software is supported by Mac ios Yosemite???
No
Can we hope for pi working on mac in near term? (not using virtual machine)
Doubt it Pradeep
Just noticed that AXISBANK Jul fut , the candles only till 21 is loading. 22 friday is missing. Other charts it is loading fine.
Nothing as such, its fine, if still you can’t able to see it can you please share a screen shot to [email protected].
I am not able to login in from this morning after updating Pi.
the error says” Error: The Remoteserver returned an error: (503) Server unable”
please solve the issue
Maintenance activity is scheduled for an hour at that time, can you please check now.
dear Nitin sir,
i want to know that what i have to do to start trading nifty is there any service provided by u to trade in nifty. Please help to resolve the problem.
with warm regards
ashutosh verma
Ashutosh, your account should be pre enabled to trade on Nifty. If you are looking at learning more on futures and options, check this: http://zerodha.com/varsity/module/futures-trading/
Can you pls add open interest as a indicator/study. Also I m unable to extend the trendline pls advise
If possible will try to add in coming releases.
I don’t have to much cash so Bracket Order is my only option for trading in future.
I place future order based on the spot price so due to no option of placing SL-M order type, I miss out the opportunity to enter the trade at the price I want.For such reason I force to enter at a level 0.50 to 0.60 paisa above my desire buying price and this resulting to loss or less profit.
So my request is to add the SL-M option in Bracket Order without SL-M facility it’s completely useless.
It is in our list of things to provide, still to mention sl-m orders are no guarantee to enter at predetermined fixed prices as once the trigger is hit order can trade at any best available price which might be much higher than trigger.
Siva I didn’t get your point as when I am placing SL-M order type with correspondent to NRML or MIS it work out fine most of the time so why no orders guarantee at my price during Bracket Order type.
Hi Siva, Nikhil,
Its great that you continue to add new features to Pi, which already is one of the best platforms out there. Just a few matters which I am unable to tackle:
1) I love to use multiple MWs, one for my portfolio stocks, the other for stocks on my watchlist. With the new update, while am able to create MWs, it does not get saved when I save the workspace, i.e. for a new session I have to create a MW (only the default MW is saved). Have wasted a lot of time with this.
2) News reader: I like to have it arranged in a way, where I can see MW as well as the News Reader, without having to change the tabs. However, having arranged the News Reader window this way, it is not getting saved to my Workspace.
3) Generally I would like to understand which customizations can be saved to the Workspace.
Thanks, keep it up.
Goto view->user settings-> market watch and select both save layout on exit and marketwatch conformation on exit, this should solve your all your queries.
Hi
When zerodha will release Pi for Apple OS ?
Not any time soon. But can use Kite web and check our kite ios mobile app in istore.
super in chartings. only thing we need is weekly and monthly chart in PI. rest rocks
Weekly and monthly charts will be added in next release.
After recent upgrade, I’m unable to delete indicators added to the charts. Previously, simple ’delete’ key press was deleting the indicators in charts. Let me know if there is any alternative/short-cut to remove the indicators.
No issue as such, one can select the indicator and click on delete, it should work. If indicator is selected it will display the selection in small square boxes,and then immediately click delete button.
Nope..It’s not working. OS: windows 10
Will reach you on this.
Not Working For Me Also….Plz Check
Can you please uninstall this and install new version from Q. If still facing any issue please write to [email protected].
thanks for reply…why this slippage ? even I placed order 1 hour before… no first come first serve anymore?
Slippage is incidental and can not be avoided if one uses market orders, can place stop loss limit orders to get exact price but if sudden spike occurs then there is a chance of order not getting traded.
hi…why I dnt get exact price sometimes when I use right click order window ..is it problem with pi or effect of High frequency trading ? ex if I place order at 1000, it get filled at 1002,or 1003… thank u
If you use limit order to place an order then there is no way for the price to trade at higher price, but if one uses market order or stop loss market option then there may be difference in price due to slippage. It has nothing to do with platform one use to trade.
really great you replied…and is it true that super computers used by big players are 400 times faster than zerodha and others, who provide 2nd level cheaper server… I’m not criticising but want to know the truth….pls…
I just noticed that brokerage is 0.01% or 20/- whichever is lower for equities and futures but not for options. What is the rationale? Shouldn’t it also apply for options as well as the turnover is quite low. It will really help traders trading in nifty and banknifty where lot size is less.
In options the 0.01% rule applies on contract volume and not premium volume. So if you buy 1 lot of nifty calls at Rs 100, when Nifty is at 8000. The turnover is around Rs 6lks.
hi my mcx orders are getting rejected reason is rms rules cheak for frreze quantity for mcxcom for entity account what is this
Vilas, every commodity has a maximum lot size per order.
what is the script code for supertrend.. If we want to generate alerts or do backtesting, we would need to write the script code. I tried STR but it says not valid code.
It is not possible as it is not built in indicator and also involve complex algebra which is not supported by Tradescrip.
ok thank you.
how to add supertrend indicator in chart…
After the new update dated 18/07/2016 open any chart and select study and type supertrend.
ok thanks…
Hi.
How to use supertrend or draw & set the period and multipler
Can go through the below link and for more queries on using supertrend one can post in the link itself.
https://zerodha.com/varsity/chapter/supplementary-notes-1/
Today, Pi said there’s an update (I updated yesterday). So I clicked on update now anyway. Nothing happens. Please clarify.
You have to click on update and if it is not getting updated you can call 080-40402020 and someone would help you with this.
Got the update to be installed. I closed all other applications and had only Pi running. The update happened correctly. Strange bug. Previously, when other apps were running on the PC, Pi had no problem updating.
A bug:
When ’save charts on exit’ is enabled, the next time I log on to Pi, all the charts open as blank charts. Not a single candlestick. Further, in such a case, if I close any one chart (say HDFC) & try to open a new chart (say Infy), Pi says to wait as it’s still fetching HDFC chart. Bizarre.
Also, please allow default market watch to be popped out. Earlier version of Pi allowed it. Now it’s not possible.
In the above mentioned chart bug case, when I’m unable to open chart, I’m forced to log out & log in again to open a new chart. This leads to loss of precious time.
You can update the patch again and this should be fixed.
Despite installing the latest patch, the problem of Pi not opening a new chart and saying it’s busy fetching another chart still persists. Fix this issue ASAP.
It is good to see lot of improvements in PI. It would be great if you add the following features in the future updates,
1. Limit order stoploss for cover order
2. Windows tiling so that I will be able to see market watch,order book,trade book etc in a single screen and not need to switch tabs to move from say market watch to order book/admin positions.
3. Something like a ’Calculate’ option in buy/sell screen to quickly verify the quantity allowed to buy/sell with the available amount.
Also, if there is some new updates coming inform us in advance so that we can update earlier than the market hours.
Thanks.
1. In our list of things to do.
2. You can do it in Pi, you can drag and drop the window where you want to see it, for more help can write to [email protected] on this.
3. Point is noted, if possible will try to implement.
One can also select later on update message and update after market hours.
In Funds tab, only Pay in and Pay out. Would be a pleasure if there is something which shows us how much funds available to trade. Right now couldn’t find anything where we can see available funds to trade.
These details are available in Positions > Cash Positions [Ctrl + Shift + V].
Ok, Thanks.
Go to Positions –> Cash Positions (Shortcut – Ctrl+Shift+V) to view margin information.
I would like to suggest that margin amount should be shown on every trade window..may be in title bar or any where in new order window as it will help to calculate and put order quantity what happens now is, it drops or cancels order just due to short of margin and we miss (good) trade opportunity !!!
On Pi, you can pop out the funds window and place it in a way that it becomes omnipresent.
True, Thanks for suggestion; but what happens is, i have to use kite mobile at day time and very difficult to use pi at day time. And unfortunately kite mobile has many issues too regarding cancellation of orders etc….
I want to drag and drop market watch,order book and chart in one window.what is the process?
Check this post.
nitin pi when we ues cross hair it doesnt show the time and price when we move the curser.though in the bok it shows the value and time but till only till there is last candel plotedin chart.in live market we have to draw lines beyond the current candel and find the resistance and support earlier before the candel has been ploted.i guess almost every day trader will be helped it you arrante to update this feature which is present in kite.pls reply is there any chances to upgrade this facality in pi.
Hi pi is getting stuck on avant garde splash screen, ”Loading contracts status” Even though I can see the contracts loaded and ticks behind the splash screen.
Can you try to move the avante garde screen and check behind if update message is there.
Avant grade screen should be like splash screen and not sticked screen by which we can’t focus anywhere till it goes off the screen !!!
Phrases are best to understand not forced before traders.
It will just stay for few seconds and will goes of automatically once the essentials are downloaded for the platform to be ready to use.
Thanks it worked…
Happy about the latest update especially for the inclusion of
1. Supertrend indicator
2. Cover order with limit entry option
Please include
1. Cover order with Stoploss Limit Order
2. Bracket order in commodity segment
Bracket orders for commodities are not allowed as they come under Algos and should not be used by retail traders according to MCX. We would be happy to provide if MCX exchange allow us to give.
hi
your pi software is overclocking and open , this is coursing frequent error & cracking of this software , please consult with some one who know something about programming ….. we are not zerodha`s beta testers ….. frequent cracking of your software effects our trading …. we traders cant switch platform to platform ( pi to Kite to ztrader ) every time ”fi” cracks …
We are taken account with zerodha to trade .. because of your ”Kraking soft ” i lost some of my trades today…. who is going to answer for lost trades ?
so don`t sent message to upgrade your software on working days … if you dont have the full confidence of ”Kraking soft”
thank you
It would be appreciated if you can write to [email protected] to look in this and fix once and for all as we could not able to find out any client ID with this mail ID.
hi sir this update is good one. i would like to say that can u able to add thing on charts that script can be searched and charts to be opened back and search engine should not be close automatically. so that we can search a winning trades very fast intraday basis thanks for this update
Is there any problem with server for Pi. After installing the updated version , its not logging in. Error Message : The remote server returned an error :(503) server unavailable
Can you check now.
After the latest update it crashes and exits automatically very often. most of the time it crashes when i start adding scrips while creating new MW workspace. Apart from that, adding symbols in scanner has made Pi great.
It would be much appreciated if you can immediately call 080-40402020 or write to [email protected] if it happens next time.
thx for replying. Its working perfectly now. i was getting an Error Message : The remote server returned an error :(503) server unavailable, but then after sometime i logged in and it worked perfectly. thx
Good that time frame can be changed from chart itself, good that you implemented our suggestions. SuperTrend is also one of our requirement to be added in pi which is added…thanks…
Now although i know it will be possible to scan stocks based on SuperTrend, Trend and MACD/RSI which needs one more improvement to be implemented, multiple time frame so that we can take buy/sell decisions when higher time frame confirms signals.
MultiTimeFrame in all chart and scanner is to be first priority to be included sooonnnn Please.
Points are noted.
Unable to launch charts after new upgradation…”unable to fetch historical chart…………….” Message is piping and a blank block chart is appearing…pl solve this problem
Can you please try now?Looks like server congestion was causing chart fetch delay/incomplete data send.
what is the script code for supertrend.. If we want to generate alerts based on that, we would need to write the script code.
Thanks for updating but I want to limit stop loss order in bracket order .in Pi software there is no limit stop loss order only have a limit order by default. Please add this feature in the bracket order and there is no price alert in the software that give me msg on my registered mobile no
pi unable to load more than intraday charts…problem occurred after the update…give me solution i’m unable to trade
Can you please try now?Looks like server congestion was causing chart fetch delay/incomplete data send.
The problem still exists. Not able to load more than one chart
Plz add universal search box for adding scripts on pi
Goto file menu and click on find symbol or use ctrl+f to get search box in new release of Pi.
Option calculator is a good addition, Thanks for that. Wish Zerodha include Fibonacci extensions also in next PI update release. Fibonacci retracement a are already available in PI but extensions are not available. It is being widely used now a days in Harmonics. Would be a great help if you can add that feature also. Also, on 4hr chart, even if we select 120 days, rarely we get charts for 120 days, they are less of less than 120 days. If that could corrected then even that will be helpful.
Thanks.
Will give fibonocci extensions in next release of Pi and also will try to add more intraday data.
Thanks.
The chart is not showing any data before 19th?Is it only me.The Hourly chart for whether SBIN or crude only shows data after 19th/20th.Any help?
Can you please try now?Looks like server congestion was causing chart fetch delay/incomplete data send.
Unable to fetch historical data.
https://postimg.org/image/ntrra937l/
why there is no weekly and monthly chart is not present in pi.. its difficult to switch from kite to pi..
Will be available in next release.
Hello sir,
My question is off-topic here. However, i wanted to know couple of things from zerodha.
Can we get the below soon on our favorite zerodha?
1. screener to scan the stocks depending upon different candlesticks, chart patters, indicators etc.
2. fundamental details of the stocks
Thanks,
weekly and monthly chart..?
Yep, everything on the to do list. 🙂
sir, plz focus on mobile App more so that one can use on the way. it will be really helpful for working people like me. Earlier i used ”iifl market” App which is very easy to use. kindly provide all those facilities like iifl App. Thanks
what about bracket orders?
Bracket orders are already available on Pi.
I had purchased a Deep in the money option of Wipro prior to the results. On results day the stock opened gap down by 6 percent. But the PI software had an upper circuit limit set, which was even lower than the spot price of the stock at one stage?
Why did the software not update the upper circuit limit for that option?
The limits are set from exchange end and it will take sometime for exchanges itself to update option circuit limits. Limits will be automatically updated and it has nothing to do with platforms.
In such a scenario making profit or cutting on losses is very important thus close you position by trading on Kite platform and then you can think of complkining about thr Bug in the Pi software…
This is not a bug on Pi. There is a circuit limit for every option contract set by the exchanges.
I have been pi user for more than a year, have not faced any problems but post this recent update pi facing lot of isses, Pi has become heavy consumes lot of resources and makes system slower, also last 1 week the software is hanging and unoftunately I cant close anyways neither from taskbar I have to restart computer to use again
I have laptop with i5 processor and 4gb also other software like sharekhan etc have no issues, any update will be useful
Regards
Sudhakar Prabhu
Your system configuration is good enough to run Pi seamlessly. We’ll get someone to call you. It’s best to write to [email protected] in the future for any account related issues.
Cover order with limit prise help full ,
multiple market Wach good
we need default f&o stock list in one market watch
For time being one can add manually one time in 3 different market watches and save but will try to give as default in next release.
great one … finally my repeated tweets and email worked for donchain channel and Compare.. can u please please add where u can see the spread between two stocks for pair trading
Please add VWAP and its derivative MVWAP.
Also, please provide an option to change the color of other lines of indicator. egs. in macd we can only change the color of macd line and not the signal line.
Will be addressed in next release.
yes i too look forward to Vwap in the future release of PI & color enhancement for Directional Movement system
Color enhancement for DMA also will be addressed in next release.
pls do more concentration on Android App developing…..in future there will be more users for app only
Pls try to send msg when a trade is executed so that it will be easy to monitor
As long as the chart is not changed as in KITE , I will not use PI.
There is no vertical scroll in charts, the candles are hitting the top or bottom, it is very annoyng, Please design the chart as in KITE. The chart in KITE is amazing, but do as in KITE.
From the beginning I am using KITE instead of PI , as the chart in KITE is excellent. The chart in pi is not user friendly.
Totally agree!!
Humble request to Zerodha team if you can make the chart space moveable/ scroll-able same as Kite, it will be wonderful addition to Pi.
Thanks!
Yes, i agree with sakthi. Please enable vertical scrolling of charts in Pi. and most importantly, add a square of button in the snap quote window, it will really help all of your clients!
the trend lines are can be edited in color thats a great convenience for users .good job done.
Yes, that is really helpful.
Sir today i tried to buy 21st july 19300 ce @ 15 but order has submitted for @ 91 Rs. i could not get it at Rs 15 more than 10 time i tried to place the order so how to do it please reply..
It is advised to call 080-40402020 to get quick help on trading related queries or you can write to [email protected]
Could you please add more than 12 chart at a time 🙂
Sure, will try to increase in next release.
Thanks
Please develop setup file for ubuntu version also. If exits please give me th link for pi setup
Dear Siva,
Zooming in a chart in pi make the latest candles out of display (unlike in kite), kindly give an option (or by default) for it to stick to the end candle while zooming out & in (unless panning manually), like kite.
Dear Siva
Please also try to include weekly and monthly chart in Pi …
Dear Siva,
yes there should be an option of weekly and monthly charts for all the scrips. And, i have few requests if You can update in next version following additions.
1) if we want to see 1 Hour chart in 60 or 30 days it doesn’t show the current/previous day’s charts.
2) in RSI we right now have only 1 parameter instead in RSI i would request two parameters. like 14,30 in same RSI chart.
3) i have been using share khan trade tiger and i find Zerodha PI as a compelling charting plateform.
Thanks & Regards,
Nisha Upadhyay
HI SIVA,
I Found something missing in Pi which sharekhan trade tiger has in trade tiger we can see previous days high low and open and close in martket watch but in in pi and nest we can see only see current day high low open high, please update pi with a tool by that we can see last days last week and last month high and lows in chart, in market watch please update the above mention feature
pls down load pi
Its 2020 and still waiting,Update your zerodha pi, its slow, incompetent and hangs like a hell when multiple charts are open.
Also a provision to highlight new highs and new lows is a lot of help in identifying fresh movements as was there in the Nesttrade
i want knw about cover order.. how to square off cover order at market price? plz answer m asap..
thank you..
Can you please provide zone marking tools like how they provide in Ignite, Trade Tiger and retain them across multiple time frames as we keep moving across from higher to lower time frames. At the moment this feature is unavailable and I use rectangle from inside tools to mark the zones and color them red or green for Demand or Supply zones. (This is a 2 step process). But this method proves to be useless the moment I switch to other time frames, as the zone markings disappear. Also it will be great if you can provide placing bracket orders directly from within charts (with predefined entry, target and stoploss points). Thank you.
Please add one column for %profit/loss and individual scrip buy value in the stock holding section.
Thank you
Pi is not working.
Showing Error, After login
Not, able to login. Please restart again to continue.
after restart the system. it is showing the same problem.
I m using window 10.
Please support
Seems to be a machine specific issue. Best write to support[at]zerodha.com.
I need to export the csv data at end of each day (for my data processing). Currently I am doing it manually. Is there any better alternative to what i am doing currently (and preferably automated way)?
You’ll have to do this manually as of now, I’m afraid.