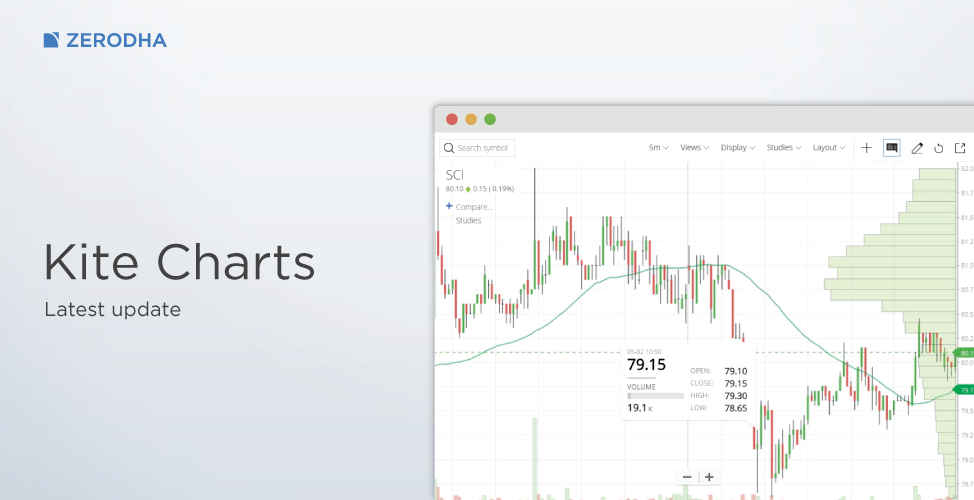
Latest update – Kite charts
Traders,
Check this video and user manual for all features on Kite charts. Below are the latest updates.
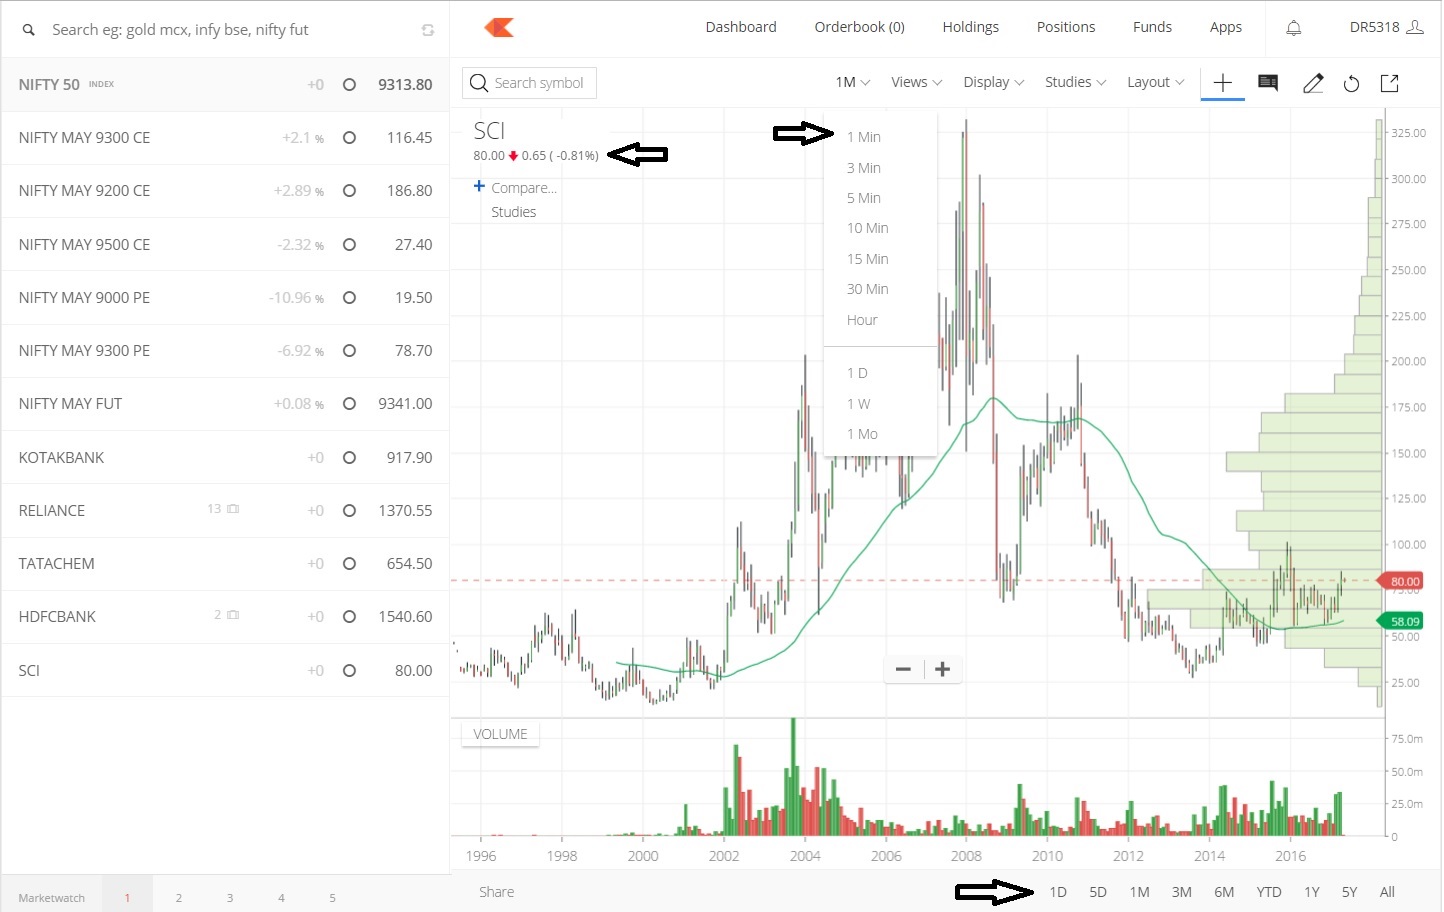
Lot more data & Quick trends
End of day data from 1996 for top stocks and intraday data from Feb 2015 (more than anyone out there). Below is a 21 year chart of Shipping corporation of India. New charts nimble even with large amounts of data.
Click on 1 Day, 5D, 1Month, 3M, 6M, YTD (Year till date) to see the trend for the selected time in one click. Based on time period selected, candle size changes from 1 min to 1 month by default for best fit for overall view.
LTP and % change: Last traded price of the stock and % change from close of the last candle/point to the current price on the chart.
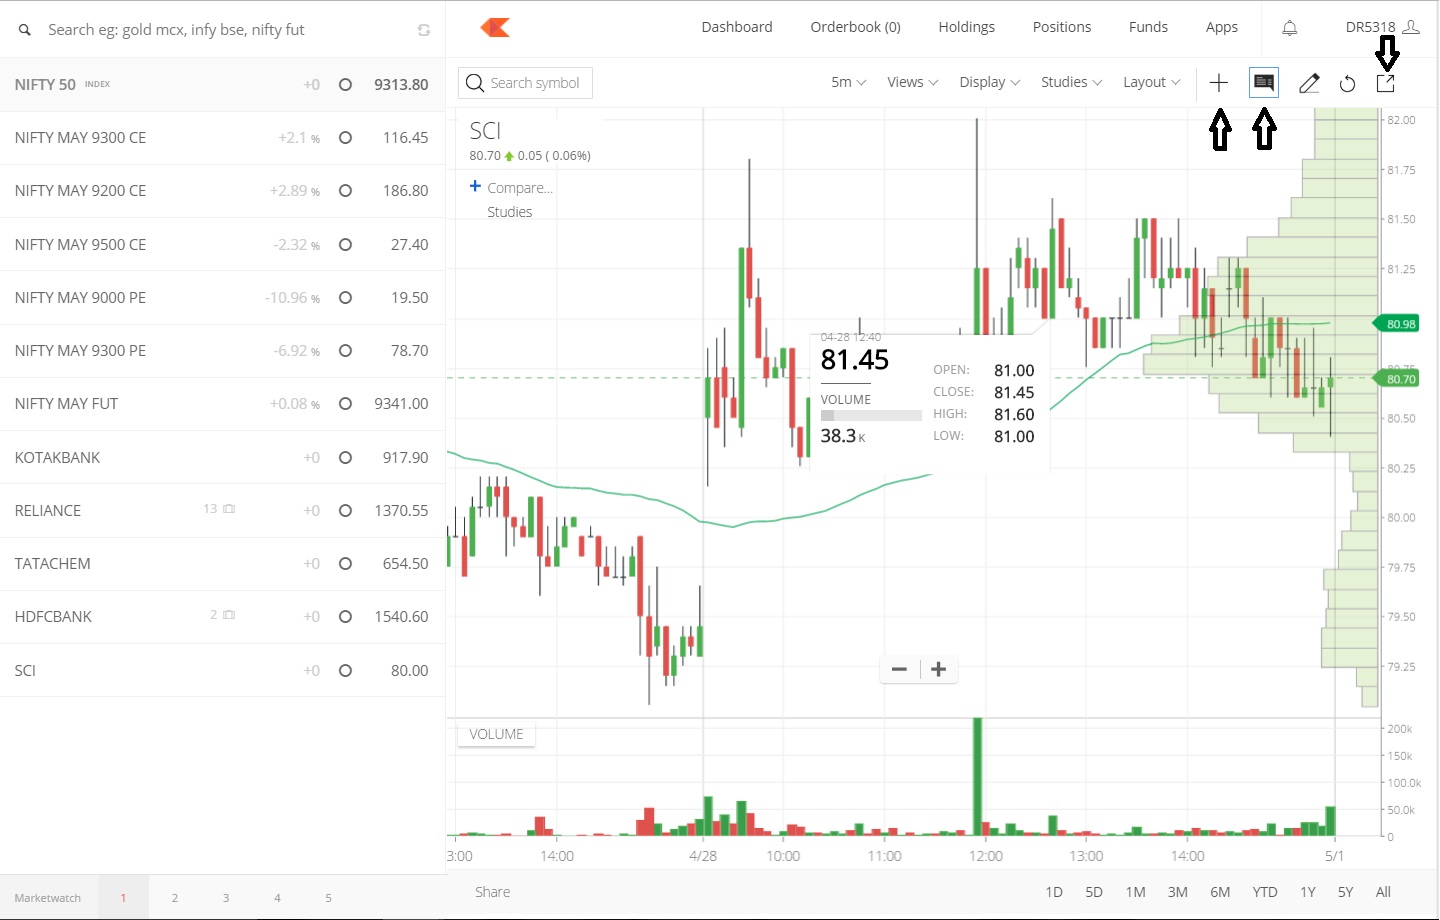
Quick trends, LTP, lots of data
New information box
Use crosshair or info box to either disable or view Open (O), High (H), Low (L), Close (C), Volume (V).
New popout and refresh icons.
New info box view
Classic info box within chart with slight transparency instead of top panel, giving more charting area.
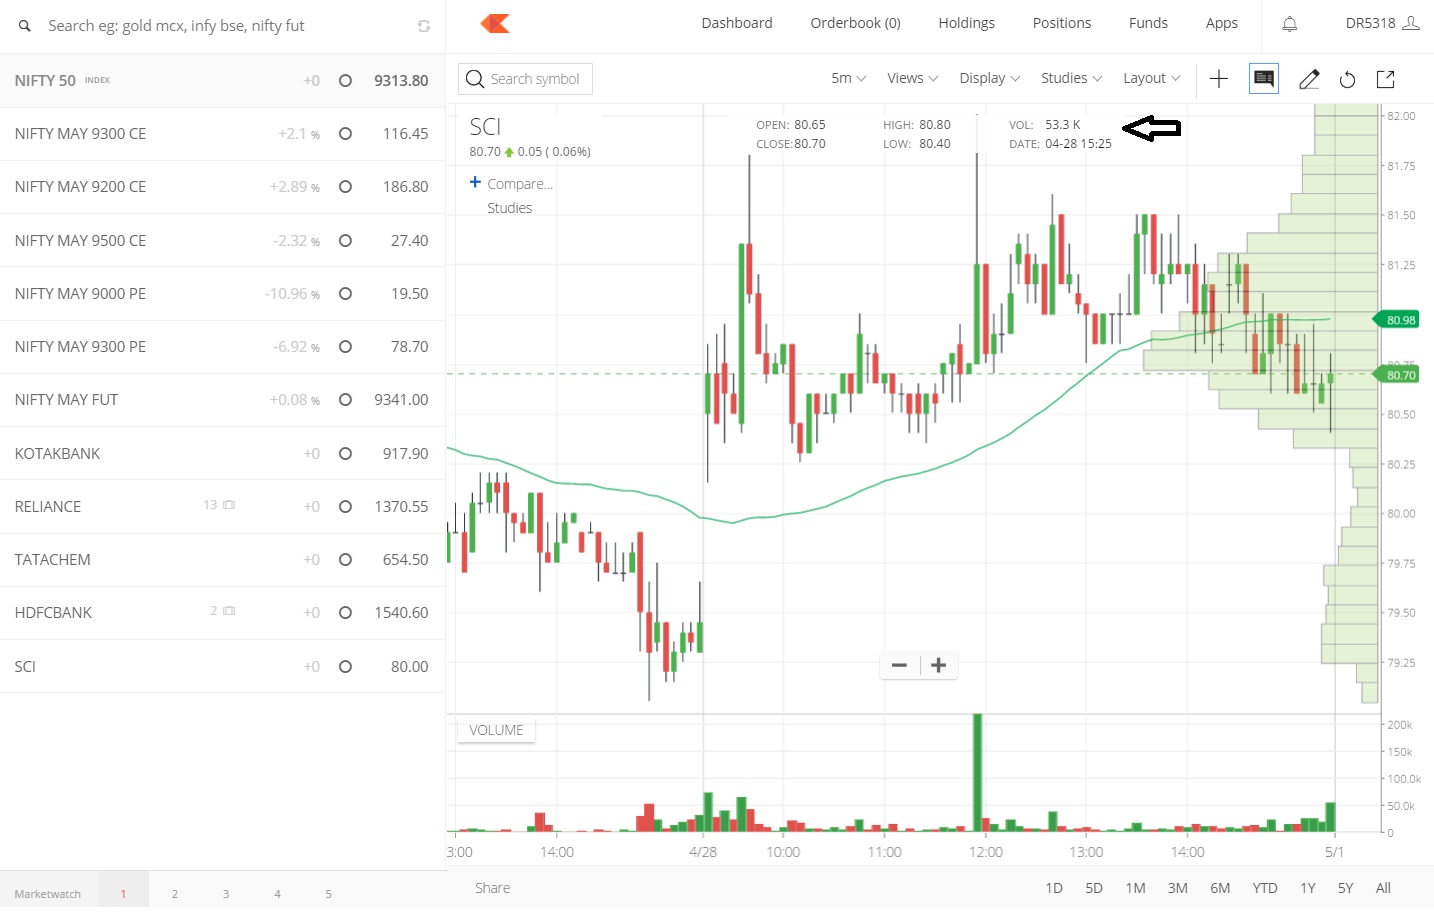
Classic info box
Easy view and layout save
Add studies/indicators and save views. Views/templates can be applied on other scrips when charts initiated.
Click on layout to save preferences like candle time frame (1 min to 1 month) and theme. Candle time frame auto saved as layout preference in 30 seconds. If chart either popped out or new charts opened without saving layout or waiting for 30 seconds, default candle time frame of 1 min gets applied.

Views and layout
Easy add/remove/edit – studies or indicators
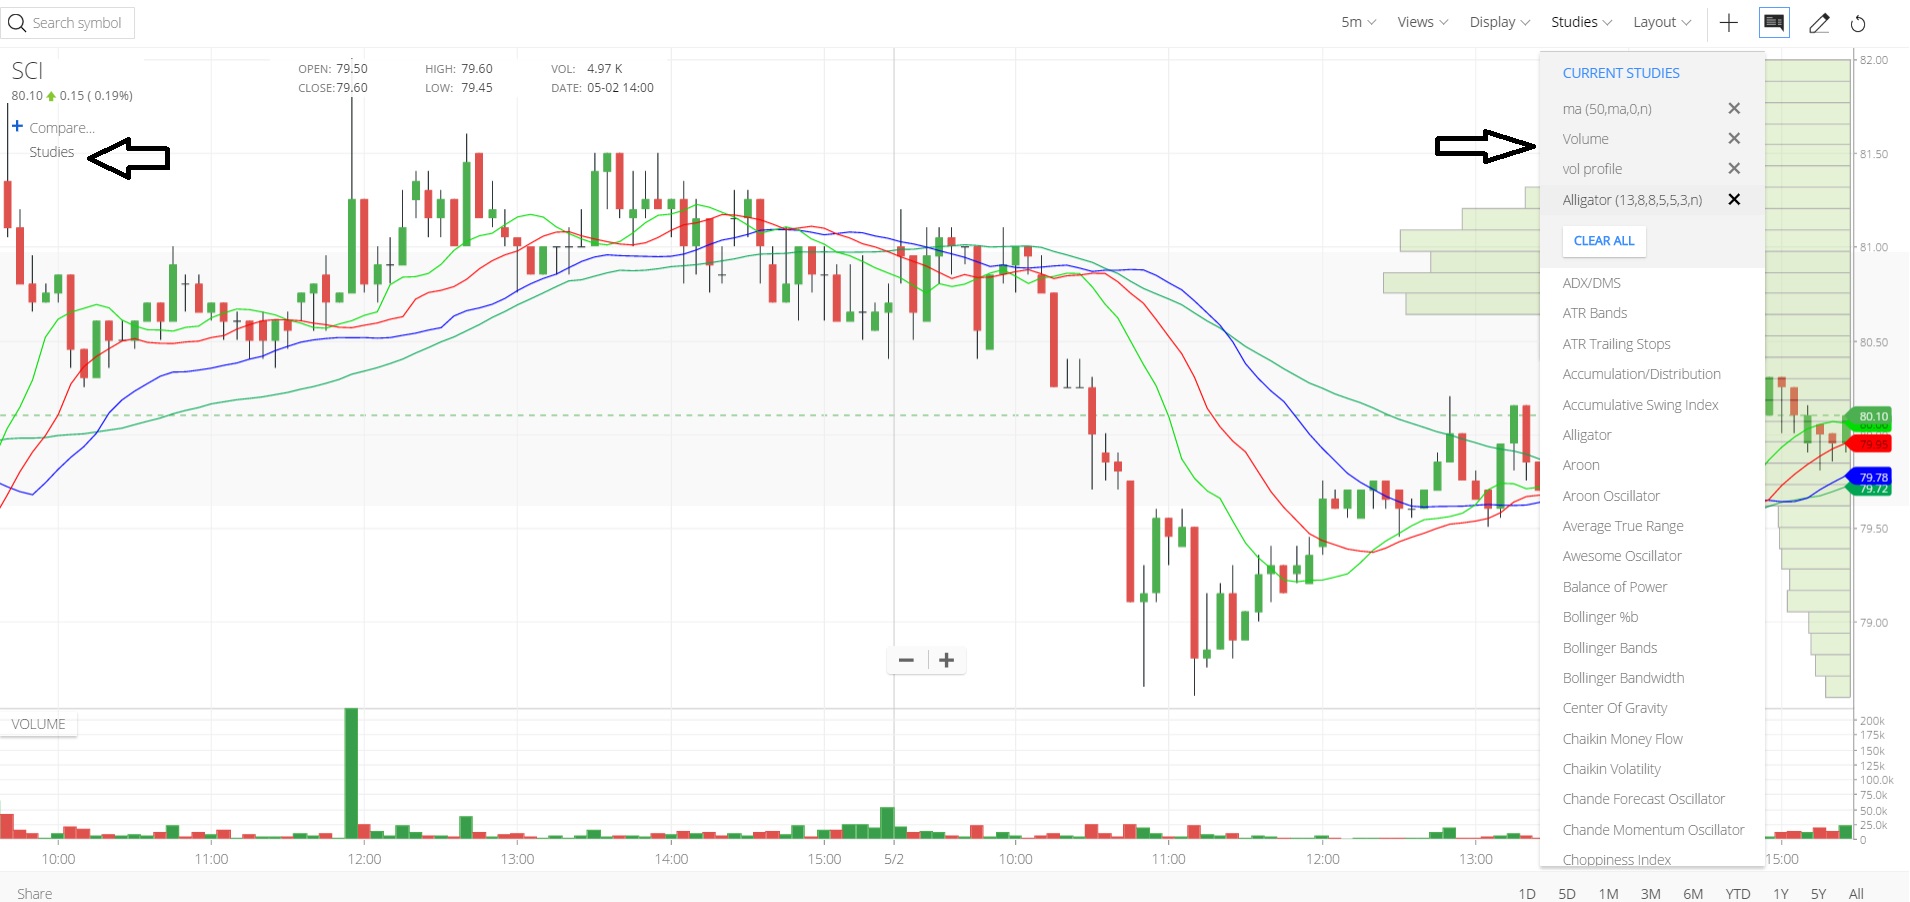
Add/edit/remove studies
More drawing tools
Initiate drawing tool panel as shown below, click on the same to hide to give more charting area.
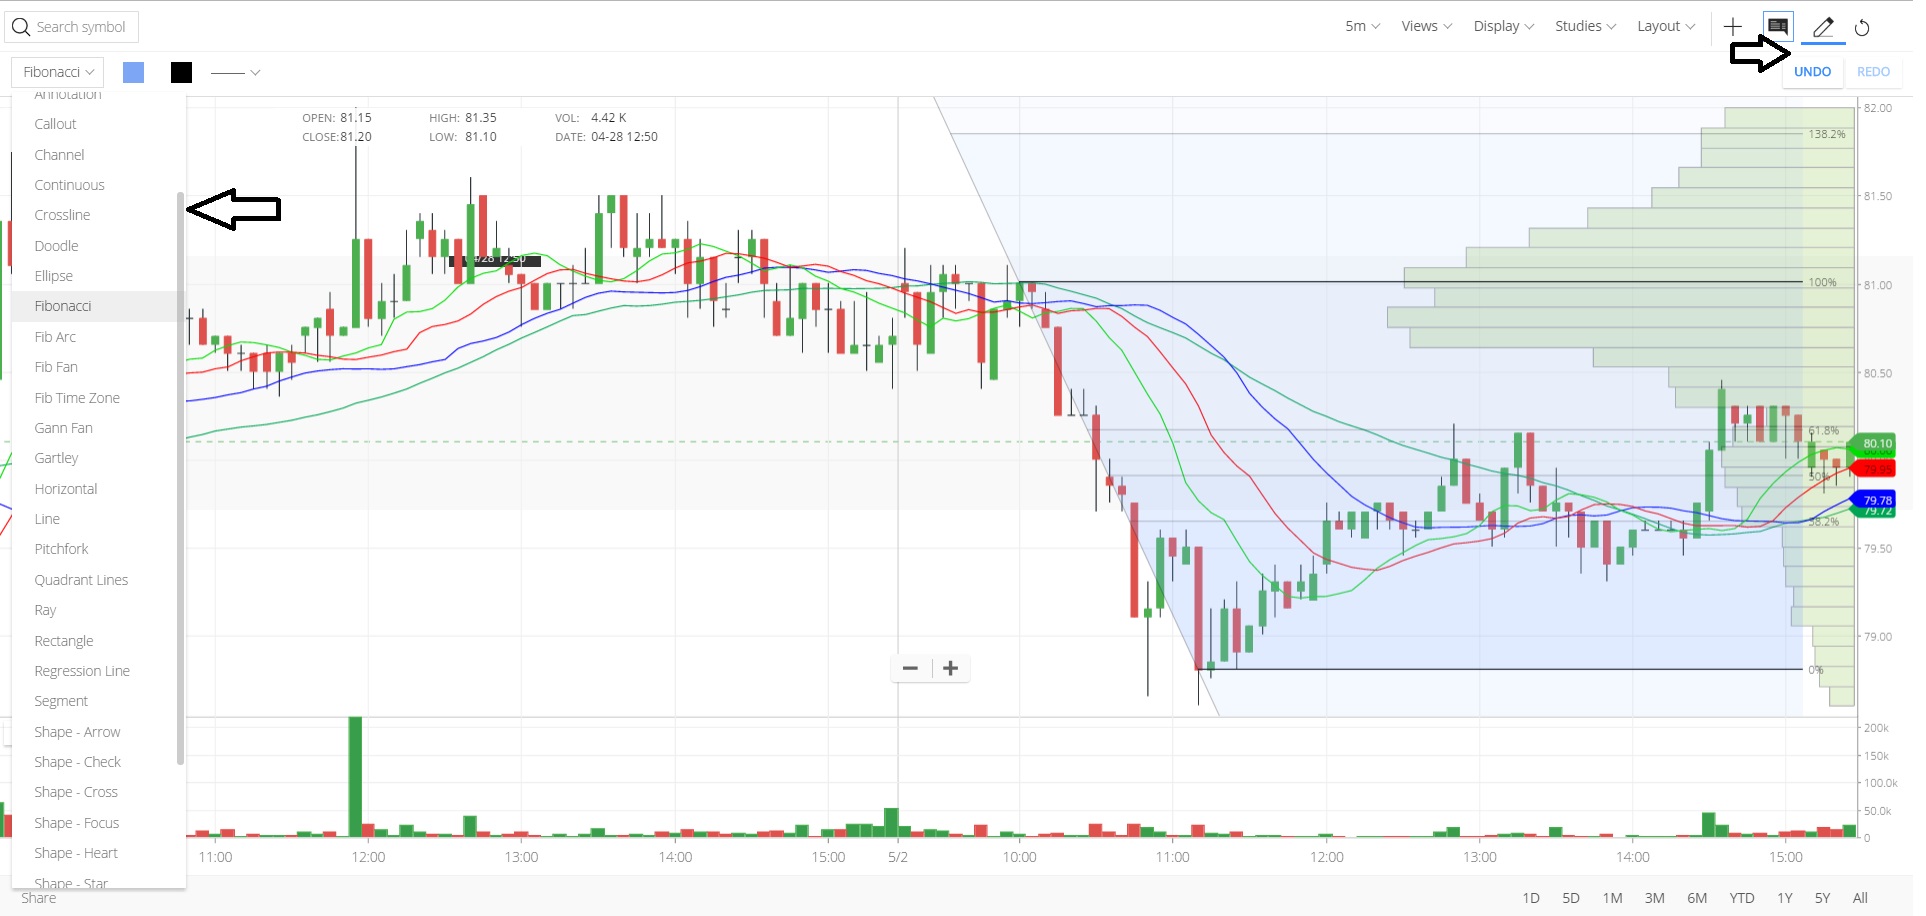
Drawing tools
Tips if using charting on mobile
- If using charting on mobile, keep crosshair and info box disabled for better experience.
- If crosshair, info box, or drawing enabled, two finger swipe to drag the chart left/right.
- Avoid loading large amounts of data on mobile.
Do watch Kite video and read user manual for rest of the features.
Note: If you are not able to see the latest change as shown in the post above, clear cache and force refresh your browser (Ctrl+shift+R).
Happy Trading,
Hoping to hear more about this stuff. Very effective and informative.
need vwma indicator in iqcharts is it posible or not
Hi Mohan, VWMA is not available on ChartIQ. It is available on Trading View charts on Kite.
please add countdown to bar close feature. Zerodha kite lacks some features like favourite drawing tools, price alert, auto save ( we have to save every time if draw or make something on chart )and many more..
Hi Team,
From the past couple of months, the charts are not loading quickly, it hinders my trading session. Every time I need to refresh the page, at least a couple of times to load the chart. I have tried with both 4G connection and with fiber broadband, the issue remains the same. Server connection error, Unable to load the page these kinds of messages I get
Can you please help me with this!
Thnak You
Hey Varun, the charts have been working fine from our end. Could you please create a ticket at support.zerodha.com with more details and screenshots, so that our team can check and assist?
I would request product team to add a simple feature that is must and take more revenue chunk out of an unknown and existing market.
Please add colour change options for candle bars on chart. I think it is must have feature for colourblind people. Red-Green colour candle doesn’t help much. There are average 8% of people out there with colour deficiency. It is potential area team should explore and add one more colour option in chart candles.
Hey Rohit, you can already change Candlestick color. Here’s how you can do it on Trading View charts. On ChartIQ, you can do this by navigating to Display > New Theme.
The charts are nor updating and getting hanged quite often with this message.
”No storage space available. Possible causes include browser being in Private Browsing mode, or maximum storage space has been reached.”
Hey Pranit, please create a ticket at support.zerodha.com with more details. We’ll have this checked.
In last few days I felt that chart is loading data very late(~20-30 secs).
I tested it in 2 chart option(chartIQ) also, it was showing two different price in same instrument but diff time frame.
and in Mobile app it was showing different.
This is a serious issue.
Please try to resolve it asap. It is hampering my daily trades.
Note: I check same in rival’s chartIQ chart, the data was correct the time. There was minimum delay of less then 0.5 secs
Hi,
There is issue I see on the charts after 12 AM daily, sometimes the scales are not correct and keep changing itself after a few minutes. Today (19th June 12:15 AM) I’m unable to see the updated prices, the chart shows delay of 1 day and does not reflect the changes of 18th June, Friday.
This is happening on all of my devices and my device clock is synced up properly.
Please check the issue!
Dear sir/ madam i am prakash using kite.zerodha trading platform & have frequently recieving problem message on my destop as follows
”No storage space available. Possible causes include browser being in Private Browsing mode, or maximum storage space has been reached.
please kindly help Dear sir/ madam
Thanking You
prakash.g
Hi NItin kamath,
Can you please add Harmonic Pattern to Zerodha
I am new to kite and just started learning how to use the tool, finding some difficulties.
1. Is there a possibility to show/hide and reduce/increase the width of the left panel? It takes lot of space
2. Popout chart opens a new tab which can be avoided.
3. In some old screen shots, I am seeing the Info (Open, Close, High, Low) as a tool tip on mouse hover of the candle. But now I can see this Info is fixed at the top position. How to make it appear as tool tip?
3 point got it, when crosshair is enabled then, it will not show the info as tooltip 🙂
Getting this error since 9.30 am, but cant get past it. Tried logging in again, different browsers, but no luck. Both ChartIQ and TV are affected.
how can i change the increasing bar and decreasing bar colour in macd
It would be good to have a watchlist on the right side of charts like it is in tradingview. Currently, if I have to analyze 100 charts, I need to search for the stock by going to the top left corner and I will have to do it 100 times(1 for each script). With a watchlist, we can just click on the name and its chart would be displayed.
Hi Zerodha,
Why we are getting pop-up for blocking Strike price to trade. It has only 400 point range in banknifty . Why we are not able to trade on any Strike prince. Could you please provide the NSE Strike price blocked for the day? It’s very ridiculous for trading in banknifty option trade.
The details of: open, close, high, low, volume. these details are not showing on top left corner in Web & Mobile. Anyone know why?
Price is not moving/changing in popout charts in web (kite.zerodha.com)
In zigzag indicator ”Extend to last bar” option is not available. Can you pls include it?
Hi Nitin,
After New Zerodha update Technical Charts are really very slow. Each candle stick loads very slowly. when I switch from 1M to 1W or to 1D it takes time to load.
Previous version was very good & light.
I have tried in Safari,Firefox & Chrome.
Am not able to see Study in dashboard and I am not able to see CPR.
Today, I realized that something changed on Kite’s order placement screen, where the previous order selections settings are not retained and I have to choose the options like ”Market Limit” and ”AMO” again to place order.
This is to me is a very bad design change that got implemented.
This will be fixed tonight.
dear sir,
I am getting an error while clicking on the chart but this issue facing in mobile, not on the laptop.
I have Zee media (1000 shares) and HCL INSYS (1000 shares) showing as under BE group. If I place sell order its getting rejected and showins as Market sale is blocked and advice to sell through BO, CO under MIS. I tried that also and also its rejected. got message as Check holdings ,No Holdings Present for entity account-KW5195 across exchange across segment across product. what to do now.
Sir,
Since last few days, when I select Chart of any scrip, the chart is not working/no movement of up / down. Please can you do me a favour about it so that scrip chart should start working/functioning/ show movement of up/down of scrip etc.
Hope,you shall do me a favour.
Regard.
new chart side
dear sir/madam,
when using compare option (under trading view setup) only new price charts are added to the existing chart not respective indicators charts. Ex: When i want to compare Nifty 10000 CE chart with Nifty 10000 PE charts i can able to see only price charts are compared not indicators open interest are compared. I want to know is there any feature present to clear this problem of mine or it is yet to be added. Please let me know.
Hi Nithin,
This new version of Kite IS NOT LIGHTER as far as displaying charts is concerned. It becomes unusable after 30 minutes of use. I have sent your team the screenshots of the cpu usage with charts. The crosshair lags so much that it catches up with cursor movement after 4-5 seconds. Any click on the chart registers after 5-10 seconds.
Saved views are saved in browser, not on cloud. Then, when the charts become slow, your tech team asks to clear browsing data, which helps only for 30 minutes before lagging again, but clearing browsing data causes the saved views to get deleted every time. We can’t build views every 30 minutes.
When clicking the tool/drawing button in the TOP RIGHT CORNER, the next dropdown menu to select the draw tool appears in the TOP LEFT CORNER. That’s illogical. It should show up in the same area (TOP RIGHT CORNER). A whole strip from left to right gets wasted anyway.
Please fix this, or at least give users the option of using the old version of Kite, which was fantastic and actually lighter than this version. You could run charts on it all day without it slowing down.
Thanks in advance
hello sir
i need your help
when i open kite in laptop for chart analsis
chart doesnot show live chart data
candlestick does not move when i use for chart analysis
Seems to be a system-specific issue for you. Create a ticket on our Support Portal for help.
I have 2 major concerns with the drawing platform –
1. Every time I draw trend lines in the daily time frame and switch over to a lower time-frame (1 hr, 30 – 15 – 5 minutes), the lines disappear.
2. After analyzing and saving trend lines and indicators on a series of charts, they do not remain saved after I log-out and log-in, and even when I restart my PC. This is incredibly frustrating.
PLEASE HELP.
1. Drawings on one timeframe aren’t relevant on another, hence they aren’t saved.
2. Click on the cloud icon to save the template for use the next time.
Drawings on one timeframe aren’t relevant on another ???????? what the hell are you saying
What he is effectively saying is price one one tf is not same as another. LOL.
How to toggle between pop charts of various stocks in my watchlist with out actually going and clicking in the watchlist or typing in the top left of the popout chart screen? Toggling between popcharts is available in tradingview.in- as we click up or down arrow , the chart of corrresponding stock in the watchlist is displayed without actually typing. Is this feature available in zerodha trading view chart?
Just click on the stock name on the top-left and type the name of the stock you want to change to.
I am unable to see the prices on Mozila Firefox v. 74.0 (64bit), i can login but prices are not updating tick wise.
is there any issue with firefox browser.
Hey Kushal, no issues with Firefox that we’ve noticed. Are you behind an office firewall, perhaps? Best create a ticket on our Support Portal in any case and someone will be in touch to help.
can we add remaining time in candle formation indicator 🙂
it will be very useful ….thank you 🙂
Yes please super important feature missing
I need Fibonacci Price Projections tools / Extension tools please help
I am not able to select period in Moving Average indicator, How I can set it to 200 Day moving average ?
It only shows Length, Source & Offset.
Length is the same as period here.
HI,
VWAP line is only seen on nifty fut chart but not on nifty chart. why is it so ?
That is because there is no volume for the Nifty index since it isn’t traded. The volume is only available for the F&O contracts.
how to get 6 months nifty futures 15 min chart
Hey Chetan, intraday candles wouldn’t be available for this. EOD data for the past 6 months (and more) is available on Kite. Explained here.
How to remove or change color of Grid lines in chart ? Could you please advice me ?
If you’re using the default ChartIQ charts, you can do this from Display>New Theme. If you’re using TradingView charts, you can do this by clicking on the settings icon on the top-right and going to the ”Background” tab in the pop-up that opens.
What is the possibility to have a tool to mark the Demand and Supply zones without the need to use the rectangular boxes?
I am not getting diplay/studies/layout when i use 4charts display but i am getting from dashboard single chart pls let me how to rectify
Thx
Sir,
I would like to know the following and please help me;
1. I want to apply my own ema lines which is not available on the zerodha study on Nifty Index , Nifty Futures and Nifty options Charts. Is it possible?
2. Can it be done thru the Kite now available.
3. If YES,what is the way?
4. If NO, is the API required to apply that study directly on the charts opened in Kite or PI Platform. In that case, can you give me free access for 15 days to try it out.
Please let me know.
Thanks & regards
The charts are auto adjusting to the scale while I scroll sideways. What I meant is that when I scroll sideways the graph becomes big or small accordingly. How could I avoid this auto adjustment?
how to plot sensex with mulple stock charts on single window?
Explained here.
I am trying to look at the past data charts like for example Axis Bank, 17th May 2009- in 15 Mins chart. Trying to reach that (old date) by changing the time frame to ”Month” but as soon as I want to zoom in to it like a particular day and 15mins, the chart reloads to the smaller time frame for example 15 minutes but to present date and its impossible to scroll back again in smaller time frame that far. Is there any other way of Jumping to an old date in smaller time frame like 15 mins. Any support would be highly appreciated.
Hi,
I want to use candlevolume indicator. I have seen youtube video of someone using this indicator but I could not find it in Kite.
Please throw some light on this issue.
Tnx
Geetha Sakthi
Because now if we draw trend lines in web kite, the same are not appearing in mobile kite app. Drawing trend lines and editing them in mobile app is tedious and difficult
Ah, that wouldn’t be possible since drawings are saved locally on the device.
is there any method :Charts once updated in web version to replicate same in Mobile charts also
hello sir
1.is it possible in near future that we can use continuous chart in lower time frame
2.when will it be available for cds
3 is there any alternate way to see previous data in lower time frame???
About new chart: Old is gold. All glitters are not gold.
Hi
plese kite tradingview chart to Countdown timer indicator
Hey Muniraj,
We are working on building a few of the popular requested indicators on Kite charts, which are currently unavailable on either Tradingview or Chart IQ charts.
Tell us the indicators you’d like to have on Kite, and like the ones which are already posted here on TradingQ&A.
Countdown timer indicator in TradingView
You are not showing many important indicators like Average Directional Index (ADX)
Hii
I am using 2 Charts in a single Page and trying to save it in Views which is not getting Saved and i have to redo again and again.
Suddenly sometimes the Chart is not displayed everything goes blank and I am not able to understand whats happening this is creating lot of problem in trading. The Problem was not there before but it is occurring since last one month. Internet speed has been checked and it is found to be normal.
Is it Possible to Change the display setting of Nifty and Sensex Percentage to Numbers (digits).
Regards
Few suggestion for Kite platform & charts
1. Kite watch list we can add remove few columns like bid / ask / open / high / low / previous close … etc.
2. Kite chart adjustable start ( end time) for Intraday candle like 30min / 60min
3. Kite chart may add few more time frames like 2 Hr. / 4Hr. … specially for commodity markets.
4. We can see open high low close and volume of bar but Not able to see other Indicators value in chart can add this part with data window like future.
few of above suggestion also apply to Pi charting also
Hope to see more better charting experience in near future.
Regards
Dolly
I’m not sure if this is already answered. Can you please let me know how to add ”Text” on the chart to add notes or pointers for future reference.
You can use the ’Annotations’ tool.
Hi Zerodha Team,
From last 8-10 days, the charts on Kite is not working realtime. The charts are getting updated delayed. What I mean is that the price has already changed but the price gets updated in the chart after a delay of over 2 mins which is not useful. When we are looking at charts we want real time update on chart so that as soon as the levels are broken we can take the necessary trade. However, levels gets broken but the chart gets updated after a delay and by the time it is updated in the chart – we realize we have missed the opportunity. This is a very serious problem. If we keep the chart open for over 20 mins then the charts get hanged. It gets stuck at one price level and does not move above.
I have tried everything from my end to ensure that my machine is not the problem. I have tried using it on different machines and every where I am facing the same problem.
I am looking at 3 min interval charts. I use latest version of Google Chrome on Windows 7. My internet connectivity speed is 16 MBPS. I have tried using my broadband connection, hotspot of my Vodafone, hotspot of my Airtel and of Jio. But I have faced same problem every where. So it is not something to do with my machine. It is something to do with the charts app. Can you look into this? Otherwise I have no choice but to switch to some other platform as trading without charts is not practical.
Hoping for a positive response.
Regards,
Prateek
Hi,
Is there a plan to add the following feature in Kite charts-
’Ability to overlay multiple indicators of the same type’
Ex : i want to add two RSI periods – 14 and 7 to the same box, not as separate indicators.
Please confirm if this feature is in your product roadmap.
Thanks
Hi Nithin,
as a trader we all use multiple indicators and i have many indicators saved in the ”views’’ option. but very frequently the indicators that i had saved gets deleted. Also please add dark mode theme.. not to the charts alone but to the dashboard and watch list also. Reason being dark mode for charts alone makes the webpage contrasting which is becoming a problem for studying charts at night…..please look into this matter Nithin!!
Hitesh, once you add indicators, make sure to Save the View and then Click on Save Preferences. If you still face the issue, please create a ticket on support.zerodha.com and we’ll have it checked.
Considering themes for Kite, I’m passing this feedback to the product development team.
Renko Chart are not showing all the bars in whatever time frame you select them.
Can anyone please explain this why? I’ve set Renko Setting to 5 which means a 5points movement should plot a Renko Bar where as if i see at the chart at end of the day I see very confusing charts, Why ?
You can Refer Reliance Dec Future Chart with below settings
Renko : 5
Period: 1Hr
You can use Renko for 1 mintimeframe and check, retracement in Renko charts can occur all the way back to any bar in the current selected chart time frame.
Bars from prior periods will always remain permanent (fixed). So, until the selected chart period is complete, the bars within the period will be recalculated as new data comes in and Renko bars will be plotted accordingly.
I’m facing an issue where if more than one chart is opened (pop out), only the one that I’m currently viewing updates while the ones on other tabs seem to stop updating and need to be refreshed to show price action and volume.
Hello Zerodha Team
In Zerodha charting, please guide me to draw derivative on indicator e.g 9 SMA on RSI, etc?
chart prices was not updating what should i do? i have installed latest version chrome but having problem and at same time other brokers charts prices changes there is no error from chrome. help me to solve this
Hey Aher,
Please check out these articles on TradingQ&A which explains why this happens sometimes.
https://tradingqna.com/t/why-does-the-same-technical-charts-for-the-same-stock-from-nse-tame-google-finance-yahoo-finance-amibroker-not-match/1688
https://tradingqna.com/t/why-does-two-charts-of-the-same-timeframe-look-different-on-the-same-platform/4715
Hello Zerodha,
1- Can’t set Renko chart brick size according to mine. Small price shares are easy to set but banknifty futures cannot be set to small brick size say 5 with 1D chart settings, kite auto selects.
2- ADX DMI don’t follow renko bricks. Bricks run further and ADXDMI line remains in its place until re clicking on renko under display settings to make it catch to current brick. Customer support says it can’t be done. ADXDMI don’t work with renko. !!!!!!!!!!!!!!???????? Is there any one to code to make it follow Renko charts. If yes then update it. Thanks.
Sir,
i want to draw horizontal line on high & low of first candle of a day with 15 minute duration chart. I know that it can be draw manually on a specific script . but i want to make template of it. So that when i apply template then each script open with horizontal line on high & low of first candle of 15 minute duration. how it is possible ?
Kindly help
why high/low renkos are not present in zerodha?
There are two types of Renko charts.
1) open/close renko
2) high/low renko
it seems like renko charts in kite are open/close charts. We want renko charts on high/low basis also.
Hello Mr Nithin
Buying or selling large volume in CO/BO at market price result in order executed in small small lots.
Eg: 3000qty of VEDL at the market is getting executed at 1000qty at Price A, 1000qty at price B, 1000qty at price C.
Now the problem is if LTP is in our favour and if we wish to change the target or LTP is against us and if we wish to change SL, we have to change each lot’s Target or SL individually. 1st 1000qty first, 2nd 1000qty next and 3rd 1000qty next. (sometimes single digit qty gets executed, Which will take a while to edit)
Suggested change: In order book, we need an option to select multiple lots and change SL/Target of those lots in a shot. Already we have the option to select multiple lots and exit those lots in a shot.
For a scalper like me, every second matter.
It will be nice if this feature is added to order book.
Thanks & Regards
Allwinrajadrai
Aark farms
Hi
I check the chart everyday between 3:30AM and 5AM.. in the early morning.
But unfortunately, the chart does not show previous day’s candle while seeing the daily 1D/15min/30min chart.
Today is 13Sep2018… it should show the previous day chart i.e. 12Sep2018… but the latest candle it is showing is for 11Sep2018. This problem has become more consistent now a days.
Request you to Please fix this problem at the earliest.
Hey zerodha team,
Recently Zerodha logo is added on the chart and it’s right at the centre of the chart with white colour text. I use chart in black background and it’s very difficult to concentrate on chart with that black logo right at the centre.
Can you please guide me to remove of atleast change the colour of that text so that the chart is visible properly?
Hi, can I plot previous day close and high/low price on any chart. Do I need to do it manually or is there any tool, which can plot it.
Thanks
You’ll have to use the ’line’ drawing tool and do this manually.
why does renko chart default brick size in zerodha kite same for same script in two different browser. I am currently facing this peculiar issue on opening renko charts in two different browsers simultaneously and getting minor different in box sizes of script.
ALso please tell me how to manually set the different brick sizes for different scripts.As currently after setting brick size for a script all other scripts open in that brick size only and it is problem and time consuming to set again and again when moving from one script to another.
You can set a brick size for a given scrip and save the view and preference. Whenever you switch to that scrip, you can choose the view with the right brick size.
how to disable last traded price line in kite
gi,
in my android phone ur kite app is working good ,but the only thing is that ,saved views of drawings line horizontal line ,channel …….. in my laptop are not seen in my mobile app, yyyyyy, reply me so soon
why are charts not updated for stock splits or bonuses fo rsome scripts.
Prakhar, we update charts for stock affected by corporate actions on a weekly basis. Can you give me a scrip for which it hasn’t been updated on Kite? Will have it checked
New window 7 computer, not fetching chart,depth details. It seems stock showing in watchlist/holdings is not enabled.
…….BUT NO PROBLEMS IN ANOTHER PC, MY MOBILE APP & OTHER DESKTOP. HOW IT IS BE FIXED….
PLS ANSWER
Dear sir,
Please provide quote panel in kite for fast buying and selling like upstock
When you pop-out the chart, you’ll see the trade option on the top right.
Hi Zerodha,
I have noticed price difference on the hourly candle Vs the price displayed in market depth. Are the oscillator indicators also getting the same feed as the hourly candle? This may have serious implication on trades. Please can you suggest.
Thanks
Hey. The indicators are all plotted based on the charts. The difference between the market depth and chart is explained here.
hi,
Can anyone help me on how to create ’stochastic RSI’ in this platform?
Thanks
1. Why mobile app kite showing different CMP for 1Month, 1 WEEK, 1Day Chart ?
2. Why there is no Buy/Sell button on Chart in Kite App ? Every time i need to go back from chart to watch list and then buy/sell options are appears.
Hey Chandrakant,
Question 1 is answered here.
For question 2, you should be able to see the buy/sell button. If you don’t, go to settings>apps>Kite and enable ’Draw over other apps’.
Hai sir,
i am using kite. In early version i saw a method of chart. i need the line chart or mountain option that can be ploted for Heikin Ashi implement. Clearly. first i am clicking Heikin Ashi then i am choosing a line chart or mountain chart for this Heikin Ashi candles.But now i can view either a line chart for candles chart patern or the Heikin ashi in candles patern. my request is a line or mountain chart for Heikin ashi candles. is it possible pls reply.
Sir,
It is wonderful in depicting indicators in KITE charts than PI. But the
problem is when we depict indicators like moving averages etc the lines
get highlighted (dark) only when we place the cursor on it. There should
be provision in the Studies column to make it darker as in the tools so that
we can immediately identify the indicators if more than one indicator is
depicted on the charts. It should also be done to other indicators like MACD etc.
with regards,
Rajashekar
Hey Rajashekar, we use ChartIQ to power charts. While it may not be possible to change the way the lines for the indicators look, you can choose what colour each indicator is to make identification easier.
Sir,
Thanks for the reply. Already I am using different colours for lines.
The problem is that the lines are very thin and I cant identify whether
it is moving average , line of supertrend, line of any other indicator.
If we could make those line bolder and thicker sizewise (like 1,2,3,4)it would
be highly useful. Hope you will find some solution.
with regards,
Rajashekar
Hmmm… We’ll check if that would be possible.
when we select 2 display, 4 display then it does not showing tools, studies, display,
what to do ?
I have same problem.
I am using google chrome.
Regards
You can change the zoom and then magically toolbar appears. Make it 80%.
Hey Nitin
can i use MT4 for zerodha and fire trade from MT4
Hi,
I am using Kite 3.0 on Chrome browser.
Lately, I am seeing that the charts are not refreshing tick by tick, sometimes I need to either refresh the page or change the time frame to get the price updated.
I have a very good broadband connection and I have tried clearing the cache and cookies, but still, the problem persists.
Please let me know how can I get this sorted.
Best Regards,
Alok
Hi NIthin,
First of all, wonderful job you people have done. The Kite platform is like a boon for many people like me where we can access really interactive charts anytime anywhere and from any device. And trading is easy as well.
I needed some help. When I try to plot 1MONTH RENKO chart (from bottom right) in Kite, it takes on a default value of 4H (time frame). When I plot the same RENKO chart in Zerodha Pi, the chart is totally different. I tried with many scrips, one of which was ICICIBANK.
I need to plot in Zerodha Pi and download the RENKO chart data to excel. Can someone from your team please help?
I essentially need RENKO data downloaded to excel. And the data in Kite is more comfortable as I am not sure how Pi calculates on RENKO. So in case it is possible to download from Kit to excel, please let me know of that as well.
Hoping to get a valuable response and at the soonest.
Regards
Ujjwal
Hi Nitin,
I went to support portal to request some feature of kite and Pi but I couldn’t find the tab where I can submit my feedback/My request hence putting it over here. I hope my comment will be seen by you early.
We need the funtionality to add indicator over indicator. In my case I want to add multiple RSI over RSI means I want to overlay the RSI over RSI(I have seen this feature in MT4). Even there are many updates can be made in kite just for example you can refer to TradingView.
This is already possible on Kite. Explained here.
Sir, I found the provision for changing colours of candles in New theme. Please let me know
how to set alert for changes in prices with sound and pop up. Under Indicators there is
provision for enlarging (expanding) but there is no such provision for chart (candles
space). Please inform if there is any such provision.
Hey Rajashekar, you can pop-out the chart to enlarge it. We’re working on price alerts as we speak.
hello Matti,
I know that there is provision for enlarging the whole chart by clicking the
pop up button. What I am asking is in the whole chart if we display indicators like
MACD , RSI etc. there is a square box to enlarge only that indicator. That provision is
not provided for chart depicting only candles along with some indicators like Moving
average, super trend, etc. Hope you understood my point.
i am not able to view chart in Kite. i am using some restricted machine where multiple things are blocked. can you please tell me which technology is used for that chart ? flash ? or something else ? any solution ?
Please provide 1 Click trading from chart in Kite like its in the Pi
Dear Nitin,
i have noticed renko bricks are repainting/vanishing on kite..it shouldnot be the case! ryt??
Renko bars for a period that has not ”completed” (last bar) will be drawn with whatever partial information is available at the time, but upon receiving more data for that same period, they will be recalculated and redrawn.
As such, a bar does not become permanent and it could change until it’s current range period is reached.
If you don’t want to see too many bricks vanishing, recommend him to choose the 1 min timeframe
Hi Matti,
Like Anish, I have same query, which probably is not answered in your reply. It so happens that (assume the brick size to be 1 for argument sake) after forming one green brick (B1) completely, next green brick (B2) starts to form. This brick keeps moving up and down. When the price falls below close of brick B1, then the brick B1 also starts diminishing. My understanding is that, it should have been fixed now. That is, the price can go down but the candle should stand. If the price further goes down, the red brick should form but B1 should stay.
Please help in clarifying the doubt.
Regards
Ujjwal
One suggestion is that
When we want to comment on any topic created on zerodha website then we have to go hundreds and more pages down for commenting . Which is very irritating.
So please made available this comment box at exact end of topic so that we can easily comment.
Hello
I have also few problem in Kite Android App .
1st Most of time in 1 Minute timeframe chart doesnt work , cant use anything ,it got unstable and take action sometimes after 20-30 seconds .
2nd is when i clear my preference then my all saved view gor deleted , why all saved view are deleted when you already have close button in saved view list from where you can remove any saved view ?
I just want to clear prefence which are common for every chart ,which is automatically applied .
3rd in morning after market open most of time i am not able to see my saved view.
4th how can i get back my saved view if i have cleared my preferences ?
Thank you
Today Morning Google Provide New Update For Google Chrome So I’l Update My Chrome Browser Afture Update In Zerodha Kite Chart & Market Watch Is Loding Non Stop Plz Fix This
BTW In Mozilla Firefox Everthing Works Fine
This seems to be a system specific issue. Best get in touch with our support desk on 080-40402020, Adit.
How many preferences kite save?
As I saved more number of chart preferences (Drawing tools analysis on chart) , lost the previous charts saved data.
There is a problem in viewing the charts ,lets say when A chart is opened it will open correctly with the settings but again when i am opening the B chart my complete settings is gone and blank . i again need to open the B chart with older settings by refreshing the page .its became completely difficult to perform this when i am viewing many stocks for selection in live market. if u can tell me the solution then its ok or else i disheartening switch over to Upstock like my other mates.
please consider my req.
Thanks & Regards,
Vigneshh.
In multiple chart Instead of left & right can it be placed two 2 charts like top & bottom
Hey Murugan, I’m afraid that’s not possible at the moment.
Always showing the wrong information in Portfolio section if I trade in the same share on daily basis(buy and sale) then every piece of information is wrong whether that is average price or Holding amount (only information which is correct is the number of shares I hold.)
This is for the kite By Zerodha (IOS app as well as for web version).
Hello
I am using kite on mozilla firefox it only shows me historical data of three months
from date 30th January.
analysis cannot be done on only three months historical data
I would like to know this problem is with kite of I need change settings. ( it shows only three months data after clicking on year, 5 years or all options on below right corner.)
pls Reply
Dear Nitin ji,
I am using mobile app kite but now a days chart is not opening in this app on mobile,when i go to chart option it shows chartIQ not supported on this platform have uploaded new kite app after deleting my existing mobile app,but still chart is not opening, i have called to zerodha customer care they replied that you have to migrate chart setting after opening page on web but after doing so i still not getting any chart on my mobile app, only ”chartIQ not supported on this platform” flashes on mobile app .
It seems there is problem with this app now a days because earlier we were able to see chart on this mobile,due to this i am unable to take any trade,
My use i.d. is YI0598 and mobile no. is 8477866777 .
Kindly do the needful.
Today morning when I saw on mobile application kite .. my saved chart setting all vanished ..What is the issue .Why it’s not showing my saved setting in saved option . It will come automatically on Monday or again we have to do setting. If again have to do then why it’s removed you it . Is any reason to give trouble to ur client in anyway..
We’re migrated from Kite 2 to Kite 3 over the weekend. If you wish to Migrate your chart settings, log into Kite on the web and click on the Migrate button on the dashboard.
Why isnt, charts showing today’s (20.03.2018) candle?
The day end data is synced on the chart sever post midnight. The data starts showing up from 6:30 AM.
Hi Zerodha Team,
How can I edit the levels of Fibonacci Retracement in Pi/Kite? Currently levels of Fib. Retr. are different in Pi & Kite. Kite has levels- -61.8, -38.2, 0, 38.2, 50, 61.8, 100, 138.2, 161.8
Pi has levels- 0, 23.6, 38.2, 50, 61.8, 100
How can I edit the level of Fib Retr. in Pi?
I’m using kite 3.0. Can anyone tell me when will live streaming charts available as we have seen same in kite ios/andriod app?
TIA
Is it possible to have a feed back blog where you can crowd source ideas for improvement.
Where you can also let us know what are fearures that will be rolled out in the next iteration that you guys are working on . So that we understand these improvements are work in progress and we dont have to keep asking for the same.
Thanks
Rohan
Hello,
I would like to bring to your notice few bugs that i found in kite UI
Kite – Mobile
1. Search feature in studies is not working.
2. Views in kite desktop dont showup in kite mobile and vice versa.
3. The scroll button does not work properly. random studies get selected.
4. can you enable option to exit from ”postions> exit” also along with or orders tab
Kite – Desktop.
1. No scroll option under display.
2. When we open multiple charts eg 4 Charts. the selected view/studies are applied only to the 1st chart.
remaining charts dont display any views/studies
Hi Team,
My charts setting are not getting save in my kite app , every time i switch to another securities previous setting are getting are vanish only candle stick chart is opening.
Hi, team Zerodha,
First of all…great experience with Kite 3.0..Loving it!!
Few requests/suggestions:-
1. Make it possible to view ”complete” details of SL-BOs after placement of orders, so that one can cross-check all the entered values – currently only ”Trigger” and ”Price” values are shown in ”info” and it’s not possible to see entered SL, Target & trailing SL values anyhow- no at least before the order is Triggered.
2. In COs, allow for SL value in terms of points also, rather than just absolute price.
TIA
Dear Team,
i am new user for Zerodha platform, i am using both web based and mobile application.i save my some graph views saved on web based application but that same is not getting on my mobile application.like what ever watch list i have its shown same on both platform so why not able to see saved same graph view . is there any solution for this?
if there is no solution then please make any solution for this which will give us best preference to use any platform anytime and anywhere.
Hey Pankaj. These chart views that you save are saved locally on your system. So, no way to sync across devices as of now. We’re working on making this possible though.
dear team,
i am comparing to web based and mobile application . in this where chart views are saved on local system.
The views are stored on your computer and not the cloud, so accessing the same from the mobile isn’t possible Pankaj.
HI
This kite 3 charting is wonderful and i am enjoying it but since a few days Kite 3 charts update only when they are in active tab of mozilla firefox latest browser. the charts in other tabs don’t update. I have to refresh them again and again.
Till a few days back the drawing i made on charts were retained and available even after many days but from last few days this has become in consistant and i have to redraw everything again. Currently using Mozilla Firefox 59.0 (64bit) on Win 10
please update the kite for drawing demand and supply zone area like trade tiger platform of Sharekhan
Hi,
MACD, Stochastic, etc doesn’t have the selection for MA type(SMA,EMA or other). Is there any way to do that? If yes, please let me know. If no, kindly incorporate in new version.
I am using the Kite. But I am not able to save the charts after the day. I have to once again open the charts fresh and view. This is creating problem and time delay. Also I am not able to continuously view the Ask and Bid like in case of Pi Market watch. But I was using Pi earlier. But it is having a lot of software problems and it is hanging many times. Can you to tell me how to overcome the problem?
The Kite charts seem to show inaccurate data everyday around midnight for a few hours on both Kite mobile and desktop site.
By inaccurate data i mean -> The most recent day’s data does not show on the chart. It does show the latest price in market watch (in kite 2.0 desktop, in kite 3.0 this value is also wrong.) but when the candlestick chart is opened the data is missing for the most recent day.
Kindly look into the above mentioned issue.
Waves indicator not present in kite . And all the indicatorsare not available in pi such as vortex , adx etc.,
Not able to see Indicator Value in data window (Information Box) or on Top of chart….
Thanks for Help in Advance
Rgrds
Dolly
Today 19/12/207 till 10:10 my charts is not showing and i am in position no one is piking call in your support.
No issues as such. Charts have been working fine all day.
Hi,
Is there any way i can lock the scale on y-axis. I am viewing charts on kite app and currently whenever i open new scripts, different timelines the y-axis scale changes which then i have to readjust to my liking. The saved views also does not remember the scale chosen. Can i set a default scale in which all charts will open ? if not, can you please consider this in future updates ?
Thanks,
Om
Will try to make this happen in future. However, this is how most users like it as the vertical axis is supposed to adjust according to the range of movement of the stock for the selected timeframe.
In charts I have saved 4 different views using kite Web.
In App (Iphone app) I am not able to see any of those views.
Please fix it. I have to use the kite using google chrome only. Even on Iphone.
How can I come back to normal mode from full-screen chart mode?
no buy / sell option on popur chart in Kite…kindly add and your system is very smooth..
Hey Faisal, check out the new Kite here. You can trade from the popped out charts.
Dear Matti,
i am unable to place buy/sell orders from popout charts, could you please help me
regards
Vijay
What is the error you’re seeing, Vijay?
is it possible to compare two or more company’s momentum data charts or any other ( studies chart ) ? like market price charts
Not right now. Will talk to the dev team and see what can be done.
Okay. A request from customer side.Please try to make those new things. No one has done it. Zerodha will be unique after doing such implementations.
I cant find Fibonacci Retracements in ’Studies’ option in Kite on the desktop platform though is mentioned in user manual; how do I find it?
Please keep clean and empty palace on kite , nothing required there. but alert is not available, you can add this . and one of the request please apply for Cryptocurrency exchange as soon as and keep your platform same as kite only.
Hi Nitin,
kindly add an option to save the chart for future reference, I use elliotwave theory extensively and I don’t see any option to keep track of my count on the chart once they are closed.
Also It would be wonderful to have more customization options on Fib’s; similar to Tradingview.com charts.
Thank you
Hey Srikant, you can save views by clicking on the ’Views’ dropdown and adding a view with all your indicators.
can you please add an option to visually and manually control stop loss on kite for trailing asap
We’ll try to have this in coming versions. Quite tricky to implement on a web platform.
thank you, visually controlling SL as and when the price moves in favor will help in capturing the entire trend moves and keep traders at ease. once again thank you for consideration.
Hello Nitin,
I am using Zerodha Kite platform for trading.It seems there is no VWMA(Volume Weighted Moving Average) indicator in the studies list.Can you please add this indictor to the studies in the upcoming releases of Kite platform?
In order to add a VWMA, in the moving average parameters popup, change the ’Field’ to Volume and ’Type’ to Weighted. In order to do this, however, you’ll have to apply the volume indicator first.
But this setup brings the VWMA into a separate section. How can we get that on top of the main chart / candle like other moving average lines ?
Since the VWMA would be plotted according to the volume, it’s plotted on the volume. I’m afraid it wouldn’t be possible to have this on the candle chart itself right now.
Hi Matti,
It should be plotted on the main chart like VWAP. VWAP also takes volume into consideration but in actual its a price. SImilarly VWMA takes Volume into consideration but the output is price only. All the charting sites and platform plot it on main chart like VWAP, so i dont understand why zerodha is plotting it in volume section.
is there any update on VWMA indicator line on the chart?
Hi Nitin ,
Can we add 25 and 75 min. time frame in kite charts.
Thanks
Haridas
Haridas, custom timeframes aren’t possible on Kite
Ok,
will it possible on Pi, with any bridge . I want 25 and 75 time frame with supertrend and heikenashi.
Thanks.
If the software you’re using for charting allows for custom timeframes, you can use the Pi Bridge to plug in data and plot charts.
How can I draw a line with the desired angle in the chart?
Rajesh, you can use the line drawing. You can watch the video on Kite charting to learn more.
Please give a timer in kite as well as an indicator which indicates internet connectivity is lost or connected.
Pls. add sorting facility in Holdings section of Kite App. It’s quite annoying to keep on scrolling up & down when there are many stocks in holdings and the ones that we are tracking on a given day are far away from each other (due to their default alphabetical order).
Also adding ”market depth” in holdings section would be great help. Pls. consider.
Thanks & regards.
Hey Santosh. Thanks for the feedback. We’ll pass it on to our developers and try to get this done.
How do I hide the middle bollinger band? Where is the option to hide the middle bollinger band?
anjay, there is no hide option, but you can change the line colour to white.
As usual Zerodha only gives ridiculous answers. There is absolutely no logic in your answers. Do you realise what you mean when you say change the color middle band to white or black? Even if the middle band color was changed to white in a white background, the white is still visible on the candles which is a distraction. Similarly if the middle band is changed to black in a black background, the middle band is still visible on the candles.
Sanjay, there is no hide option, but you can change the line colour to white.
Hello Zerodha,
I am using two same indicators in my chart (Supertrend) and I want both have completely different colors from each others, I am changing the colors of both, but when I open any other chart, it again shows the default green and red color.
So my question is, How is it possible to save the color preference for indicators? How can I save the indicator colors for always so that I don’t need to do the same thing for each chart again and again.
Awaited for your response.
Thank you.
I guess I fount the option, -> View >Save View.
BTW, Thank you 🙂
You can click on save preferences or save it as view and you can apply it to any chart you wish to.
there is no option for display of chart directly from holding list of stocks in kite web. Option of add and exit. Please include it. It will be helpful and time saving.
Iliyas, this option will be available in the upcoming update to Kite.
Hello Nithin,
Can you please consider including TTM Squeeze as part of the Indicator Buffet? Thanks.
Hi Zerodha,
Any news on the release date for Kite 3.0?
Sanjeev, coming soon, we’ll keep you posted. 🙂
Hi,
Kite RWI takes only 1 parameter where as AmiBroker takes 2 parameters.
I am using 30 min timeframe and it seems from every day first candle it starts a new calculation.
Value differs between AmiBroker and kite.
Could you please explain why kite is using a different implementation?
Thanks,
Deb
And Daily, Weekly and Monthly Charts are showing only 5 to 6 days candlesticks chart . I am not getting full loaded charts….. And is it possible to keep price alert or technical alert in KITE Charts…….?
Sir I am not able view Pivot Points lines on my kite i am using latest firefox browser. lines are showing more than pivot lines up and down. i am not getting clearity lines please suggest………
sir i am not able to make live ratio chart between two stock in zerodha kite,please provide me guidance
Since Last week i see that in Back office one cannot view a single day P&L. the default from date is April 1 2017.
Each day one cannot see the P&L.It always starts showing overall from April.The output does not help anybody.Please review.
Sanjeev, we have disabled that option for now. We are revamping Q and the option to choose date range will be enabled back again soon.
I want to open 5 minute chart of a particular stock for a specific date (example 28 aug 2016). How do I do it in kite ?
For now, you’ll have to scroll to the desired date manually. We are considering adding a jump to date option in the future.
Have you added Jump to specific date in all type of chart, as it is very difficult to scroll chart for long duration.
Hey Aniket, this isn’t available yet, however, there’s a range selector in the display menu that you can use to view charts for a particular range.
In kite, Zee Media share price in NSE is not updating. In BSE it is OK. Kindly look into it.
Zee media is trading in BE group, you need to add ZEEMEDIA-BE to your marketwatch. Tomore about stock categories check this post.
Hi Sir
I am using kite app at mobile for my daily trading but from last 2 day i am not able to trade because my charts are not displaying.
but if i open kite in explore everything working fine but mobile app not working
my mobile is Asus Zen 5
Plese help me in this regards My mobile is 9008283135
Rajesh, clear your app cache/data and login, the charts should work fine.
Dear Team,
Charts are not loading in Zerodha kite mobile app since 3rd Oct, i have cleared the cache and uninstall and reinstalled the app. Rebooted the mobile but no luck.
Cleared the browsing history of browse, i know that does not make sense but still i did. Raised a complaint today 4th Oct with your support team and have also shared the screenshot.
Kindly get this fixed ASAP.
Regards,
Deepak
Deepak, will have someone from our team to get in touch with you.
Deepak, will have someone from our team to get in touch with you.
I also have same problem
DJ9425
Hi Haridas. We’ve recently upgraded our charts. This has caused the charts to stop working on a few older versions of Android. Our team is working on fixing this and should be able to make the charts work on your phone soon.
Dear Team,
Your team is in touch with me via ticket which i have created, but i am not getting resolution. I have provided all the information and i have been told to upgrade my android version.
This solution seems stupid to me as how come app was working fine till Friday 29th Sept and since Tuesday started giving issue.
If android version was issue then it should have not working till now.
Anyways i tried to upgrade the android version but my phones system says NO UPDATES AVAILABLE.
I sincerely urge you check into this and get this fixed as many users are facing the same issue. Since last 3 days facing this issue.
This kind of issues should be kept a catastrophic or priority 1 and should get resolution in 2-4 hours.
I was Zerodha’s fan but now I am really pissed of this kind of service and forced to write here.
Regards,
Deepak
Hi Deepak. We’ve recently upgraded our charts. This has caused the charts to stop working on a few older versions of Android. Our team is working on fixing this.
Hi Team,
Chart is not working either in desktop and iOS app also. Is there any downtime on chart?
Harsha, on desktop you will have to clear your browser cache. In case of iOS you will have to reinstall the app.
Hi Nitin,
In my desktop application, the chart is not displaying. I have restarted my laptop, cleared the cache, logged out and logged in. Tried every possible thing. Can you please help me out.
Regard,
Ranjit Kumar Mallick
Ranjit, just clear your browser cache.
Sir , Thank you so much for your reply of my last query . .. Sir script ALERT is not available like NEST in Kite software, OHLC info box is disturbing chart , so please shift is near by upon chart near by drop down time frame menu. and most of the worst point of Supertrend indicator is, it indicates by arrow late after one candle, so please short out these problem.. About supertrend and Alert many people wrote here, but no response . please response about these topics. thank u
if i try to use pivot points in kite in chrome browser candles become small in size, this is very disgusting, please look into this one.
This would happen if the pivot levels of the scrip you’re looking span a large range. You can resize the candles by clicking and dragging the y-axis up/down.
Info box contains only OHLC and Vol values. Suppose I have applied stochastic indicator and I want to know value of it at any instant there is no option and if you move crosshair it doesnt show you exact values.
sir After today maintenance problem is that chat’s candles will become very small in all type of time frame.. ,,
yesterday it was showing very nice and long long. but today it feel like that you took the blood of candles after today’s maintenance.
What am i saying….. Just apply standard Pivot Point and look the chart ,, you can find the problem and please correct it.
thanks.
WE are running a new version, this will be fixed by tuesday when market opens.
Hi Nithin ji,
When are we going to get next version of Kite? I am having so many issues with Kite chart. Everything was working fine, till 3 weeks back. Suddenly my Maketwatch prices stop updating. Real-time update of my position price stop updating. I have to always do trade in market, since I do not know the realtime price. Today even charts are not updating. When i logged a ticket, i was told, it is because i am inside firewall and proxy server. But all were working like a charm before when I am inside the same firewall before. If i am outside firewall, looks like things are working OK. I cannot be outside firewall during market hours. Please help me.
VJ, this must be your system admin who has made changes on your office network to stop streaming of quotes. We haven’t done any change and nothing we will be able to do about this.
Sir, i am facing the same issue as mentioned in my personal laptop which i purchased recently. The charts are not auto updating in home laptop. Already tried clearing browser cache, allowed chrome in firewall ”allow app to communicate through firewall”. Please support
Aakash, will have this checked.
Nithin When will Chart IQ disable automatic selection of drawn objects when ever mouse cursor is moved in the vicinity of the drawn object? It is tiresome to draw objects in the vicinity of other drawn objects or delete drawn objects in the vicinity of other drawn objects. Are ChartsIQ taking any action on this matter Nithin? Trading view India is so much better in drawing objects or deleting drawn objects in the vicinity of other drawn objects as drawn objects are not automatically selected whenever mouse cursor is in the vicinity of other drawn objects.
Yeah, Shyam, we are talking to chartiq on this.
Hi Team,
In Kite, why don’t we have an option to fix a small window of Open High low and % change from last day.
Mr. zerodha, why Derivative chart(Future particularly) do not get readjusted post split action ?
We’re working on making this happen, will take some time though.
Hi,
How can we open four stocks charts at the same time in one screen in kite zerodha.
In this version not possible, we will have an update for this soon. Currently you can use a chrome extension for this. Check this video.
Sir where is chart compare option in Kite?
Check this: https://tradingqna.com/t/compare-option-on-kite/6739/3
Hi Team,
I understand Kite saves data on cloud and thus same view should be available on different machine or mobile. However, when I build some trend-lines on one laptop and try to access the same chart from mobile or ipad or other machine, I do not see my trend-lines and S&R zone. Please explain how can I sve these so I do not need to draw them over and over again.
Regrads,
Harshit
Harshit, drawing tools are saved locally. Also drawings made on one scrip will not be in context if you open another.
There is a problem with Kite today as all my charts are opening with RSI by default which is really strange. Yes bank price has crashed to 379.
You must have saved RSI as a view. Once you do it that indicator opens for all charts. You can create a new view. Check this video.
Pls provide Elliott wave labeling in Draw tools to label Motive waves 1-5 and Corrective Waves ABC.
Has Zerodha finalized Kite 3.0 exact release date?
Not yet.
Pls provide 1D, 5D, 15D, 30D, 60D setting for Kite charts so all chart data is not loaded and becomes heavy on PC/laptop.
Kite charts already has this option at the right bottom of the chart.
1. Can one plot Ratio charts on Kite/pi. e.g. Banknifty/Nifty and other relative performance charts.
2. Can one plot charts for straddles and strangles on kite/pi.
If not, is it under consideration. Please incorporate the above two features.
Thanks,
1. Check this https://tradingqna.com/t/compare-option-on-kite/6739
2. Not possible.
Zerodha Kite is so heavy on resources of the PC/laptop.
where to check kite version? how can i know that ?
Kite Web is auto updated, current version is 2.0. On the App, you can click on the Menu option to view the version. For Android it’s v1.9.28
Thanks for adding this feature (though implementation is partial but I am happy):
1. Also as there is limit for 20 scrips to be opened in one tab of watchlist, it would be great if you allow opening a chart without adding it to the watchlist. I can see, you have Search Symbol text box on chart which allows us to search among our watchlist, it would be great if this box allows results from all NSE and BSE with scrips in watchlist as top results and rest at the bottom of the suggestions list.
1. From my holdings, it would be really great if I can open a page with all the transactions done for that particular stock or at least the Tradebook page with the current script already selected and user will put the time range.
2. It would be really helpful if notes keeping is allowed for the holdings eg. my analysis, target, SL etc.
Reiterating my previous requests below if they missed attention:
1. Please allow opening of charts from the holding page itself. Its very tiresome to find the scrip in watchlist and then open the chart.
2. There is menu comes on hovering a scrip in watchlist, please add all those menu to come up while hovering holdings too.
3. When you hover on Day’s Chg in holdings page, sometimes it shows 2 different popups. I know one is the actual amount of change due to today’s change but whats the other popup for? Some scrips show only 1 popup.
Thanks,
Ashish Sharma
Thanks for your feedback Ashish, here are the replies.
1. NSE & BSE results do show up. Can you elaborate?
1. For this we’ll need integration to the backoffice, currently we’re running a vendor based backoffice and will be migrating to an inhouse app soon. Should be possible then.
2. Will pass on the feedback
Pvs requests:
1. Since the market watch is omnipresent, you can add the stock to the MW and open charts from there.
2. Same reply for this feature as well
3. One represents percentage and the other absolute.
Thanks Venu ji for the reply. My comments:
1. All NSE and BSE results are not shown in Search Box of charts. I will try to explain the scenario – Everyone has his own logic to maintain list of scrips in different watchlists (depending on sector, alphabetical order or type of trade -long term watchlist, short term watchlist, FnO watchlist , intra watchlist etc). I don’t want to add new scrip to any of my watchlist unless I complete my study of the scrip’s chart. Hence I requested if the Search Symbol text box on chart allows us to search all NSE and BSE scrips even if they are not in my watchlist it would help us to study its chart without adding to watchlist. If a user likes the chart, he can add the scrip to watchlist after that. The search results on the chart page should give matching results from watchlist/holdings as top results and rest from BSE-NSE at the bottom of the suggestions list.
2. Its great to know about in house backoffice is coming but can you please share the probable timeline for the same? I am sure, opening the tradebook from holding page would certainly be one of the most loved feature for the users. Please add this request to your list.
3. Thanks for passing on the feedback.
Previous requests:
1&2. Yes I understand there is a bypass as you suggested but if the menu that comes on hovering a scrip in watchlist is made available while hovering holdings, it would save a lot of time of all the users to going back to watchlist and check details. In Today’s competitive world, a service provider has to raise attention from the basic features to enhancing the user experience.
3. It looks there was a bug earlier which is fixed now. The popups are now uniform and show correct values. Thanks.
Hello Venu ji, can you please have a look at my above msg and respond those?
For ease, copying those below:
1. All NSE and BSE results are not shown in Search Box of charts. I will try to explain the scenario – Everyone has his own logic to maintain list of scrips in different watchlists (depending on sector, alphabetical order or type of trade -long term watchlist, short term watchlist, FnO watchlist , intra watchlist etc). I don’t want to add new scrip to any of my watchlist unless I complete my study of the scrip’s chart. Hence I requested if the Search Symbol text box on chart allows us to search all NSE and BSE scrips even if they are not in my watchlist it would help us to study its chart without adding to watchlist. If a user likes the chart, he can add the scrip to watchlist after that. The search results on the chart page should give matching results from watchlist/holdings as top results and rest from BSE-NSE at the bottom of the suggestions list.
2. Its great to know about in house backoffice is coming but can you please share the probable timeline for the same? I am sure, opening the tradebook from holding page would certainly be one of the most loved feature for the users. Please add this request to your list.
Previous requests:
1&2. Yes I understand there is a bypass as you suggested but if the menu that comes on hovering a scrip in watchlist is made available while hovering holdings, it would save a lot of time of all the users to going back to watchlist and check details. In Today’s competitive world, a service provider has to raise attention from the basic features to enhancing the user experience.
Problem with Zerodha Kite is that drawing objects are automatically removed when browser cache and history are cleared. There are others like Trading view India web platform and Metatrader web platforms where users can easily save drawing objects by saving as a template. Zerodha kite is limited to save view without drawing objects which is a huge drawback.
Clearing browser cache doesn’t remove the drawn objects. Getting someone to call you to help you with this.
Yes it does. If I clear history and cache all the drawn objects are gone which is really tiring to draw again. Even after I draw all the objects and save views for all banknifty scrips, once I clear the history and cache, and click on opening any of saved views, there are drawn objects shown on the chart. Very disappointed with Zerodha for this kind of poor setting. I trade primarily on kite because of trend line replication, price line, measure tool, etc which are not available on Zerodha Pi. Zerodha has looooong way to go in tweaking their platforms which will take years and years.
I typed wrong earlier as I actually meant There are no drawn objects shown the charts.
All drawing tools are saved on your browser, so if you clear history/cache, it will go away. Storing this on our servers is something we intend to do in future.
Nithin, After reading the above comments, I would like Zerodha to accelerate saving templates with drawn objects to cloud feature at the earliest as all traders are facing this problem. It is always safe to clear all cache and history for browsers after browsing for the day.
There is a huge communication gap in Zerodha. One person at Zerodha says all drawing tools are saved on your browser, so if you clear history/cache, it will go away and then other person at Zerodha says Initially, drawings were saved in the browser cache. But now even drawings are saved on the cloud server along with views. It shows how unprofessional Zerodha support staff are.
Shekar, my bad. This was implemented a few weeks back. I wasn’t aware.
Actually Nithin, your statement was correct, ”All drawing tools are saved on your browser, so if you clear history/cache, it will go away. Storing this on our servers is something we intend to do in future.” But your support staff were insisting that everything is saved to cloud. I checked myself by clearing cache and history and yes all drawn objects disappear and we traders have to draw them again.
Whatever happened to edit for Fibonacci? 78.6% is missing. Pls provide edit for fibonacci levels so traders can customize Fibonacci levels. Price tends to pullback to 78.6% level as well not just 50% or 38.2% or 61.8% levels only.
Hi Nithin,
My id DO0042. I am unable to save the indicators or templates which I made for any script. I tried by keeping the charts open for 15-30 minutes again if I open new one fresh charts opens up.It is really frustrating and when I open in my mobile platform blank chart opens up without any indicator which i made in my desktop.One more thing can you please is there a option called views in mobile platform.Kindly reply me .
If one want to save indicators or templates one just need to add them to chart and save it as view. On mobile also there is view option, open any chart in mobile app and on top left the second menu option, look like pin is the view option. From next time for support specific queries one can write to [email protected].
I am surprised that Zerodha has not provided any ’save’ button beside the ’saved views’ list? It is common sense to provide ’save’ button beside ’saved views’ list so traders can ’save view’ instantly and dont have to type in the exact name to save the view again.
Kite Platform GUI is not opening properly
Only links are displayed on web browser
Must be to do with the firewall. Can you email [email protected] with your client ID.
Zerodha should have bought Trade Interceptor mobile trading platform. Trade Interceptor mobile is the no 1 trading platform. It would have made a nice addition to your existing platforms. Thinkmarkets beat you to it and have bought Trade Interceptor mobile trading platform.
Some of the studies colors are faded which I dont understand why. Why dont you provide the same bright colors for all studies? Awesome oscillator colors are bright where as MACD histogram colors are faded? Is this a joke? When I change the MACD histogram colors to all black due to faded colors of the MACD histogram in an all white theme background, MACD histogram color appears grey and not black. Why is this? Pls be consistent in programming the colors otherwise it is such an eyesore.
Nithin, Pls provide a separate trend line drawing tool. Continuous drawing tool is cumbersome in the sense, we have to always hit Esc to exit the continuous drawing tool. Trading view India web platform also has a trend line drawing tool only. I dont know from where you people have got continuous drawing tool idea. Pls remove continuous drawing tool and insert trend line drawing tool which is standard and proper.
Continuous option is used to draw patterns, if one want to just draw continuous trend line one can select line option, if one want to draw limited trend line segment option can be selected.
Thanks Siva. I was breaking my head in how to draw limited trend line. Usually in international platforms, Segment is Trend line (limited), Line is Ray. Pls provide customization of drawing tools so that most frequently used drawing tools are shown first.
It is about time that SEBI approves demo trading accounts for Indian markets. Many of us would like to practice strategies on demo/virtual account before using a strategy on live account. All international stock trading platforms offer demo accounts/ virtual trading account to practice strategies using charts. Brokers should put more pressure on SEBI to enable demo/virtual accounts for practice so more people in our country can take up trading as a career.
Kumar, we have a plan for this. Will take more time.
Nithin, Pls enable customization of drawing tools in Kite 3.0 in such a way that frequently used drawing tools are shown at top of the list and rest are hidden with an arrow pointing down and can be easily seen when the arrow is clicked. I use mainly Trend line, horizontal line, Measure, Fibonacci retracement, Vertical line but if you see the draw tool menu horizontal line is way down and so is vertical line which is in the last.
Nithin, pls add save template option in the top menu in Kite 3.0 so the template can be loaded easily rather than saving views for each scrip.
Also pls add ’save’ ’overwrite’ options for saved views menu so it will be easy to save views rather typing the name of the saved view again and again.
Yes I know we can save layout in Kite 2.0 but it is not good enough as traders would like to save different templates using different studies. Pls incorporate save template, so traders can save 3-5 templates and apply any template in the pull down menu. Metatrader web platform and Trading View India web platform both have save template option. One can easily save as many templates as one wants with Metatraders web platform and Trading View India.
In the kite charts, when I do some studies and save it, the study gets deleted after a few minutes. Sometimes it remain for one or two day and sometimes it goes off in a few minutes and I have to again draw the desired study patterns. How to save it permanently or till I delete the study.
Once you add studies, click on save preference. Check this video.
pls enable search for all scrips in market ( Now if we search it shows only scrips saved in market watch coloum) .whenever i find market gainers and losers . first i add this in market watch then after i can view this chart it is more time consuming instead i search in already open chart search coloum it reduce time and without add i see chart which i want. see other web charting platform and do the needful. thanks
Ticket 649372
Not getting any update even after several update.
Finally had to close the order.
Hi,
Client ID: ZI2120
Name: Debraj Chakraborty
Today, I put a limit order MIS SL Sell Order for TATAMOTORS after 9:40 a.m. at Rs 383.55
This order got triggered and executed at 12.22.26 at Rs 383.55
How is it possible? Price never reached at Rs 383.55 after 9:20 a.m.
How can order be executed at 383.55 at 12.22 a.m. when price never reached.
I verified the price with NSE and it is confirmed that never reached.
Please revert the trade.
Thanks,
Deb
Received a lecture from support saying that every tick is not possible to catch etc etc…Though I understand that part but please understand my order is a SL order and as per my understanding Zerodha send the actual order to Exchange when SL is Triggered. As per Zerodha support that tick is not captured by Zerodha as it is shown in the price. Then How come it got triggered and sent to Exchange ? Can any expert clarify the process of stoploss order and at what point actual order is sent ?
Debraj, a stoploss order gets placed on the exchange. It isn’t that we send it only when the price hits. Check this.
You can check below link as well. https://zerodha.com/z-connect/tradezerodha/zerodha-trader-software-version/stop-loss-orders-limit-market Nithin Kamath says: February 8, 2013 at 12:19 pm
You only mentioned that order only sent when price triggers.
So you mean if we place a stoploss order Zerodha directly pass it to Exchange and exchange take care of stoploss order? Can you please confirm?
I have corrected the blogpost. I can’t fix all the comments on the post. Yes, as soon as you place a SL order, it is placed on the exchange itself.
Support point me to this below thread
https://support.zerodha.com/l.php?url=https%3A%2F%2Ftradingqna.com%2Ft%2Fi-placed-a-stop-loss-order-which-got-executed-but-i-dont-see-my-stop-loss-price-on-any-charts-be-it-on-nest-nse-amibroker-or-any-other-chart%2F577%2F2&auth=9f48e97eb2c223fbedf6fe3e54549071
but simply ducked the simple question I asked
How stoploss is executed from broker site? If they could not catch all the tick for technical reason then how they are able to trigger a stoploss order and send an actual order to Exchange?
and I got this below where it says
Order is only sent to exchange when it is reached and triggered at broker.
https://zerodha.com/z-connect/tradezerodha/zerodha-trader-software-version/stop-loss-orders-limit-market
Debraj, I am editing that post. Don’t know how it got missed. SL is placed on the exchange and not with the broker.
Deb, how did you verify price with NSE? Any trade that is executed on exchange can be verified here :https://www.nseindia.com/tv. Btw check this answer, I have explained why the price may not be showing on stock charts.
Hello
I have been using kite app to track nifty, from two days nifty chart is not opening in kite app plz help me out .
No issue as such from our end but will reach you on this, from next time for support related queries you can write directly to [email protected].
I just reinstalled zerodha kite in my mobile. Issues was, i’m unable to get my previous saved view. Please look into this issues.
Am unable to type a new stock name directly in the chart which is not already there in my market watch. Earlier I think this feature was there. Now if I want to check the chart of a new stock, I first need to add to MW and then chart it. Can this feature be added ?
Sandeep, it has always been like this. This feature is on our list of things to do.
Thanks Nithin
Pls change kite market watch it restrict more than 20 in one page otherwise change search tab in popout chart window . pls enable search for all scrips in market ( Now if we search it shows only scrips saved in market watch coloum) .whenever i find market gainers and losers . first i add this in market watch then after i can view this chart it is more time consuming instead i search in already open chart search coloum it reduce time and without add i see chart which i want. pls see other web charting platform and do the needful. thanks
Hi, In a chart after drawn a trend line or support & resistance line when I toggle to another script and come back the drawn lines are gone, studies & indicators are fine.But when ever I using drawing tool its not saved & every time I need to do it again.i clear caches and tried sill is not working .Kindly help me.
To mention at any point of time drawings are saved on 10 charts only, it follows FIFO method so if any new drawing is framed on 11th chart then drawings made on 1st chart will be vanished, for more clarification on this or if the scenario you mentioned is different then you can write to [email protected]. No limit on number of drawings on single chart.
Dear team ,
Pls change kite market watch it restrict more than 20 in one page otherwise change search tab in popout chart window . pls enable search for all scrips in market ( Now if we search it shows only scrips saved in market watch coloum) .whenever i find market gainers and losers . first i add this in market watch then after i can view this chart it is more time consuming instead i search in already open chart search coloum it reduce time and without add i see chart which i want. pls see other web charting platform and do the needful. thanks
Zerodha kite chart almost perfect but will you please improve little bit more like buy sell buttun on chart also multi time frame with sync crosshair like investing.com this is more useful and helpful.
Thanks
From Last 3 days, Kite is not showing any live price in watch list. It is always trying to fetch data.
Do I need to change any settings to make it work?
No, none. Could you call us on 080-40402020 and someone from support would be happy to help 🙂
Have you made any change on your antivirus/firewall?
Hi,
I use it from office if they change I have no control over it.
Do I need to set proxy for web version as well?
but other web charts like tradingview working fine.
Yeah, can you try setting a proxy and see. I am guessing the office might have blocked.
I called the number mentioned above and they said that I will be receiving a call from technical team. I did not receive any call but after 1 hour it started working.
Again today morning it is not working when I logged in from office.
Where to set proxy in kite?? I hope you are not asking me to change office firewall which is not possible. For you r information web version of other broker like Sharekhan and Ventura is working fine. Can you please look into it?
hmm.. Debraj, can you ask your system admin if they have blocked streaming on Kite. If they have, tough for us to do anything. I will anyways get someone check this.
wow..finally I made it work and traded. But discovered a hidden auto square-off charge of 23.6 rupees from zerodha. I went through your order types manual completely and it is not mentioned along with auto square off for MIS, BO,CO that auto squared is penalized like this.
Completely new for a trader coming from sharekhan or ventura. Not sure what else hidden can be expected here ???
All charges are here: https://zerodha.com/charges
I am unable to save drawings for individual stocks. Suggest me.
Check this video.
Sir, it’ll be very helpful to traders if u create an option for price alert on kite app. We will set a price with a condition, then when price touches or crosses that specified price, it’ll show a notification with sound or vibration. For example, a stock is being traded at ₹95. I have set an alert at 95.6 such that when the price moves up or touch 95.6, we will be notified by a vibration or sound. Please insert this new system. It’s very important
Yes, coming soon.
if layout option not possible in kite then pls add chart linking options for popout charts . thanks
We should have this soon.
[img]http://i.imgur.com/fqFbabX.png[/img]
Dear team ,
Pls arrange layout like this in kite . it is more useful to analyze a scrip as soon as open in Multiple time frame.
Hi Zerodha,
when i open Kite in Chrome browser or in android app or browser in android phone
am facing strange issue regarding charting .. the issue is .. whenever i open any chart (1 min, 3 mins or 5 min candle chart) by default it shows candles ONLY FOR 1 day or atmost 2 days.
So the EMA, SMA, MACD, RSI calculations are done based on just 1 or 2 day details which turns out to be totally and horribly error .. this is crazy and terribly bad.. never seen such a case in any of the trading softwares of other vendors!
the only way i can get something working is swiping the chart to see the left or historical data.. this is then Kite updates old data of 3-5 days old and all charting gets nearly corrected.
This issue is seen even if i switch time intervals.. means if i change from 1 min to 5 min.. only 2 day candles are shown again i need to do circus to get calculations corrected.
I tried lot of things like clearing browser cache, clearing preferences, pressing CONTROL + R keys, saving view .. Even trying on new machine on which kite was never opened.. but the issue seems to happen everywhere..
today 29th aug morning around 10 AM i sent email and still awaiting for response.
Dear Nitin,
I am a Kite user. Few requests from my side –
1. Can you pls increase the number of scripts that can be added to watchlist or increase the number of watchlists? Each time adding scripts and deleting scripts (to accomodate additional ones is difficult). I understand kite is meant to be lightweight, but still…?
2. The Draw button is on the right side. I have to go and enable it. Again come back to left side and select the tool. If I popout a chart I need to do the same thing again. My suggestion is keep the commonly used drawing tools (like trend line, support line, channel, fib) as part of menu bar (Provision to customise that bar will be great, may be in future)
3. Pi was great. I tried it out sometime back. But holding mouse for crosshair is painful. If you can fix that I will happily move to pi. 🙂
Dear Nitin,
Is there any way in Kite charts to show OHLC data ( on top of Charts) along with other indicators data which runs through charts like EMA ( on top of Charts) when mouse hover on any candle.
I have found crosshair a bit sticky. Can we change crosshair property from solid line to dotted line.
Thanks in advance.
Kaushal, you can use the info box to see OHLC without crosshair. Check this video.
Dear Nitin,
Unable to view 5 min intraday charts prior to 20 July 2016 (Checked INFY and MARUTI). This contradicts your claims” Intraday charts available from Feb 2015″.
No solution from your support team. What to do?
You can use 10 min timeframe to see more data as we have set limit on number of candles.
in kite there is data problem in chart when i see any chart like 5 min or 10 or 15 min candle chart and after click on refresh chart some candle value changes , i think this is data problem and this problem should be solved as soon as possible
I have answered here.
u didnt understand what i m trying to say , i m saying that in kite when i m watching live intraday chart of any minute and then if i refresh chart the candle value changes means open high low changes of some candle , why this happens , plz tell me this
Sir,
1. Unable to choose ”Exponential” moving average in Pi software in 5 min time frame.
2. Unable to view 5 min intraday charts beyond 20 July 2016 (Checked INFY and MARUTI). This contradicts your claims” Intraday charts available from Feb 2015”.
3. Would expect intraday charts atleast from 2010. The is necessary for back testing.
Please advise
1. No issue as such, provided more data is added on to chart on Pi. If still facing any issue please write to [email protected].
2. We have set limit on number of candles, if one want to view more data then can increase the time frame to 10 min or more.
3. May not be possible for now.
IN KITE plz add option of every moving average to make it thicker beacuse in default every moving avegrage is very thin so plz add option to make it thick and to make it dash or anyother format
Issue with bar chart not working. Kindly fix that.
somehow my kite charts are not working properly I am getting all the candles and bands look flat – very dificult to comprehend is it because of browser settings or what ? I have tried relogging as well but doesnt seem to work.
Have you applied Pivot points? If yes, then our tech team is working on fixing this issue.
I also feel it. Patterns are visible only when more data is loaded. Otherwise everything looks rather flat.
Hi,
What is the code/logic behind the kite studies ? I can see a difference in ADX values, when calculated using R packages versus kite.trade addins. Where can I see this logic if required ?
Thanks
Siva.
by ADX, I meant, kite.zerodha.com studies that I add for charts.
Check this link.
Thanks a lot Nithin!!!
Hi
please add in kite RSI INTERDICT 50 LINE, ( 80,20 )
THREE LINE IN RSI
Is there any tentative date for the next release of Kite with all the new additions ?
WE are replacing bit by bit at the back end. Front end, no tentative dates yet.
plz add buy/sell button on chart in kite , because while watching chart in kite and if we wanna take trade then we will have to go to market watch page and then find our script and then we can trade , because of this time running out and sometime price quickly up or down so plz add buy/sell button in kite chart so that we can directly trade from there……
there is no Open Interest Indicator in indicator section in kite so plz add this one because its very much needful indicator
The drawings are suddenly disappear. God knows when they will be saved or saved ones will be lost. no proper user manual at all details how this works. I had drawn so many drawing on the charts and suddenty they disappeared. No option to save the drawings.
Check this video on using Kite charts. Explains everything.
1- Can i use Fibonacci Retracement tool in Kite Chart ????
2- How can i plot the 2 Hour candle chart ?
3- Why response supertrande arrow in next candle ???
4- In commodity segment is available BO facility ??
if you have not these , then please resolve that normal issue.
Check the video on kite charts here: https://www.youtube.com/playlist?list=PLkxTRam6E2V-okv6gwQlt6dLTsn0v6CD1, no commodity BO yet.
hi
i am not sure if you have released the continuous charts or not but i can see it
just wanted to highlight can we have an option where if we select the default mode as continuous charts then every time we open the contract we should always see a continuous contract instead of going and manually selecting the option under preferences
Mayur, once you select continuous charts, can you click on save preferences. Once done, it should open up by default all the time when you open an equity future contract.
1. Sorting(marketwatch) should be added in Kite (available in Pi)
2. No.of stocks in each marketwatch page should be increased to 50 from 20.
Hi Nithin,
I am really happy with kite trading but only thing lacking in Kite is that there is no filter screen to short list the stock for mobile/web based users. Is it possible to add the real time filter screen in Kite for intraday trading as below:
Ex:
1. Stock last price from 70 to 200.
2. Technical indicator filter like
a) ATR from 25 TO 50 .
b) STOCHRSI from 20 to 100 etc…
3. Daily Change (%) From 2% to 10%
Have you checked http://screener.smallcase.com/
Hi Nithin,
Yes i have checked http://screener.smallcase.com/ but it is only EOD/SOD price not real-time data.
Dear Sir,
At present there are no holding in my account. however there are mutual funds in my account purchased through SIP in Coin. However when we see the holdings tab in Kite web it shows no holdings.
Please rectify this error. The screen should say there are no equity holdings / FNO positions.
Please help.
Regards
Bhushan K
Yes, if there is no equity holdings, MF holdings don’t show up on Kite. We are working on fixing this.
Dear Sir,
Any updates on this issue. still this issue is not yet fixed. Please do it so that the people need not login to Coin and they can monitor or see the holdings in equity and MF in one stroke.
Regards
Bhushan K
This will be fixed in the coming days Bhushan.
Dear Nithin Sir,
At present in kite web application, when we open the charts there is a option to compare the chart with another stock or futures.
However at present the system is allowing to compare the stocks or futures which are added in the market watch. This feature actually should be available to compare all the stocks in NSE / BSE or futures.
Please allow this to compare the chart with any stock even if the same is not added in market watch. Please consider the same if technically feasible.
Regards
Bhushan K
I’ll pass on your feedback.
Dear Zerodha Tech. Team,
As per my concern about kite zerodha web App it’s really nice and better app for trading but to make it best i have a suggestion that please provide us the 2 hour time frame in chart.
as your technical experts suggests to use PI app but PI app is not so much user friendly. So it’s a kind request to you that PLEASE PROVIDE US 2 HOUR TIME FRAME in KITE zerodha application.
And one more issue I am facing that always super-trend arrow is not reflecting in same web app. when I am refreshing the page or chart then it reflects for a moment (for 1 second or 2) only. resolve the following issue from you’r app too.
awaiting for your reply.
Thanks & Regards
Jayesh Sharma
Super trend arrow issue I am facing in current working candle.
I’ll pass on your feedback to the Kite developer team.
It’s a couple of months now and still, Fib is not configurable. This is serious and please bring back the custom fib settings, it’s very hard to trade when Zerodha decides what should be the only settings and not provide options for customization.
The new version is not good as previous was easily configurable and tradable.
hi
according to circular no: MCX/TECH/269/2017 today (01/07/2017) MCX OPTION mock trading is on ,,
how can customers of zerodha can participate in this MT,
MCX options are still not live for trading. This was only meant for Brokers.
Dear Nithin Sir,
When will be the new back office and new Kite 3.0 expected to be launched….
Waiting eagerly for new exciting experience with the new releases….
Please update soon…
Thanks
Bhushan K
We have already started replacing bits and pieces. The entire replacement hopefully in the next 4 to 8 weeks.
Dear Nithin Sir,
Please add Indices to the top with a real time clock on the Kite Web platform and android app as well.
Please consider.
regards
Bhushan K
Yes coming soon.
Hi my id DO0042. I got a wrong price execution in siemens script on 31/07/2017. Buy price is 1458.14 avg (50 shares) and kept sl 1443 but my stop loss was got hit at 1:06 p.m avg rate of 1442.25 (slm). Here my question is after 12:00 p.m siemens price never came down below 1450. I have checked in your zerodha kite,pi charts and even in sharekhan terminal and nse charts. How come it was possible to hit. Can you please explain.
My contact no: 9566068331.
I have answered it here.
Dear Zerodha Tech. Team,
As per my concern about kite zerodha web App it’s really nice and better app for trading but to make it best i have a suggestion that please provide us the 2 hour time frame in chart.
as your technical experts suggests to use PI app but PI app is not so much user friendly. So it’s a kind request to you that PLEASE PROVIDE US 2 HOUR TIME FRAME in KITE zerodha application.
Thanks & Regards
Jayesh Sharma
Hello Nithin,
Now a days I observer delay in update of charts, which are highly notable, the market depth info and chart bar ticks are not in sync, is it common problem or I need to make any changes in my work setup.
To note:
I use FireFox browser with 2Mbps line, tried with google chrome, slightly better than FireFox but the problem still persist
Any help in the right direction would be appreciated
Regards
Raj
Raj, can you email [email protected]. I can’t see any delay as such.
Hello Nithin,
there seems to be some issue with the Heiken-Ashi charts. To give you an example, select any stock future, say TCS Jul 2017 future, set the duration to 1HR, and candle type to Heiken-Ashi. The chart gets displayed. Now, if you click on the refresh chart button a few times, the values of the last 3-4 candles start changing. Sometimes even the candles’ colors change from red to green and vice versa.
I have tried it on different browsers, after clearing up the browser caches, but still saw the same issue.
rgds,
Sandip
Have answered here.
Please provide buy/sell option from the pop chart window. It is really difficult to reach the correct stock among the five watch lists and then place the order. This option is there in the mobile version, kindly provide it on the desktop version as soon as possible.
Jagdip
Can you incorporate the brokerage calculator into kite interface and show both net and gross P&L in positions?
why do we have to go to brokerage calculator if we want to see net positions… its not hard to add another column or for net P&L or give it as an option to users who want to see P&L inclusive of all charges (except of course stamp duty as even brokerage calculator does that separately and its anyway negligible).
It will make it decisions much easier and will be a windfall for traders!!
It is on our list Sid
Great! Waiting for it!!!
Hey guys,
Latest iOS kite update just sucks, let alone making it better its worse. Rates never get updated, its so frustrating especially when one is traveling and app is the only way to trade.
If you guys cant fix it at the least please revert back to its earlier version; It would be a great relief for small investors like me.
I am still not sure how on the earth did you guys release it without baking it right?
Hmm.. its weird, can you make sure that you have the latest update of iOS
Nithin,
It isnt happening just with me alone.. with all my friends and colleagues around, that said i keep my device updated all the time. I am forced to buy an android phone which i would hate to but looking at my android friends who have no complains of Kite App am left with hardly any choice OR switch away from zerodha which i would hate again 🙂
It would be really great if you could get this addressed asap.
Kiran, can you email me on [email protected] with your contact details. Strangely we are not able to replicate this issue.
Please add 2H time frame chart option in kite . Currently available in pi
I totally agree 2H, and also 3H would be very useful as market is roughly about 6 hours. Entries can be done in 2H or 3H time frames. Not much use for 4H as market is only 6 hours.
the option data is lagging , this is not acceptable … if this happen this month i am going to quit zerodha …
hmm.. lagging where? on market depth or chart? Haven’t received any other complaints. Can you email [email protected].
Hi,
There is a big difference shown in %change in market watch screen and day’s change in holdings screen in live market for many stocks. This issue exists from many days but I reported a couple of days back. I have emailed the issue with the screenshots to support but it’s not solved yet.
hmm.. shouldn’t. Can you share a ticket number.
Nithin,
Ticket #372550. I got the resolution confirmation. Thank you.
Hi,
Could you please include multiple studies for the kite-platform which can be saved in local machine ; each study may consist of multiple indicators. For eg, study1= Moving average, Stochastic or any more indicator etc. , Study 2 = Indicator1, indicator 2 , indicator 3 … , Study 3 = Indiator-x indicator-y , indicator -z …
Multiple indicators in one page sort of clutter chart. Applying different studies for different time-frames will ease analysis.
Thanks in advamce.
You can already do this Ajitesh. Check this video.
sir
how can add nifty other indices like nifty energy, nifty commodity, nifty consumption, nifty infra
If you search for index in kite search box, you will see all indices that exchange provides data to brokers for.
Hi Nithin Kamath Sir,
I do not understand why are you not replying my below thread.
Current Kite interface looks good and so simple.
but its good if we have additional page where we have all information like “Pi” software “Market Watch”.
where we have columns symbol(stock name), %Change, LTP, Open, High, Low, Close, Volume, bid qty, Ask qty…
Currently in “Kite” web platform if we want to see volume then we need to load chart and we can see volume for one stock. We can’t see current volume for all market watch stock.
This new feature will add great value in web platform https://kite.zerodha.com, like all other brokerage house provides this functionality.
Thank you for considering this additional page requirement.
Yes Kiran, this is on our list to do as part of Kite 3.0.
I completely agree with Kiran above. Volume is fundamental to trading and it is missing from Marketwatch (Kite) !!
Hi Zerodha,
Current Kite interface looks good and so simple.
but its good if we have additional page where we have all information like “Pi” software “Market Watch”.
where we have columns symbol(stock name), %Change, LTP, Open, High, Low, Close, Volume, bid qty, Ask qty…
Currently in “Kite” web platform if we want to see volume then we need to load chart and we can see volume for one stock. We can’t see current volume for all market watch stock.
This new feature will add great value in web platform https://kite.zerodha.com, like all other brokerage house provides this functionality.
Thank you for considering this additional page requirement,
Thank you,
Kiran
Hi!
I am a new Zerodha user facing difficulty with drawing lines on charts using Kite Android app.
Is there a video / help section for that.
Regards
Check the video on kite charts here: https://www.youtube.com/playlist?list=PLkxTRam6E2V-okv6gwQlt6dLTsn0v6CD1. On mobile, make sure to disable crosshair to scroll or use drawing tools.
Hi,
Can we have volume in NIFTY (index) & Banknifty (index)? or Any plan to add this. In Kite OR PI.
Regards,
Shradhdha
not able to trade for au finanace bank shares since morning!!!!
Why AU Bank is not allowed to sell on BSE???
You can sell. Add AU Bank on watchlist, and then place a sell order by right clicking on the watchlist.
Hi,
Currently future charts are contract wise.
Can you introduce continuous future charts?
Like current contract continuous chart.
This will help a lot.
Thanks,
Deb
We have just released this feature, not announced it yet. Under display on the kite chart, you have an option to click continuous chart. Once done, you can see continuous daily chart for futures. Currently the index continuous charts are proper, we will have stocks, commodities and currency soon.
Hello
you didn’t response my comments.. Can you explain Why ???????????????????????????
for example Just look above 2nd July 17 at 2.37.
Hope you will response me this time .. Please consider following feature
>A “alert” set it on LTP, When LTP goes up/dwon our setting Price then software give a notification.
> OHLC Info set between “search symbol” and “Time frame drop down menu” or you can make it movable
> 2 Hours Time frame
>Volume Weighted Moving Average (VWMA) Indicator. It very nice indicator.
Reg
Ashok
Ashok, if you have coding related queries, post it on tradinqna.com in algos section
Person incharge of the charting for both Pi and Kite is the worst in designing charting platform as he has no experience whatsoever in designing charting platform. For example: In Zerodha kite, when one draws objects, any object is easily highlighted as soon as the cursor goes close to it which is totally ridiculous as one is not able to draw or use other tools as earlier object keeps getting highlighted/selected. It is common sense to display small squares when an object is clicked on and not highlighted as soon as the cursor goes close to the object. It is a shame that we Indians cannot design a charting platform using common sense.
Kumar, Kite charting is not an inhouse platform. It is built by http://chartiq.com/, they are one of the biggest in the world and power a lot of international brokers. I have pointed out this issue to them.
Nithin,
I hope the above problem will be fixed asap in Kite 3.0 because the above problem is really frustrating to do technical analysis.
Use Metatrader web charting platform and Tradingview India charting platform. You will see how they have designed it cleverly in selecting drawn objects. Drawn objects have to selected by clicking on them, when small squares or small circles appear and only then can be modified. Pls make ChartIQ to incorporate this ASAP for Kite 3.0
While opening the account online, AADHAR option is disabled for me. It is showing as ” This is not available as you are not KRA/KYC Verified”. Only option is doorstep pick up. Can you please let me know if I can send the documents myself to your address instead of waiting for pickup?
Also can you please let me know the list required documents that needs to be enclosed with this form for verification.
Thanks
Yes you can courier it to us. Documents are mentioned here.
sometimes layout automatically cleared . what is the reason for this?
Maybe you are clearing your browser cookies?
Sir, plz add KDJ indicator in Pi software or in kite it is a best indicator and usefull. It is similar to Stochastic oscillator in this K,D is cover but J is play an important role. Bcoz of that GOOGLE FINANCE give this technique. Plz sir add KDJ…
Hello Sir,
Thanks for giving my last comment answer quickly & happy to use Pi Software… Thanks….
Hello Sir,
I am using Zerodha Pi Software. For Intraday & Positinal view in Nifty Future I am using 15 Minute with 60 days chart select in Pi Software.
=> Strategy is Use:-
– Surper Trend – 10, 3 is parameter
– EMA 13, 34 – Cross Over basis work (1st preferance is Super Trend only)
-> I need to Set up with Multiple Indicator with its parameter for Above 15 timeframe & 60 days, so forgot false signals… I need to use Exponential Moving Average- EMA. So, Can u please give me EMA Parameter for above strategy in 15 min chart with 60 days…
Hi,
How long does is take for correct data to be updated in kite after a corporate action? One of my stocks had a stock split in May 2017 and I am not still getting the correct avg cost reflecting in the Kite and Q back office. Inspite of calling for technical help, your team is not able to resolve it. They are not even sure how long it will take for the issue to resolve.
Are all your customers with corporate action on their shares sitting with incorrect data in Kite.
Atleast inform your customers properly as to what the issue is and what are you all going to be doing about it.
Your systems are showing incorrect data and no one seems to know what to do.
Hi,
I use pivots in kite chart with 5 mins timeframe.
As per the information I got, it should use previous days HLC/3 formula to calculate.
But value differs. I checked it for ITC, reliance, Infy
Can you please confirm what is the formula used to calculate pivot and on which data for 5 min time frame?
For Example,
Infy’s yesterday pivot should be 947.17 if we take day before yesterday’s
Close: 951.9
High: 955
Low: 934.6
Pivot: (951.9 + 955 + 934.6)/3 = 947.17
But open Infy in kite with 5 mins timeframe chart.
Yesterday’s pivot is shown 947.72
Why this difference?
Thanks,
Deb
Check this: https://tradingqna.com/t/why-do-pivot-points-differ-on-kite-and-pi-how-is-this-calculated/15780
Hi,
Please try to understnd my question. I already searched on net and found the answer you pointed in reply.
Still I will try to clarify once again. As per your pointed Q&A thread:
”Hello,
There are different ways to calculate pivot points, Kite and Pi uses slightly different ways and hence may not match.
The input for pivot point is High, Low, and Close (HLC) of previous candle.
On pi the previous candle is hard coded to day candle. So whatever chart time frame (1min,15mins, 30mins, 1hour, 4hours) the pivot points are calculated based on yesterday’s High, low and close.
In Kite it is dynamic,
Previous day candle HLC values are considered for 1,3,5,10,15 min timeframe.
Previous week candle HLC values are considered for 30 min and 1 hour.
Previous month candle HLC values are considered for 1 day timeframe.
Hence the pivot points may not match when looking at a 30min, 1 hour, or 1 day time frame.
Also, the way S3 or R3 is calculated is slightly different on Kite and Pi. See the formula below.
Pivot Points formula on Kite:
Pivot point (P) = (H + L + C) / 3
First support level (S1) = (2 * P) – H
Second support level (S2) = P – (H – L)
Third support level (S3) = P – 2*(H-L)
First resistance level (R1) = (2 * P) – L
Second resistance level (R2) = P + (H – L)
Third resistance level (R3) = P + 2*(H – L)
Pivot Points formula on Pi:
Pivot point (P) = (H + L + C) / 3
First support level (S1) = (2 * P) – H
Second support level (S2) = P – (H – L)
Third support level (S3) = Low – 2(High – PP)
First resistance level (R1) = (2 * P) – L
Second resistance level (R2) = P + (H – L)
Third resistance level (R3) = High + 2(PP – Low)
Note: S3/R3 values are calculated differently for Kite and Pi.
There are different ways to calculate pivot points (so both ways are correct), both kite and pi is powered by different charting engines and hence they differ. .”
So this anwer says that for 5 min chart I will get last Daily candles pivot as pivot.
AM I CORRECT HERE?
If I am correct in understanding, then please go through my question once again. I am posting it once again for your help:
For Example,
Infy’s yesterday pivot should be 947.17 if we take day before yesterday’s
Close: 951.9
High: 955
Low: 934.6
Pivot: (951.9 + 955 + 934.6)/3 = 947.17
But open Infy in kite with 5 mins timeframe chart.
Yesterday’s pivot is shown 947.72
Why this difference?
Hope I made my question clear.
I have answered here: https://tradingqna.com/t/why-do-pivot-points-differ-on-kite-and-pi-how-is-this-calculated/15780/3
Hi,
I know you choose to ignore this but still I will continue posting this till I get a reply from you.
as mentioned in the update that intraday data is present from 2015 feb…But we can not see it because chart can not load that many bars. Whats the use of that data if we can not see?
Please consider following feature
============================
1) Please add date range selection capability so that we can directly load some older portion of historical chart
For Example:
if we want to see 5 min chart from 2015 March to 2015 April, we should be able to select and load the chart only for that date range.
2) Atleast go to some date feature will also help.
For Example:
if we want to see 1 min data for 16th December 2016, we should be able to directly go there using this feature.
Please consider.
Debraj, you can’t open 1 min candle from 2015. But if you open 1 hour candle, you will be able to see it, the restriction is around number of candles you can see at one time. Date range is on our list of things to do, but will take time.
plz add open interest value in market depth option in kite , without open interest think how can one trade? so plz add it
Yes, on our list to do. Btw, you should check this on why you shouldn’t track intraday OI.
i need the the pivot indicator to show daily,monthly ,weekly,and yearly pivot this kind of functionality is available in tradingview.com charts ,also if i wish to see only the pivot and not resistance 1…5 and support 1…5 there should be a option to hide them
Hello Sir,
My another Que. For Intraday And positional Nifty future trading Which time Frame add in Kite Zerodha.
I have to use now Super Trend with 15 Minute Nifty Future Buy Sell Trend Identify. And If 15 Minute chart show Buy Signal then open 5 minute Nifty Future chart and when show super trend buy signal. It is perfect.
I know Super Trend with another Indicator filter is better stretagy, so can u please tell me Which Indicator is I will be Use with Super Trend Indicator For Nifty Future Intraday and positional with Time Frame.
Suggest you to go through the technical analysis module here: https://zerodha.com/varsity/
Hello Nithin Kamath,
Can U Please Open Below link and tell me how to open in multiple chart or nos. of 4 charts in 1 Google Chrome Window in KITE Zerodha Chart??? So, Can I will be use multiple chart in same browser window with Kite Zerodha.
Zerodha Kite Multiple Chart same Google Chrome Window Possible Like Below Image
https://kite.trade/docs/kite/images/trading-screen.png
That is using a browser plugin. Check 7.20 on this video.
Dear Sir
> it is a great update and great work , thanks a lot for it.
> can i hope to you for some addition tools, if yes then please add 2 and 4 hours time frame, like PI, because indicators gives great profitable response in equity and silver in 2 and 4 hours time frame, with some deep SL.
> A ”alert” required, you can set it only on LTP, When LTP goes up our setting Price then software give a notification.
> Can you set OHLC Info between ”search symbol” and ”Time frame drop down menu” or you can make it movable.
I hope you will work on that points… Thank a lot in advance.
Ashok
Dear Nithin Sir,
Please inform how to update the correct price of the CDSL shares credited to my demat account. the same is not available to be shown under discrepant quantity and rate place.
Due to this the P&L is not showing correct. Please guide.
Regards
Bhushan
Check this.
Why dont you position the zoom in/zoom out icons in Zerodha Kite near the top menu rather than at bottom in charting area so they dont cause a hindrance when panning the screen left or right. Why dont you provide a customizable quick access tool bar for frequently used charting tools near the top menu rather than clicking on the draw and then again the pull down menu of the select tool menu? Pls use some common sense in organizing the layout from traders perspective.
Nithin,
The BO leg works in an unexpected manner even after facing and reporting it earlier. Today as well faced similar loss of capital.
Information posted on ticket #317141. This is the second time same issue is faced. I was hoping that preventive measures were taken. Now I want to see what explanation is provided on the incomplete leg of BO being placed.
Your BO order is executed after 3.20, just before we run auto square off and in that session new orders were not allowed hence counter orders were not placed, mailed you the order book with time, you can check and revert to that mail.
BO order got executed at 3:21pm to be precise and which your reply it is clear that again same thing that clients are left with no option of exiting the order and relying on the auto square off to make us loss/win, surely there should be some enhancement in Kite which can remove this possibility of clients being helpless in BO which happened with me twice already.
But your reply on the blog and the reply on the ticket just creates stress for a client and there is no thought for a solution on it.
Pls provide a quick button to cut off the continuous trend line. It is very tedious to click continuous again after drawing a trend line. Otherwise provide trend line in the list. Seriously continuous for drawing a trend line. Why dont you make it easier rather than making it complicated always. Zerodha always wants to make it complicated by introducing cumbersome ways for using tools.
I have been using Android version of Kite. I want to know how can I switch back to Marketwatch view if I open chart of any script by clicking on Chart icon. I did not any option on the charting window. I have to close an application and come back. Please suggest. Regards
You have to use the back button.
Hi Nithin,
My name is Aravind. I am new to zerodha, but I have been trading with other brokers for the past 7 years.
First of all I would like to say that I am very much impressed by zerodha’s trading platform and its whole support system. I have found the technical analysis that kite provides, to be on par with if not better than, those of some of the other full service brokerages. Customer service is also excellent. On the whole a reliable service. Great job!
That being said I have found certain shortcomings with kite, even after the recent update.
None of them deal breakers, but still I hope they can be fixed in the near future.
Firstly, There is no option to choose 4 hourly or half day time interval for charts, which is one of the most widely used intervals for swing trading.
Secondly, The drawings that I make with the drawing tool are only saved for the last 10 charts. As soon as I make a drawing on an 11th chart, the very first drawing disappears. This can be really frustrating, especially for traders who like me, have quiet a number of stocks on their marketwatch.
And thats it. Hope you will fix these issues soon…
There is a hack to see 4H chart. Click on 1M at the bottom of the chart. You will see the candle change to 4H. We will give custom time frame soon. About drawing tools, they get stored on browser cache. If we don’t have that limit set, it can slow down the experience. Indicators there is no issue.
1. Please try to make chart more navigable(when multiple charts are opened); by placing big watermark or logo in respective chart.
2. Along with respective chart show current price, position and p&l status of that particular script.
3. It will help in quick buy and sell in multiple monitor setup.
Please add ’Buy’ and ’Sell’ button on the chart which comes after clicking on combined shapes.
Hi Team, please elaborate on what exactly ”saved views” saves (does it save all indicators? and / or drawings?) ……also let us know what exactly ”save layout preferences” saves? which one saves Fibonacci retracement?
I use different set of indicators and fib. for same scrip and finding it difficult to save them differently, making me do all indicators all over again everyday for the different set-ups.
thank u so much!
Save view saves indicators and not drawings. Fib is a drawing, it gets saved per scrip when you click on save preferences.
Sir,
please check#492247 ticket opened on 1 jun 2017.
i could not save drawings for 10 charts.it washes away same day if not then next day.Done,everything written on this blog and advised by support team.please revert back to old kite
thanks and regards
sir,
problem resolved
thanks
I too thought of the same first, so i tested at 2 different place with different internet speed and that too on 2 different PC with 2 different time frames and without of any cutoff of connectivity.( Mobile App also included)
1st was at 1 MBPS
2nd was on 8 MBPS
Only 1 Min time frame showed correct LTP
So if 1 min charts shows tick by tick LTP the on another time frames also the tick of LTP should be same as 1 min chart.
Eg. If crude oil LTP is on 1 min chart is 2077 in downtrend then 15 minutes ticks shows 2074- 2075
Is there anything else i should check. As internet connectivity has been checked without any drop downs.
Ah, I think you are looking at the Heiken ashi chart and not the candle stick chart. Check this. In heiken ashi chart, the close of the candle is calculated differently, so it won’t match LTP on chart. You can change the chart type to candlestick and this will correct.
It worked. Thank you sir.
But is there any method to get actual LTP on Heikanashi Charts too
No, HA charts don’t work like that. Check this: https://tradingqna.com/t/why-is-there-a-difference-in-the-ltp-on-the-marketwatch-and-on-different-timeframe-charts/15801/2
Hello sir, my querry is related different LTP is seen on different time frame chart than the actual LTP. Why it does not show the actual LTP. It is very difficult to trade in such condition.
This is on both the kite app and web
Plz sort this out.
Hmm…are you talking of LTP or charts looking different on different timeframe. Check this.
sir,
1. i was holding 5 shares of wipro in my portfolio.
2. its almost 10 days since split of share took place. because of that in my kite interface price of share reduced by 50 percent but yet number of shares are not updated.
3. i spoke to customer care of zerodha , he told it will be done but yet its pending . so plz update . its creating lot of troubles.
regards
Ratan, until the new stocks come to your demat, the price will show this way. It can take sometime before the new split shares show up.
Hi Nithin,
1. Is there an indicator (with different name, if available) for plotting Relative Strength?
2. I am not able to see use option of applying any momentum indicator itself (for example I want to use KST on RS of some Index). Presently any indicator/study applies on price data only.
Sorry typo in second statement above.
2. I am not able to see/use option of applying any momentum indicator on other momentum indicator itself (for example I want to use KST on RS of some Index). Presently any indicator/study applies on price data only.
One more point.
3. Many trading software platform provide options of smoothing the indicators and plotting both (original & smoothed) together. along with option of allowing lead/lag for one of them. This i can’t find on this charting platform. Everything is so hard coded.
1. There is a relative strength indicator itself. If you are comparing between symbols, there is a compare option too.
2/3. Checking this out.
Many Thanks for addressing. Just got a call from Shiva and things got clarified. Just one suggestion- add seperate indicator for relative Strength (In Technicianapp.com- Price Relative is there to compare two indices or securities). Then it becomes easier to manipulate this indicator for further studies.
I am not able to save views in kite web application. It is happening since 2 days. Has someone faced this issue ? I have tried in all browsers.
Hi,
as mentioned in the update that intraday data is present from 2015 feb…But we can not see it because chart can not load that many bars.
Please consider following feature
============================
1) Please add date range selection capability so that we can directly load some older portion of historical chart
For Example:
if we want to see 5 min chart from 2015 March to 2015 April, we should be able to select and load the chart only for that date range.
2) Atleast go to some date feature will also help.
For Example:
if we want to see 1 min data for 16th December 2016, we should be able to directly go there using this feature.
Please consider.
Hi, Is there any option to increase the size of the watchlist?
Hi Nitin,
Thanks for new interface for Kite, its really what I was looking for.
Few Suggestion
1. Provide 4H TF
2. Provide Ask/Bid(Top one) on Chart
3. Provide ATR along with OHLC in information box ( I do know ATR indicator but this will be helpful addition)
4. Alert Based on Custom Conditions and Price
5. Buy and Sell Buttons on Chart similar to Pi
6. Option to Save views ( Currently not working)
7. Pine Script Support on Chart ( Not thru API )
Hope this will be taken into consideration
Thanks
Sandip
1. There is a hacky way to open it, click on 1M option at bottom of chart, it automatically becomes 4 H TF.
2. Yes coming
3. hmm…
4. Simple alerts will come first.
5. Yes coming
6. It is already working fine. Check this video.
7. Pine script IP is held by someone else. So this wont’ be possible.
i cant find open interest in market depth in kite? so plz tell me where can i find it? and if its not available in kite then plz put open interest value om market depth, beacuse its a very common thing that should be there , and plz dont tell me that in pi its available , beacuse at my point of view pi is not good at all because one can not see chart in pi and trade beacuse in pi there is a big problem in zooming and if u wanna make pi powerful just watch how sharekhan tradetiger works i think zooming is much better in kite than pi so thats why i dont use pi so plz put open interest value in market depth , its a very common thing for trading that is not available in kite
It is not there currently, working on adding it.
I totally agree with you what you said Manoj. It is completely shocking to see how Zerodha has designed Pi through Tradelabs. There is absolutely no logic in the way they have designed Zerodha Pi for ease of use.
Don’t understand what’s wrong with that Kumar. If you’re comfortable using Pi, you’re free to do so. If you feel trading on Kite suits you better, please use Kite. We’re open to taking suggestions and implementing it for the better of our clients.
’Open to suggestions and implementing it for better of our clients’. Not entirely true. If you were then you would have paid more attention in changing the design of your charting platform features based on clients feedback.
It is very scary as Zerodha servers have downtime issues and when the trades are not squared of before time, it is a huge loss. Zerodha does not compensate the losses due to server downtime. Pls introduce two types of schemes: One for Rs. 20 flat and other Rs. 50-100. In this way Zerodha can invest more for infrastructure and maybe also offer basic charting platform Zerodha Pi and advanced charting platform like Fox Trader.
hi
i just logged in to kite but when i clicked to open chart, the chart section opens blank graph. kindly look in to the issue. I tried on other browser also.
Seems okay, can you email [email protected] with client ID.
it started working fine after sometime. thx a lot for responding and I appreciate your service.
how can I customise timeframe in kite platform..
I want 4 hr. time frame candlestick..
Currently 4H by default is not possible. There is a hack though. On the bottom of the chart, you can see 1D, 5D, etc.. Click on 1M, it automatically opens a 4H chart.
Hi Nithin,
I am one of the early customers of zerodha and have to say the kind of progress you have made/are making is awesome. The latest kite chart is very neat and easy to use. Great job on that!
One request: Can you please add ”Behgozin Slope Finder” technical indicator to Kite charts studies list?
Its like 3 line code as shown below in amibroker code and useful to find the trend and helpful for both intra/positional traders. Hope you consider this request 🙂
——————————————————————
_SECTION_BEGIN(”Behgozin Slope Finder”);
Tr2 = Ref(C,1); // 1 should be configurable range: -100 to +100
Tr3=Ref(C,7); // 7 should be configurable range: -100 to +100
Trend2 = MA(Tr2,7); // 7 should be configurable range: 0 to +100
Trend3=MA(Tr3,7); // 7 should be configurable range: 0 to +100
Slope1=((Trend3-Trend2)/Trend3)*100;
Plot(Slope1,”sample text”,colorGold,styleLine+styleDots|styleThick);
_SECTION_END()
——————————————————————
Regards,
Balaji
🙂 Thanks, bouncing this off our tech team.
Does that mean, we will get it in some time? if so, any timeframe?
Thanks,
Hi Nithin!
How to customize block size in Renko Chart ? Is it possible to fix its size based on ATR 14 days ? If so, How ?
Thanks in advance.
Guruprasad
Under the studies dropdown on kite charts, you can see renko and next to that a settings icon. You click on it, you can enter the box size you want. Check this video.
You guys are doing an awesome job at Zerodha overall, great work! I did have one request though, I hope I am not too late. I wonder if it would ever be possible for you to add +, -, /, and x tools into Pi or Kite. This would be super useful for people that like to trade spreads or are interested in pairs trading. It’ll be an easier/cleaner way to view the spread than having to use compare, which is not too helpful in this context to be honest.
Could you please check the following situations in iPhone 5s in Safari browser with the kite charts.
1. If the chart is poped out (using the toolbar like button), it is coming properly in a new window. But if I switch the phone to landscape and portrait, chart in the portrait is not proper and not taking the whole screen area.
2. Tooltips for Refresh and Popout chart to a new window, buttons are not correct.
3. Once I popout out the chart to a new window, busy indicator is visibile till I press the refresh button again.
Nithin, Could you please also explain how the new mandatory call and trade charges are calculated which are applied from a few days back for auto square off time?
I guess this process also has some bug, because today I made sure my last BO gets executed completely before square off and Q- ledger I still see a call and trade charges are applied very weird.
Thank you,
Whatever is not squared off on your own,the order gets squared off by our dealer terminal and charged that Rs 20. If your today BO is charged even after you squaring off, I am guessing it is a bug. Will have this checked.
Thank you for your reply..
Got the exact timestamp details and it clearly shows that I missed to square off by 1 minute 🙂 but Rs.23 was deducted as opposed to Rs.20 as you mentioned above.
It is Rs 20 per service tax (ST of 15%)
Makes sense. Thank you for information.
Never seen such a delay by any broker on a ticket raised(317141). It is 2 weeks now without a response on the ticket. I guess no one is even looking at the tickets raised. Very poor in providing updates to customers..
Having this checked.
Thank you Nithin for your reply.
I guess someone from support team tried calling me. But I am sure team did not read all my comments on the ticket 317141 which also said that I am not able to receive any calls currently due to travel so please drop updates on the ticket.
From team’s comment I guess, by only talking to me will resolve the issue so I have given my current International number.
Waiting for their reply on the same:)
🙂 will get someone to write back.
Thank you for your help Nithin..
Someone did write back to me on the ticket.
But looking at the solution on the ticket 317141 I am amused how a high possibility of a bug on BO placed from Kite application is denied saying a connectivity issue with exchange. A partial BO BUY executed correctly and stop loss and profit booking orders rejected due to reason ”adaptor is connected to tap”.
In any case a BO should not be executed partially(it losses the whole concept of a BO) is my understanding.
If anything is wrong it should just reject the complete BO order, which leaves a customer with some options and no unnecessary loss.
I have replied on the ticket also with my comments.
I kindly request you to take a look at it as I think resolving this will help a huge number of Zerodha customers going forward.
Thank you,
Checking
Nithin, Any latest updates on this ticket please ?
Nithin, Still no resolution received on the ticket 317141. It is already over a 20 days now. Wondering if any SLA is setup for this one. Kindly share if any updates please ?
Will reach you on this.
Thank you for your help till now but no action taken to reverse back to my account. And also cannot reply to the comment in this blog. Kindly look into this.
in next update pls consider these
limit cover order
exit all position ( cover or mis or cnc at one click if something goes wrong )
separate window for admin position just like pi
easy screen split
quick limit order on screen…
Why intraday historical data do not show year? is it having data from 2015 Feb?
There is a restriction of number of candles that you can fetch on the chart, so if you want larger intraday data, convert the candle to a 5 min, 30min, 1 hour.
if there is a restriction on number of bars, can we select a date range to view the intraday data. Data is available but we can not see as chart do not support number of bars.
If date range selection can be introduced that will be real helpful.
Also, does pi tool has intraday data from 2015 feb? I only see 60 days.
Please introduce.This will be really useful.
Hi ,
i am new zerodha customer. i have taken account 1 year back but using now only.
chart and chart tools are not enabled in pi software for me.
can anyone help. do i need to pay money for that
Regards
Anil
Anil, they are by default enabled for everyone. Check this playlist on using kite and pi: https://www.youtube.com/user/zerodhaonline/playlists
Can you please add harmonic patterns to kite? Right now Gartley pattern is the only one available.
Also, please add the option of adding and removing levels in the fibonacci retracement/extension tool like most other charting softwares.
really confusing….if i use macd or MA it changes bar formation again…..
hii
2 renko chart of same stock, of same time frame showing different bar formation….why so…?
Check this link.
thank you….but not only live or same day charts… i still see difference in 2 same historical charts with bigger time frame too….when we try to study certain price movements with multiple chart types and if it shows different formation even 1-2 bar/candle too is not good i think…
lets say series of green bar in between 1 red bar…sometimes red bar missing, sometimes it shows….
Renko will get plotted based on how much data you are loading on the chart. If you start at an earlier point, the bars will be different. It wouldn’t happen with candle charts.
Hi Nithin,
there is one bug in Charting on kite web. Raised under ticket 498701.
Basically if you select 1 D (1 day) as timeline then current day candle mix with yesterday candle and combined 1 candle appears for today which is wrong. Yesterday candle comes correctly, but only todays candle is wrong.
Also when you open a chart then for 1 second it shows correctly and then immediately it start showing wrong.
Please correct it.
REgards,
Saurabh
I think it is because of time set on your computer. Can you change it to India time and see.
Hello Nitinji,
Could you please have a look at my request/suggestions for Kite I wrote 1 comment above @ ”May 30, 2017 at 2:14 pm”? It would really help to the users if these features are added to it.
Thanks & Regards,
Ashish
Yes, i have it on our list of things to do.
1. Please allow opening of charts from the holding page itself. Its very tiresome to find the scrip in watchlist and then open the chart.
2. It would be great if you add all buttons that come up on hovering a scrip in watchlist to come up while hovering my holding.
3. Also as there is limit for 20 scrips to be opened in one tab of watchlist, it would be great if you allow opening a chart without adding it to the watchlist. I can see, you have Search Symbol text box on chart which allows us to search among our watchlist, it would be great if this box allows results from all NSE and BSE with scrips in watchlist as top results and rest at the bottom of the suggestions list.
4. When you hover on Day’s Chg in holdings page, sometimes it shows 2 different popups. I know one is the actual amount of change due to today’s change but whats the other popup for? Some scrips show only 1 popup.
Elders Impulse system bar colours are finally working. Thank you for fixing the issue!
hi sir
kite is very good platform for trading I am very comfortable with it
but whenever I want buy or sell any limit order at coming price but order completes at current share price
example: today I wanted to sell ACC at 1588 but current price was 1592.80. I sell it using limit order at1588 but still my order was completed at 1592.80
Yes Nikhil, if you place sell order below current price, it becomes like a market price. You need to use SL orders with trigger for this. Check this post and video.
thank you sir
when will Quant get ready to use?
Will take some more time.
Hello Nitin,
You and your team are really making Kite better by every release (at times buggy but great updates as far as I am concerned). I was wondering if there’s a possibility in the next release to have multiple charts (2-3 charts) in one window?? Right now we have to pop out and shuffle between the tabs. I was wondering if another option of using multiple charts could be added ?
Let me know your thoughts….
P.S.. I know its possible in PI but I find Kite a lot easier
Regards
Rudra, check this video. Hanan shows a chrome extension which can be added to give you that effect of 4 tabs in one view.
I somehow missed to say thank you earlier. Thanks a lot that worked. Waiting for the new version of Q – anytime soon ?
In the next 4 weeks for sure. Atleast I hope. 🙂
Great, will look forward to it
Is there any option available to remove remove default grid-lines in Kite chart ?
Yes, go to display and then click themes on the chart. You can change it to whatever.
I don’t think we can remove the gridlines from the Kite chart?
I have change the color of grid line to that of background. It is not exactly removing them but you can try and see the results
How you changed the color in IQ chart.. is it possible to remove grid line
Hey Karthikeyan, you can change the chart theme on ChartIQ by navigating to ”Display” > ”Themes”.
24-05-17 auropharma till 10-12 am low is 531.40 and chart not showing that low , beacause of this my trade executed , then who is the responsible for this? i think there is too much data problem in kite , candle repainting also , plz solve this issue as soon as possible and i also check with sharekhan chart it shows that low that means something very big problem in kite data plz solve this issue
Reply
Check this answer, there is no issue on Kite.
Hi, I’m using kite app for last 6 months.its very fast and user friendly. I appreciate the effort you and your team is taking to give us a flawless performance while doing trading
I’m having some suggestions that I think will be helpful to the most users.
1. In the app and software kindly add an option for the P&L which will display the profit and loss after deduction the brokerage and taxes (profit or loss I made in my trades which I can get In hand) while doing the trading. The brokerage calculator funta in zerodha website can be used with our stock that we buy or sell with the quantity to get the P&l in the display.
This will help us to how much real profit we made after in intraday trading.
2.kindly give option for getting alert or pop up if the stock price change as most of the people doing the intraday trading will check on the chart whole time and will miss the changes that came in other stocks.
3. After market hours most of the stock in the marketwatch will show zero. Pls try to display the value.
4.Another App with the above said suggestions and news like notification in the market like bonus, dividend, split offerings and quarterly result will help us to be in touch with market and no need to use any other app or software to do market research.
Hopefully some of the suggestions are valid and hope we will see our profit after all deduction in future updates.
1. Yes on its way. By the way, you can check this on Q.zerodha.com.
2. Yep
3. It doesn’t show zero. Are you sure.
4. Yeah, working on it.
plz add buy and sell button on chart in kite so that we dont have to go to marketwatch everytime to buy or sell , its taking so much time
Hi,
Kudos for the great effort on the new Kite.
I am facing problem with the Elder Impulse System, where colors (Blue, Green, Red) are not working. All bars are shown as Black. Few other people have also pointed out the same.
Request if you could look into this.
Yes, Elders Impulse system is not working. i have reported this multiple times but it has not yet been resolved. Can we atleast get the older version till this new version is fixed? this has been pending for very long time .
Hi Nithin,
Chart is not updating correctly, it is very very slow. frustrating to trade from Kite now.
below massage appears on browser
”No storage space available. Possible causes include browser being in Private Browsing mode, or maximum storage space has been reached”
never faced such issue on older version, hope u will resolve this issue.
Chethan
Chethan, can you clear your browser cache/cookies. It should work. Checking on this.
I am facing the same issue. And if I clear the browser data then it’s deleting saved views on Kite. Basically resetting everything.
And because of No Storage Space available issue charts are not able to refresh.
Kindly help.
I have tried clearing browser data but still same problem is exist. I am using Kite on Firefox Mozilla.
This issue is occurring again. I am getting the error ”No storage space available. Possible causes include browser being in Private Browsing mode, or maximum storage space has been reached.”
i cleared cookies and cache and yet nothing is fixing this issue.
Am still getting the same error inspite of clearing the cookies and chache in Firefox.
”No storage space available. Possible causes include browser being in Private Browsing mode, or maximum storage space has been reached.”
Please fix
Same here. Everyday charts are getting stuck
Hey Prem, the charts are working fine from our end. Could you please create a ticket at support.zerodha.com with more details, so that our team can check and assist?
Hi,
This is Naveen and my client id is DN3906.
The issue is regards to with RENKO display on Kite. Before one week, the renko dsiplay was working fine without any issues, but now I am unable to see the the uptrend and downtrend (RED and GREEN) arrows. I have already escalated to Zerodha support, but still there is no response from there end. Also, I checked with my friend and there was no issues with his login. Please look into my login and let me know if there are any issues or do i need to change any settings to view the correct RENKO display.
Thanks
Naveen
Naveen, just read the ticket. In the first chart where you are seeing red/green arrow, you have added supertrend indicator on the chart. The second one you haven’t added, hence you are not seeing these arrows.
As instructed I clear cache many times and save the views but worthless the views are vanished. Its really frustrating to set up multiple times. I’v not much knowledge about software programming but its not really cache issue its might be KITE updated reflect. Not only me about lots of User facing that. Kindly fix this.
Saving preference is not perfectly working as it saves them in Browser Cache. For me , somehow browser cache cleans up multiple times automatically, which leads to clear preference without even pressing button ”Clear Preference”.
Really frustrating to set preference multiple times in a day.
It works fine. Could you clear cache once and then try to save preference?
There is a mismatch between a candle and its OHLC info when I move the chart with backward/forward keys .
pls fix it.
i have reinstalled my laptop. but candle chart is not moving in kite app.
Why are Bracket Order and Cover Order blocked on Weekly Bank Nifty options?
It’s very useful while writing Put and Call orders on Bank Nifty, especially Bracket Order with trailing stop loss.
Please, can you kindly reenable it on Bank Nifty?
Shrenik,
BO/CO Bank nifty options have been blocked.
The position limit of a Trading Member(Zerodha in this case) in equity index option contracts(Banknifty option contracts in this case) is higher of Rs.500 crores or 15% of the total Open Interest(OI) in the market in Banknifty option contracts.
Since Zerodha as a Trading Member is breaching the 15% limit of total OI in Banknifty option contracts, we are blocking Banknifty option trading in Cover Order(CO) and Bracket Order(BO) effective 21st April, 2017 to curb any further increase to the OI through Zerodha as BO/CO are highly leveraged products.You can resume taking intraday Banknifty option trades using the product type MIS.
Here is the NSE linkdeclaring the same rule on position limits of Trading Members under Index Options.
When selecting fibonacci i am not getting edit option setting for fibo % select . like i want to select 23% and 78 % also the one with previous version was there please help
and yes i am talking about web version kite not mobile .
Fibonacci settings will come soon.
Hello Nitin,
When can we add/withdraw funds from the mobile app? Its very important feature must have in mobile kite app as well.
Please reply as earliest as possible.
Thanks
Shekhar Chauhan
Shekar, If you’re using the Kite android you have the option to add but not place for a withdrawal. The iOS app doesn’t support either. This will be added soon.
if i select any color as background in new theme option under display menu, that color is not appyling in background . just check that
My Kite chart only opening Ambuja Cement chart. When I click on chat button on any stock, it’s only opening Ambuja’s chart. Please Assist.
One thing I forgot to mention, the issue happening in Kite wb and kite app both.
Click on Layout -> Clear Preferences
I did this and the chart is loading properly.
Yes. Thanks. 🙂
Hi, my user id is DS7587, I am getting a strange problem in charts after you have updated this that the time it shows on chart in delayed by 3 hours like when the live market is 3.00PM it shows 12.00PM and so on (charts being live only but the time is delayed by 3 hours). I am using kite on internet & Mozila firefox, earlier it was showing the correct time but not now.
Hi got the issue, this was because of different time zone, but Cant you fix this thing as I am under different time zone right now, & it creates so much confusion while looking into charts, it should be fixed with market times not bounded by computer time/ time zones.
Bo (bracket order ) not work commodity only cover order pls update app
Hi Kamal, as of now the MCX exchange does not support bracket orders. Once they allow you’ll see Zerodha offering BO in commodities as well. BO is currently available for NSE, NFO, and CDS.
Pls update app cover order not work limit order
Cover order work only market order
Kamal,
Cover orders are market orders.. You can use BO (Bracket Order) that is placed as a limit order. A BO is a type of order where you can enter a new position along with a target/exit and a stoploss order. As soon as the main order is executed the system will place two more orders (profit taking and stoploss).
Check this link
Nitin,
When are you providing programming in Kite?
Sandip
Sandip,
Have you check out Kite Trade
Sandip,
Have you check Kite Connect? Read more here
On my chart the time in the footer is incorrect the range is from 18:00 to 23:00 hours.
How can i correct it?
Can you please clear the cache and check once again.
My user id DS7587, I am also getting same problem with different time, tried clearing the cache, browser history etc everything but not working.
Hi got the issue, this was because of different time zone, but Cant you fix this thing as I am under different time zone right now, & it creates so much confusion while looking into charts, it should be fixed with market times not bounded by computer time/ time zones.
Chart update looks awesome. But it is heavy and occupying 25% of my CPU most of the time. It often freezes my chrome window. So I switched to PI again. Please consider making it lighter.
Kindly allow the client choose old version. What ever chart I open it only showing IDFC chart only. Settings also chaning all the time. Somany bugs…It made me stay away from trading. Unreliable …
Kesav, Can you please clear the cache and check once again. You can save preferences Shouldn’t be happening. Can you send an email with the screenshot to [email protected]
Hi Sir,
The new version is very smooth….
Can i request to add Fibonacci projection tool in the chart ?
Thank you.
Hi Anand,
Fibonacci settings will come soon. Click on drawing tools, you can see all drawing including Fibonacci.
Hi Akshay
Thank you for your reply, but still my question is unanswered.
I am not talking about any setting in Fibonacci, and i know where Fibonacci tool is available in the kite, i am saying to add new indicator that is Fibonacci Projection and that is different from Fibonacci extension which is currently available in kite. Please visit below link.
Fibonacci projection is widely used in Elliott wave theory, it is based on the basic 1 – 2 – 3 price movement, for an example 1 -2 is the first price movement, and it will retrace to 3 point, after the retracement we can project the next price movement measuring 1-2 swing like 127%, 161%….so on.
Hope you understand what i am trying to say, and hopefully it will be included in kite which is missing.
http://www.chart-formations.com/fibonacci/projections.aspx
Thanks
This is exactly the concern that i struggling with too. Fib projections is one key aspect for Eliott Wave analysis.
I see the last message is in a dead-end. Is this feature in the near pipeline?
Retracements feature (that is currently implemented) works like a breeze. needs to be complemented with Projections as well.
Hey Sripathi, Kite charts are powered by ChartIQ. The tools available are built and made available by them. As such, it wouldn’t be possible to give you an ETA as to when this would be available.
How to add Support and Resistance in the New Kite
Dear Nithin
Appreciate your efforts. Thank you for the new charting.
The views that I had saved before the chart update are gone on chrome. They are still visible in firefox. I have cleared preferances on the chart and cleared my cache on chrome. No improvement. I could add the views all over again but wanted to make sure there wasn’t some quick fix that you could suggest.
Thank you again for the improvements and for interacting with us.
Tushar,
This currently works only on the same browser. Should be possible soon.
Hi Sir,
New version is really good. Your efforts are appreciable.
But its very slow. its making the system dead slow and taking time to open the charts.
I am using chrome and uc browser. In both browsers the same problem.
Can you pl guide.
thanks
HI Nithin,
In new kite update all saved views are deleting after clearing cache ,its hapeening repeatedly in all browsers,its even very tough and hectic to save views again and again.please resolve the issue.One more thing the views i saved in chrome browser are not visible in firefox ,opera..
Hi, Bhaskar Should work. Have you tried Save preference under Layout? Can you clear your preference once and then save.
It should work fine on other browsers as well.
hi akshay
even after clearing cache and save preferences the same problem all saved views got erased,please fix this soon
Hi, Nithin…
I’m unable to load data of lets say … three or four days or more … on my mobile… Could you please let me know how I would do that… Especially when I’m using renco Charts..
Hi Teja,
Renko charts are price dependent and time independent. You can increase the height/value of the Renko bar in order to be able to see Renko data for more number of days. If you’re still having issues, can you share a screenshot to [email protected]
Renko chart is not accurate. Time at the bottom appears to be inaccurate on each brick with size I have chosen
Dear Nitin,
Present iOS Kite app lacks with so many features and having lot many practical issues.
i escalated this and you promised that the Native iOS Kite App is being under development (almost 6 months ago)
could you pls update the present status and when can we expect the launch of the same.
Regards
Venkatesh
Dear Nitin,
when would be your new back office would be expected?
i believe it was long awaited since this year March…its Middle of may now.
Appreciate if could you let us know the actual status.
Regards
Venkatesh
Or may be you could revert back to the older Kite version till all the issues are resolved in the newer version.
Color Coding for Elders Impulse system is still not working. I mailed support and they told its fixed. But its still not fixed. Can it be fixed at earliest please , this is impacting my trading.
update
I am able to login now but orders are still stuck.
Is there option to enter limit order entry and exit in COVER order and BRACKET order in KITE ?
Bracket is limit entry. Cover is market entry for now.
Dear Nitin,
One request from my end. Could you please increase the font size to 10? Or give options to increase the font size.
Thanks,
LN
Hi Nitin,
Why I am not getting the indices like, Nifty, Bank Nifty and Sensex like I get that in Pi ? Or what should I have to do to be shown in Market Watch?
Thanks,
LN
Search for index in marketwatch, you will see Nifty bank nifty etc. Sensex is still not supported. Also check this user manual: http://kite.trade/docs/kite
Thanx Nitin. Got it. Need to prefix ”Index” . Thanks for the quick response.
Chart not opening in Kite App. Even I uninstalled the existing App and again downloaded new App. Please fix it. Every time I have to open kite on Google Chrome to see chart.
Bharat working fine here. Can you email [email protected]
Hi,
The kite has charting issue as soon as more than 2-3 TL / indicators are marked. In live market it keeps showing charts cannot be loaded due to low memory & then it either stops updating or slows down. Inspite of clearing cache frequently, the issue keeps repeating. The issue is on chrome on IOS , windows 10. In earlier versions have never faced this issue of low memory. Can you tell us why are charts suddenly needing so much of memory ? Please try to find a solution soon.
Hmm.. strange, it isn’t been reported. Can you email [email protected] with your client ID.
Hi nithin,
I have already mailed them on friday. ticket no is 697002. I have also attached a pic of the error which pops up.
I am also facing the same issue and across all my friends who trades. after at least one or two hour, i get message that no memory available, and it works damn slow and hangs. very often i have to clear cache and cookies, then again login. This is king of irritating.
Hi, Problem is because of TL and getting stored in chart memory. It is not making to delete the old trendlines and freezing/hanging the entire kite browser session itself. Please check and fix asap.
I am also facing the same issue. I am using firefox, windows 8.
Majority of your customers seems to be okay with you’re old chat versions. Old one was real simple and it was using ultra low bandwidth. But this one will stick and hang.
It’s good that you are innovating and always upgrading your products.
But first add your new upgrade as an option. Let customers try. If everything goes fine then take the previous one off.
Over confidence doesn’t work always.
i agree with you madhu sp
Dear Nitin K,
Your chart data is flawed. Check Daily of KTK bank and you will see a huge gap which was a corporate action for the rights issue. Gail Weekly has an additional top because bonus is not reflected.
I agree the data is free and you are a pioneer, but inaccurate data is really not acceptable.
Either stop the charting or improve your data. Check ET free chart servicehttp://economictimes.indiatimes.com/markets/technical-charts
Viraj, like I have mentioned earlier, daily data isn’t adjusted for corporate actions. We are working on doing it soon.
hi
kite chart is giving wrong candles, this is a waste platform ,,
Binu, what wrong candles, can you explain.
Dear Nitin,
The updated version is surely better then earlier version… But some issues need to be addressed. When I want to see periodic charts from the bottom right side buttons, like YTD, 3 months and all, the charts are not popping out as per my selection. Its showing as per 1 hour, 1 day, week and month charts only. Hope you fix this ASAP.
That is how it is intended to be. When you open a 1 day chart, we can show minute candles. If you chose 1 month, no point showing min candle, so the candle size changes to 4 h. Which means you can see the entire month trend in one chart. Check this webinar.
Dear Nitin, I congratulate you for this update but believe me I’ve checked everything, cleared whole browsing data. Having 2mbps airtel broadband, which barely gives me any problem once in a year. I called customer care also. Chart is not auto refreshing for me. Sometime getting error ”Error while fetching chart data, please refresh” but hopeless. Please guide.
Same problem
Same problem please help Nithin kamath
I tried with clear cache option, not worked.
Then I tried clear data it worked..all clear now.
Sir,
you can add buy and sell from Popout chart.
comparison on stocks in single chart can be still better my adding previous day price.
try to add top gainers and looser in kite terminal.
NSE sector wise details can be included in kite platform.
Hi,
Please give the option of Renko charts with tails so we can know the high and Low of each box. it is pretty helpful.
You have spoiled the chart completely. Super trend is working wrongly.
The Buy/sell arrows are not showing up on indicator, we are working on it. But it is a simple logic, if candle crosses the supertrend line upwards it is a buy and if down it is a sell. Exactly like moving average.
Not only that, also colour change and drawing of ST is wrong during the changing candle. Also can you compare result of earlier chart and current chart. It looks little different to me (may be perception). If you have both can you post both NIFTY charts with ST here.
The same chart still keeps opening, though you select different security/symbol. The title bar shows one which we select, but the chart remains the previous one. This is becoming more and more hectic. This was discussed on first day of update and it still exists.
Any progress or consideration?
Yes, true as Madhu said in previous comment. I am also facing the same issue. Additionally, when I cleared my browsing history and caches all my previous settings like studies- MA, MACD, Pivot Points etc. are gone and again I have to set those things. Is it condition that previous saved things will be removed when browsing history and caches will be cleared?
Hi ,
I like the previous version. The open high close low panel is blocking the view in mobile. Pls atleast make it moveable. Also in the earlier version the pointer crosshair are just one click away. Here we have make more taps in the mobile view.
Thanks,
sir when you will release updates for pi?
AND pls add feature of Order management through dragging lines
We are planning one next week.
Hi Nitin,
Happy to see updates.
I have 2 questions/ suggestions.
1. Do we have any chart or option to show % of delivery shares or delivery quantity along with volume of the stock in daily chart. It will be usefull.
2. Different colour in market watch for the scripts in security ban period, rather than knowing after placing order.
Thanks,
Vishwa
Thank you sir,
Charts working very well after after clearing preferences.
I really appreciate your prompt response personally.
but still will be more happier with customized fibonacci levels.
Is it now possible to place Spread Orders through the revised kite ? I am not able to locate any option for this.
It wasn’t working before as well.
kite getting hung or non-responsive frequently.Needs a lot of improvement.Unable to delete horizontal line once drawn,pivot appearing and reappearing even after deletion.click on any button does not respond. woh.
Must be your system specific issue. Can you try another computer and see if the same issue exists.
Is pi platform closed permanently?.Not responding for last 10 days on login.
Pi is working very well. Can you email [email protected]
pivot point value is changing at 30 min or above that should not be changed. i think support resistance for intraday will be the same in any timeframe. but its changing . 5-10-15 min ok but 30-60 changing.
If I am not wrong…..charts of 30/60 min shows weekly pivots….like wise daily charts show monthly pivots….while time frames smaller than 30m show pivots for the day
plz check in any other software in any other platform pivot point value will be the same except zerodha
I havent used any other platform, so cant comment….but i find this useful…bcos i can mark weekley and monthly pivots which tends to hold far more strongly than the intraday pivots using different horizontal lines and try to trade around them.
worst experience !!. not able to see clear graph. when zoom out graph it’s cropping. previous version was good. can you add the same for choose previous version.
You can reduce height of candles, check this video.
i am also facing the same issue …
NOW ITS WORKING WAY BETTER ON ANDROID,major irritating bugs regarding views n preferences seems resolved.
THANKS ZERODHA FOR rectifying IT FAST.
🙂
Please rectify other bugs as well.Thanks.
in old chart format multiple Zigzag were working fine
in new one …….. no such applicability …….. why !!!!!!
Checking
crosshair not working.Volume,high,low,close box disturbing unnecessary.Nifty spot does not require it at all.
working now
You can disable this if required.
Hi,
In the charts, we are unable to select the studies with a starting letter. Earlier this provision was there. Also the scroll provided is not user friendly, in fact it is not working with the up and down arrows. Please provide a search in the studies as given earlier.
Yes search will come soon.
if i select black background in kite , day seperator vertical line line is too light too see so plz make it thick so that we can see day seperator clearly
We have added custom theme option now. You can set those gridlines yourself.
Hi nithin ,
In this new update there is a limitation for the decimal numbers after .(point) not like previous version where there is no limitation.
Eg: 1.2233…
For currency it is upto 4 decimals
can it increase for equities too
hmm.. there is no need for equity.
In mobile, I still not able to add multiple moving averages. By default it is taking 50days for all moving averages and doesn’t allow to change days. Will it be fixed by today.
Works fine on all the devices I am trying. Getting someone to call you.
Someone called me, As per his suggestion I have uninstalled and reinstalled application cleared cache. But Maps are loading slow and same problem of MA persist. When I click on MA line there is a pop up like ma(50,ma,0,n) then settings button and cross button. but when I click on settings button nothing happens. If I want to change days from 50 to 10 I just can’t do that. Please help.
Hmm.. not able to replicate this MA problem. Works fine for me.
Thanks Nitin,
Currently MA issue is not appearing. But I will observe or day or two and confirm.
Thank you.
Hi Nithin Sir,
At present in the new chart in Kite web, search option is provided.
At present the search option works only for the scripts added in any of the market watch.
Can we make this search bar similar to market watch search bar so that we can see the charts of any segment without having the need to add the script to market watch and then add chart to it.
Please check feasibility and let us know the same.
Thanks
Bhushan
loading is smooth when compared to the last one, added some useful details, that’s really a good job. few features were gone, it may not be important but it would be nice if it’s available too in display options.
in previous version i could change settings of fibonacci tool, now with this update i cant find settings for fibonacci tool . please add this feature where i can change settings of fibonacci tool. thankyou
Y don’t push a message to kite for all users asking them to do a browser cache cleanup and other common error solving stuff….I am pretty sure tomorrow the complaints will be reduced by half
New Charts on phone don’t work correctly. eg. if i open chart for nifty fut instead of seeing nifty fut chart i would see banknifty or any other stock that in next to it in the list. also there are still issues with refreshing in 1min chart.
Hmm.. can you click on layouts within kite charts and click on clear preferences. It will fix.
Hi
In this new charting tool, I am not able to use custom color for bars. I used to use black and while bars. It was better on the eyes.
Please add the feature back.
Rajdeep
You will have it tomorrow.
This new chart is not better than previous one for me like small investor. It’s controlling are more difficult. To many problems like if new scripts chart open then open previous one.
Bandita, give it a couple of days, change always is a little tough.
sir when you will release updates for pi?
AND pls add feature of Order management through dragging lines.
Hi Nithin,
Chart experience is good but i feel old one was good. In mobile crosshair info is disabled which is very much frustrating , not able to understand exact candle’s high and low.
In Kite desktop version’s info is taking so much space in top, sometime not able to see candle for this info box. frequently need to move chart. which is again frustrating. Please do it more user friendly.
You can enable crosshair on mobile by clicking on the + button on right top. Earlier chart this entire top section of the chart was opaque and not getting used. Putting a translucent info box, there is more space for charting.
In the Studies drop down provide option to search the name of the indicator. If i have to choose some indicator with name starting with ’R’ or ’S’ i have to scroll a lot. Also try to provide auto-complete drop down. When i load chart the amount of data consumed is huge so cant think of loading multiple charts at all
Sir please add Gann angle
The draw icon is on right top and the drop down comes at left side, who designed this, did they use atleast once?
Unable to create image to share, clicking ”create image” button is not yielding the results, overall in the name of upgrade you just complicated interface 🙁
Yes, having that sorted.
Hi,
How to remove horizontal and vertical lines in it?
However your cursor/crosshair and right click.
The looks of the new chart is good. but some features I did not like. those are
1. when charts are open in a new tab and i was working on other tab charts are not updating.
2. drawings are not getting saved. every time i refresh charts drawing gone. which is very annoying.
3. search box in studies not there. as a result it took longer to search any particular indiacator
please add feature where default setting of users keep saved
thanks
1. Checking
2. Click on save preference after adding drawing.
In the chart in X-axis why is it showing 6’o clock?
For ex. on a 5 min chart…it is showing as marked closed at 10:25 hrs !!!
How to correct the time?
Can you check what is the time zone on your computer. It might be showing wrong if your computer time is wrong.
Hi, Cant you fix this thing as I am under different time zone right now, & it creates so much confusion while looking into charts, it should be fixed with market times not bounded by computer time/ time zones.
NO CUSTOM THEME NOW. I have difficulty distinguishing red and green. I have great difficulty understanding candles now. Please bring back option to change color of candles.
Now It is disappointing, disaster app. I have to reset indicator Avery 5 min.
Clear browser cache and preference in layout, will fix.
i am even ready to pay monthly subscription for the previous version of kite..if u cant change it,atleast try to sell it . i need the simplified form …i couldnt handle this new update constant disapperence of saved views and many more umcomfortable things which i dont wanna adjust and work…SO PLS SELL ME THE OLD KITE CHART SYSTEM ,I AM READY TO PAY ANY MONTHLY SUBSCRIPTION FOR IT …ALL U GUYS R DOING IS DEFENDING UR BUGGED UP UPGR
Rajesh, Clear browser cache and preference in layout. This will fix automatically.
Dear Nitin,
I have not yet received Activation link for PI from 5 days, Its just showing Activation pending. What is the matter? Also i am not able to add funds in commodity account. It does not show option of commodity in funds tranfer.
Kindly advice.
Will reach you on this.
color coding not working for Elders Impulse system. All bars are appearing in white color , even after choosing specific colors for bullish, bearish and netural candles. Tried it in chrome as well as Firefox, same issue seen in both browsers.
Allow to Place Limit Price with Cover Order in Kite like in PI.
Thanks for the upgraded version…However, there appears to be significant issues with the new software like
– Charts not getting updated real time for most part of the day
– A change in time period results in the settings and saved preferences (views) getting lost
– Picking up a new security from the watch list is still invoking the charts of the previous scrip
Kindly look into these issues at the earliest as the ’Refresh’ issue is really causing huge problems while trading
1. No issue as such.
2. Can you clear browser cache and clear preference, save preference once again.
3. Above will fix this also.
Thanks Nitin… However, the first issue which is and the most troublesome of the lot still persisting even after clearing the cache and recreating the views…
– Charts not getting updated real time for most part of the day
On further testing, I have realized that the issue crops up after you have already invoked 2 charts and have popped it out… When the chart for the 3rd scrip is popped out, one of the previous ones stops refreshing… Subsequent charts when invoked further accentuates the problem …. I have checked this in Firefox, IE as well as Chrome and the browser setting is not the issue… Kindly look into this problem at the earliest…
Your firm is doing a wonderful job overall but feel that this software has not been tested adequately before release… Not sure how this issue is being worked around by the other active traders!!
Aruna, it works fine irrespective of number of charts I have opened. The live feeds to popped out charts come from the main kite watchlist. If you have removed the scrip from there or closed that page, all popout charts will stop working. This is how it has always been.
Appreciate the prompt responses from your end and all the proactive steps taken by you to address the queries from the users grappling with the new version … The live session conducted by you has been useful…Its amazing to note the personal interest taken by you in resolving the user queries
But unfortunately the issue of real time refresh of prices with multiple charts still remains.. I have never faced this issue with the previous versions and bandwidth does not seem to be an issue either as I have been using Kite for close to 2 yrs now… It would help if your technical team can assist me with this during market hours tomorrow … thanks
Can you email [email protected]. We will check.
Sir I am too facing similar problem regarding Chart not loading after clearing my chrome data…………
Please Help!!!!!!!
VO1241
Manoj M Mestry.
Please create a ticket on our Support Portal.
unable to save the drawings. even after save preferences. plz guide me.
Clear preference on chart and clear browser cache once. It will get fixed.
Any plans of including volume profile on zerodha pi ?
Night theme is good & less strain on eyes when you are continuously looking at chart for 6 hours.
nPlease bring it back for charts & entire webpage of kite, an additional night theme option.
OLD VERSION WAS GOOD….IN THIS VERSION VOLUME IS NOT DESPLAYED
Its very nice..Keep up the good work … some bugs though
All drawings disappear on refreshing the chart..Please solve it
Can you please put alert & notes options
Dear Nithin,
Thanks for Updating ”Kite Web App.”
It takes few Minutes to Re-Learn the App.
till Date Experience, ” NEW Kite is Feather Lite ”
Thanks A lot ”Team Zerodha” … Your Action Speaks Louder. ( You Do care about your Clients. )
Updating kite was a splendid move , the charts looks slick , but it seems it has been executed poorly and not thought through . Please make the necessary changes needed . Its affecting our trading experience .
Problems :
1 ) Previous analysis all wiped out , seems no back up was taken nor were clients informed about the update to make some time and back it up some how through screenshots . WOULD HAVE TO DO ENTIRE ANALYSIS ON ALL SCRIPTS again .
2) Chart refreshed goes back to the old chart that was opened .
3 ) Information ( OCHL) dialogue should have been outside the chart as it was earlier .
4) New analysis is wiped out if the window is closed or if you log out .
5) Dynamic indicators for example RSI aren’t even showing the value .
6) Preferences are not saved . Chart will only open with the minute view rather than the day view that is saved .
7) Search function for studies is needed .
8) Full size options of the scripts that used to hide/unhide indicators .
Also today the scale of the chart is changing on its own or not adjusting to changes once the day view is selected from the minute view .
Hi Nithin,
I suggest stop all the advanced updates etc and concentrate on basic requirements of the traders.
– Consider entire day just refreshing page of kite for whether order got executed. The small ’Chirp’ sound does not help. This sound does not come in Kite Android. It has to be customizable, like ring tone etc.
– This can be called next generation tool only if scanner facility is added. (One in PI doesn’t work). And Please, if you provide scanner facility, pl give simple one. Not strange like PI. (They say color changes, it it satisfies the condition. It doesn’t. Even if it does, can you for entire day keep checking the color…)
– There is no Upper circuit limit / lower circuit limit in kite
– Market Protection in market order is available in NEST and not in PI/Kite.
– Q is still buggy. Crux was suppose to be available from 01-Apr-2017.
More over, I suggest you taking a user survey on the facilities available and wishlist and go ahead with further updates. Otherwise, you are wasting your time, money and in turn getting frustrating messages like is written above…
I am myself an IT engineer. It is hard for me to understand what does it take to provide this basic facilities.
I think search box is required in studies also if we close a chart and open another chart previous chart is displayed
Please add the ability to change the bar colors. I am a color blind and if I can’t change the default color, charting will be no fun for me.
I would firstly like to congratulate you on a very good design and thank you for always trying to make things better keeping in mind the fact that it should not look ugly.
The new charts are very good looking and is also much better in features. It is definitely lighter than the previous version. Change is hard to accept and some people take time to adapt.
There will always be those that complain but then even Microsoft hasn’t managed to take out a single software that didn’t have bugs, and their products cost the moon 🙂 you are giving us this for free.
congratulation and thanks once again for a job well done.
Upgrades r gr8 but a lot of bugs r there in kite android app.
They need to do beta test n rectify serious bugs as it is a critical software dealing with money.
Image bank a account a behaving erratic ppl will go mad.
I use 10 mins chart with few indicators … I have saved the preferences but still it gets set to it’s default.
Please have an option to go back to the previous chart system.
I am already planning a switch.
When we add a callout on chart and save it and then open another chart and then back to the chart where had put the callout, it disappears !
Is it not supposed to be saved there for later viewing ?
I am also facinmg the same problem. Please add this feature!
Chart layout preferences are shown as successfully saved, but next time when Kite is opened (after clearing cache etc) charts do not load with saved preferences.
Clear browser cache and preference in layout once.
and yes chart lag sometimes, it takes much more time to open the chart or screen is completely blank for some time, it takes multiple refresh to load the chat.
Checking.
Thank you zerodha team.
Great update .nice chart you guys provide
Quality data . thank you so much
while using on phone facing some issues about study
study not fetch for all scripts
Thank you
why dont you allow metatrader for zerodha
please add scanner in kite which helps us to know what are the %change on the kite and please change the studies view because while adding new indicators to the chart current studies (indicators) list is start covering the whole lists of indicators or I say that current studies start hiding all the lists of indicators.
There is a EMERGENCY problem in chart settings.
when i click on specific stock or index chart only BANK NIFTY CHART IS OPENING.
KINDLY BE ALERTED
Clear browser cache and preference in layout.
In fibonacci tool we cant add more levels. please guide
Thanks a lot for this standardized chart However a lot bug in this chart like layout and time frame doesn’t save properly.I figured out mainly layout saving issue other than everything awesome.
One more thing i just want to ask is there any difference between paid software chart and free broker software chart.I heard about that free software doesn’t represent actual chart for the live market.Please clear my this confusion.
Clear browser cache and preference in layout on chart. should fix. Paid software has more features and functionality. Data is almost same.
Thanks for the reply. I use color bar chart and many times it gives wrong color. On 15min color bar chart sometime open price is greater than close price then it produce green bar vise versa, However systematically it should be same like candle chart. Please try to fix this bug. My strategy works on color bar chart. It will really help me in my trading hours.
Thanks
Color bar chart is not like candle chart,it depicts line charts,it means the color of present bar is based on previous bar close, for ex: if present bar close is greater than present bar open but still if it is lesser than previous bar close it will form a red color bar which is not the case with candle charts.
cool thanks for this valuable reply.
Requests:
1) allow to change colours of candlesticks
2) allow to maximise chart. earlier it was possible.
It would be nice if we add scanner in Kite. so that we wont depend on Pi.
Hi Nitin,
One request. The data loaded on charts do no adjust for bonus/splits etc. So the chart is not representative in such cases.. Like Ongc in monthly chart… not able to find the long term trend.
Thanks
Yes sourcing and adjusting corporate actions on all
Hi Nitin,
Right now, in Kite I am able to see charts only after adding stocks to Marketwatch.. Any possibility of viewing charts without doing that?
Thanks
On our list.
Please add LTP beside the Avg. Price (in the the window which we see after order placed).
It will be very useful.
Great software. good amendment. i like the new graph screen.
just provide one alert. that price reaching certain value/indicator value.
it will of great help.
1) Maximize Button On Chart now vanished…it is still there on indicators..Square button between Up and Down Arrow
2) You Cant Place Limit Price with Cover Order in Kite…But you can place limit Price order in PI….!!!!!!!!
3) Same chart Open for Different Scripts…
Please Rectify these Problems As soon as possible
1. There is popout button, right top of the chart. Look at the chart above.
2. coming soon.
3. Clear browser cache and preference in layout.
hi Nitin@Zerodha,
progress is always good, new update is good.
request you to please make fibonacci retracements and extensions programmable/configurable by the user.
thanks
In pop-out mode desired script change to previous one .
For example if want to open hdfcbank in popout mode it will open in BankNifty
Clear browser cache, clear preference in layout.
Congrats Nitin, the new charting is better than the previous one, with some extra info. Nitin please add information of ”Book value” of Banking and NBFC stocks, in any manner preferably- P/B, in the Stock Widget. This will be of immense help for Long Term investors. Thanks. Mahendra Panchal ( RM1368)
Yesterday in the Display Header Dropdown I was getting option to select themes that is Day or Night theme.
Today I am not getting it ……. Please check and fix it.
It is only coming after Pop up Chart ……. if we do not pop up the chart …. the theme option is not coming.
can u provide customized time frame?
Hello Mr Nitin Kamath,
Your new Kite seems to be a good initiative even though some bugs are there which I believe you will fix it .
I want to focus your attention on a bug for which I need to explain with Chart Picture ……
BUT, How can I insert a chart picture with this comment Please advise.
The web link for my chart image is –
http://i64.tinypic.com/23r0hud.jpg
http://tinypic.com/r/23r0hud/9
[IMG]http://i64.tinypic.com/23r0hud.jpg[/IMG]
Manoj, we will try giving the 4H option soon.
Dear
In new platform i am facing difficulties. In 15 min. chart how to remove vertical lines of every two hr. I need only day seperator to have more cleaner look at my chart. Requesting a solution.
We will give the custom theme option.
Not able to get volume bars. Wants to open 2-3 different scripts in chart, but every time opening the same chart in pop out. Please resolve this issue
Clear browser cache and clear preference in the layout.
Please keep all the features of old version intact with new version features..Otherwise new one is better..Thanks..
Drawing we make disappears when we open the same chart again.
Click save preference.
Yes is there anyway to add scanner feature on Kite similar to PI.
I trade from office and cant use PI in our office -:)
For intraday trading we need scanner which is similar to PI.
If the current values of indicators (like rsi) can be displayed (instead of having to position the cursor exactly) it would be nice.
My experience with the new release is as follows:
– Issues reported with the earlier versions remain as they were
– chart response – has become sluggish, user actions get delayed response when a few charts are open
– indicators like Supertrend are now misbehaving (issue already raised with screen shots)
– Concept of Views – Intention is good, but implementation is pathetic. Example .. you save a view (say ”myView”)with set of technical indicators. Obviously it has to be done with some chart with some symbol and time frame.
When the ”myView” is applied to another symbol, the chart changes to the one with which the view was saved whereas the user expects ”myView” to be applied to the chart I am currently viewing. Nothing can be more frustrating.
– Under ”View” menu, themes (day, night) are available only if the chart is popped out
– Refresh take very long or are never ending. Thankfully it stops when the browser refresh is done 🙂
Nitin, if you happen to read this post, please note:
I hear about Zerodha adding features and becoming better. It would have been better if basic issues are addressed before adding more frills.
e.g.
1. when the market opens in the morning, charts do not get connected to data feed. They simply scroll to the left. They will form candles only after multiples attempts of ”refresh”
2. Volume bars stop getting updated after some (random) time, related indicators like Klinger misbehave
3. Candles stop forming after some (random) time if the user is not active on the screen doing refresh periodically
If someone wants to have an occasional glance at the charts for signals without unnecessary manual intervention (like periodic refresh) the current product is not at all useful. The last version expected users to refresh the chart before looking for any signal. This is contrary to the concept of ”Signal” itself.
The new release has all the problems as they were (with last version) and have added many other usability issues.
Further, I would like to make a humble request … Please follow standard software life cycle processes (thorough functional testing in live environment, beta testing etc. ) before going live with a critical software like a trading platform.
Looks like I should take a break rather than braking my head with Kite for now.
regards,
Sreekumar
Sree, I am checking on the three things you have pointed to immediately. I use it regularly, haven’t seen this. Candles will stop forming as long as it gets ticks, only if your system goes to sleep or internet stops will it stop. The save bit, if you can clear preference under layout and cache on browser, it should get fixed.
Last candle in any index option chart is behaving erratically.
It keeps going up and down, looks like this needs to be corrected.
i want to old version, this one is too much flexible, some time others company’s chart appear when chart open
Clear preference under layout.
STUDIES section – SEARCH studies option is missing. please cover up!
Hi,
Can you please add Implied volatility for the index/stock options in charts or in some place?
When can we expect IPO segment in Zerodha?
You can apply using your bank and Zerodha demat. Check this.
Thanks Zerodha Team for the upgraded Kite version.
Currently, the ”Info” bar (the one that shows open, close, high, low, etc.) which is displayed on the charting area. Is it possible to shift it upwards in the row of ”Search Symbol” ? This is because, ”Info” bar blocks the chart views and there’s hindrance to using charts effectively.
Thanks!
Having it there gives more charting area. We have also introduced transparency.
sir,
saw zerodha new kite version. 1 day, 5 day, monthly,6M , yearly is good.
1)but i think old kite version was more flexible and friendly.
2) fibonacci user setting are not available (23%, 50%,78%)
3) chart gets unresponsive for 30 seconds ( previously not present)
4) full screen chart not available when we add MACD, RSI, STOCHASTICS.
SUGGESTION:- Keep both old KITE and new KITE version optional as like bank online sites
3. hmm.. no issues as such
4. Checking.
sir
yesterday i change the background color but today that option is cancelled
we sit long time on pc so black background color required
Popout chart and under display you can see black them.
Where is fibonacci? Please provide search option in studies. It were available in old version. Please update.
Check the post above. Click on drawing tools, you can see all drawing including fib.
The new look appeals though when I saved a view yesterday and returned, the saved view was missing. This resulted in a lot of time and effort to bring together again all indicators, studies etc that I normally look at. It would be great if someone can look into this aspect!
Also, there is no option to maximize chart, only indicators can be maximized. It was available in the earlier version.
Clear cache, clear preference under layout and try again. Works fine.
thanks a lot for the constant upgradation. does this also has a drawing on one time frame ( like D Daily ) available on lower time frame ( like 60 mins or so ) ?
Yeah, drawings remain when you change time frame.
Dear Mr. Nithin,
I can find some new features has added but few old features are also required here, The most important is *Autosaved Drown Trendline, & Marked Patterns.* Thats was a great feature, which seems unavailable now.
The new update is loading same previous chart for different script. Also, once paramenters saved doesn’t really get applied on another scrip sometime.
Kindly enable it to open in previous opened time frame, by default it is opening on 1 minute time frame.
Clear cache, clear preference under layout and try again. Works fine.
Thanks Zerodha Team for this Kite update. Its really a better experience. Only issue am facing is to save the charts . ”Share” is not working. Hope to get it back soon.
Also would like to know the timeline (if any) for the chart ”Replay” feature. Would be really helpful for all the traders.
Share will come back. Clicking on save views should help.
Hi Team,
Today, I’m watching market from last 3 hrs and unable to take a intraday.. Every tic or Sec provide a change in trend… if every min trend is changing… how can we have intraday ..I request you to, please watch chart type or trend graph for each time visual… each time trend is changing….. really not happy in kite site…..
Expecting for better trend visualisation…..
.
Hmm.. trend changing where? Charts will just mirror what is happening in the underlying stock.
Hi Nithin,
it is on every new candle in chart for 1min
Check this video.
thanx for the update but
still eagerly waiting for
1.Bracket order buy sell from chart itself which is predetermined
2. advanced braket order with profit booking option ( which is the game changer for plenty )
3. fibonacci levels cannot be adjusted … new levels couldnt still be added 🙁 plenty of fibonaacci traders dissapointed
Still Bracket order buy sell from chart is missing ??
Another issue… Open one chart and set the timeframe to 15 min.. go to positions tab and open the previous chart… the time frame is getting reset to 1 min.
Yes this happened to me too. You need to save the layout preferences to make sure that the 15min chart opens the next time.
Actually saving the Layout preferences is also not working as the 1min chart keeps coming back and the unwanted indicators are also coming back. Please fix this asap Zerodha.
All these problems are driving everyone crazy, really. Please fix these immediately.
Can you clear cache and try again.
Clear cache, clear preference under layout and try again. Works fine.
Yes it does works fine now and the custom settings is also back and working. Thanks a lot for such quick and swift response. Really appreciate it. Kite now works like it should.
To day Biocon is jumping from 1021 to 1062 and back to 1021 every 5 seconds.
The price is fluctuating very often.
Yes another problem which is happening today. Another new problem. Please fix all these problems Zerodha.
I am looking at the chart, seems normal.
Chart drawings are not getting saved. Can u make them saved by default or through saved views please?
You need to click on layout and save preference.
The new Kite does performs better than the prior one with respect to chart navigation, zooming, panning. Also a lot of problems that happened on Sunday and Monday ( just after the updates ) seems to be fixed now.
DO NOTE :: its helpful to go to Google Chrome History settings and clear out the cache just to make sure that Google Chrome is loading the newest and the correct version of Kite.
Also the options to change the color of the candle body, candle wicks, candle borders, date dividers, grid lines is still missing from this new version. Please bring back this settings as because a trader really needs to customize the looks and feel of the chart to make him comfortable using it while trading. As one theme/color may not suit everyone so the ability to customize the colors is crucial indeed. Again the previous version had all these options so there is no reason why this new version shouldn’t have them too.
Overall this new version is good on many aspects and performs well too. So keep up the good work.
Thanks, custom settings coming soon.
Still Pending !!
There seems to be a bug when you try and compare 2 different charts. Once you plot 2 different charts to compare and now when u zoom in and out, the graph line interchanges upside down.
Vivek, compare, essentially uses the data on the screen as reference point to compare the performance. If you zoom in and if the relative performance for that period has changed, it will switch. What I mean to say is compare starts comparing from the starting point on left axis of the chart. if you zoom out, there will be more data.
COMPLAIN:
Looks like a good update.
But there are problems with this update:
1. I have made bookmarks for charts of different shares. Before the update, if I opened all bookmarks (by right-click and select ”Open all bookmarks” to the bookmark folder in chrome) it would show the charts with what I set in 1st chart, say for if Daily chart for 1st, then rest all will have Daily chart itself. But with the update I have to select saved view + cross hair + info + refresh.
It’s a lot of time taking.
2. Sometimes, when I have 2 charts open of say SBI and INFY in 2 different tabs, after the refresh, INFY becomes SBI… Really sucks.
1. Clear preference once under layout, and then save preference with 1D, this issue will get fixed.
2. Clear preference should fix this. This is happening if the old chart hasn’t updated to the new completely. Clearing cache will also work.
Hi sir,
The new modification were good,but two things I Facing Issues
1)If I open 3 charts only one was Live, the remaining charts needs refresh button.
2)when I click chart it open the correct one and when I click full frame it goes to previous chart frame constantly.
Please update these Issues.
1. Still facing this? Have you closed the main window. Can’t replicate this issue.
2. Clear preference under layout.
Dear Nitin Sir,
Nice Update , 1 suggestion allow sorting in watch list with increase in volume ( Avg )and Price (Highest and lowest ) and not able to draw lines.
Hello,
Charting looks clean with ease of saving preferences for multiple views.
However, I hope that splits and bonus shares are considered appropriately in longer term charts. For e.g. I can still see Asian Paints price not updated for splits in July 2013.
Regards,
Vaishnavi
Yes, working on this.
Hello,
Volume bars are not updating automatically. I am forced to manually refresh. Pl fix this ASAP.
regards
No issues as such. Can you check again. Also make sure you don’t close the main kite window.
Hi am using zerodha kite for trade such a great platform but need some help…. When using Fibonacci there is no 0.236 and 0.786 ratio and how to remove fill options from Fibonacci want only lines not filling and also how to remove grid line from back ground for clear interface….. what to do please suggest….
We will introduce custom theme. Fib settings will come soon.
Good to see continuous improvements.
have one suggestion:
Can we have an option to see Stock Wise Charges ( STT+Brokerage etc) anywhere ? Currently we can only see time period wise charges on the transaction amount.
Will be available on new Q.
Excellent Kamathji. Very flexible tool.
It will be great to have ability to open a stock without having to add in Market Watch + Buy / Sell option (which I read as coming soon).
when we take crosshair on candle its not showing details of candles it should show open low high close like older version of kite charts
Click on the info box as explained in the post above.
Fib’s are not configurable, can we also have saved fib series as with old version also we have to select/deselect our options everytime we load a chart
Hi Nithin,
Great charts. I would like to state a requirement that I miss in your charts. I like to maintain a watchlist and as I scroll through the watchlist, the chart of the selected stock should be displayed. Somrthing like in Metastock. I need not browse for the stock or click on the chart icon in the current watchlist to display the charts.
Regards,
Sharma
I am happy with new update in kite. But only one issue is , i am not able to save my drawings, like trendline, fibonacci etc. Every time i start chart and it disappear. Please do something for save drawing on chart, like trendline, fibonacci etc.
Thank you
Yes I am also facing same issue.
Please fix this.
Also we dont know if drawing is saved or not.
It would be better if we knew if settings are saved or not.
Click layout and save preference.
Once you add drawing, click on layout and save.
The entire new border which has all chart buttons(1m, candle,studies etc all of them) , is not clickable for me in google chrome. It was working fine earlier.Please resolve it .
Weird, still facing this issue?
sir i do not know why u change old version kite charting i think u r not testing on mobile its work horrible old version work like butter and its work like salt if u not give option to switch old version i think we leave zerodha i think what ever i red the comment given above they are not trader i think it very very very bad step for zerodha because 90% trader in zerodha wokr in kit dont make difficult… if u use old version in mobile its work nice but this new version not user friendly ……. think about ………..
Hmm.. Rishi, it will take a few hours to get used to it. This version is much better in a lot of ways.
Earlier chart were very easy,
In the new charts how can We Enable – Close -Open -High – Low – VOlume – Time things that used to be shown on the right upper side of old charts, these helped a lot which is missing in the new charts,
Pls help,
Best regards,
Sachin
I have explained in the blogpost above. Click on info box.
new changes on kite chart are quit difficult.
indicator trend change hone ke bad bhi dikhata nahi hai.
chart ko refresh karna padata hai.
so please solve this issue.
Chart refresh will stop only if internet is disconnected.
Good changes made to the one earlier.
Thank you.
But lot to done, say look at the features ”Trade Station etc..” provide.
Make our life easy to trade options.
Hi,
Great update. Congrats on the same. I wish alerts be added with some pop up notification and sound. Is it feasible.
EVERY TIME I PUT MY THEORY ON CHART BUT AFTER REFRESH IT VANISHED
THOUGH ITS REFRESHING FAST AS EARLIER
Click on save views after adding indicator.
Most welcome new Kite updates, I like changes.
But….
Past 2 day not working my chart properly, if I open any script chart that shows blank screen. Today I was accessing a chart and set any indicator or change chart time frame 5m, 15m, 1h,etc. Is moves forward non-stop automatically whenever close it.
New updated chart is time consuming, not open quickly or anytime not open Plz fix it….
Hmm.. still facing this?
Great Job Sir, Thanks to you and your Team. Very good and updated ”New Look”.
But only difference in old and new in Themes which was available in Main window of Kite before POPOUT Chart.
In version it is available only after POPOUT Chart.
But Thanks & Regards again for your hard work.
good update but i am unable to find the settings for fibonacci retracements. please guide me.
Settings will come back soon.
This new version is good, what is to be added is total volume near price and change in price + total volume. at present volume available in chart only.
Nice improvements.
In case of going to other section like position etc and coming back to chart, it goes on 1 minutes time frame within 30 seconds is too fast.
Kite should hold to last setting unless changed.
Click on save preference under layout to save your settings immediately.
Almost every change is lovable, almost. Though there are some, kind of, downgrades the over all feel is largely neat.
Just one issue I found ,you said EOD data from 1996, Nifty however still loads only till 2006. Just something I noticed.
Yes not everything has data from 1996. We are working on getting it on.
please put a separate window option for charts on mobile app, for swift shifting.
also during market opening the the chart freezes and forms tiny ticks every second.
i am sure many of us faces this issue.
thanks
Forgot to add a concern in previous comment, difficult for distinguishing candles of new version for a color blind person
opening the custom theme.
good tool to understand..
How to plot volume moving average on chart?
Add volume chart first. When adding moving average, choose source as volume. Check the kite user manual link I have shared above.
nice. convey my regards to the developement team.
Thanks Zerodha Team for this new kite update .
The search symbol feature on the chart is awesome and was in my wish list, though it searches only those which are already in the market watch , please make it universal.
I do have one request , please add the the theme option , changing the background and candle colors.
Hi Zerodha Team,
I am not getting the night view in new Kite charts, I am more comfortable when background is black as it is in ”night” theme. please fix it.
Hi Nitin, trendlines get erased if clicked on refresh (even if layout was saved prior). Pl help on that. It was working before.
Agree. Sometimes the candles stop forming midway, so one has to refresh, and once we refresh, our drawings vanish.
Another issue I found is that the Supertrend indicator does not adapt when the trend changes. It happens only after I refresh.
But keep up the good work.
Once you add drawing, please click on save preference in layout.
Sir, charts stuck & not ticking well like previous version, have to refresh everytime after coming to tab.
Even sometimes, candle stucks at one price while Pi showing new rates, it’s frustrating.
I don’t like this version.
Still facing this? There is no issue with ticking.
Fantastic updates. I totally appreciate and adore zerodha for their futuristic mindset!
Will there ever be more time periods? Like I wanna see Quarterly, Half-Yearly and Yearly candlestick charts just like we have in sharekhan.
Thanks.
chart is not display in black colour
Major drawback is chart needs to refresh, they are not streaming on their own.
No such issue Mahesh. Still facing this?
Tools are not available
There are more than before. Click on drawing tools icon next to popout, dropdown with all tools appear.
GREAT.
THANKS
3/05/2017 12:11 pm
KITE Android APP
SAME CHART OPENING FOR DIFFERENT SCRIPS..RECTIFY THIS BUG EXAMPLE-IF I OPEN BHEL CHART CLOSE IT N THEN GO OPEN NIFTY CHART IT RELOADS BHEL CHART BUT I CLICKED TO VIEW NIFTY. Started happening from today 3rd wed 2017 PLEASE RECTIFY THIS BUG ASAP.
preferences GETTING DELETED FOR NEW SCRIP I OPEN HAVE TO READD continuously
INITIAL CHART loading TIME IS HIGH.
MOVING AVERAGE VOLUME indicator MISSING
PLEASE ADD SEARCH FOR INDICATORS LIKE PREVIOUS CHARTING SYSTEM
FEW MORE THINGS
LTP ON CHARTS IS DELAYED OR DOES NOT REFRESHES NEED TO reopen CHART TO RECTIFY
PLEASE UPDATE LTP ON CHARTS AS FAST AS YOU DO NORMALLY KITE ANDROID APP
NOT A BIG ISSUE BUT BLACK THEME MISSING
Should be fixed if you cleared preference under layout icon. All indicators are there, you will have to scroll down.
Hi nithin,
I am facing 2 problems with this new update.
1. It looks like the platform has a bug. Whenever I open a chart of a script it opens a chart of a script which was previously opened. Fix this bug on priority. It’s frustrating and time consuming.
2. In the previous version whenever I would open let’s say an hourly chart . Kite would automatically consider this as a default timeframe and from that moment onwards it would automatically load only hourly chart . But now no matter what I do kite loads 1 min chart as default . So I need to change it back to higher timeframes. Manually every time. Which is time consuming.
Warm regards ,
Akil
KITE was already good only you need to make the process FASTER, no any other changes required.
1. Gets fixed, if you can clear preference under layout.
2. Once you select time frame, click save preference.
One of the worst upgrade ever faced.. all my saved charts vanished.. each time it requires to load indicators on chart.. this time not done at all.. earlier version was too good..
Clear preference once under layout. When you add indicator make sure to click save views.
Also please give an option to switch to the old format if user wishes. Because, till all these functional/performance issues are fixed in this new chart format, day traders are not convenient to switch to new charts quickly
please add black background in new update,getting strain on eyes by seeing white background
Can you keep indicator/studies search box? diffcult to scrolls till end.
Also can you add search box for drawing list as well?
Thanks
how to change theme in new version like black theme pls tell me
Popout chart and under display.
Thanks for all the services provided by this team to develop self and others,
As of now, there is default time frame chart, need customize time frame chart like 2days,3days,4days chart etc like.
Dear Sir,
In old we were able to set the view of fib level you have disabled it in this new version. I request make the setting option available for fib levels. and am also getting problems in saving the preferences of the charts it did’t get save, Rest everthing is Excellent! Thank U
day n night in theme not available… would have been great if available.. as night mode its easier to watch n study graph
Popout chart, you can see under display.
Hi
The new version is nice. Much needed 4 hrs candle is introduced and I am happy with it. Thumps up for updation.
I am missing the search option in ”studies” and ”drawing tool” section from older version. It will be more helpful, if the search option for these 2 sections are added in the new version.
Where is the 4 hour candle?
You get to see it if you click on 1 Month time frame chart at the footer of the chart.
so what does that mean ? why would you want to confuse people – the bottom timeframe’s if you click on 1 day – it shows a five min chart, if you click on 5 day it shows hourly chart, 1 month shows 1 day chart … Is this how its supposed to be ? am I missing something here ?
Bottom is not a candle timeframe. It is a period. It is a quick way for you to see chart for 1 day, 5 Days, 1 Month, 3 Month etc.. Based on how much time period you want to quickly see the chart of the stock for, the candle time period changes. For example if you want to 6 Month chart, opening 1 min candle wouldnt’ make any sense as there thousands of candles. Hence a 1 day candle opens to show a quick view of the trend.
well 4hr chart is not available .. if we click monthly at the bottom it pulls up 30 mins chart
chart is opening previous script on every click and no live data on charts every time i have to refresh to see the chart candles etc fix it as soon as possible. I have checked chrome and mozilla no live chart data. 🙁
This is exactly what i am facing, no live price action on popout charts and its difficult to refresh 8-10 charts every time you open that chart tab window. 🙁
Varun, I think you have closed the main Kite window. If you close it, live ticks stop.
Hmm.. no such issues with data not ticking. Do check your internet once.
Please insert a search bar in studies to search the indicator etc . its hard to search manually
I hope if you can add the entry price and sl price line on chart as It shows in meta trader terminal and ability to place, modify and close orders from chart itself
with Crosshair i want to calculate number of candles passed on time axis just same as it is present on meta trader 4
please make it similar or better thn mt4
zerodha is the only indian broker which can implement charting functionality as meta trader. hope they make better platform than meta trader
You can use the line option under drawing tools to measure candles.
Hi,
please add buy and sell signal in popup chart so that it will b easy to trade but however changes as per now its good.
Dear Nitin,
The Elder Impulse system is not working, instead of the candles being Blue, Red and Green, its all Black, Please correct this.
Regards
Previous charting experience was better.. please get that back…
Yes.. at least they should give an option to switch back to the old platform if interested.
i having issue for last 3 days that i once opened the natugas contract but whenever i open other scripts it shows me natugas only.
today i don’t know how i am able to see my saved view.
mobile app is great but has some flows, hoping to correct this issues. sometime we are in quick trade and app stopped logging in and stop showing market depth and stop showing charts, it becomes problem for small trader.
yesterday whole day pop out chart option was not working , not even showing the symbol of pop out now today it is showing.
Wow… New charting is super. Thanks Zerodha..
Hi team Zerodha,
good work done in bringing new version of kite,
Can the candle colors be changed to custom colors, the default colors are not so contrasting.
Regards
siddharth
Giving the custom theme option.
Nice update.Fibanocci values are not getting displayed on y axis.also allow us to customize the settings like which ever fib % we want to use.i want to use 14.6%,76.4% isn’t there.
Also please add live options data to do live options analysis.
Reiterating the request from Sumit . Is it possible to place price alerts? . Alert would help us to track the prices without keep navigating to a site. A notification on the price alert would prompts us to take action. This feature would make a kite trading a fun-filled trading. Thanks for looking to the request.
Yes, on its way.
New update is awesome. Please add Nifty 50 (nifty futures available) and we need scanner in kite.
Search for Index on Kite, you can add Nifty from the list of indices that show up.
Hi,
Below are my observation
– Volumes doesn’t update until refresh is pressed.
– RSI graph doesn’t show the live index. Only a moving line.
– Where goes the search in studies , need to scroll a lot to find something.
-Why I have to save each & every graph of a stock. If I put RSI , MACD in one graph it should appear for all others until I remove it.
-Still can’t buy or sell from graph in kite web.
But good job , new chart looks better & organised than previous version
also when i save the changes like u said the rsi it does not change ..it just fades away when i login soemother time..i need to put all the indicator again…
Click on save views.
Once you add an indicator, you have to save it as a view. Once done, you can open for all. Volume and RSI seems to be working fine.
Please add a clock so that the time remaining to finish the bar or a candle can be calculated.
Clock coming soon.
When will the clock come? close to 4 years now…
Hi.. In this new update of kite charts the ”Elder Impulse System” color coding is not working . For all the bars its showing the same color.. Please check…
great update for short term and swing traders , head ache for day traders ..like mr.nithin said lets hope this change will bring some greater good …but this chart system is definetly not a upgrade ..all we can do is adjust to the new system which is so not zerodha .
Rightly said Mr. Rajesh. It is just impossible to see through all these niggles and day trade in peace. The chart area used earlier was ideal. Now too much of browser space is used for charting and this is making the aspect ration weird. I am not sure how long its going to take to get used to it.
i thought i am the only one feeling that way…
This is not a better version, you cannot change the colour of BACK GROUND this is actually a downgrade from earlier where custom settings were given instead of forced alternatives. My saved chart layout is also lost.THERE IS NO WAVE IN CHART STYLE
Custom settings we are bringing back. All the previous chart styles are in display still.
So much handy now. Makes my everyday trading easy… 🙂
Hi
Improvements are always good!!!! i observed that if u open charts for scrip 1 and pop it out fine. then go to main screen, then open scrip 2 then try pop out…. scrip 1 opens again,
need to select scrip2 again and popout it works ok
Also the pop out charts once refreshed, the volume details are not updating automatically
u may check at ur end for this
Can’t replicate this, can you see if it is still happening. Clear your preferences once under layout.
Cant change the color of candle sticks… i am color blind and its very difficult for me to differentiate between red and green.. I used to work with red and blue.. pls help
We will bring custom theme back.
Everything looks fine so far except the only issue i am facing while poping out any chart and its stop giving live price action, i have to refresh the chart to see where the current price of stock now. i hope it will get fixed soon.
Thanx.
yes facing same issue.. please resolve asap
Hmm.. working fine for me. Can you email [email protected]
Having the same issue. Not all the time but it happens, please resolve it asap
Do you close the main Kite tab after opening the new chart tab? If you do, the ticks on the chart could stop.
My markings are disappearing if i toggle between two stocks. How to retain my markings
Dear Mr. Nithin Kamath Sir, Pls note to make following changes in your new charting software
1) Make rates visible h/l/o/c on overhead like earlier becuase if we click the info button its box covers full charting candles and rates are not visible and user friendly
2) On the overhead script name is visible with big size..and becuase of the same it covers charting and candles not visibile properly in mobile. Just make this script symbol
3) Pls make our timeframe preferences saved because it open alway in one minute candle.
1/2. we are making name box transparent. By bringing in OHLC into the chart area, we are actually getting more chart area.
3. Click on clear preference under layout. Add your time frame and click on save preference.
And where is the high, open, low information of each candle? Do you expect us to use the crosshair?
Can you look at the post above. I have shown how you can initiate the info box.
when we take crosshair on candle its not showing details of candles it should show open low high close like older version of kite charts
Click on the info box as I have shown above.
Previous chart is shown most of the time after selecting a new symbol
Clear preference by clicking on layout.
Hello,
The new kite update is missing all the drawing tools settings , especially the fibaonacci settings.
please give option to select various fib levels such as 23.6 / 78.6 and 88.6.
also need more fib levels with expansion and projections , only 138.2 and 161.8 are not sufficient.
also need a pure ABC fib projection tool.
it will be much better if we can type on our own ratios that the software can calculate and show.
Also please allow feature of trendlines to the copied and trendlines should magnetize to candle highs and lows fore extreme precision.
right now these are very basic features that kite does not have and its actually impossible to do any decent technical analysis on kite , let alone trading.
chart settings are also missing , cannot switch off the grid ? cannot hide date markers ? cannot change candle colors ? what happened to kite ? intead of going forward , seems to have taken 2 steps back …. very disappointed….
i was with angel broking for 7 years and their software speedpro is really awesome , came to zerodha due to low brokerage , but Pi never worked for me from the beginning and kite is literally unusable. … what to do ?
best regards.
chandan singh sabarwal
We are looking at getting settings on fib levels back and custom themes. The rest are essentially feature requests, that I am taking down.
Excelent charting , liked it lot. have a question how to save annotation (text) lines or drawing elements on charts. I have made some notes on charts & after after checking with few different scripts I came back to original script & found all my work got unsaved. So please let me know how to save charts with info on it.
Checking
I want the price move according to the cursor movement, as in the earlier version. It is more easy to see the price in particular time of chart.
Please do this small change.
Hmm.. it is like it was before.
True. We must have this feature.
Sir,
Ref:- DR1784
All your trading platforms are big failure. Nobody knows what kind of trouble we get any time. Yesterday chart popup was not working. Renko is no reliable in any time frame.
Unhappy trader,
T.Ramesh
Ramesh, Renko’s don’t work on time frame, they are meant to plot only based on value/underlying movement. When you change time frame, renko box size is essentially changing. If you want to change the renko box size to your choice, you can click on the setting button and put the box size you want.
Under Renko settting>set range manually is not consistent across scrip. I can select manual range 1 for first script but it will change when i open chart for another script and i can’t set to 1 for that script.
HOW IS RENKO AUTO RANGE SIZE CALCULATED ACCORDING TO DIFFERENT TIME FRAMES?
IS IT POSSIBLE TO SET RENKO AUTO BAR SIZE TO ATR IN CHART?
Previous charting UI was better… candlesticks looking very bad… hope u will see to that
Old version is better
where is day night mode?
Day n Night in theme available only if POP OUT Chart.
When you popout chart, you can see it under display.
I have put all the necessary indicators and saved the preferences + I have saved the View also with a new name, however the same keeps getting erased. I have tried saving it couple of times and the same is occurring again and again. I tried it in different PCs also.
Plus can alerts options be given on this new version.
Can you clear preference once and do this again.
I also set all the indicators that i want and saved the preferences + Saved Views also with a new name, But after 2-3 times login – logout it will remove all the saved setting & erased all indicator. I have tried saving it many times and the same is occurring again and again and again……………
1. Sometime Supertrend (period 7 & Multiplier 1.5 ) not working properly.
2. Search option is missing to find indicator.
3. when market is open in Market watch closing price show two day before closing price for first two three hours everyday so pls solve this.
4. If possible modify date format in DD/MM/YY.
1. Checking.
2. Will come soon
3. Until market opens in the morning, the OHLC LTP is shown as if it was yesterday market closing time. So C will be showing the day before’s close. As soon as market opens, it gets updated to today.
4. hmm.. checking.
We welcome new charts
Please make below quick fixes so that it will be even better
1. Script name box should be transparent like study name
2. Information box should be transparent like study name
As it overlaps the below due to its white background
Regards
Shankar
3. – & + zoom box should be transparent like study name
Hi…How to display different time frame charts on the same screen window ie 1hr,1d,1w,1m
Thnks
Ashok
You have to popout chart and arrange your screen. Check the video that Hanan has made to arrange multiple charts.
can you send the link to the video on putting multiple charts one screen in Kite ? is it possible to accomodate 4 charts in one screen ?
You can use one of the utilities, check this video.
Sir,
It was a pleasant surprise Monday early morning to see the new design.
Regret to say, the feature of making notes is sorely missing. In previous charting system one could jot down thoughts.
Regards,
Ramana
RV6009
All those drawing tools are still available, actually there are more now. Can you click on drawing tool icon next to popout as soon in the post above.
I am using Zerodha ”KITE” (Web based system) for daily trading, your system ”KITE” is good but your technical team is making it worst by updating it.
Problems:
1> We need to click on chart 2 times to see the chart of next stock.
2> It’s becomes slow to remove stocks from list after updation.
3> Sometimes it’s showing ”Error fetching data”.
4> Sometimes it’s showing ”…..” (dot) on list.
Update ”KITE” ONLY IF YOU CAN UPDATE IT PROPERLY otherwise DON’T DO THAT.
It becomes HELL, when you update it wrongly. Don’t make it worst than previous.
I can not understand there is no any person to TEST your system on daily basis as intraday trader.???
KITE was already good only you need to make the process FASTER, no any other changes required.
1. Checking this.
2/3/ From which list? marketwatch? Nothing has changed anywhere else on kite.
From marketwatch area on the left on the web based kite.
Works fine. Can you send a screenshot to [email protected]
andriod kite app has many bugs (for instance we cant change between charts)
In kite web how to change background colour to black?
Can you clear preference under layouts once. It should fix this.
The entire new border which has all chart buttons(1m, candle,studies etc all of them) , is not clickable for me in google chrome. It was working fine earlier.Please resolve it .Facing issues.
Still facing this? Can you email [email protected], we will call and check this.
also while selecting daily candle it shows one minute candle even after clearing browsing history and cache
Can you clear preference once under layout. When you select a time frame that you want, either wait for 30 seconds or click on save preference under layouts.
Hey,
I’m facing an issue where if more than one chart is opened (pop out), only the one that I’m currently viewing updates while the ones on other tabs seem to stop updating and need to be refreshed to show price action and volume.
Every new minute, the candle just appears flat
I guess i am facing something similar – In my browser i keep 3-4 charts open with 5 minute candles. They have to be manually refreshed most of time. It was an issue the older charts also. Please see if something can be done.
Thx
Hmm.. the main Kite window has to remain open if all charts have to tick.
Dear Sir,
If another chart is pop out obviously the charts would be open and the main screen would work in backside. Will the same suffice the purpose or we will have to make the use of tab resize extension in chrome always.
regards
bhushan
As long as main screen is working in backside all charts will tick. But there were a few cases today where it wasn’t.
how can i check my pop out chart and keep my main kite window open? if its required for all pop out charts to be ticked?
You need to ensure that the main Kite window which has watchlist on it is open somewhere in the background. Only then will all popout charts tick.
Hmm.. it seems fine. Don’t see this as an issue.
Hello!
I am having similar problem since a week. I open the pop-out windows on a separate monitor, it keeps showing horizontal ticks/bars but no candles with time unless refreshed. I have to refresh each page manually and then sometimes all the study parameter/statistics are gone. Earlier it was working well though.
Also, there was a problem in changing the BO trigger price, i tried multiple times, refreshed the page, also logged off and logged in. It kept saying ”Modification request sent” but it did not change for 15 minutes and triggered then after. Another instance, I was trying to cancel an order but it kept saying unknown error for 2 minutes and finally placed the order, for which I took some loss.
Kite has been acting up lately. Can you please help?
Anyone out there???
I am still having the pop up chart problems, I have to keep refreshing to see current candles.
Garima, as long as you keep the marketwatch window open after you pop-out a chart, things should work fine. But if you are still facing an issue best if you write to [email protected].
Thanks! I do keep marcketwatch open. I will write to support team then.
please put a scanner,like list of all scrips have cut moving averages or whose rsi is above 50or 60,or any user defined scan on any oscillator or price or voleme or averages.
Pls get alerts implemented huge thing lacking sinc3 beginning
Please fix chart views template Option…
1.while clicking on it it changed but tim frame not changed it ramained same
so reading problems create fustrating
2.while changing chart from one script to another old used chart opened not new one… so this is another problem
3. please allow us to open default chart time period not 1 min as default which is set … we need to use 10 min 15 min whatever we want to set or template saved can be handy for that , but it get
1 minutes as default
4. poout chart not working on chrome 58 64 bit please look it
1/2. Can you click on layout and clear preference and try again. This shouldn’t happen.
3. Open a chart, change the time frame to 10m or 15min, save preference. Once done, the next chart will be the time frame you select.
4. Checking this.
Hi Sir, thanks for making it light weight and sleek. But I am using Chrome and the charts needs two times clicking to open. Either the chart does not open or the previous loaded chart opens in the first click. it requires 2nd click to open. Please advice. Thanks.
Having this checked. Is this all the time or only once in a while.
Nice Works but sometimes chart popup didn’t work. Popout comes with close script chart.
Can you check if still facing this.
there is nothing to see candle high low open close and cant even see price when moving mouse up and down to check where to set SL its the worst improvement u have done to kite roll it back or improve it for pricing guidance on mouse movement and candle’s pricing
Aasim, check the post above. You need to click on the info button to see the OHLCV. Whatever option you select will show up net.
thanks, searching since yesterday, finally got this answer. Zerodha should auto-show this info on-mouse-hover but info button isnt bad. Now I can use candlestick on zerodha.
Stupid update.
It’s frustrating. I have to add technical indicator Avery time so much wast of time.please bring back old type.
Jaydeep, you can click save view. Once saved, you can change scrips and it will load the chart. If this is not happening, can you clear preference once on your chart (click on layout).
In ichmoku cloud there is no option for hide any one element. suppose if i want to hide cloud there is no option avalible.
Zooming a particular time frame segment facility can be incorporated.
Mr nitin , Please do some about Live Options chain with greeks . Portfolio hedge and payoff !
Facing lot of trouble n have to use Sharekhan terminal for this .
Hoping this will resolve sooner . Rest zerodha is perfect .
Thankyou 🙂
:), yes soon.
Issues:
Fibs not configurable anymore!!. fixed fibs – could we have it configurable to other levels also.
trendlines – don’t get saved if you switch to another chart.
Yes, the previous fib settings had small issues. We will try to bring it back working properly soon.
fib retracements drawn on charts keep getting darker and darker on its own on changing time frame or just when you open the chart next time to the extent candles n screen gets completely illegible. I have complained about this a lot of times by now, please look into it
Why there are only three retracements ( 38.8% , 50% , 61.8% ) in Fibonacci retracements ? I want 23.8 % and 78.6 % levels because i only enter in trade when stock start moving above 23.8 % level. Kindly add 23.8 % retracement level in finonacci in Kite .
Plz add the 23.8% level to Fibonacci. It was there before this update to kite was done.
Is it possible to place price alerts?
Not yet, on our list next.
Hi,
All is well, but the indicator disappears after a few times of interclicking between stocks. And then i have to bring in the indicators once again. Cant, i set a particular set of indicators permanently?
Not able to replicate it. When you add indicators, you have to either save it as a view or wait for 30 seconds for it to auto save. After which you can switch between stocks. If you do before that, they might disappear.
Seems to be way too slow after this upgrade and several hiccups during the order placement.
Not appearing good enough for a quick trade entries. Might be an infrastructure issue… please have a look.
This is definitely faster. Can you restart your system and check.
NEW LOOK OF CHART IS GOOD
Super Charts
Day & Night feature removed again?
No, available under display.
Need a scanner in kite also..
Dear Nikhil,
This is specifically for mobile platform. Post changes are done I am not able to add multiple moving averages. By default it is taking 50 days MA and if I try to add new MA for say 20 days it is still taking 50 days. Upon clicking settings nothing is happening. Also Charts in desktop are better but the views which I am saving are not appearing in my mobile. So it is very frustrating experience adding studies and its parameters again and again. Request you to do through testing before releasing. Since last week it was so smooth on mobile. I am sure it will be fixed soon.
Regards
Can you try now and let me know. Not able to reproduce this.
Not able to save drawings , even after saving preferences.
Should work. Might be cache. Can you clear your preference once and then save.
cleared the cache still not able to save drawings. another problem is that whenever i pop out any chart every time nifty 50 chart appears in the pop out
It is working correctly, getting someone to call you.
I am not able to save drawings in Kite 3 paltform. Tried many things like clearing cache, clearing preferences, still not able to save them. Could you please help me. I am using Chrome browser.
Mahant, all drawings you make on charts will be automatically saved in your browser cache. Whenever you open up a chart where you had previously drawn on, the drawings will be retrieved. However, this won’t work if you clear browser cache, or switch browser or PC.
Hi Nitin , I am unable to save any indicators on my Android phone…. Earlier version was better and fast…Could we can place an option for older version also…
Can you go to layout on chart clear preference once and try again. Once you add indicator, click on save views.
Thank you for the charting update. Did not take much time to get used to it. The bottom pre-defined time-frames are helpful. Switching between views is also easy.
If I hover over the refresh button, it says shape. I am using firefox. But in every way the charts have definitely improved.
I would like to request a tab to open charts from our holdings/ portfolio, instead of only our watch list.
Thank you team Zerodha. The update is beautiful and I am loving these changes.
Adding/removing is now easy, I can do it from the studies drop down or from the left-hand menu.
A lot of new tools available.
Custom setting for Renko charts.
Saving views and switching between them is pretty easy.
The menu at the bottom with predefined time frames is very handy.
This new update is loading same previous chart for different script. Very frustrating ,every time you need to clear preference for every new script.
The old version is better.
This is actually a feature request from most traders – opening the same preference when charts are initiated. What you can do is save your views, when new scrip is opened, apply the view/template of your choice.
You got it wrong Nithin.
Try this and you will experience it for yourself.
1. Open the chart of some stock (Say Infy)
2. Click on order book
3. Open the chart of a different stock
You can see the chart of Infy being opened.
This is a serious bug!
Can you clear cache, clear preference under layout and try. Shouldn’t happen.
i am also facing same pro. i cleared cache and its still doing the same .i request u to look in to this .this is serious pro …people always confuse with this ..please check
Can you send an email to [email protected], it is definitely not happening if you have cleared cache and cleared preference under layouts option.
Please check the problem in mobile chart. It opens the script, but then goes back to previous chart as many have mentioned here.
Can you clear preference under layout on kite charts. Once done it will get fixed.
Will definitely take some time getting used to the new look and new features, but looks great in the first glance!
Please add live option geeks value for all options so that one can easily apply various options stratagey with any other tool. please update this. This will make you complete.
Yes working on it.
i was hoping you add buy sell on popout charts .long pending demand
🙂 coming soon.
Hi Sir,
Place order from popout chart page feature.
Can you please provide approximate time to release?
We are hoping by this month end.
Thank you for your prompt response.
Yes, Please add Buy/Sell window on Popout Chart, this is the only reason why am forced to use Buggy Pi app.
This new version is heavy. Takes up one full core in my 2 core processor.
Hmm if anything this version has become lighter. Can you double check.
Hi Nithin,
This new version of Kite IS NOT LIGHTER as far as displaying charts is concerned. It becomes unusable after 30 minutes of use. I have sent your team the screenshots of the cpu usage with charts. The crosshair lags so much that it catches up with cursor movement after 4-5 seconds. Any click on the chart registers after 5-10 seconds.
Saved views are saved in browser, not on cloud. Then, when the charts become slow, your tech team asks to clear browsing data, which helps only for 30 minutes before lagging again, but clearing browsing data causes the saved views to get deleted every time. We can’t build views every 30 minutes.
When clicking the tool/drawing button in the TOP RIGHT CORNER, the next dropdown menu to select the draw tool appears in the TOP LEFT CORNER. That’s illogical. It should show up in the same area (TOP RIGHT CORNER). A whole strip from left to right gets wasted anyway.
Please fix this, or at least give users the option of using the old version of Kite, which was fantastic and actually lighter than this version. You could run charts on it all day without it slowing down.
Thanks in advance
candle data view box should be made fully transparent, otherwise earlier was beter.
Absolutely right. It is very, very resource heavy, in spite of what we’re told. No trading until this is fixed.
This charting updates are good…. But… Not so flexible…. Which I felt…. I want my old charting style… I am used that… Please provide option who wants switch to that…. Reply… THANKS…
I am sure that u will get used to the new charger quick
This is much better, give it a couple of days to get used to. Change is usually tough, even if for better.
This is not a better version, you cannot change the colour of candles like in earlier version, the second decimal in indicators is not there like in earlier version, this is actually a downgrade from earlier where custom settings were given instead of forced alternatives. My saved chart layout is also lost. I want my old chrts back
Agree
Second decimal is available. Custom settings we are looking at.
please fix the issue AsAp
Hi Nitihin,
unable to insert horizontal line. This is the only indicator which i use. Can you help me out.
Thanks.
Seems like working fine for me. Click drawing tool and then choose line.
Thanks for all the changes made today. I can now see the indicator values on the right and time on the OHLCV area without using crosshair. I also think it is much faster than before now.
Can you introduce trading from chart.
Great update, charting is extremely slick now. Took a couple of hours to get used to it.
Very Nice tool and flexible to use.
omg!!! there are tons of flaws in this version…plese look into it…yesterday popout button did not work for me…..:(
how can i watch multiple stocks at one time?…comeon nitin
Hey, popout is working fine.
Come on Nitin. There are numerous of bugs in this kite and i personally know a few who are very unhappy with this buggy version. Change is very much welcome but not a buggy version to the client. Please test it properly before updating to the client. All the bugs were in Charts.
What was the reason you removed color (Change) from candles. Now i cant differentiate bw bearish and bullish candles. It has been disgusting now. Plus whenever i bring a new chart, the first chart which i have seen is shown. Given 1 star on play store. Make all the corrections ASAP or i’m changing my broker.
GIVE COLOR CHANGE OPTION IN CANDLES.
There is color change. Click on Display, go to change theme, you can change those colors to what you want and save.
Sir Kamath i have tried going to display in the new kite but i cant change the colour of my candles. i am used to having light shaded or black and white candles and other tools to avoid getting attention from my surroundings please can you check and provide the changes for colour of the candles
Go to display, click on +new theme, choose the color of your candle and apply the theme.
Sir in the theme only two options are there day and night. In that we cant change colours. Also please let me know any provision to show alert by way of sound or display if order is executed or if there is any
change in prices either way . ( to know the trend we can fix some alerts as in case of some others brokers charts).
Sir.
How can set fix percentage(%) based brick (or box) size in Renko chart. And in kite platform what is default parameter for Renko chart.
Brick size can be set by clicking on the settings button next to renko when you are selecting the chart type. There is no fix %, you will have to set the brick size in points. The default brick size changes with stock.
Charts in android kite app are not opening. Can you suggest any remedy please.
No issues our end. Can you email [email protected]
Kite mobile app’s chart not loading ??
Works fine.
Kite is very effective and simple to use. Thank you for providing such a user friendly trading platform. Although i would prefer dark theme for zerodha kite same like zerodha pi. Dark theme reduce strain to our eyes.
Sir as I am beginner to intraday trading I have one queries. whenever I reach the target in BO why the stock does not exits immediately even though the LTP of the stock is same as my target price , Instead the price again goes down and I miss my target price and I had to wait for the price to come up.
is it multiple charts layout available on kite?
Shekar, will be available in the upcoming update to Kite.
there are too many issues in synchronization between kite android app, kite 3.0 url( open in mobile) and kite 3.0 url( open in destop. If you save study in android app, you can not see that study in kite 3.0 url( both mobile and desktop). Similary the case when you add some stock in market watch list in android app, you cannot see in kite 3.0 . I have already raised a ticket on this and ticket number -#851481
Hi Nithin,
I am facing very peculiar issue in my Zerodha account while saving the cart template!!!!
After adding all the studies, If i tried to save the chart template, i could not able to do so?
Is there is any issue?
I do have one more account and i could able to save the view once i add all the settings and the same is not working with other account..
If you have any solution kindly let me know
Regards
Sreenath
7204815630
You just need to click on save view and then save preferences. Should work fine.
Hi Nithin/Matti,
I am also facing problem with ”Save View” Option. After saving, it does not showing the saved template. I tried multiple times in multiple browser then it got saved. I tried to save 2 template but it saved only one.
Please help us with the issue.
Hey Manish, you need to wait for 30 seconds after adding indicators before saving a view.
This didn’t help. It’s 31st July 2018 and I can’t save more than 2 views. Occasionally, the 2 that are saved also vanish so I have to refresh the page a few times.
Hmmm… Can you please raise a ticket on the Support Portal. We’ll have someone get in touch with you and have this checked.
hi sir, after drawing trendlines, it is getting vanished after couple of days and i hav to draw again.
pls help me with this
Hey Nirav, all drawings you make on charts will be automatically saved in your browser cache. Whenever you open up a chart where you had previously drawn on, the drawings will be retrieved. However, this won’t work if you clear browser cache, or switch browser or PC. Read more.
can u add nyse in zerodha like icic have ,thanks
my candle stick chart does not get updated have to click the refresh button always to check the changes.
Hey Abhijit, are you on a corporate network? Can you please check on a personal internet connection?
Yes this is the problem that i face every single day even though i am at my own house using my own internet either 4g or normal internet connection. Other brokers don’t have this type of issue in their charts accept zerodha. its so annoying to refresh the chart again and again. I have made lost in many of my previous trades just because i din refresh the charts. i just don’t understand why this wrong chart only in kite but not in other broker’s chart.
Hello sir there are so many bugs in treading view(zerodha) some times it just moves horizontally not vertically some times it just lags or get hang and many more
sir kite point and fig chart not working properly very bad lag in inverse signal accour
Not getting you. Can you email [email protected] and [email protected] with a screenshot and explanation.
kite html 2 minut chart update
Custom timeframes is something we’re working on. Should be available in future releases.
@Nitin Bhai, BSE Sensex index kab add hoge. No option to add BSE sensex in watchlist. I have checked it from customer care they are also not aware.
#suggestions.
1. Two major index nifty 50 & BSE Sensex by default need to be on top of market watch. These are basic for all user, So it should exclude from watch list and place above that. (Change in index can be made from there only)
2. Last trade time for stock is not known. very important for trader. How much fast liquidity is in stock to buy and sell in minutes is most important for day trading. So if last trade time last trade qty is given it will help most.
3. Top gainer/looser by value and volume. Market news & announcement , Trading calls all are missing in mobile app and web version.
4. You have given 5 watchlist it is okay to add(20*5=100) stock script but Do you really think anyone tracks 100 stock.
5. Script Margin %, Very big point, if you cannot give margin calculator for equity day trading no problem but atleast given margin % of a stock. How can i calculate how much amount required for ITC 500 shares intra day trading. As each script has vary from 10% to 75 % margin so each script margin % required can be given with immediate update. Not required developers to go huge changes.
Lots of more key essential thing is missing in mobile app version and i can see updates are not getting frequent after so many suggestions from various users. You may have start brokerage firm as passion which has turned in vast business now. So Now you cannot go with same speed like beginning time of your business and you cannot left these inputs from various users unhandled. You need to be more hardworking and professional with IT Team. because YOUR BUSINESS IS NOW RUNNING ONLY THROUGH TECHNOLOGY. SO YOU NEED TO BE MORE ADVANCE IN TERMS OF SOFTWARE AND WEB TECHNOLOGY.
See now huge smartphone users in india and multitasking is in life like, travelling and trading, is part of life so mentioned suggestion need to be must have point in smartphone app version to make is practically useful app for day trading. I have already given much input here as suggestion not complained. I have switch Zerodha just because of brokerage charges but I see kite mobile app/web app is far behind from most of market leaders in industry which i used to.
Few of the features you’ve mentioned are already in our pipeline in the next release of Kite. The other requests, I’ll pass on the the Kite developers. The idea with Kite was we wanted to make it clutter free unlike other mobile trading apps. News/Announcements you can track on : http://pulse.zerodha.com
sir, plz introduce the replay button for charts.
thank you.
I lost my save chart all the time once I logout and login later, then I have to modify and save chart as per my preference which is somewhat unnecessary and time consuming. How to fixed such kind of issue.