
The 20 Market Depth (level 3 data) Window
I’ve driven a car for many years and I’ve even changed my car a few times now. Each time I changed my car, the engine remained more or less the same, but the features within the vehicle and its aesthetics continuously changed. Air conditioner, power steering, and power windows were all luxury features in the car at one point, but today, I guess no one buys a car without these essential features. The game-changer for me though was parking assist. The little camera at the back of the car gave me complete visibility of the parking space available. I was no longer required to pop and twist my head out and struggle to park the car, nor did I have to bug my co-passenger to get down and help me navigate my way into a parking spot. The parking assist feature did everything and helped me execute a perfect parallel park. The parking assist feature was my edge for hassle-free car parking.
I feel the same edge while trading the markets with the level 3 data 🙂
Level 3 or the 20 market depth feature is unique and has multiple uses. You’ll probably appreciate the level 3 market window if you have traded at an institutional desk. A regular retail trader would not understand this feature anytime soon, simply because this feature was unavailable all these years until we introduced it for the very first time to the Indian retail traders.
The purpose of this chapter is to help you understand how useful this feature is and get you started on building trading strategies around this feature.
If you are entirely new to this, I’d suggest you read this blog to understand what the level 3 data is all about.
Assuming you know what it is, this chapter will help you understand the multiple uses of this feature.
Contract availability
For the option traders, the 20-depth order book gives great visibility into the availability of contracts to trade and help identify better price points to execute these trade. Without this visibility, it becomes really hard to trade illiquid contracts. While I’m specifically talking about options here, you can extend this to Futures contracts as well, especially the illiquid ones.
Let us put this in context, have a look at the regular market depth (i.e. the top 5 bid-ask) of the 13000 CE expiring in Jan 2020.

We can see narrow bids on the left and a notch better offer on the right. You’d probably hesitate to trade this contract if you are someone looking at trading a few lots of Nifty.
But check what’s hiding under the hood here by opening the level 3 data –
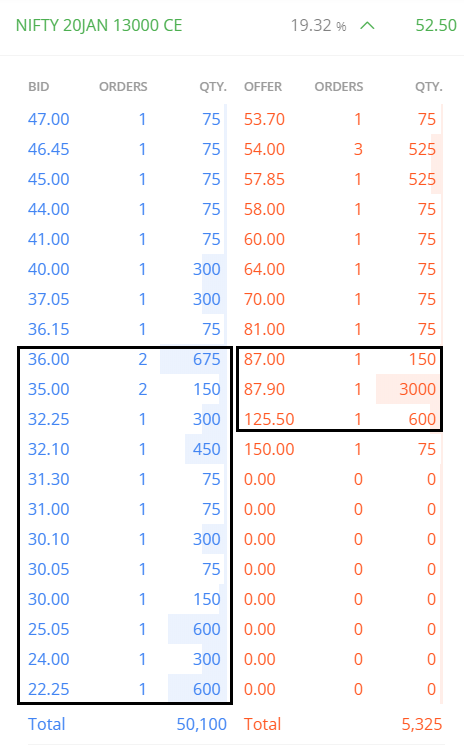
As you can see, there are many contracts available, but they are not visible in the regular market depth. In fact, the bid and offer quantities are heavily concentrated below the 8th row respectively.
Given the availability of the contracts in this strike, the perspective to trade or not completely changes and will now depend upon your trading strategy.
Execution control
Level 3 data gives you full visibility of the approximate execution price for your trade. This is particularly useful when you decide to scalp the market. When you scalp the market —
- You trade large quantities, i.e. buy and sell large amounts in quick succession to profit from small tick moves in the stock
- Since these are quick trades, you place market orders only
Let us say you want to buy and sell 5000 shares of Hindustan Zinc; the regular market depth window gives you the following information —
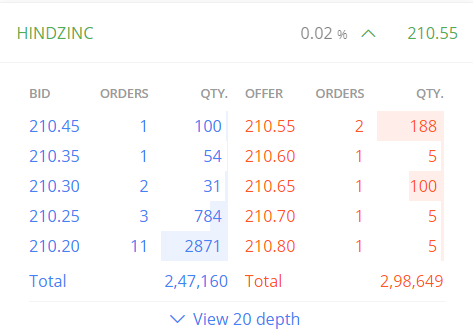
As you can see, there is no visibility on how these 5000 shares will get filled. Now, take a look at the 20 depth window —
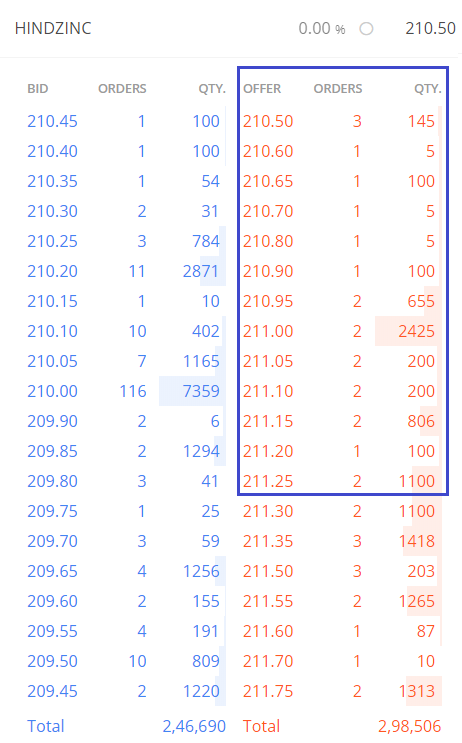
The 20 depth window paints an entirely different picture. It not only tells me that I’ll get the 5000 shares, but it also gives me information about the approximate buy price. If I were to place a market order for 5000 shares, I’d be buying this order book from 210.5 to 211.25. I also see at 211; there are 2425 shares available, so I can expect the average price is at or around 211.
Now, my decision to scalp the stock should depend on the pop I’d expect over and above 211. Maybe 211.5 or so. Of course, you’ll get the exact breakeven (post charges) if you were to use a brokerage calculator.
Position sizing
Level 3 market window plays a critical role in ‘guesstimating’ the number of shares to trade, given the liquidity of the stock. For the sake of this discussion, we will assume that the availability of capital is not an issue.
Now, have a look at the regular market depth —
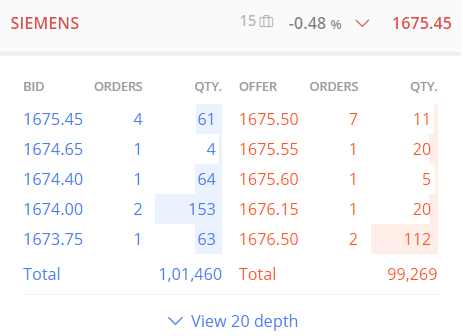
You expect Siemens to move from 1675 to about 1690 over the next hour. So, given the fact that you are not constrained by capital, how many shares will you buy for this intraday trade?
The regular market depth window suggests that you can buy close to 175 shares. However, the 20 depth opens up a different perspective altogether —
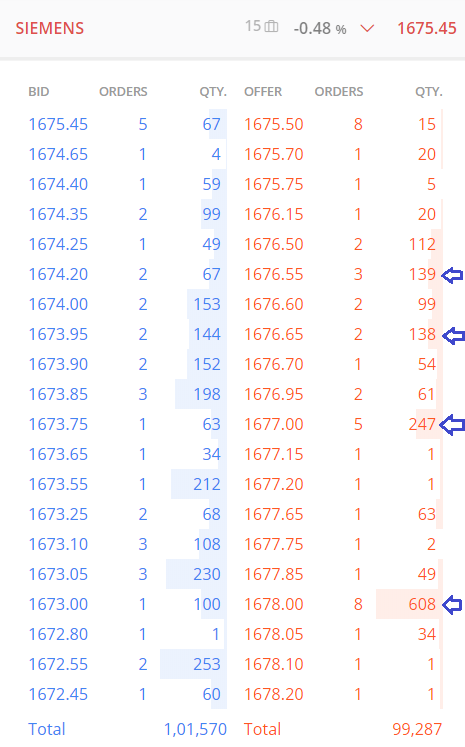
In fact, the liquidity in this stock lies below the best five bid and ask, and the impact cost is reasonable. The regular market depth window fails to capture this information. Assuming you intend to buy about 1500 shares, the buy price will lie somewhere within 1675.5 to 1678, which is spread of 0.149%.
In this case, assuming you are sure about the target price (1690), you can go all in and buy through whatever is available at that moment.
Order placement
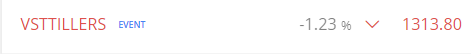
You can extend the position sizing concept and use the 20 depth market watch to place a stop loss or a limit order. Assume you have an intraday buy position in VST Tillers at 1313.8.
The question is, where you would place the stop loss for this trade? Can the 20 market depth help us with this?
Of course. Have a look at the 20 depth window for VST Tillers. As you can see, there is a concentration of bids in 1290. The good part is that the number of order count is also the highest (35) in 1290.
This implies that several traders have placed an order at 1290, indicating some sort of price action at that level. This perhaps builds a case for placing the stop-loss.
A prudent trader would probably place a stoploss not at 1290, but maybe at a price just below it.
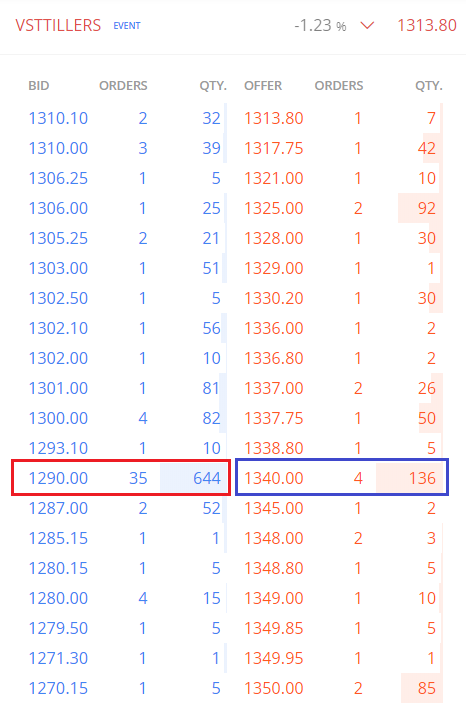
So I was a buyer in this stock, then purely based on 20 depth I’d probably place my SL at 1290 or below, maybe at 1287 and by the same logic, set my target at 1340 or at 1338.8.
Validate the support and resistance level
I find this extremely interesting. In the example above, we identified 1290 as the stoploss price, simply because there was a concentration of bids. In other words, we expect 1290 as a support price.
If this is indeed true, then it should show up on the charts as well, right? Have a look at the chart below –
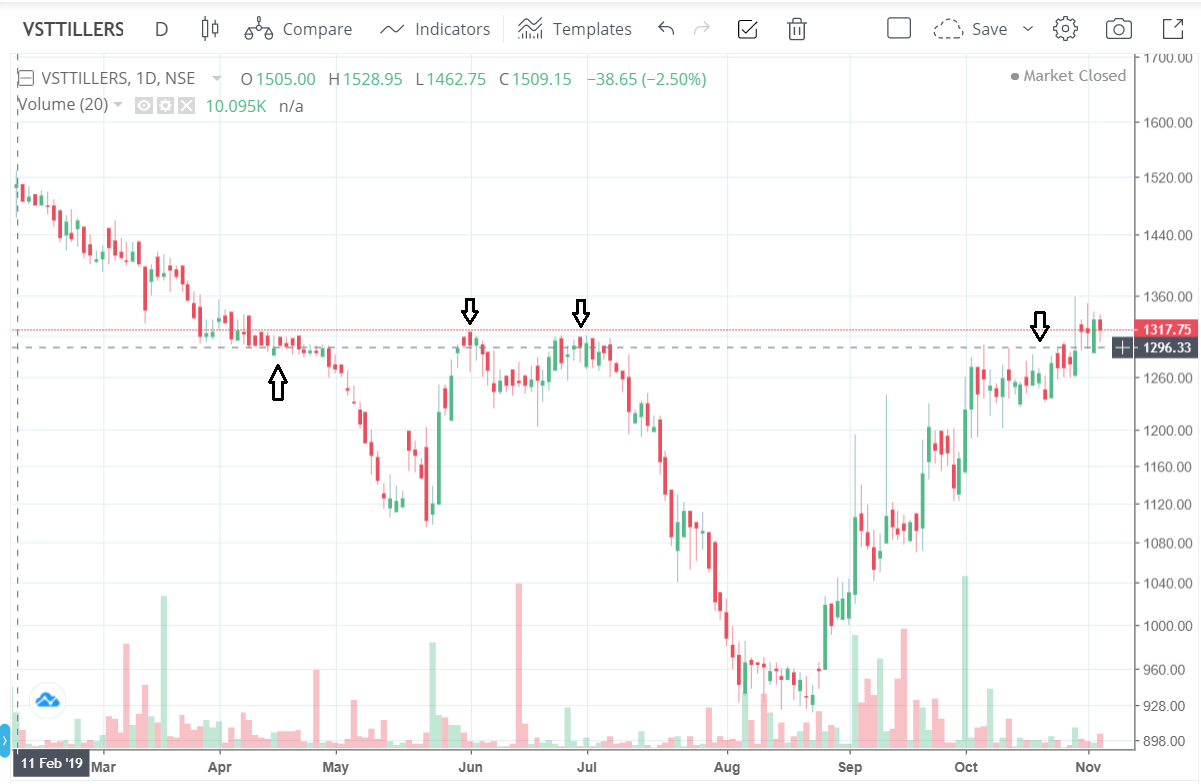
Clearly, there is some price action around 1296. Remember, support and resistance is not one price point, but rather a range. Therefore 1290 – 1300 marks as an intraday support for this stock.
This is a perfect example of seeing the price action concept play out in the market.
Another way to look at this is first to identify the S&R level and then check the 20 depth to figure if there is a concentration of bids/offers in that zone.
Hopefully, by now you’ve started to appreciate the immeasurable value 20 depth order book brings to you while trading.
Remember, irrespective of which technique you use to develop a point of view (technical or quantitative analysis), things boil down to price, and the action trades take at that price.
The 20 depth market window is essentially your ticket to validate the truth of this price action. Make sure you use your card wisely!
Do post your comments and tell us how differently you will use the 20 depth window for identifying trading opportunities.
Good luck!
Hi Karthik this chapter is still not added to the pdf and there a few numbering mistakes, would appreciate if you or the team could solve this
Thanks, let me check.
Hi karthik,
First I watched the videos and then reading the modules. I m impressed by the way you have manufactured the course.
I m learning these to enrich my knowledge not for trading but for knowing the nuances of share market as much as possible.
I m a retired banker and want to enrich myself in the manner that I should be able to teach others. I have given a challenge to myself. lets see.
Thanks for the kind words, and I\’m happy you found both the module and videos useful!
Hi karthik, can you please start making videos (if not already) like your team has done for all the early chapters of the module.
I feel they are more comfortable and easy to understand learning mode of communication apart being just convenient and time efficient. It’s my request if you can make them for all the remaining chapters and modules at earliest. It would be helpful if you can provide a rough expected timeframe for their upload.
And if those cards are not on the table for now, then just be honest about it, would also be great and not a problem, rather than saying ‘soon’ and leaving me in a hope. Thank you for your time and efforts.🙂🙂
All the content is here and we keep adding more, Shreehari. Do check all the playlist here, hopefully what you you are looking for is already there.
https://www.youtube.com/@varsitybyzerodha
finally completed module 1. It took about a week. Great learnings are there.
Glad to know that! Happy learning 🙂
For example if i want to sell the stocks at a price of x, but no one is offering to buy at that price. Will my stocks rejected from selling and stay in my account?
Yes
It wont be rejected, it will stay in the system (for the day) until a price match is found.
Dear Kartik,
It has been fascinating completing all your modules…I completed them a year ago..However when I saw the progress % today on app, it dropped to between 30-50% in various modules. I understand there have been some revisions, however am unable to distinguish the changes…so I have re read all of them which is not possible…So my request is if it possible..please highlight/mark the new changes everytime some upgradation is made…
Hoping to hear from you on this…
Thanks for the feedback, I will share this with the team.
started getting serious about stocks and want to continue as a passion ,completed module 1 today….
Happy learning, Rishi!
me too starting today
Finally, completed the Module 1 after days of reading. Thanks a lot for the work you are doing.
Now i have only two doubts form the module 1) in the market window, bid price, offer price, quantity is clear. So Orders = number of traders available at that point of time willing to buy or sell their shares at that particular price. Am i right?
2) under order placement, you said
\”A prudent trader would probably place a stoploss not at 1290, but maybe at a price just below it.\”
Why it is so? .., pls explain
Thank you🙏
1) yes
2) So if you place a SL at the exact price where there is high demand and supply, the the chance of that price getting triggered and bouncing back is high (only from my experience), hence I\’d personally prefer placing it slight above or below.
Okay. Thank you for the reply sir.
Happy learning!
Hi Karthik Rangappa,
I complete the module 1 today, thanks for your effort to make the clear content to undrestand the concepts easily.
i have some doubt in this reply. if i place SL at 1287 instead of 1290.
1290 has priority for sell right? then why 1287?
Sl is a single price point, so if you set at 1290, then your SL is at 1290, 1287 has no relevance.
When you place SL, you don\’t want to your SL to get hit. You set it because if the trade that you\’ve taken isn\’t right then you can limit your losses.
At 1290 there are some concentration of orders so there could be a high chance that the stock can hit 1290 stay there and rather than fulfilling all those orders at 1290 could bounce higher which can you give you a greater chance of getting into profits or reducing your losses further.
Hence placing the SL below 1290 is advisable based on the above information. I hope I was able to communicate my point in a simple way.
How would you detect if algorithmic trading is manipulating the offers and bids to push you (retail investor) into a certain trading decision?
Very hard. However, in my opinion your trading decisions should come from your trading thesis, not influenced by external factors.
Very surprised to see such heavy concepts being taught early on, am i missing anything in the flow .
Hmm, its an extension of the market depth discussion we had earlier in the module 🙂
First of all, thank you so much for imparting all this knowledge. i didnt understand support and resistance. For the first time, today i understood how to get stoploss and target.
Thanks Shubhalatha. Happy to note that you got the SL and target bit. Whats is it that you find difficult about support and resistance? Will be happy to help 🙂
Good morning, Sir. I watched your video on daily analysis where you mentioned that elections affect the market. I understand that central policies directly impact the economy, but how do state elections—like those in Maharashtra—affect the market? Is it because the BSE building is in Maharashtra? And how do elections in states like Rajasthan and Uttar Pradesh affect the market? Shouldn’t states like Haryana and Karnataka, which are more prominent in IT, have a bigger impact?
Also, I’m struggling to properly read charts and fully understand technical analysis from your module. Could you please suggest any good books besides your module that can help? I’m not sure what mistakes I’m making when applying price action and other techniques
As far as the markets are concerned, the state elections are only indicators of the local sentiment and what impact that might have on at the national level. Nothing besides that. BSE/NSE being in MH is not really connected with MH\’s election.
Thank you for putting efforts in this training. This is very helpful.
Glad to hear that, Prashanth. Happy learning 🙂
sir, we don\’t understand this topic at all please explain in detail with example, data and explainations given in this chapter are not resembling so we are not understand.
Hmm, which part Sunil? Is there anything in particular that you want me to explain?
contract availability sub topic in which charts and their data provided.
Sorry, unable to understand your query. Can you please give more context?
Best course for starting the stock market journey.
Happy learning 🙂
ARE THE CONTENTS ON VARSIRTY APP AND WEB SAME? SEEMS TO BE UPDATED ON WEB AND NOT ON APP.
Yes. App will go through an update soon.
Thank you so much sir for this incredible efforts for teaching. this is my first comment after completing the whole module of varsity. such a great information.
Nirali, thanks and I\’m glad you liked Varsity! Happy learning 🙂
Thank you sir for this information
Sure Vinay, happy learning 🙂
Hi Sir, What is price action? how is this used in trading?
Could you please help me to understand the concept in detail or direct me to any source of yours?
Hi Mounika, do check this video, I\’ve explained price action – https://youtu.be/1kQjXFL4Mfc?si=4AvdDaaewIAK3h6X
Amazing learning.
Glad to know, happy learning 🙂
In the youtube video(https://youtu.be/GYMqpIaWMck?si=UmFrYVi8IGmc76di) they were talking about being able to view 200+ levels on liquid scrips!
They deleted the video 🙁
Yes, was asking about full depth. Dhan offers it: https://blog.dhan.co/introducing-full-market-depth/
It provides fantastic insight into market behaviour. Institutions have built advanced tools by making use of the full order book
I\’ll share the feedback with the product team Vivek.
Hi karthik,
This is with reference to the comment above: https://zerodha.com/varsity/chapter/supplementary-note-the-20-market-depth/?comments=all#comment-521280
I was wondering how deep the order book went. Upstox now offers 30 depth. Dhan offers FULL depth to unlimited levels(https://youtu.be/GYMqpIaWMck?si=UmFrYVi8IGmc76di)
Does Zerodha have any plan to give more depth or preferably even full depth?
Not sure, will check . Are you looking for full depth?
Please provide me market depth data in index.i am using zerodha for a long time
It does not work that way. Check Nifty futures instead.
Please provide me market depth in index
Index is not traded right?
I had attempted tests for Module 1-Stock Market Basics for Beginner, Intermediate and Advanced. I had qualified for Beginner and Advanced. I had not qualified for Intermediate but I had viewed my answers by mistakes. Could you please help me attempt the Module 1-Stock Market Basics for Beginner final certification test.
Waiting for your positive response.
Hey Manoj, can you pls drop us an email about this – [email protected] ?
Is Level 3 data now available for option contracts?
Ah, no, I dont think so 🙂
Hi Karthik,
This is very insightful. Thanks a ton.
Just to clarify, the Stop Buy and Stop sell orders are held at the brokers end, right?
All these orders are limit orders, and can also represent profit booking orders, right?
Thanks Nikhil. By \’held at the broker end\’, you mean ordered routed via a stock broker? If yes, then yes :).
You can use these orders to for any sort of execution – to buy, sell, book profit, exit at stop loss etc.
I checked for level 3 data today and it keeps changing so fast. So my question is how can find out the concentratiin of bids and offer to decide the support and resistanc
The only option is to eye ball for concentration. Else you will have to code this.
Dear Team,
I am not able to see level 3 data for Nifty 50 options. Is there anything i need to do to see 20 market depth for Nifty weekly option
Ah, its for stocks. Please do call the support desk for this.
Love the initiative Karthik. You honestly are doing a great job👍
Thanks for the kind words, Arnav. Happy learning 🙂
Can you explain more about the three headings (bid orders and qty)? Couldnt get a clear explanation on any of the before chapters!!!
Please do check this – https://zerodha.com/varsity/chapter/the-trading-terminal/, have explained the terms here.
How can I download zerodha varsity PDFs in hindi
Hindi PDFs arent there yet I guess.
Okay! Are the modules linked to one another? Should I complete the technical analysis module before going for the fundamental analysis module?
Not really. You can however check the video series – https://www.youtube.com/watch?v=yzRP-mA2eiE&list=PLX2SHiKfualH_xMbGM-3zWC47s9gUjGR_
Hey Karthik! Hope this comments find you well. As you said that the market depth data keeps updating every second and is influenced by new trades . Don\’t you think this will affect price action?
It will, the point is to figure this and place your trades accordingly.
Hi Karthik!
Thank you for creating such wonderful content. I am completely new to the world of stock markets and trading. I have finished this module. I intend to identify some stocks in which I can invest my capital for a long period of time (years) instead of intraday trading. Which modules would you recommend me to study in this case?
I\’d definitely suggest you look at the fundamental analysis module for this 🙂
Check this – https://zerodha.com/varsity/module/fundamental-analysis/
WHY IS THERE NO \”SUPPLEMENTERY NOTE\” IN STOCKS MARKET BASIC PDF?? WHY???
Hmm, I guess the chapter was updated later on.
what about time and sales?
20 depth is price based. There is no time stamp data available.
Thank Karthik……After I posted the query I myself had a little bit of an insight if i may call it that. I began wondering if the maximum depth of the book might be equal to the maximum distance at which I can place a limit order and so I googled \”how far away can you place a limit order NSE\” and got some references to stuff like operating price range (OPR) and Limit Price Protection (LPP) on nseindia but ran out of time to investigate further. I\’ll just try placing an order 10% away and see what happens
Ah, yes, I should have pointed that out to you, dont know how I missed it. But yeah, best way is to experiment and figure. Good luck 🙂
Karthik, just out of curiosity how deep does the order book go? Is it possible to some day have access to 100 depth instead of the 20 we get today? Do institutions/market makers/HFT firms get to have the entire order book to unlimited depth?
Good question, I dont really know how deep the order book can run. Will try and figure 🙂
But for most traders, the top 5 bid-ask positions is good enough. Some traders prefer 20 depth order book, to see where liquidity lies. Beyond that I dont really know how it can benefit most traders, unless you are running an institutional book.
But as far as I know, even the institutions have 20 depth access.
Is the l3 data available through the kite connect API if, not how would one go about getting this data for programmatic use-case?
Not sure actually, request you to please check the document here – https://kite.trade/docs/connect/v3/
Hi Karthik,
very well written article. Thank you for this.
1 Question , \”If this is indeed true, then it should show up on the charts as well, right? Have a look at the chart below –\”
I can see the the 1290- 1310 acting as a resistance on older dates rather than support.
Can you please help elaborate more on this ?
There is price action around the stated price, hence it acts as resistance or support. Support and resistance levels can interchange, check this – https://zerodha.com/varsity/chapter/support-resistance/
IS 20 DEPTH ALSO AVAILABLE FOR COMMODITY MCX TRADING?
Nope.
Hii karthik,
This is om i have question is this varsity course fully updated? Because i can see here some comments are from 2014, 2017 and 2019…
Yes, the content is relevant as they are finance concepts which dont really change, and we\’ve been answering readers queries since 2104 🙂
Hello Sir,
How can i find the name of investors more that 5% stake in quaterly or annual report.
Regards,
Madhusudan
Please check the shareholding pattern published in the company\’s report, Madhu.
Hello sir I am very new to market… My question may sound absurd
Even if the 20 depth is displayed then also we can trade( buy shares) only on the last traded price … So if I open a 20 depth parameter of a particular share which I want to buy, showing last traded ( offer price) 1500 but somewhere down there in 20 depth parameter it\’s showing like 1400 rupees so how can I select that price and buy..
I don\’t even know what I am asking is a correct question or not? Plz help/clarify
You cant select a particular price on 20 depth, Kunal. The 20 depth gives you a cue on how the prices are trending, basis which you need to place your trades. So consider the 20 depth only as a guide to the price at which you want to buy or sell.
But how are the bids and offers of different different prices if the price of the stock is same for everyone ? Sir please reply !!
Think about as different prices at which people wish to transact in (bid-offer), but a transaction will take place only if the bid and offer match, and that is a trade.
Thanks for the clarification karthik
Sure, happy learning 🙂
Hi karthik, is there any other blog post where you have discussed how the total figure at the bottom of the market depth is arrived at? For example considering the siemens example above, the total bid qty is 1,01,570 and total ask qty is 99,287. These values keep changing throughout the course of the day, and unlike total traded qty/volume- which can only increase throughout the day, and can even go down as the day progresses. So if the total bid qty is 1,01,570 at 10:00 am, it can come down to 99,800 or thereabouts at 10:05 am. So does this total represent the outstanding qty that has not yet been matched yet or something else? How is the total computed?
Thats right. The bid and ask represents the total quantity that the traders intend to trade, but the trade happens only when the bid and ask match at a price, and thats traded quantity. The traded quantity can only increase over the course of the day. The bid-ask numbers keep changing based on the perception traders have on the stock.
GOOD
i want to know about charts with 30/60/75/ minutes duration. where can i found details about 75 minutes charts.
On kite itself, Gurjeet.
Therefore 1290 – 1300 marks as an intraday support for this stock. will it be support or resistance?
If its below the current market price, then support else resistance.
BankNIfty options doesn\’t have 20 level market depth. What about that?
Just I am starting study this varsity….
Feeling like I found awesome stuff.
May be I am too late but thankful for all the stuff you nailed here.
If you give questionnaire link for a learners after each chapter or each module that will be somehow helpful to us to build confidence.
Thanks Samuel, its already there on the mobile app, suggest you please download the same 🙂
The description about Price Action and Support & Resistance is simple and superb and clearly understandable.
Glad you liked it, Sriraman, happy learning 🙂
Why F&O have only level 2 depth?
Sorry, not sure what you mean. Can you kindly eloborate?
good work
Happy learning!
hi
do you have pdf in hindi
No, we dont.
Hi karthik ,There are some stocks in which I CANNOT SEE full 20 market depth, i am only able to see 5 bid, what is the reason for this.For eg as of today i am not able to see PFC 2O market depth but I am able to see ITC.Is this due to less traded quantity and volumes or what.
The 20 depth is available only for NSE stocks, Hardik.
Hello Kartik, Well designed module 🙂
In \”Order placement\” point the example you took:
You buy VST Tillers at a price of 1313.8 to target at a price of 1340. In window as it is appearing that interest start building at a price of 1290 with 35 bid with quantity of 644; which means it started showing support at 1290 but on chart isn\’t the red line showing the resistance zone instead of support zone; it might be go up. Please clarify. Also, correct me if I\’m wrong.
The chart is of EOD basis and the 20 day depth is intrday, Navneet.
Thanks Karthik.
Thanks Karthik for answering my query.
Could you please also elaborate a bit on how are the multiple orders within a second clubbed by the exchange and displayed on broker terminal?
Let’s say we have 10 orders going through in a second. 5 are hittting the bids and the other 5 hitting the offer. Does it display the bigger or heavier side of the trade. Like if the buy order was greater than the sell, then it would add the buy order quantity and display the avg. price of the buy trade.
Please let me know if my understanding is correct?
All trades are displayed. The bids-offers that you see is a collective order from multiple traders, but all wanting to transact at the same given price.
Hi Karthik,
For most of the stocks i could see the spread is 5 paise. Is this something standard for the Indian market or is it decided by the broker platform?
Why I\’m asking this is since I\’m learning trading watching traders from outside india, I could see the level 2 prints having all decimal places like 60.41, 60.46, 101.3 etc.
Also, if you could please elaborate a bit on the difference between tick by tick data and a 1 second snapshot data?
Does zerodha provide the 1 second snapshot data? If yes, how are all the orders clubbed for 1 particular second.
In India, tick size is 5 paise, pretty standard across all contracts. Tick by tick data captures all the trades that happens in the market and 1 second is the snapsot of the trades that happen within that second. There could be multiple trades within that 1 second.
I think I got the concept but not clear, so in general terms if I was ready to buy 100 shares at 28.5
and from 20 depth I see 80 shares at 27 rs so now I will place a limit order at 27rs. Sry if I\’m not clear to put down my doubt.
The idea is to see the way bid and asks are flowing and then figure where maximum liquidity is, Vinod.
Hi Karthik,
The level 3 data is actually helping me a lot in understanding the order flow. Thanks a lot for this feature.
Would it be possible for kite platform team to print the time and sales in a separate window as a list to compliment the level 3?
This would really help in finding the hidden orders and understand the orderflow better. This is the only piece i find missing.
Glad to know, Umesh. No, I dont think that will be possible 🙂
HI karthik,
Could you please let me know if your platform provides the feature of
real time time and sales feature for NSE Equity trading for
tape reading analysis along with Market Depth?
If yes, could you please share me the video or the document on how it
can be enabled on your web trading platform?
Regards,
Umesh Gupta
We do provide data real time via APIs, Umesh. Check this – https://kite.trade/
Hello Karthik,
I am very new to trading .should i first read all the chapters on the kite before starting my first trade or should proceed for trading.. The query is not very interesting but i hope i\’ll get guidance.
It probably helps if you read these once before you start 🙂
\”Contract availability For the option traders, the 20-depth order book gives great visibility into the availability of contracts to trade and help identify better price points to execute these trade.\” Yet I am unable to find 20 -depth order book. I am able to view 5 depth order book but unable to view 20-depth. I am able to view 20-depth order of an stock but fail to view option\’s 20 depth . I have tried this on using kite.zerodha on my desktop but still the same. If there are any requirement for this please let us know
Kedar, why dont you call the support desk for this. They will help you sort this out.
As stated earlier,
We can only see 5 market depth in zerodha for option contracts.. Why there in no 20 market depth in zerodha for option contracts..?
Could you please let us know when it will be available?
Or Could you suggest any other software for level 3 data???
Is there any other API to get level 3 information…?
Can you please call the support desk for this? They will help you with it.
Sir,
Suppose I want to study an industry business flow and related factors who impact the industry positively/negatively. can you suggest from where can I specially get to know a particular industry business flow? Any reference pls?
We have started to write about it – https://www.youtube.com/watch?v=dMjce5P4j-Y&list=PLX2SHiKfualE4o4joBMXM_YHGBKnZSQbs
Sir,
How many types of industries are there under Nifty 500? Can you share a link mentioning the list?
You can check the Nifty indices website for this Anirban.
Sir,
I am doing a job now and trying rigorously to learn your material in Zerodha since the past 5.5 months. I can afford to give 2 hrs daily on reading. Now, since I am already learning the basics of capital markets, all the 2 hours are getting devoted to learning now. Keeping in view of this, however, I have thought of studying the business newspaper but it is quite difficult to learn this since all the time is now getting to learning. Request your suggestion on ways how to keep me updated on daily news. Should I start reading any business newspaper or there is any weekly newspaper which I can learn at the weekend. I thought of LiveMint but I have no experience on time consumption to cover the newspaper daily. Please suggest ways out.
Anirabn, you can track all news here – https://pulse.zerodha.com/ , its a one stop place. Even Twitter is a decent place to track news 🙂
Hello sir, is this feature still available? one of my friend is recently opened account in zerodha. he is not getting the feature may be due to RS 100 brokerage is not generated by his account. Is that much brokerage required is still a condition?
Kiran, not true. This is open and free for all now.
Reason?
We can only see 5 market depth in zerodha for option contracts.. Why there in no 20 market depth in zerodha for option contracts..?
Its temporarily disabled but will be back soon.
Can I buy the offer at a lower price and sell(bid) at a higher price?
That may not be possible 🙂
Thank you for such a quick response.
Happy learning!
Hi Karthik,
By far the best content to understand markets!
I am going crazy with understanding the bids and asks! Please advise.
So there are over 250000 bid quantity at say Rs. 100. This means there are so many buyers here that the market will not go below 100. But this also means someone is selling those to buyers. Does it mean there is a support or resistance? Will market go up from this point or will there be a fall because of all the sellers selling at Rs. 100 to the buyers???
More Bids = support??
More asks = Resistance???
Thanks Sonal. Bids and Asks keep changing, so its very hard to consider these as S&R levels. Do watch this video – https://www.youtube.com/watch?v=-h1R5oIL0PI&list=PLX2SHiKfualH9XGLv9r1sdKucoGky35J7&index=5
First of all great content. I mean I finished the first module now and I love it. Thanks for this type of content.
Happy learning 🙂
I can\’t wait to explain this to others and let them know the significance of 20 depth.
Sure, happy learning 🙂
Dear Karthik Sir, I am proposing a minor change to a word in this chapter,
Current Sentence:
`and the action trades take at that price.`
Corrected Sentence:
`and the action TRADERS take at that price.`
Noted.
Dear Karthik Sir, I would like to propose a small change to a sentence in this chapter,
Current Sentence:
`We can see narrow bids on the right and a notch better offer to the left`
Corrected Sentence:
`We can see narrow bids on the left and a notch better offer to the right`
Ah, thanks for pointing this. Will change.
I this Varsity is one the best authentic source on Share market concepts. Keep up the good work
Glad you liked the content, Jatin. Keep learning 🙂
HOW TO WATCH COMPLETE ORDER BOOK/FULL MARKET DEPTH ?
You get order book with top 20 bid-ask at best.
Thankyou
I have been looking for this has been the silver bullet that I have needed to execute any trades
Thankyou
Now I need to find who can provide level 3 can you help Thankyou
Zerodha does 🙂
Having mentioned that this is useful for Options trading, how useful is it for intraday trading?
Just like the way futures and equity trading 🙂
Dear Karthik,
From 0 knowledge to something in markets, definitely because of these modules, thanks a lot for those.
I had a question regarding foreign organizations, like Indian organizations publishing (D)RHP or Annual Reports contains all organizational level data including manufacturing units, number of employes, models their prepare, area of business.
I Didn\’t find this type of data for foreign companies like Meta.
require your valuable insights…!
Charan, they too publish this data. Check for SEC filings for Meta or any company of your choice and you will get all the info.
such an amazing explanation.
Able to develop a new POV
Happy learning, Sourabh!
I am unable to see 20 market depth for Nifty or Bank Nifty Options. Stocks 20 depth is working fine but options is not
Only on stocks for now.
These all were wonderfully written Modules and really appreciate what all you are doing. Thank you publishing such awesome content FREE of COST and learners like me will thrive for a life on this.
Written back then is still so relatable. Cheers!
Happy learning, Shubham 🙂
Is 20 depth only valid for Future and Options? Like if I only want to trade in cash, is this still valid?
Disha, 20 depth is available on all NSE stocks and F&O. Not available for BSE, MCX, and CDS.
I have completed module 1 and I have gained so much information about the markets
Thanks for your wonderful insight
Happy to note that, Manikanda! Hope you continue to enjoy learning on Varsity 🙂
sir i actually didnt understand this chapter much. do you think i will better grasp this after i read the TA module
Venkatesh, we also have a set of videos that you can watch – https://www.youtube.com/watch?v=yzRP-mA2eiE&list=PLX2SHiKfualH_xMbGM-3zWC47s9gUjGR_
Do we also have details of the type of traders (institutional/market makers etc) that are buying and selling a stock like in Nasdaq Level 2 data.
Yes, we have level 2 data as discussed in this chapter.
I sincerely appreciate all the effort that was put into making these modules. They are very informative and easy to understand. Learning about the markets has become fun because of the way concepts are explained here. Thank you sincerely to the team and people behind it.
You\’re literally feeding our minds one module at a time.
Happy learning, Shreya 🙂
Thanks for the kind words, Shreya. Happy learning 🙂
hi sir..
can you please explain me about bid and offers, And how this details will be helps to trade.
Have done that earlier in the module. You can also check this video – https://www.youtube.com/watch?v=5t5O0MnNJNE&list=PLX2SHiKfualH9XGLv9r1sdKucoGky35J7&index=9
Great Start For Who Want To Be In Stock Market For Life Time 🔥Thankyou so much 🙏
Happy learning!
Hi Karthik, just out of curiosity – Does Zerodha have to pay extra to the exchange for obtaining this level 3 data?
i guess if we need to understand this module first we need a good clarity on the future and options .
Not really. This is the basics module.
Good explanation, Sir
Thank you..
Happy learning!
How did we end up with the 0.14% spreed.thank you
I have explained this in the chapter itself I guess.
Hey, can we have this level3 data in the form of priceladder like how fyers has(there price ladder lags like crazy though).
Also why does the API not let us get the level3 data?
Sharing this as feedback to the team.
Thanks sir for this information i need this kind of Knowledge.
Happy learning 🙂
Yes, appreciate the immeasurable value of 20 Depth Order book u have depicted as well as ur selfless style of presentation,word of clarity etc. for everything.
Happy learning!
Hi how can I have data level3?
Its enabled for you, click on market depth and open it.
Hey Karthik, have you guys thought of displaying this level3 data in the form of a price-ladder?
Its pretty weird but no trading terminal/software in India, provides a price ladder for >5 market depth, even though its a common feature outside India.
Or you could consider partnering with platforms like GoCharting/Sierra Charts/Bookmap and provide them your level 3 data that could be displayed in DOM price ladder.
Hey Tom, thanks for the feedback. I guess the team had explored the possibility of a price ladder. Let me check with them to figure out what constraints we have for not doing this.
1) I have an online trading account with Angel broking and have some equity shares of different companies.
2) I want to open an online trading account with Zerodha.
3) is it possible to transfer all the shares from angel broking to Zerodha online without any paperwork?
4) I wouldn\’t like to continue with angel. How can I close demat & trading account of angel?
5) Please guide me the transferring process.
Yes, that\’s possible. Here is how you can do that – https://support.zerodha.com/category/account-opening/getting-started/other-queries/articles/how-do-i-transfer-shares-from-another-demat-account-to-my-zerodha-demat
Last question is based on, when we are doing option trading in nifty and banknifty
Can we get data of traded quantity in terms of no of buyers and sellers during live trading (in 5 min candle) ?
Please do check the market depth window for this.
The provided in the 20 depth, one of them is total bids vs total offer. Now, if I am wathing this data @ 11:30 and my chart is 5 min candle then @ 11:35 total no of bid and offer that will be shown in the dropdown will be from since opening of market or between 11:30 to 11:35?
If we have total bids and offers since opening market how can we get it for 5 min candle? ie No of executed orders (option contracts) during those 5 min chart?
You just have to track the volume information, Anupam. The volume will give you a sense of how many trades have taken place for the day/moment.
In this supplementary useful knowledge we get to know how many order quantity are either being put for buy or sell. But how can we know or get the data for no. of order quantity which got executed squared off or bought oe sold. I want the data for executed orers. How to get it?
Thats the traded quantity, and the end-of-day total volume is the traded quantity for the entire day.
20 depth is very good thing but it oy show the data of ZERODHA traders not all the active participation in the share market….so how much i can be assure on zerodha\’s 20 depth structure????
20 depth is across the market and not just Zerodha.
why we place stoploss at price(Rs.1290) with which more sellers are placed order?
Its the buyers, Dilshad.
hi,
i am placing a options sell order after looking at level-3 data, the price there is much higher than level-1 data but the order is not getting executed despite placing a price matching order. can you please help in understansing the price discrepancy.( it is 10-12 rs. higher)
Jagdish, as you go deeper down the price ladder, liquidity dries up, which means the bod and ask spread increases.
HI, TODAY NIFTY FEB 17300 CE TRADING AT 88.
5 BIDS AND OFFERS ARE BETWEEN 87 AND 88.
BUT 20 DEPTH BID AND OFFER PRICES ARE BETWEEN 104 AND 106.
HOW DO WE INTERPRETE THIS.
PL REVERT.
NOTE- STUDYING THIS ON VARIOUS STUDIES SINCE A FEW DAYS
That\’s because the liquidity dries up after the initial few bids and offers, Percy.
Hi sir,
Sir can I add my Varisty certificates on Linkedin under licenses and certifications
I think you can Chandu.
What is the difference between order and quantity?
Order is the act of placing an order in the exchange, quality is how much you intent to buy or sell.
What is ojas TECHNOCHEM share price
Sir
Please give the solution of my problem.
Many days I feel unmotivated in market and feel boring. Many days i think what I can do in market, feel hesitate in market. And loosing my knowledge is required when no trading signal . I use grand checklist but never it\’s 6 point matched in signal.
Feeling demotivated is a natural. Especially on days when you make a loss. But if markets are an area of interest to you, then the bounce back from the demotivated state is quick. If you are unable to bounce back quickly, then you need to reevaluate if markets are really for you. Do introspect if you got into markets out of some external pressure or compulsion. If the answer is yes, then maybe you should stay away till you feel naturally motivated again.
Good luck!
Sir,
Your work is phenomenal and I am very grateful. It is my personal request to you to create a similar content on crypto and forex, or atleast suggest some source of equal value.
Thanks,
Thanks, Chandan. I dont know much about crypto, so cant really write about it 🙂
very happy to complete module 1! heading over to module 2 soon!
Happy learning, Ahishek!
Excellent content and clarity.
Thanks Karthik and zerodha for knowledge sharing
Happy learning, Anand!
Hello Karthik,
Thanks for an insightful view on how to create Position Sizing through Market Depth. But just curious to understand, let\’s say in the Siemens example above, where we have the Totals in Blue (1,01,507) & Red (99287), does it in anyway imply that the short term view of price action is Bullish (& vice-versa) to make our POV more solid about it being bullish to take a long trade ? Please advise accordingly. Thanks in advance, and once again Kudos to you and your team for creating absolute Encyclopaedical Knowledge for everyone on Stock Markets.
Gaurav, the thing with bid-ask total is that it\’s very transient in nature. It changes so quickly that it is difficult to build a fresh thesis, but you can use it as a tool to support your thesis. For short term take, you need to check the prices (price is the key driver), and then associate them with the bid-ask tally.
A follow up comment:
What will be the nature of DOM when the price is moving sideways.
Karthik, what I am trying to understand is, how will the order book act, when the stock is (intraday) Bullish, Bearish and sideways.
It would make it very ease, if you could answer questions from both the comments.
Thank you,
J.
So the way to look at this is straightforward, look at the price, direction, and the order book in conjunction. If there is a lot of movement backed by volumes in the orderbook, then you can expect the directional move to continue, simply by virtue of a fat orderbook. But this is very transient, the very next second the dynamic of the order book may change. So the point is, any trade decision that you take based on level 2, make sure to cover that position quickly.
Hi Karthik,
Can DOM, be also used to partially confirm the direction of a move?
Assumption: Stock A Might break an intraday resitance level, and may go long unitl held.
Questions:
1. What is the possible scenario happening in the DOM, will I see increased quantities of bid, or will I notice offers being filled very quickly? Or offers moving very intensely?
2. And If I had taken a long position, where can I anticipate myself being stopped out, in other words, what would be the nature of DOM, when the price may start reversing.
3. How can one use DOM to anticipate a reversal, when the price is trading at all times high.
Thank you,
J.
Its possible, but this is purely for scalp trades.
When a quick move happens, backed by heavy either bids or asks, then you can expect a lot of orders hitting the exchange, and the trend to continue. About stopping out, dont think DOM will be of much use.
Is there any other type of securities?
As in?
What is securities? And what it\’s type? Sir please explain in simple…
Stocks are also called securities.
really very helped to me. thank u and love you zerodha
Happy reading!
Why 20 depth not working for voltas future? Any specific reason only VOLTAS not showing 20 depths
Perhaps there was no liquidity beyond the first 5 bid-ask?
I am beginner, and learning a lot things from this. Thanku Sir.
Happy learning, Harsh!
I am reading about the market for the first time so is it wrong that I could understand half of this chapter ??..or should I read a few later chapters and then come back here ???
Chetan, I\’d suggest you start from the first chapter and get back to this chapter later on.
Is 20th market depth available in zerodha? Can I monitor it from there?
Yes, it is.
Happy Teacher’s Day,
Learned a lot from this wonderful creations.
Thanks, Vijay! Happy learning 🙂
Appreciable article on DOM.
This attracted me to open account with Zerodha
but I am bit skeptical on extra charges if any
to avail 3 level DOM facility for a new and novice trader like me.
Thank you very much !!
No extra charges, DOM is free for all now.
Thanks
only limit orders will be shown in market depth right ?
Yes, because market orders get filled.
Sir please provide the hindi pdf also.
needs hands on training. wld be grateful if u make a live vdo. please
I see the button for 20 depth sometimes, but otherwise I see 5 levels only. Why is that?
It is available only for NSE scrips, Maz.
Best for retail investor
Can it get on kite connect api???
Sir the third module after technical analysis is option trading in the app whereas in the website it\’s fundamental analysis.which one should be followed?
You can take up what interests you, Sharal.
Have been using 20 Market depth for last years never thought from the support and resistance POV. Thanks for this amazing POV @karthik sir!
Happy learning, Manish!
As 17yr old newbie to this feature , I feel like as if my brain is completely being destroyed and rewired to the opportunities this can present .
Thank you Karthik sir.
Happy reading Steven! Glad you started this at a young age 🙂
Wishing you the best!
We often see large sums order on the lower side of the bid/ask which are pending but when their order comes closer to the execution they just fade away, is this a way by market makers spoof us?
Ah, a lot of orders gets placed and cancelled. IOC order types 🙂
very well explained about the market depth, contract position, how to estimate the buying and stop loss preference, thanks lot
Good luck and happy trading, Jagan!
Very nicely written, thank you..
Happy reading, Suneesh.
Hi Karthik,
What is Support & Resistance? Is there a way to offer a better explanation of this concept.
I\’ve explained this to the best of my capacity here – https://zerodha.com/varsity/chapter/support-resistance/, do check the comments as well.
Great initiative! Financial literacy is the need of the hour. I myself am new to this arena and I found Varsity quite helpful. Thank you.
Happy reading, Manasi! Hope you continue enjoying reading on Varsity.
Please ,make a book of varcity in hindi or english version that we can buy it
Hi, this chapter is a bit confusing to me. Is there any blog/video where I can refer to the concepts explained here in detail?
Some things I did not understand:
For the intraday VSTTillers trade:
\”So I was a buyer in this stock, then purely based on 20 depth I’d probably place my SL at 1290 or below, maybe at 1287 and by the same logic, set my target at 1340 or at 1338.8.\”
Why would you place a SL at 1290 or lower?
Not sure if there are any videos on this topics. 1290 or lower has a maximum concentration of order, hence.
Nice
Hi Nikhil sir
Thanks you for sharing the educational content with the world. Your efforts mean a lot to us.
I have one query with regard to certification, can I receive a credential id and credential url post completing the module quiz. It will be helpful for me while sharing it in my Linkedin profile or resume
Hope, you can help me with this.
Thanks again.
Sharing this with the team, thanks for the feedback Shubham.
Hi sir
Great work I learn lots of things through this…
Credits to – Mr.Rangappa
Happy learning, Vignesh!
In case of VSTTILLERS, what\’s the logic in setting SL at 1287 and not 1290? And similarly the Target at 1338.8?
Hmm, I\’ve explained this in the chapter, right?
This is weirdly answered in a way that it\’s easy to understand
Happy learning, Aradhya 🙂
Sir you block is great
Thanks Karthik for this wonderful explanation!
Happy reading, Omkar.
To be honest I didn\’t quite grasp the concept entirely, but I understood it to be a feature that shows more than the normal market depth window, enabling traders to make more informed decisions.
Yup, that\’s about right. If you are comfortable using the 5 depth, then this is just an extension to it 🙂
It is for show off only. Whenever there is big move then it is getting stucked for even an hour also. Then what is the use if it doesn\’t work in crucial time.
There was a small issue, but not anymore. Please check.
Holy Crap! I am new to trading futures and options and finally understood what \”Support\” prices are and how they are identified. This will surely help me in setting the right SL and Target prices! So insightful.
Good luck 🙂
Zerodh team always different from other , excellent
Thanks
Happy learning, Rakesh!
is there any material to study
Hi Karthik,
So as you told, you are converting tick by tick data into 20 depth.
1. Why 20 only, why not more than 20 which can cover more price range than 20 depth.
2. Is it possible to get more depth if we buy API from you or in any other way
Please let me know in detail
Thank you very much.
1) This is relayed by the exchange, btw, 20 depth covers most of the orders anyway.
2) Nope.
I am not able to get 20 depth
I tried several times to as mentioned phone no
Very difficult to reach staff
Kindly up date to me immediately
Regards
Ashok Kumar
Senior executive engineer
There is a small issue with it, you should be able to view it t\’row.
Hi karthik,
Yesterday and today also level 3 data not getting. When we can expect it. Plz resolve it ASAP. Tq.
Most likely tomorrow.
Hey!
Should I finish every module first before starting to invest?
Or can I just start right now and learn in the process?
Also, any specific order in which I should follow this course?
I\’d suggest you learn Fundamental Analysis before you get into investing.
Hi Karthik
Level 3 data not getting in kite. Please check it.
I think the 20-depth feature on Kite will not be available today due to a connectivity issue with the exchange colo (from where we receive tick by tick feeds through which we create 20 depth). You should be able to use the feature normally from tomorrow
Whenever i decide to buy shares for intraday, i first check the total quantity of bid and offer and if the bid side is more than offer ,i buy the shares thinking that the price will go up.idont know how this technique clicked in my mind,whereas nobody has explained abt it anywhere,but whenever i do i mostly succeed.any idea abt this?
Pallavi, I\’d suggest you pay more attention to the candlestick pattern than this, it is far more effective.
As every one told, it is amazing feature but, I believe for options trading especially for buyers this 20 depth is not sufficient because it covers range of +/- Rs.1 from LTP. Is it possible to provide range of +/- Rs.20 from LTP in separate window ? so we can guess big move in that option.
For example NIFTY 20th May is trading at Rs.21.75. If u provide depth for
1. Rs.20-21,
2. Rs. 21-22,
3. Rs 22-23 and so on for offer side.
What do you think, karthik ?
These quotes are directly from the exhange. We show what the exchange provides, we don\’t have control over this data.
It was working for equity but for options getting stucked. I will also check on Monday and let you know.
Sure, good luck Sivasankar.
Read the first module. Loved it and looking forward to learning to trade with varsity. 🙂
Happy learning, Arihant!
It i.e level3 data is getting stucked in kites many times but 5 bid ask window working properly. Plzzz improve it
It was working good at my end today. Let me check on Monday again.
thank you Karthik !
Great job Zerodha Team !
You guys are creating a new India by spreading financial awareness.
will try to join your revolution somehow 🙂
Happy trading and happy learning, Sudhanshu!
Sir, are you going to add financial modelling as a module in varsity?
Yes, hopefully soon.
Very nicely explained.
From the above examples i have some doubts….
1. When the current of the scrip is at 1313, then why should some one place buy orders at 1290, 23 points away on an intraday basis.
2. Also the stop loss and profit target are two large… And it may not be possible to reach in intraday…. So the orders which are not executed will open for the next day also.
1) For a better buy price?
2) Hmm, you will have to think in terms of percentage.
hello, how i could get the certificate of your course.
Please download the app, its available both on iOS and Android. The certification is available there.
Thanks Karthik that was pretty simple one. And I thought derivatives were tough one. Need more clarity on each topic ahead. Tha ks again.
Happy learning 🙂
Excellent content !!! Simply fabulous !!
Thanks, Ashok.
In Zerodha, 20 market depth cannot be seen in currency derivatives and commodities. can you pl guide how I have to go for it in Zerodha.
Its only for Equities for now.
thank you zerodha…
Good luck and happy trading!
Hi Sir,
I would like to ask a doubt regarding a statement you told in the comments section : \”there is no way one can identify disclosed quantity. By the way, level 3 helps you identify contract availability. Given this, the disclosed quantity, if any, will only make the liquidity situation better.\”
What is meant by a disclosed quantity and how will it make the liquidity situation better?
Not really because disclosed quantity never gets exposed in any order book. It is like buying wanting to buy 5 chocolates at a shop, but you keep buying 1 chocolate at a time, the shop keeper will not know how many you really want but will keep selling you 1 chocolate every time you ask for it.
Thanks – worked like a charm! Just read it yesterday nite & used it today & works to the T!!
Happy reading and trading, Gautham!
I can still see numbers under market depth.. after trading hours .. what does they indicate?
…ya I am new to this field
Maybe the post-close you\’ve looked at. Its open from 3:40 to 4 PM.
This 20 market depth data does help in identifying support & resistance in intraday trading… This can be used in conjunction with chart(minutes based) in the background on Kite….
Would be very useful if traded in high volumes.
Thank you team Zerodha for providing this facility for retail traders👏
Keep developing & incorporating new software technologies on your platform 👍
Happy trading and learning, Neeraj!
Hey the 20 market depth visible on a stock is order placed in the market server or at Zerodha server???
All feeds are directly from the exchanges, Sohail.
Is there any certificate available to complete this course?
You get a certificate if you manage to clear the quizzes and certificate on the Varsity app.
Okay, but I think we can guess based on bid/ask volume ratio.
Is the \”total bid\” in the above chart means the volume of shares that is sold to bidder, or is it only the bid offer that is not traded yet? Please clarify this one.
Thanks.
These are the quantities available to trade at this moment, it can be traded. But remember the traders can cancel these trades before they execute.
Is the \”total\” in Bid/Ask chart is Bid/Ask Volume? Bid/Ask Volume is the number of shares changing hands, Am I right?
if the Bid volume is double than Ask volume, price is likely to go down?
If the Ask volume is double than bid volume, price is likely to go up, is that Correct?
Thanks in advance.
Manish, it is very hard to conclude the direction of the price based on bid/ask since the bids and asks keeps changing every second.
Thank you so much! reread is another form of practice and this will help in long run to understand the market for newbie.
Good luck, Kunal!
Hi
Can k but or well stock in point means for example A company share 831 market price i want to sell it 834.5. is it possible in zeroda.
Sorry, I\’m not sure about your query. Can you please give context?
Me and my mother were discussing about tata chemicals and we found that near the start of 2020 the prices shown by different platforms like moneycontrol , kite ,tickertape and trading view do not match.
Please check why is there difference in prices shown by different platforms , and which one\’s data is right.
Are you sure you are checking EQ series? Prices cannot differ. Or maybe there was a corporate action and that dint reflect on other platforms?
You mentioned – \”We can see narrow bids on the right and a notch better offer to the left. You’d probably hesitate to trade this contract if you are someone looking at trading a few lots of Nifty\”
Has the image been changed as bids are on left while offers are on right. Not that I want to point out a gap but I just want to be clear with all the terminology being used here
Must be an oversight, let me check this again. Thanks.
Please add volume in it if possible or we have to use chart to check volume at saturated levels.
Pradeep C Pradhan
You want to add volume to?
Thank you for clearing this basic concept…cheers
Good luck!
In the market depth data what does the color(blue or red) on the numbers inidicate. Like in the above example of Seimens, some data is shaded in blue or red depending on Bid or Offer data.Further some data is partially shaded and while others are not or completely shaded.Please clarify.
Blue is the price at which you buy and red is the price at which you sell. The shaded part indicates the quantity available.
Very informative. But for retailers it seems not so realistic to use it. Market changes in seconds and one should have at least some time to analyze.
It is best to use it to get an overall perspective.
hi I am a ca student with very much interest into the stock market would it be enough to start my trading after completion of these modules, and I would thank Zerodha for providing wonderful content free of cost. i would like to receive assistance from you to enter into the market .
Yes, this will help you to some extent. But your real insights will come from real trading experience 🙂
I think even though disclosed quantity may not give the actual numbers for an offer or say 100% accurate info, the quantity across all the 20 depths may be considered to have similar variance between actual and disclosed and hence, still may give us a general idea and help in utilizing the information gainfully, as intended in your article.
Hmm, the objective of disclosed qty is to not give the accurate order info, else oy would defeat the purpose 🙂
Is it possible to check view chart and market depth on mobile kite in single screen.
Nope.
I want more on level 3 in f
need API for kite connect for data , to apply own strategy , is it possible?
YEs, do check Kite Connect for more details.
Ok.Thanks.
Good luck!
Prints show the buy orders and sell orders executed in a separate window.If bid orders are repeatedly printing with lower prices the stock price is coming down and vice versa.I think foreign brokerages show the trades executed in a separate window.Also called time and sales if i am not mistaken.
Hmm, I know, but I guess this will be tough. Will share a word with the team.
Hi,
Any plan on adding prints to the level 3 data feature.
Prints?
Sir, Can you please clarify that If some one writes false information in disclosed quantity how can we truly understand the actual size at that level ? For ex- an Ask size at a price 100.0 is showing 350qty but actually the seller placed order to sell 500qty. He disclosed 350qty only making the size small.
Please correct me If I am wrong some where
No, that is not possible as the system wont allow that.
Please let me know when will your team fix this patch. I will then download the pdf\’s accordingly.
Thanks & regards
Hi Karthik, I saw on this particular module and some others, that the number of chapters mentioned in the module, all of them are not coming in the pdf. A couple of chapters are missing in some modules. Anyway you can fix this please?
Regards
These are new chapters which got added recently. Will try and get them updated.
You have given to look from another perspective and I have applied it today it works 110%. Thank you for sharing this gem!
Happy trading, Arshad!
Chapter 15 is not integrated in Module 1 PDF. Same is with some other modules as well. Can you please fix??
Thank you
Thanks, will point this out to the team.
Regarding the usage of this data for placing options trading.
Does that mean, if I put limit buy order at the prices shown in offer, then that would be fulfilled? or would the order be first full-filled for the lowest offer first?
What would be a trading strategy in such a case?
Limit order helps you fulfill the order at the specified price, Dinesh.
Dear Karthik,
I know this may sound silly but i am not able to understand the pictures which have the blue and the red text on em. If its not too much, could you explain it to me in much simple terms?
Rishi, that is called the bid and ask price. Do check this chapter, section 9.6 – https://zerodha.com/varsity/chapter/the-trading-terminal/
Hi, Karthik… Thanks a lot…
I had started few days back and reach up to here. You had not told anything about finding of S&R level.
Can you brief something on that or does we have separate module on S&R level finding?
Not sure how you missed this. Check this – https://zerodha.com/varsity/chapter/support-resistance/
Hello Karthik, compliments for the quality and simplicity of the write up.
Any updates on the depth 20 for commodity?
Not yet, Yatesh.
completed the first module. it really helpful for new traders. thank u sir.
i have a doubt
if number of total bids are more compared to total offers in a share , then that share will form bullish and if it is vice versa means stock moving bearish. Is this really true?
That\’s not true at all. In fact one of the most common misconceptions in the market. I\’d suggest you ignore it completely.
Sir i am not able to understand this concept of market depth 20 and how it can benefit me in trading please explain
I\’ve tried to explain the same here in this chapter, Pratham.
Hi,
When I downloaded the pdf for different, I found that few chapters in many modules are not included in the downloaded pdf. Is it a bug or is it going to come into the pdf in the future?
Thanks.
It should be updated, let me recheck.
Why this facility is not available in BSE
Not for now.
Oh.. Ok. Np 🙂
Can u kindly make me understand the reason behind it??
Is it because of bandwidth issue or are there any regulations restricting it? Because since you are providing level 3 data(eg : depth upto 20) on kite application what is restricting you do the same for api?
No, not bandwidth issue 🙂
If there is lack of liquidity, then it does not matter which one you look at – top 5 or top 20, the order book will be empty 🙂
Hello Sir,
This is a nice initiative. Kite connect API are providing level 2 data as of now. Is there any plans of providing level 3 data through api\’s??
Not for now, Harsha.
sir, i didn\’t understand why to place SL order at 1290 in above example.
That is the likely support area, Prem. Please do read up the chapter on Support and Resistance – https://zerodha.com/varsity/chapter/support-resistance/
I am writing about the message from Neeraj on November 9, 2019. The reply button does not work for some reason, hence posting a new message…
I totally agree with what Neeraj is requesting. Whole point behind 20 depth data is to identify high volume bids/offers and then use this info to either identify SR levels OR to identify the price spread of your market order. The rate at which the level 3 data refreshes makes it very difficult to process this. Instead visibility to top 5 or 7 levels with highest volume on bid/offer side would be really handy. Please check the technical feasibility of providing this.
Very happy to see you providing level 3 data already… but yeh dil mange more 🙂
And we love to do as much as possible 🙂
Very elaborate content. learnt a lot guys, thank you. keep up the good work.
Happy reading!
Very nicely explained. Very easy to understand
Happy reading!
I couldn\’t have expected a better explanation and usecase of 20 market depth. This would definitely help long way.
Thank you so much !
Good luck, Ajit.
Hello Karthik sir,
Thanks so much for the lessons on stock market. Please I wish to know if someone in Africa can trade in the Indian stock market and even that of other countries.
Thanks again as I await your response!
Hey Jude 🙂
Foreign nationals can invest in India via the FPI route, which may be a complex process for an individual. The best way is to invest in an India ETF if offered by any of the financial institute in your country.
FPI – http://www.in.kpmg.com/TaxFlashNews-INT/KPMG-Flash-News-SEBI-FPI-Regulations-2019.pdf
Hello Karthik sir
Firstmost, you have been active in replying all our queries, so a big THANK YOU. I would like to ask here that I have been into stockmarket from 2017. Till 2019 , I have been doing gamble around and lost many lacs. It was in this year I decided to learn complete ly in stock markets and then Invest. So even during gambling, I took aroung 1% knowledge. Now in last 2 months saw various vedios, webinars, learned multiple startegies and all but have not gone into basics of technical analysis, fundamental and all. I know how MACD works, what is MA, Bracket orders, MO and etc. as this are shown in every videos. But somewhere or the other in heart, I feel something is still missing and I may have taken giant step rather than micro step. . You may highilght on this. In this , I sold all loss making stocks which were 90% down in portfolio just to see them rise in next one month. I did this to release some funds but still feel like I should have waited. So please guide me what to do in all this current scenarios. In this market, you have so much to read and see, how do I start is the biggest question since I already know things that are advanced as said earlier. Can zerodha modules help me in this. Am I doing too much or too less is also a question here
Pratik, this is exactly how one starts, so don\’t get worked up 🙂
At a stage, you\’ll figure that you know things but everything is scrambled. You need to connect the dots and ensure there is an order in this madness. You will find this order only with more market experience and by going through multiple market cycles. Until then, reduce your capital exposure in the market and trade with sums which will help you validate all the learnings in the market.
Good luck and stay profitable 🙂
Sir can you please explain how to use market depth data…how to interpret it in live market
This chapter is about that no 🙂
What is meant by spread of 0.149%?
Difference between the bid and ask.
What do you mean by Contract availability ? Can you please elaborate.
One value addition to this web Page can you put the post comment tab above the comment & discussion area.
since a person has to come all along down to post.
Contract availability = liquidity. Basically you should be able to easily buy and sell the contract. Thanks for the suggestion, Asif, I will bounce this to the tech team.
Dear Kartik,
Is it better to trade in options or trade big quantities in intraday?
It all depends on how you trade right?
Sir,
this feature will likely save from excessive stop loss hunting in intraday also. I just started micro trading and now i know how to save myself from stop loss hunting…
Hmm, you may also want to read this – https://tradingqna.com/t/a-query-on-stop-loss-hunting/38650
For fundamental..
Hello Karthik Sir,
I have just started reading from module 1. Just need to know how this chapter of supplementary note can be a part of introduction to stock markets. Because, a person like me who have just heard of options but dont know of it is reading this chapter will be confused. I think this chapter must be part of F&O section is what I feel. Do comment back.
Also, need a small guidance from your side. I am daily looking around various videos, attending various webinars and reading various books on trading and investing. I am a bit of confused somewhat and when I go in live market I feel like what to do now even after reading and watching so much. What should be the best approach to avoid this and be consistent in trading and investing. Any inputs from your side is valuable to me
Pratik, yes, what you say makes sense. I included this chapter here thinking that this is a feature on the trading terminal. Too late to move, but will add a disclaimer here.
I understand that it can get overwhelming. Set yourself small goals in the market and try to focus and achieve only that. For example, goal for day 1 can be to figure out how to place a market order, the goal for day 2 can be to figure limit order, day 3 may be to read how bid-ask changes. Do this for a month – small learning objectives on a daily basis and after a month, you yourself will feel that you\’ve learnt quite a bit. If you have any queries, feel free to ask us.
Hii Karthik sir,
Ur articles are soo great!, infact I got lot of information related to tarding and investing frm varsity zerodha…
I am newbie in stock market…
I wanted know more about how to calculate intrinsic value in depth…
Can u pls suggest any blog so that I can access to it….
And, if I want access historical ratio\’s where do I have to search for it?
Rehka, I\’m glad you liked the content. YOu\’d like to calculate intrinsic value of which one? Stock (fundamentals) or options?
completed 1st module. was very knowledgeable and easy to understand. hope these pace is through out the course.
I hope so too, happy reading 🙂
hi karthik sir,
is there any knowledge needed to understand this whole topic coz i\’m finding difficulties in understanding this concept.
Will you please help me gaining right knowledge
seriouslly i didn\’t understood a single point in this
Start from the first chapter, Himanshu. Let me know if you are stuck anywhere. Will be happy to help.
Hi,
could 20depth data be used to identify the trend direction ? Bullish or bearish , can number or volume of bid/ask suggests direction of trend ?
Hmm, not really. It is best if used keeping intraday trades in perspective.
Yes sir
Hi Karthik Sir,
I must say my foundation for trading started with varsity, i am glad i came to know about varsity which has the knowledge shared by a person like you with vast experience in trading & investing, how simpler can someone make the concepts of trading & investing understandable to others so that even a person like me could understand about it atleast to an extent, it was after reading the topics in varsity i was able to understand the terminologies used in trading & investing when i read a book or when others are talking about it, it really helped me to learn gradually and explore things which i really needed, 20 market depth is really useful tool for me when i combine it with VSA concept sir, hope you come up with an elaborate topic on VSA in trading thank you sir
Thanks for the kind words, Rajan 🙂
By VAS do you mean Volume spread analysis?
Karthik, Nicely written in simple terms a very good refresher of jargons and Knowledge. Examples were relatable, 20 market depth level 3 analysis is slightly confusing for me. Considering I\’m a retail investor its a good to know not a must know.
Thank you for the material. All the best
Happy trading, Teja 🙂
Yes, this is good to know and not really required to move forward.
Sir, your material and practical approach is even better than an MBA college. This material has given me more knowledge than my college. Why don\’t you launch your books for CFA, FRM….
Happy to note that, Sandeep. The current focus is to develop content to help the trading and investing community at large, so hopefully after this goal is done 🙂
Hello Zerodha team, Nice article about bridging the \’informational assymetry\’ gap for retails traders! Thanks for making life easier for retail traders. Quick question: It seems like Level 3 data is mostly useful for intraday trading or short term trading. How is this useful for long term investors?
You are right, level 3 is mainly used for intraday trading/scalping. It is of no use to long term traders.
apart from annual report how can i get knowledge of that particular sector?
You can look for sectoral reports from the industry body. For example, SIAM is the industry body for auto, TRAI for telecom, etc.
Sir if i want to invest in a fmcg company….
So i need to study the fmcg sector….
So how to study that particular sector ..
I mean what are the sources to study a particluar sector?
Pick up the annual report of an FMCG company and start reading it. This is the best way to develop a sense of whats happening in the industry.
SIR
the 20 depth move so fast one ia not able to grasp the content. what is the remedy
Tis an incredible tool not only for perfect scalping but a good intraday swing trade can be executed with a limited sl. I really appreciate the effort Zerodha has taken to take our broking industry to next level.
However sometimes I feel a problem when level 3 gets stuck and if youre in the middle of trade that too in a large turns out PAINFUL. I shouldn\’t whine though.
Thanks, Ravi 🙂
Hi, Is this available in MCX also.
Not yet, Amit.
great information karthik…please keep us updated with such tools and information 🙂
Will do, Shubham 🙂
Hi Karthik,
Can i get kite 20 level data in google sheet or in excel or in Json format to my analysis.? Also will you provide any kite API to consume this 20 level data to another platform ( even with some pricing model like per user billing ) ?
No APIs or other formats for level 3 data, Vicky.
Hey man !
I just want to say, Thank you.
I\’ve been reading a lot of investment books but I was still overwhelmed about trading. After carefully going through the first full chapter. I am a lil bit confident to get onboard now. Thanks to your well written and superb simplified examples it was easier to grab on.
Thanks for letting us know, Abhishek! Happy reading 🙂
Hi Zerodha Team,
1) 20 level data only beneficial when you can save as a historic order flow data for future use else no one can make decision basis on 20 level data or 5 level of data.
2) As you already having 20 level bid ask data, Can zerodha provide historical order flow levels,real time order flow via heatmap like Bookmap providing.
3) Can you please provide cumulative delta and AVWAP in kite?
1) Depends on your trading strategy
2) This is not possible, I will anyway check with the team
3) For the delta bit, I guess you can check with Sensibull team. Maybe they can.
If I have my brokerage with in FEB 2020 is above 100 but what if, If i fail to pay the same brokerage next month. Will my account he out of the factility
Sir, I have my Demat and trading account with you.,
I need your help to get this level 3 depth data into excel or google sheet table.
Please advice me how to pull it.
Thanks again!
This may not be possible. However, I\’ll double confirm this from the team.
Sir may I know who to get this 20 depth figures real time data into excel or google sheet.
Can you help me!
Thank You.
Hmm, this can be tricky. Not sure if this can be done.
Hello Team Zerodha,
My currently paid brokerage is more than 100 rs in this month but still not see this option
The list will get updated soon. Else, I\’d suggest you speak to the support team for this.
Is it Availabe on Pi ?
Nope, Kite only for now.
Hi Karthik,
A Newbie this side, as per my understanding, as a buyer I should be looking at the offer price section right? If yes, I would always look at the lowest price to buy the shares, and the lowest price is always at the row 1 of the offer section, in that case how is the rest of the data in the other offer section rows helping me to buy the shares? Please help me understand this
I had generated more than Rs100 brokerage but still I can\’t see 20 Dept
The list will be updated frequently. I\’d also suggest you create a ticket here – https://support.zerodha.com/category/trading-and-markets/kite-web-and-mobile/articles/view-20-depth
How can saw 20 market dept
Click on the market depth to see this option.
Hi sir,
Thanks for such a nice initiative. Pray and hope we make best use of it and get the benefits.
However, is there an example of how retail investors can use it to avoid being stoploss hunted.
Also, is it only for Shares currently. Not seeing for CrudeOil.
Thank you.
Its not available for crude oil/MCX contracts yet.
Zerodha is just fooling people,if they really want to help then at least they should provide the bridge for connecting kite to tools like ninja trader
John, how is this fooling people?
Hi,
The feature is really good.
But I have a suggestion, can zerodha implement top 50 gainers and losers.
Thanks, will pass this feedback to the dev team.
Level 3 or 2 is useless unless these data can be imported into tools like ninja trader,jigsaw.i had requested for a bridge for kite and ninja trader ,I was ready to pay for the bridge but I was turned off,your support team said I will have to develop it my self,I am not from IT background so it is not possible for me to develop the bridge,in short level 3 is useless ,in fact it will do more harm by using it without the tools
Thanks for the feedback, John. Will pass this to the dev team.
nice job
Thanks!
20 depth is not visible in USDINR
Not as of now.
Interesting, does total bid for buy and sell gives some clue about overall ternd for the day??
Not unless you associate this with the price movement.
Thanks for adding this feature. By the way, can you please tell what the background colour of the QTY column mean. At each price point, buy or sell, the background colour of the respective QTY, is of different length. As far as i can understand, the length of the background colour, neither indicates the number of orders for that QTY nor the bur or sell quantity itself. I am sure there is some logic to the variable length.
hmm, this just indicates the strength of the buy-sell quantity.
Intersting
Indeed!
Is it available in currency features and options 20depth
Not as of now.
Where to find this option? I am still saw old type of market depth only.
Click on 20 depth in the market watch.
i will be more beneficial and productive if it plotted on the chart we trade as support and resistance according to 20 level market order depth.
Hmm, Ravi, that will be complicated right?
Sir am I eligible for this feature?
Appreciate for such out of the box ideas for retail traders….I will start using this and see what I gain….
Good luck, Arun!
Hello Karthik,
As usual, get work and keep it up. I was unaware of this feature until now and hence would use to validate my intraday trades.
Can this be used for positional or swing trading?
Regards,
Harish, this is not particularly useful for positional and swing trading.
Is it available on smart phones as well..?
I trade on phone.. I this option was not displayed to me and yes I\’ve generated brokerage of more than 💯
I\’d suggest you speak to the support or create a ticket here – https://support.zerodha.com/category/trading-and-markets/kite-web-and-mobile/articles/view-20-depth
From watchlist how can I use the 20 market depth. I can\’t find the option 20 market depth on my Zerodha Kite app
Assuming you are eligible for the 20 depth, I\’d suggest you click on the market depth and then on the 20 depth.
All are ok when it possible dark or night mode in training view
When will it be available for all please (irrespective of Brokerage amount)?
Regards,
Sanjoy
There is a considerable amount of efforts to bring this feature, hence its bound by the brokerage generated, please check this – https://zerodha.com/z-connect/featured/introducing-20-depth-or-level-3-data-beta-on-kite
I definitely would be generating 100 rs for brokerage but I don\’t see this option. Please help.
I already generated more than 100 revenue , Still cant see 20 level Market depth
The list gets updated regularly. I would suggest you speak to the support team once.
More than 100 Rs as a brokerage on last 10 days but not seen my account (Daily 80 rupiees in equity & commodity), please clarify.
The list gets updated regularly. I would suggest you speak to the support team once.
Thanks you very very much sir
Happy trading!
is it available in commodity market data?
Not for now.
not show market depth on stock why?
It is available on stocks as well.
I know that Karthik. But we need to visit different places to get different data which might be time consuming.
Any thing in Kite or other software we can see most of the data in a single page to take a quick call? Like Technical Indicators, Levels, moving averages, oscillators, Pricing details of previous days, fundamental details etc in a single page
All technical details are available, either on tradingview or ChartIQ. Fundamental is to the extent of what\’s available by smallcase by means of a widget. I\’ll anyway pass this feedback anyway.
Someone please help me with this. Above the writer of this post said, \”The bid concentration is the highest at 11980; in fact, this is the highest in across both sides of the order book. So this gives me the conviction to go ahead and place my long trade.\”
but it is not the bid, it is the offer i.e the seller is asking so when the LTP reaches here the price should fall right? bcoz selling is more and demand is less. So, how he continued on the long?
Please explain the chart.
That was a mistake, Ismail. Fixing it.
Thank you so much Mr Karthik for the gnan you are providing.
Is there anyway (since price action movements are very fast) to view all the different data like Technical/Fundamental/Quantitative analysis, Market Depth etc to build a strong case for a trade quickly? Is Zerodha or any other software telling all this information in a single click?
Also since POV is different before the market starts, but after the market is open, is there anyway to know the trend change?
Appreciate more information like articles/books/software on this would be greatly appreciated
Kite gives you both technical and fundamental data. For basic fundamental data, click on the stock widget that appears when you hover over the stock name in Kite\’s market watch. You cannot know the trend change before it happens.
What is the difference b/w bids and orders? I am so confused
An order can refer to either buying or selling. Bid and ask is the price at which you transact. Check this https://zerodha.com/varsity/chapter/the-trading-terminal/
ok sir ,after relook please clarify this concept
hello kartik sir
i did not understand nifty future 15 minute intraday breakout concept.there was 2250(highest quantity for sale) quantity for offer at 11980 price point.how did you say there was a breakout probability?
I will relook at that, Monirul. Looks like some confusion there.
Hello Sir, Please tell me the Market Opening Timings.
9:15 AM to 3:30 PM
20 market depth is not working in pre market session i.e. between 9:00-9:15.
This is available only after the market opens, Prashant.
20 market depth is not available for MCX?
Not yet, Rahul.
Hi
Great article and very useful. However, kindly correct the last example shown for validation of range breakout. It shows offers and you have traded assuming it to be bids. If there were multiple offers at 11980 then logically breakout shouldn\’t have happened.
Please correct me if I am wrong.
Thanks and Regards
Kalpesh
I think the traders who had place sell order @ 11980 will keep the stop loss above 5 to 10 points i:e 11990 ,once the price starts moving above the level, they will panic to exit (buy) ,this will lead to breakout due to dual price action. we should place a buy order above 11990 with a stop below 11979.
Hmm, depends on your strategy, Arvind.
Brilliant analogy of car parking assistant! We\’ll written article.
Glad you liked it, Adarsh!
Hi Karthik , firstly thx to u n Zerodha for getting this to us. Secondly the concern arnd the brkout eg. I believe the wordings hav confused many including me. 2250 being the highest in offer(bids to sell if i may so) shd be the supply zone and act as a resistance from price pt. So either we see it as a temp resistance or enter in a trade only if this price pt breaks on the upside. Correct if that is what u meant. Thanks
I may have unintentionally goofed up somewhere, Jay. Let me recheck. Thanks.
The logic to trade the long in Nifty was the presence of huge sell order at the resistance? I didn\’t understand the trade.
You are essentially validating the presence of price action with this, Sanjay.
I AM HAVING ZERODHA DEMAT ACCOUNT HOW GET 20LEVEL DEPTH OR 3 LEVEL TRADING PLATFORM
You will have to generate a minimum brokerage of 100 Rupees per month to get access to 20 depth.
Yep! That\’s good enough, thank you
Hey Karthik!! I sincerely appreciate all the effort that was put into making these modules, they are very very informative and awsome.
The content is really great, Thank you and varsity for curating the concepts and information into one place,
And one other thing, does zerodha offer
\”time and sales \” data??
Thanks for the kind words and I\’m glad you liked the content here. We provide OHLC and volume data, which is time-stamped. Guess this should suffice?
Sir, At what one should focus on number of orders or at Quantity in market depth while making decisions for intraday trading.
which is more important to look at order or qty. ?
Both matters in a different context, Hemant.
I was wondering how this was helpful. This article makes a lot of sense.
A webinar on the subject would be fantastic.
Planning on that as well, Prithvi.
Karthik,
As always, an excellent write up.
A basic question from my side. For a Nifty 12000 CE trading at 111. Suppose a trader has placed 4 sell orders with 1200 qty at 135 and he is the only one who has placed sell Call orders at 135 level. The trouble is that he has disclosed 0 qty. In this case what would appear at 135 CE sell side level. Pls remember that hypothetically these are the only orders placed at 135 CE sell.
Sandeep, then the entire quantity shows up on the order screen.
Is this feature provided through Kite connect API? I checked the depth that we receive in Ticker data and we are still getting 5 levels of market depth and not 20. If not yet part of kite connect API, any plans in future? Also, will there be any additional charges?
Thanks in advance.
This is not available on the APIs yet and I\’m not sure if it will feature there as well.
Hi Karthik,
You wrote \’The bid concentration is the highest at 11980\’, shouldn\’t it be Offer instead of Bid, maybe a typo. And since 11980 has highest offers, wouldn\’t it serve as supply zone rather than support.
In the last example, when there was highest bid at 11980 on sell side, it should imply that it is the resistance and market may not go up from that level. But the inference has been made reverse here. Can you please elaborate ?
Parendu
Relooking into this.
In the last example there are 18 orders in the offer side total 2250 quantity. is this means that bid is concentrated there(11980)
2250 quantity are in sell side?
would you please clarify this there must be problem with my understanding.
yes that\’s right…..but there are a lot of sellers there so is it a nice idea to go long after that level breaks?
Hmm, interesting. I\’ve never really looked into that actually.
How to access it on kite mobile
We have the approvals, will be made available soon.
Hi Karthik, Thanks for providing one more excellent tool for better decision making. I just have one question. I understand that this data (20 level depth data) is dynamic. So how much that we can depend on such data that is dynamic in nature?
The dependency is good enough just for short term trades, John. Best works for scalping actually.
Hi Karthik,
I had written the following suggestion yesterday, for which you had replied that I can choose to see only the Top 10. I am not sure whether you have understood my question. I meant Top 10 in terms of \”Quantity\”.
Once Top 10 are identified they can be shown in the order of the price itself, as it is done today (Intermediate prices where the quantity is low will get discarded). The displayed items need not be rearranged in terms of Quantity.
This may slow down the refresh rate somewhat but I think it should not matter, as it gives valuable information.
————————————————————————————————————————————————–
This was my previous message:-
\”Instead of showing all 20 price levels, Can you please display only those price levels which are in the top 10 in bids and offers side?. This will make it clear where are the supports and resistances. This is especially useful in the case of nifty and banknifty where 0.05 price level makes it almost useless, because we can see only at a distance of 1 rupee with these 20 levels.\”
(( I could not reply to your message there and so I have created a new message here))
I\’m so sorry, I didn\’t quite get what you were saying initially. This is quite clear. This could be quite complicated in terms of tech and of course, the refresh rate will take a hit. None the less, I will check with the team.
In the range breakout example its not bid that are concentrated….offers are concentrated right?…..if its ture should i still look for buy?
It is the price at which you will buy right?
sir, in commodity section, it is not visible!
This is just for Equities for now, Ashok.
Great tool for scalping… and I hope this is only free for some time
Dharma\’s query is a valid query as even I am confused on the nifty example ..At 11980 there are more sellers..so price should go down…how it has gone up…pl. help to explain. Rgds Sandeep
These are offers, the price at which you get to buy.
Good day sir very nice i m using this feature best & solve my all problem & idea for market im happy
Thanks to zerodha & All Teem
Good luck and happy trading, Naween.
Thank you for the wonderful blog. My concern is when max quantity 2250 placed at Nifty@11980 for selling then how it is giving conviction to go long or bullish breakout. Could you please elaborate.
The quantities keep changing, you need to see how the bids are getting paced at that level. If the bids are continuously higher at that point, then you develop more conviction at that price point.
100 Rs as a brokerage on daily basis or on a monthly basis, please clarify.
Monthly.
Why is it called level 3 data? Are there any level 2 & level 1 data exists, if so what are they?
I presume, level 1 data is usual LTP, OHLC and vol, level 2 data is top 5 bid & ask data..
Check this, Uday – https://tradingqna.com/t/how-much-more-prices-per-second-are-displayed-in-level-3-data-over-level-2-data/4035
Hi Karthik,
Appreciate this new feature- thanks; it\’s most certainly preferable to just seeing the top 5 bid and asks, but in my experience, I do find that the level 2 data can often prove to be something of an illusion especially in the function of establishing supports and resistance. Often you find a strong quantity of bids and ask at a certain level and prima facie you\’d think those levels could be crucial but as you move closer to those levels, invariably the bids and asks just disappear from the table. I\’ve read somewhere that this is often the smart money looking to trap the retailers like me and send the stock scurrying the other way cause there\’s nothing quite like having trapped positions in driving momentum the other way.
Well, bids and asks change, that\’s the very nature of this beast. You need to evaluate how the order flow hits at these key price points. Need not necessarily be for that given moment.
Hi,
Instead of showing all 20 price levels, Can you please display only those price levels which are in the top 10 in bids and offers side?. This will make it clear where are the supports and resistances. This is especially useful in the case of nifty and banknifty where 0.05 price level makes it almost useless, because we can see only at a distance of 1 rupee with these 20 levels.
But you can choose to seen only the top 10 🙂
No doubt, this is valuable, but how much. Liquidity can vanish in micro secs with computers putting orders in and out, Can a human eye catch this variation?
Tools such as bookmap Or jigsaw can only help along with 20 depth. Unfortunately, we do not have those in India.
Thanks, will look in these tools as well.
Dear sir, Pls email me this article I need this for trading. OR give me link from where it can be opened.
Aren\’t you able to read the article here?
Hi Team, when soon we can expect this feature in commodities ? any deadline your working with ?
No deadline as such.
great support for us thanks zeroda
Good luck and happy trading.
Rs. 100 BROKERAGE EVERY DAY OR PER MONTH OR IN ONE TRADE PL CLARIFY
That on a 4-week basis.
Nice article.. you guys have made a mistake though. The bids are on the left and the ask(offer) are on the right. Surprised such a basic mistake being made by a brokerage company!
Why though?
Sir,
when it will be available for commodity trading
Need to check with the team.
sorry its \”bids\”…not \”bits\”.
Got it!
20 depth
A speechifier should know how to make his listeners understand and Sir you are best at it 👍
Thanks for the kind words, Ashmeet. Happy trading!
view 20depath” is not being shown in market depth on my pc, please let me know sir.
This feature is available for clients who have generated a minimum brokerage of Rs.100. Check this – https://zerodha.com/z-connect/featured/introducing-20-depth-or-level-3-data-beta-on-kite
sir,in nifty future range example you highlight offer side of order book and telling about bits.I think there are more sellers at 11980 level.So price will come down na…please clarify..
Thats offers the price at which you buy.
Hi Karthik,
Excellent insight for RTs.
Kudos to your efforts in improving Zerodha always! Goodluck in your future endeavors as well.
Best Regards,
Arindam.
Thank you for the kind words! Happy trading 🙂
Hi karthik,
All are fine, but how to enable or see 20 level depth…
I could not able to see any article or link or after logging 20 level depth option.
I have generated more than 10K brokerage but still nothing is seen.
Bhaskar
I think you should reach out to the support desk for this, Bhaskar.
Excellent article!
I am a new to intraday trading and was exploring the 20 market depth; apparently Zerodha is watching what I am doing since I got a pop-up asking me to read this article!
Thanks for the information; will try to use it.
It is just a coincidence 🙂
Thank you, This is good information made available
Happy trading, Pramod!
Am not able to see the 20 Depth
This feature is available for clients who have generated a minimum brokerage of Rs.100. Check this – https://zerodha.com/z-connect/featured/introducing-20-depth-or-level-3-data-beta-on-kite
I think analysis based on visible quantities is misleading as there is feature of disclosed quantity. The numbers in market depth do not paint the full picture. Correct me if I am wrong.
If you think about it, the 20 market depth is an indicator of liquidity – both in terms of contract availability and the spread. If the order is a disclosed one, then it only improves the liquidity situation right?
\”view 20depath\” is not being shown in market depth on my pc
This feature is available for clients who have generated a minimum brokerage of Rs.100. Check this – https://zerodha.com/z-connect/featured/introducing-20-depth-or-level-3-data-beta-on-kite
I have generated more than 100 Rs (Brokerage alone… But I am not able to view 20 depth data…
I think you should reach out to the support desk for this.
So this is only or those doing fno right?
You can use this for equity intraday as well.
PLS SHOW OPENINTREST INCREASE DECREASE IN OPTION BY INDICATOR SO CAN EASILY UNDERSTAND % CHANGE IN CONTRACT .
Ok.
good feature i like
Glad you did!
Amazing featute for the reatil traders. Way to go team for bringing such innovative and pro Tools to the world at such decent costs.
Happy learning and trading 🙂
Hi Karthik! Newbie here, under the \’The 20 Market Depth (level 3 data) Window\’ section, you\’ve said – If you are entirely new to this, I’d suggest you read this blog to understand what the level 3 data is all about.
Are you referring to this chapter as the blog or have a separate blog elsewhere, in which case I do not see a link to it. Can you help?
\’Read this blog\’ is hyperlinked 🙂
Sir, how will the market depth data be relied upon? When clients or trading systems use the disclosed quantity feature, not the entire quantity is shown. In such a case, isn\’t there a chance that the wrong assumptions are made looking at just the market depth?
Valid point, but there is no way one can identify disclosed quantity. By the way, level 3 helps you identify contract availability. Given this, the disclosed quantity, if any, will only make the liquidity situation better.
Very nicely written, thank you for your incredible insight.
Salman, thank you 🙂
cannot see market depth
You need to have generated at least 100 Rupees in brokerage to see the 20 depth. Please check this – https://zerodha.com/z-connect/featured/introducing-20-depth-or-level-3-data-beta-on-kite
Karthik sir this chapter is not added in the pdf,please add it and one more thing when some new chapters are added in the existing modules how am I supposed to know.
Noted, will take a look. Thanks.