Charting – Pi
Traders,
Advanced charting without any cost for data is one of the big pluses of Pi. We have 10 chart types with over 80 indicators. Over the last few months, our clients testing Pi have requested for a lot more indicators. We will start adding them soon. This post will talk about all the basics of using charts on Pi.
If you want to learn more about Technical Analysis, get onto Zerodha Varsity.
Invoking a Chart
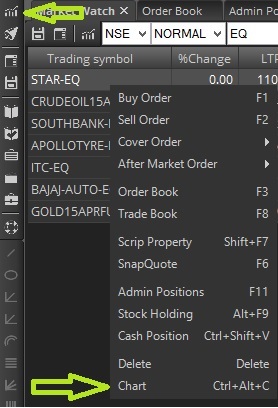
There are three easy ways to invoke a chart.
- Right click on the scrip on your marketwatch, and choose Chart
- Use the shortcut key Shift+C
- Use Create new chart icon
Invoking the chart
Selecting a time frame
You can currently open minute, hour, and day charts. Intraday charts are available for up to 6 months, and day charts for over 5 years (top 150 stocks and indices). We will add more data and stocks to this soon. F&O charts are available only for as long as that contract has been live. We suggest looking at the underlying stock/indices charts for much longer historical analysis. And yes, we also have options charts from when the contract has started trading.
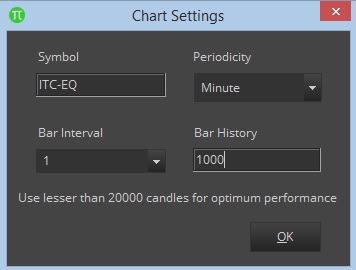
Once you invoke the chart, you can use this box for selecting the time frame. You can open upto 50,000 candles based on your system speed and configuration, but we suggest using lesser than 20,000 especially when trading. If you request for more bar history than what is available it will display the chart from when the data is available.
Select time frame
If you want a 1-minute chart, use like the image above. If you want a 5-minute chart, change the bar interval to 5 but keep the periodicity as minute. If you want a 1-hour chart, change periodicity to hour and bar interval to 1. Similarly for Day chart, change periodicity to day and interval to 1. If you want a day chart for the last 1000 days (bars), keep the bar history as 1000. If you want the last 10,000 1-minute candles, keep the bar history as 10,000.
Note: If you want to change the time frame for a particular chart, you can’t do this directly, you have to follow the same process as described above. With Pi, you can invoke charts of multiple time frames at the same time unlike other platforms where you can have only 1 chart per contract.
The chart might take some time to load if you are requesting for larger bar history. this video on loading charts of different time frames.
Chart types & Indicators
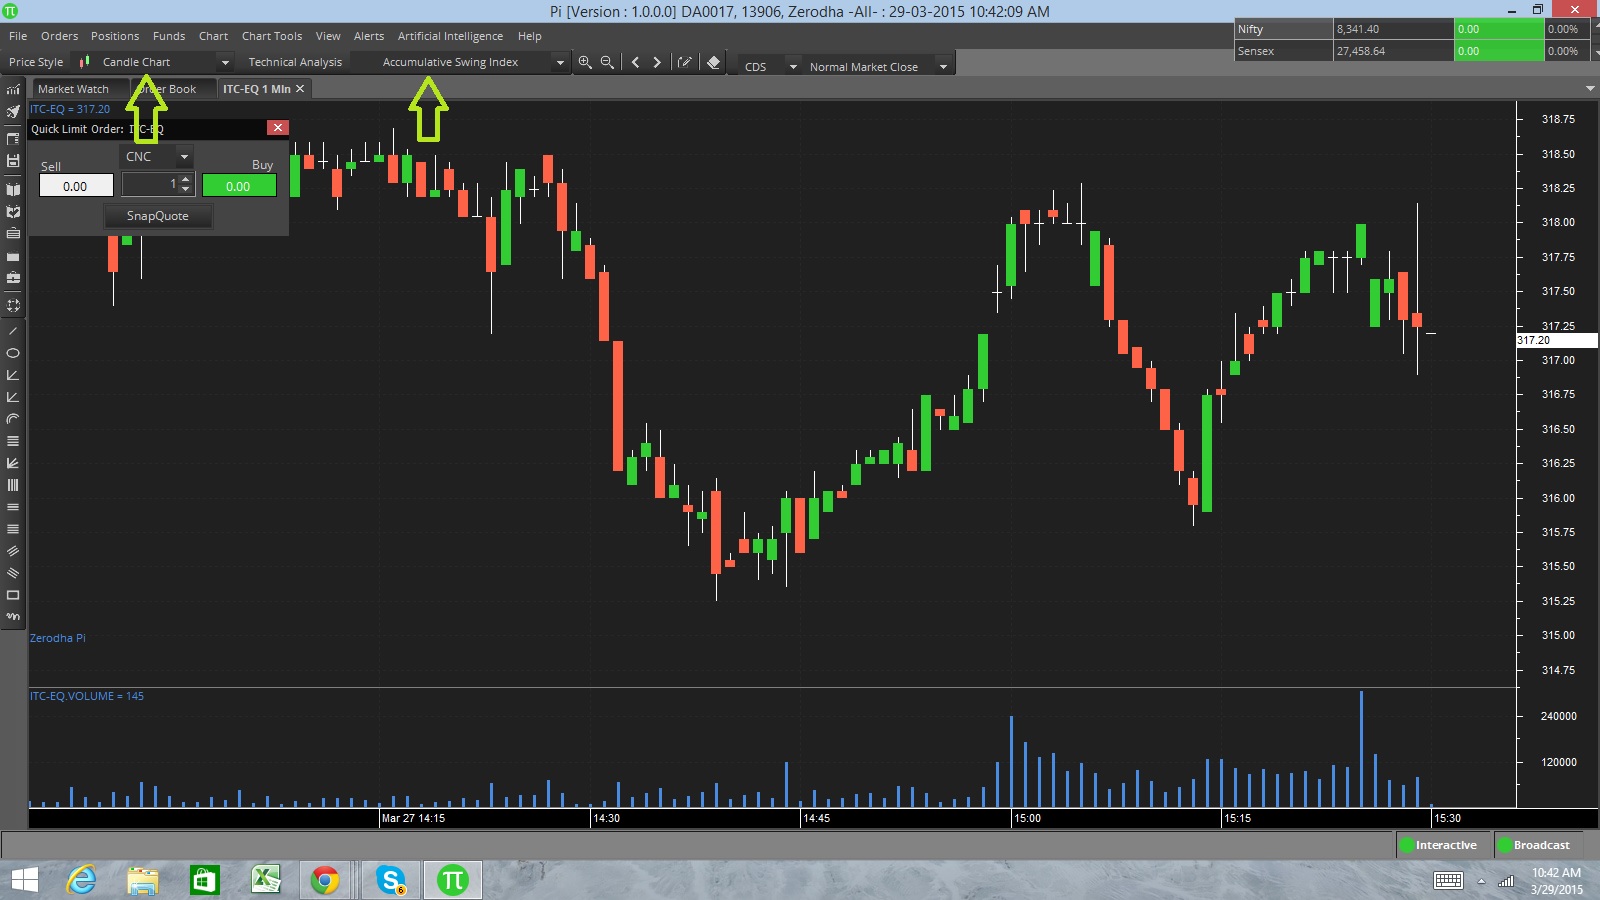
We have 10 chart types and over 80 indicators. The default chart type is candlesticks, and you can use the price style and technical analysis dropdown for selecting chart type and indicator respectively. Note that these two dropdowns get enabled only if you have a chart open.
Selecting Chart types and indicators
You can add an indicator on Open, High, Low, Close, Volume, or another indicator as shown below. (In the pic below, we have added an EMA on volume, and now trying to add EMA on RSI). Check video.
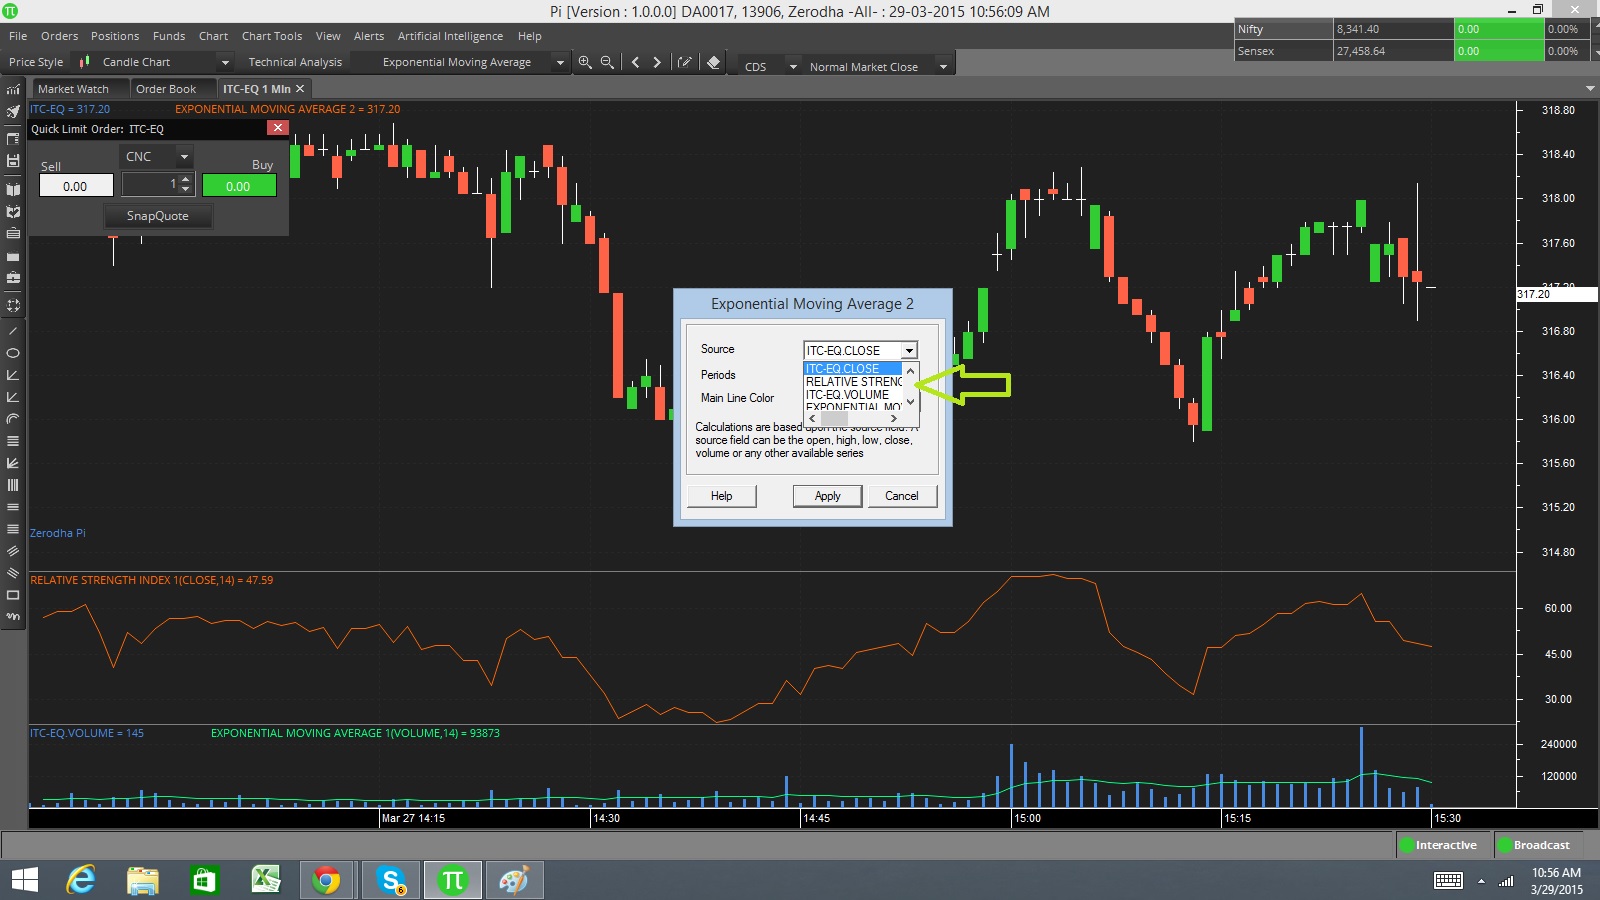
Adding indicator on O,H,L,C, Vol, and another indicator
When you are trying to add an indicator on an indicator, it is possible that it gets added to the main price panel, instead of the panel in which the indicator is. If this happens, click on the indicator, you see white square boxes. Left click on the white box and drag it to the panel you want it on.
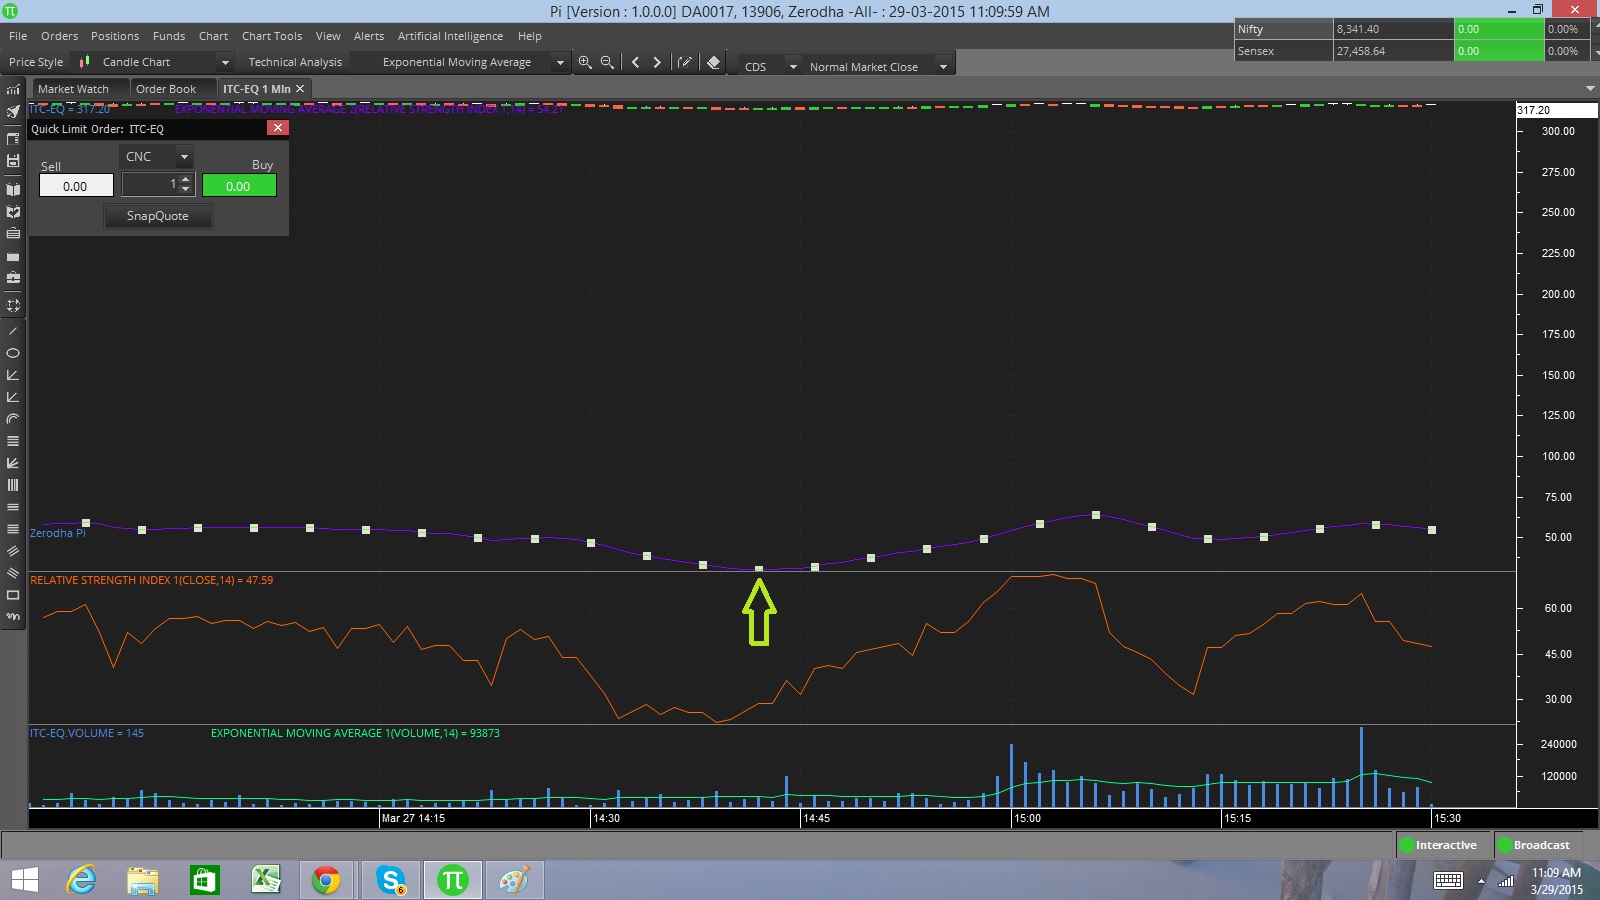
Dragging the indicator on correct panel.
Deleting an Indicator
In the pic above, once you have clicked on the indicator press the delete button to remove the indicator.
Viewing OHLC and Volume of a Candle
To check the OHLC and Volume (tooltip) of a candle, left click anywhere on the chart and hover your mouse over the candle keeping your mouse clicked as shown below. You can also check this .
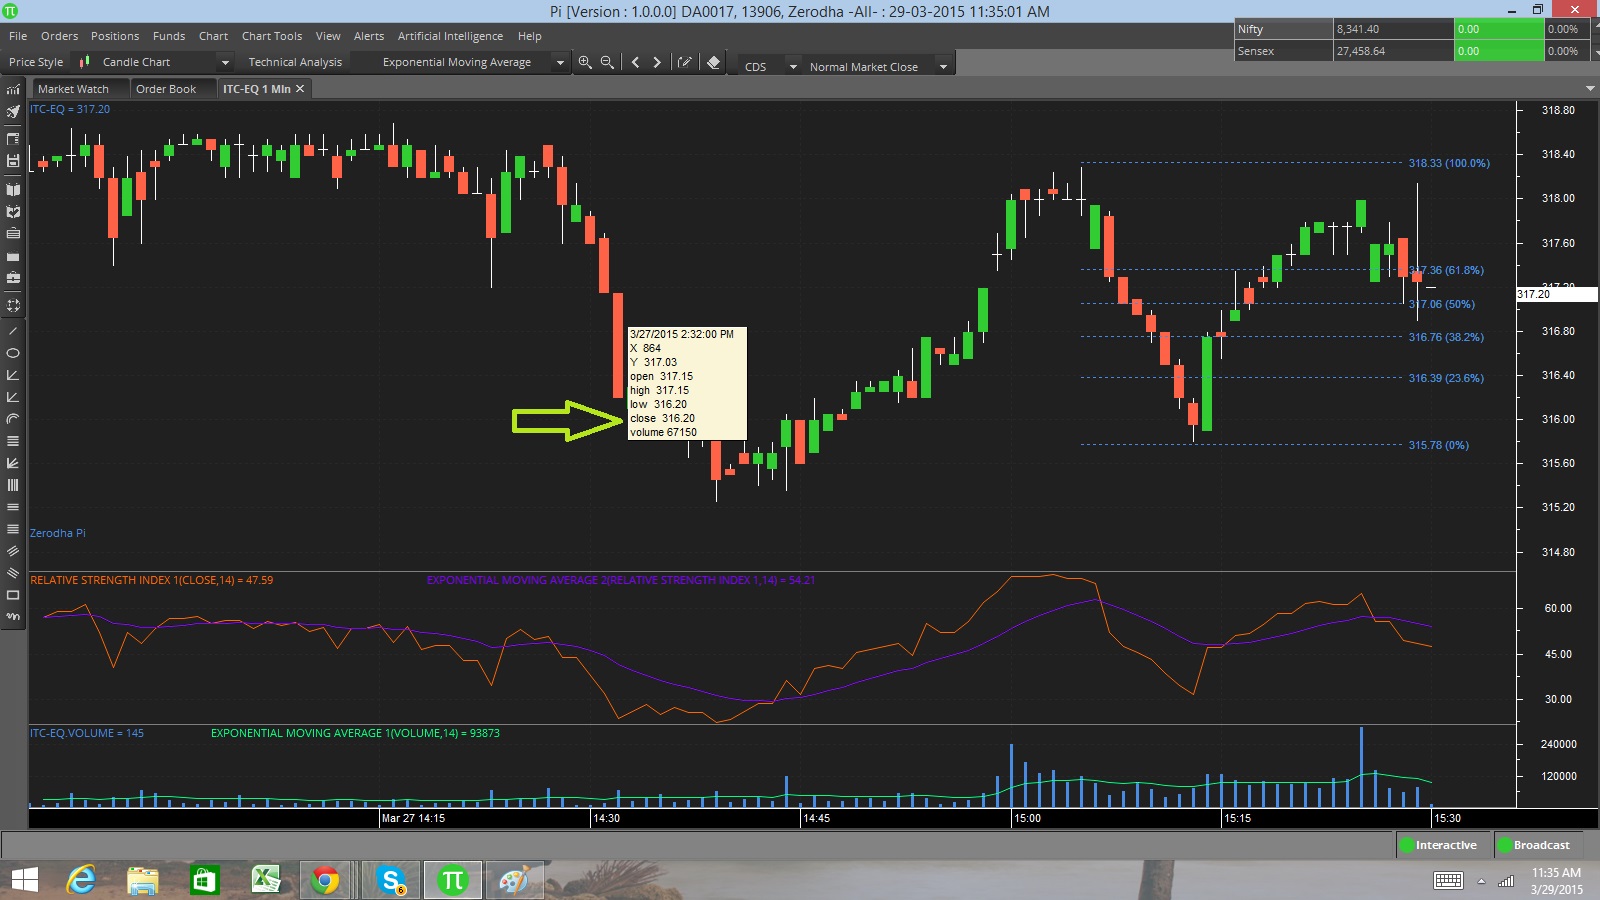
Watching O,H,L,C, and Volume
Drawing tools
We currently have over 14 drawing tools, from trend lines to Fibonacci retracement. We will keep adding more. To use any of the drawing tools all you need to do is select it from the left panel as shown below and then draw based on where you want it.
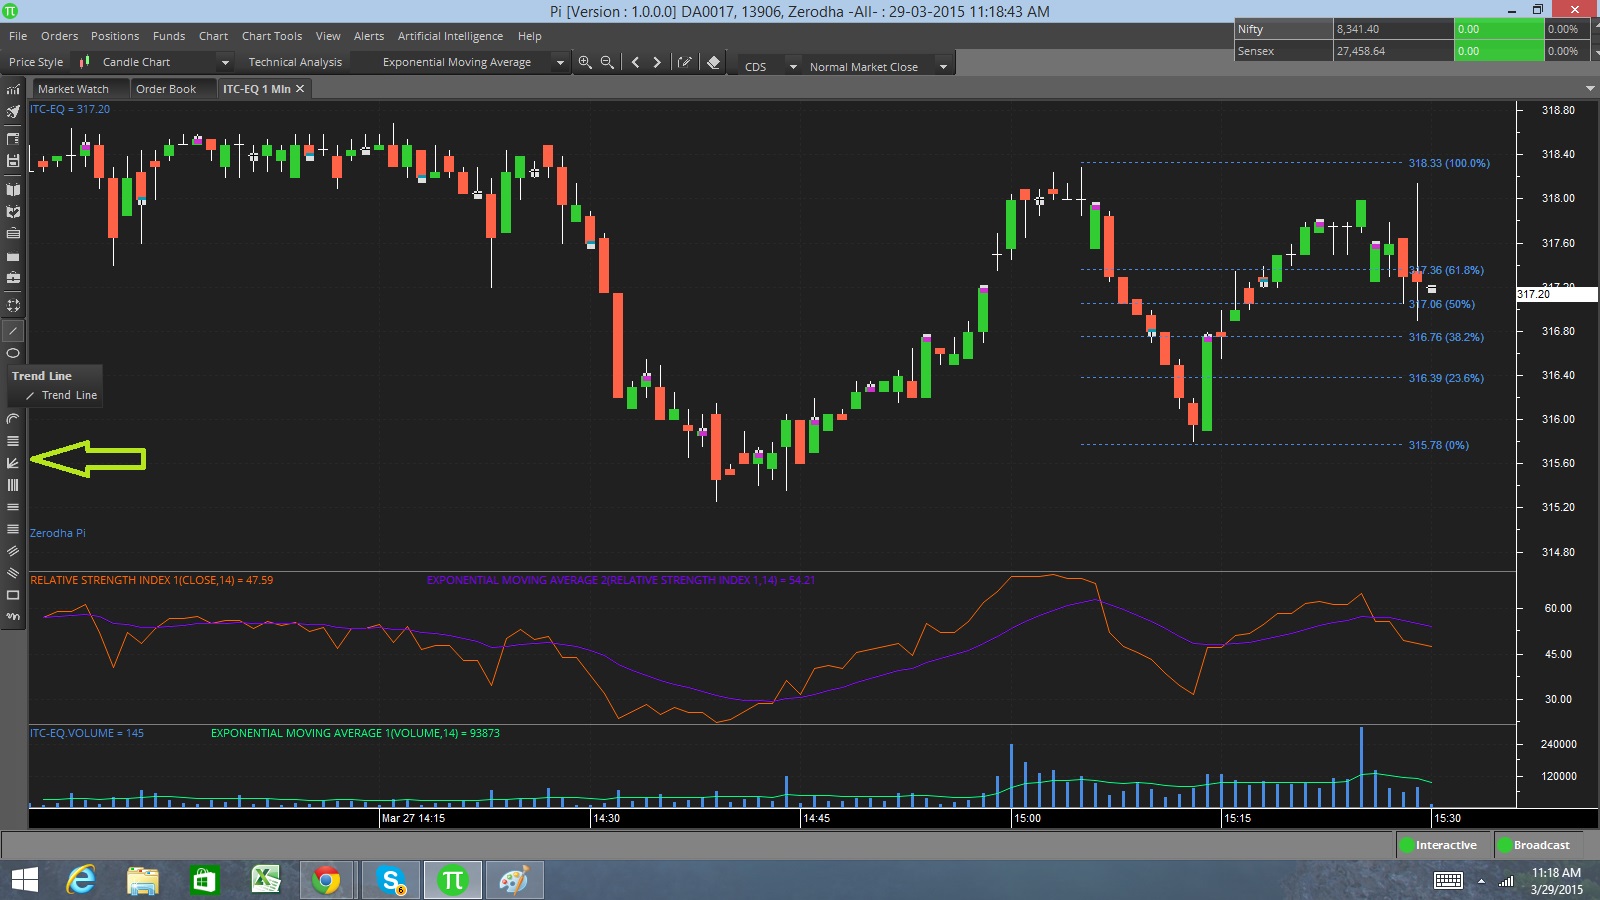
Over 14 drawing tools
Zoom in and Zoom out
Pi has shortcut keys for almost everything, but for regular everyday actions we’ve tried to make it even more simpler. You can use the up/down arrow keys to zoom in and zoom out. You also have the zoom in/zoom out buttons on top of the chart. You can even right click on the chart and decide to “Complete Zoom Out” or “Zoom Selected Area”. Check out this target=”_blank” rel=”noopener”>video to see how it’s done.
Scroll Left and Right
Scrolling through a chart is possible by using the right and left arrows on your keyboard. Alternatively, you can scroll using your mouse. Ideally, it’s best to use the up/down/right/left keys in coordination to arrive at the right point on your chart. If the point you’re scrolling to is very far, just right click and zoom out completely and then choose the portion of the chart you’d like to view and zoom in there.
Right click menu on the chart
Right clicking on your chart opens up a lot of additional options as shown in the image below.
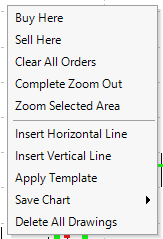
Right click on chart
Buy Here: You can buy directly from the chart. Yes, this is possible. View your chart in detail and decide exactly where your buy should happen.
Sell Here: You can sell directly from the chart without having to open an order form.
Clear All Orders: You can clear/cancel any open orders on the chart by choosing this option.
Complete Zoom Out: Use this option if you want to see all the available data on the chart.
Zoom Selected Area: Choose this option and click any two points on the chart and that portion gets zoomed in.
Insert Horizontal Line: Use this option if you want to draw a horizontal line to get your Support/Resistance lines.
Insert Vertical Line: Use this option to draw vertical lines on your chart.
Save Chart: You can save your chart as an image or even a template with all your indicators for future use.
Delete All Drawings: Delete all your drawings at once instead of clicking on each drawing and hitting the delete button.
Invoking an Index chart
First add the index on the marketwatch as shown below, and then follow the same steps like you would for any other scrip. You can open index charts for Nifty, Banknifty, CNXIT, among others.
Adding index charts
Happy Trading,
Can you open the options intraday chart in PI. I am able to open the chart for options in Kite, but not on Pi.
does zerodhas pi charting software have the following indicator
ichimoku;
renko
and point and figure
Hi,
The last couple of days’ candlesticks are missing from the charts.How to solve this?Please help.
Best create a ticket on our Support Portal. Someone will get in touch to help.
The same with me. I installed latest Pi version today in a new computer. Pi charts are not working.
Best create a ticket on our Support Portal and someone will be in touch to help.
Charting tolls chack in
Hi,
There is any shortcut key to view the chart of next stock available in watch list?
Installed Zerodha Pi today. Chart is not working. showing error message. Kindly support how to see chart. I can able to add scripts in Zerodha Pi. But Chart showing error. Chart and Chart tools not enabled when I look in the screen.
This seems to be a system-specific issue. Please create a ticket on our Support Portal.
pi ka chart nahi aa raha hai.
Best create a ticket on our Support Portal.
Can i compare two P&F charts in Kite?
Hi,
Can i create custom chart on PI? for instance i want to add 2 scripts for the spread chart, can i do that?
I’m afraid not. You can use the compare feature on Kite charts to compare two scrips.
Ok, can we create spread chart?
Hi, I have been facing this issue on Zerodha Pi for the last one week. Before market opens I open 3-4 tabs of the stock futures I would like to trade (ICICI Bank, Nifty, Bank Nifty, etc). Once the market opens I then shift to other time frames just to get some broader perspective and then I come back to the 15min time frame after around 5-10 mins and I see that no candles are being formed on the 15 min time frame. The live candles just stop. I sent a similar email to Zerodha Support, along with a screenshot but it has been more than 24 hours and I have not received any assistance and the issue still persists. How is one to make informed trades if this issue persists?
Hey, can you please create a ticket here: https://support.zerodha.com/
Hi Matti,
I was waiting for a call from the support team as for a speedy resolution of the above mentioned issue. No calls so far….
Hi,
I already have created a ticket for this issue in the support portal. Waiting for a quick response…
Hi,
I have been facing an issue since yesterday morning, when i open any stock or index chart, there is no movement of the candles inside the chart whereas the market watch is showing the price movements. The same issue is not there when i open any commodities chart like crude oil/copper etc only in stocks and indexes. Is anybody else is facing the same issues? Request immediate help
Hmmm… This shouldn’t happen. Best create a ticket on our Support Portal.
In Zerodha Pi, when I make trendlines and if I scroll by mouse. The trendlines does not remain in place. It fluctuates as I scroll mouse. This problem is not happening in zerodha kite.
But I am fan of pi, because I can save charts on my pc which is not possible with kite.
So I would appreciate your support to fix the bug, so that trendlines remain intact.
Hi,
Isnt Pi being updated by zerodha anymore.
1. Volume overlay is not availbale.
2.vwap is not available.
3. pivot points and not overlayed on chart.
All the above things are available on kite.
what is happening guys.
Regards,
Ashish
Hey Ashish, Pi is supported by a third-party and there seem to be no immediate plans to add new features.
Hi
there is now pivot points in zerodha pi
can you tell me how to insert if its there
thank you
hi nithin plz provide dark theme for kite, currently the dark theme is only for the chart and for the watchlist and dashboard its complete white….. really its to contrasting at night time while doing chart study!! plz my only concern.
also when 4 charts options is used and when the charts are on display… there is about 1cm white thick strip!! plz see to it as well!!
Hmmm… Will look into this.
How come there’s no up & down direction keys on the y-axis of the charts? Keyboard left & right keys works well for direction but up and down keys just zooms in and out.
How make template of plotting Previous day high low horizontal line in chart for every day.
You’ll have to do this manually I’m afraid, Ketan.
First of all thanks for very good and in detail tutorials on share market it help me a lot. As a ”confused about share market” person it was very useful. I am using Pi for so many days and getting good results. So, as we can see the expert adviser points(Red and green arrows) during BackTest. can we see them on Realtime chart window? Please advise. Also can I get Buy/Sell alerts when market is closed if not please if there is an alternative please send because a middle class man working from 9 am to 6 pm it would be very useful Thank You!!!!!!!!!!!!!!!!!!
You can get alerts using expert advisors on the live market. These won’t be visible on the chart, however. Additionally, this would only be possible during market hours as alerts are based on changes in the markets. Not possible to generate alerts when markets are closed. 🙂
Hello,
query regarding Leadmini 18dec18fut contract on PI platform. I am unable to see day candle of 17 dec and 18 dec (current day candle). should I need to update anything on PI? Please help asap.
Hey Jitendra, no issues with the data. If you’re still facing this issue, best create a ticket on support.zerodha.com.
How do I invoke pivot points, previous high/low line in charts of Tradelab?
HI ,
I am using Ichimuku System for My Day Trading it is available only on Zerodha Kite 3 Login but not available in
PI Version… Can you Tell Me how to Use Ichimuku from Pi Chart ????
Thank you
Hi,
I use Pi for trading. I also use it to get intraday 1 minute data for analysis. Zerodha Pi doesn’t updata the last minute trade both in the chart as well as excel data (which we can download to excel). Can you please look into it.
why is the 200 simple moving average different on a stock i opened on zerodha charts for monthly in comparison to the other website showing 200 sma for monthly different on that same particular stock??
Saddam, candles in a chart are formed based on various ticks received from the exchange. While there are thousands of tick, we will not be able to pick all the ticks, hence, the candle formed will differ from one platform to another. This might lead to a slight difference in the indicators you apply. More on this here
However, daily candles will not have this difference as they are formed with the exchange’s bhavcopy data.
1. i am using Pi software for my analysis. i am not able to get more than 120 days charts. is there any option to get longer duration charts in PI.
2. for Study i need text to be written on the face of charts. but i cannot do that.
3. The line color in PI comes default set. for changing it we need to manually pick each and every line and change the color. i feel the settings in Kite are better for color changing. see if you manage to get a similar format in PI too. Even Amibroker has similar settings. i mean Change color before we draw it on chart.
Thanks and Regards,
Piyush
Hey Piyush,
1. For daily charts, you get charts up to 120 months.
2. You can add text to charts by click on the Chart tools option & select Text object. You can refer the Pi user manual for help regarding this.
Hi Zerodha
Is vwap available on pi or you still don’t want to add it?
Is it possible to draw RSI on (OPEN+HIGH+LOW+CLOSE)/4 in stead of CLOSE price in Zerodha Pi or Kite platform. This feature is available on tradingview. Your prompt response will be highly appreciated.
Hi,
try to plot 2 SMA
1-20 SMA
2-200 SMA
as soon as try to plot 2-200 SMA, it gives following message
Invalid period for Indicator SMA-2
please guide
thanks in advance
regards
Namaskaram,
Do you have any tool, which will pop up when a Stock hits Support and Resistance levels, i.e, Pivot levels
Please let me know, this feature can enhance the intra day Trader returns.
Charts not getting loaded in Pi software
error message
could not load file or assembly ’System Enterprise Service.Wrapper.dll’ or one of its dependencies. the system cannot find the files specified.
I reloaded the software and disable antivirus too to check out but problem persist.
how to save chart drawing on pi
i want trendlines (extended). it is present in your website version.. i want it in pi. is it possible.?
Hey Kunal, you can draw the trend lines yourself using the line drawing tool.
Hello,
I want to know ,how to setup or get data of standard deviation of monthly difference of high and low for 2 to 3 years data of any stock.
does the Pi platform have the ability to display historical price to earnings data of a company on a chart?
Hi Sharath, no, PE is not available on Pi.
how to save trendline and support line and some text… once clsoe and reopen all not seeing again redrawing lines and type.. so pls is all save in the chart when open or clsoe..? pls
After seeing all the earlier queries made about charting and the present condition of charts in Pi , my question is ”are you neglecting Pi users?”. There is no doubt there are several excellent facilities made available in Pi. But the basics have to be made simple. Like a previous comment made in this section , i too am forced to keep sharekhans Trade tiger chart opened while trading in Pi because in share khan i simply have to click on a candle and a horizontal line comesup and the price and date are highlighted at the ends whereas in your software one has to ’ very carefully hover the mouse over the candle and read the values given in the box . slightest movement changes the value and you end up making a wrong trade . in a small box , all the values in small fonts, dates in a mistakeable format like 02/03/2017 ( not like Mar -02) and again microscopic hand movement while reading the values in the box and all values change. Its as if Pi requires high precision unlike trade tiger where you can simply click on any position to get the the values high lighted. Renko charts i dont know why u people make it complicated . If one gives the Brick size as 1,2,5 or any number let it show the charts accordingly like the Renko charts in Trade tiger . Here the less said better. The people who have designed the software for you either has concentrated more on the complexities and have ignored the simple basics. Pls look into it.
how do i add a custom indicator to the chart in Pi?
Hey Sourav. Custom indicators aren’t available as of now.
Sir,
Is there any chance of adding quantitative indicators in Pi ?
Or any chance we can have pairTrade module within pi ?
Also I would like Zerodha pi if it can provide Range bars ( like 1 point range bar , 5 pt bar).
Thanks in advance
Line Break chart is not work properly in Zerodha PI
Please solve
Why pi Chart OHLC differ from Snap Quote OHLC. Is there any remedial measure being taken to remove this ambiguity on Pi platform ????
There is nothing wrong here. Why this happens is explained here.
Why Vortex Indicator not Available on Zerodha Pi
sir, for a long time I have been waiting for tick and volume chart in pi. I mean 100 tick, 200 tick chart or 1000 volume , 2000 volume chart. In March, I was told that this facility will be added in pi. but when? charting platforms like ninjatrader have this facility. I want it in pi free or paid.
when we place order from chat, a line should be seen on the chart so that we may modify order by dragging this line.
It will be very helpful for us.
thanks
krunesh
How to add all FNO in one GO, i am unable to add all FNO is showing error unable to add more than 50 script after changing the setting from User Settting.
Hi Nitin,
I have a small suggestion, regarding Pi.
Why don’t you include Composite Index ( Constance Brown’s) as one of the studies. It is a Non-normalised Oscillator and is very useful for spotting reversals and divergences. Actually it is more useful than RSI itself.
And interpreted together with RSI it is fantastic.
The logic and Metastock/ Trade station syntax(s) is in C. Brown’s book Technical Analysis for the Trading Professional ( 2nd edition).
Hope you will include the study in Pi some day.
Regards,
Anirban
Hi Team,
I need to adjust the position of horizontal line drawn on chart(Right Click on Chart> Insert Horizontal Line) on Zerodha Pi as per my requirement but not able to do it.The default horizontal line stays as it is.
Any suggestions?
Thanks,
Sandeep
Untick the Crosshair.
Hi,
Is there an easy way(shortcut) of letting a new script load on the same chart ? Reason behind my question is while doing EOD chart analysis for any number of scripts. Is there a way to easily browse through the stocks one by one on the same chart. Maybe an option to double click on the next script and the chart for it would load on the same charting screen .
Please let me know at your earliest convenience. Thanks.
Regards
Hi,
Today I am getting ”Unable to fetch historical chart data for IDEA-EQ, only live data will be there.” error on pi. I tried to open other charts. But same error. Can you please help me resolve this issue?
Thank you.
Hmmm… Can you write to tsive[at]zerodha.com with this?
Hi,
1.Can anyone tell me how to apply vwap in pi?
2.How to fixed the draw box in any particular position (like left or right)?
3.How to open an another chart and what is the shortcut key when I am in a particular chart(I want to see a new chart instead of the present chart but in the same tab)?
1. You can apply VWAP by searching for Volume Weighted Moving Average in the Study dropdown.
2. You can’t do this right now. It remains a floating widget.
3. You’ll have to go back to the Marketwatch and invoke the new chart. No way to do it directly from the chart.
Volume Weighted Moving Average in pi is not working in gap up or down. its showing different from kite platform.
sir how can i add drawing tool like gann square box in pi please tell me
I am encountering below error while trying to plot 13,26,9 MACD. Please help
”Invalid Long Cycle for indicator MACD1”
Please note this was working fine until yesterday
hey zerodha,
is ur graph tools work on live intraday trading or not..? and are for desktop site or mobile app..?
Satwant, you can view intraday charts on our platforms. Check out the Kite Charting video for more.
Does Zerodha has Renko chart type in Pi?
Yes, Renko charts are available on both Kite and Pi.
Hello Zerodha Where is the option to display previous day high and previous day low? All broker platforms have this feature. Why doesn’t Pi have it?
Sanjay, that option isn’t available in Pi, but you can check out the previous day’s candle.
While using Pi, is there a way to link the chart to a Marketwatch Tab?
I have a list of symbols in my Marketwatch Tab, and as I click on any of those symbols, I want the chart (with the same timeframe, time-period, indicators, etc) to show the symbol selected.
Satish, this is not possible.
Does Pi scan all the stocks every minute and popup a particular stock(s) where a buy/sell is recommended?
Sriram, yes you can configure it to scan every minute. There won’t be a popup everytime but you will see a change in colour.
Zerodha is one of the best brokers today in the Indian market. I hope Zerodha will break barriers and continue to grow to become the top most discount broker in the industry. MIS with cover orders are awesome in Zerodha which provide an easy way to limit risk and also one can orders quickly using Zerodha Kite and Zerodha Pi.
Hi Nithin,
Can you please add ichimoku cloud in pi at least after 2 years of requests from your users.
Regards
Tanveer
Many of us have made the same requests repeatedly but have fallen on deaf years. I even emailed their support asking when they will add trend line replication and there is no reply from their support. Our Indian brokers are infamous for cutting corners to make money. If they provide all the tools and indicators then brokers will start losing money, this is why the brokers in our country only provide bare bone platform without full functionalities so they can make more money.
I think our Indian brokers should have done more with Omnesys NEST Plus charts rather than just leave them at basic charts. Yes it was frustrating to use Omnesys charts at one point as one could not do full technical analysis with their basic charts. Zeodha has gone further with new technologies such as Zerodha Kite which is awesome. Zerodha Kite is one of a kind and also one of the best web trading platform ever.
I am not able to open intraday 3 minute graphs before feb 2017. While it is mentioned that intraday graphs are available after feb 2015. KIndly look into the matter.
Regards
RN5649
Intraday data also includes 30mins / hourly, to mention there is restriction of number of candles, so you are not able to get data on 3 mins till 2015, you can try opening for higher time frames.
How does one remove drawn objects individually by using list? How come there is no option for drawn objects list in Zerodha Pi?
One can select any drawing and double click on it to see delete option along with edit option. There is no list of drawn objects because there is no limit to number of drawings.
Exactly there is no limit to number of drawings. Because there is no limit to number of drawings we require pop list of drawn objects option so we can easily select which ones to delete quickly. Using shift or ctrl we should be able to easily select the drawn objects in the list to be deleted rather than selecting one by one drawn objects from the chart and deleting them one by one which is very tedious. List of drawn objects popup window is there in many platforms such as Trade Tiger, Trader Workstation, Ninjatrader, Amibroker, etc. Why is it not available in Zerodha Pi when it is available in other platforms?
We may not want to remove all drawn objects but a certain group of trend lines on a particular time frame or group of horizontal lines from a particular time frame, etc.
In that case one can right click on that particular chart and select delete all drawings option. All the drawings added on that particular scrip for all time-frames will be deleted. Also if one added 100 different drawings it is not practical to provide the entire list and I personally believe it doesn’t add much value even that entire list is provided.
Deleting all the drawing objects for that particular scrip on all time frames is not practical as it is very tedious for traders to redraw major support and resistance lines repeatedly on a number of scrips. It is quite practical to add a feature to show list of drawn objects otherwise many international platforms would not have done it. On many international platforms, list of drawn objects shows drawn objects relevant to that particular time frame. As traders we have used international platforms earlier for technical analysis using Indian stock market data feed provided by data vendors. Rather than clicking one by one horizontal line or trend line and deleting them one by one, traders can easily select those particular trend lines and horizontal lines of that particular time frame from the list quickly and easily using ctrl and shift and delete them which saves a lot of time.
Hello Sir,
I wanted to request in case there’s a possibility to add the indicator ”QQE” in Kite. Please let me know.
i want to add qqe indicator in zerodha
Hi Pravin, thanks for the feedback. We’ll check on the possibilities 🙂
Forgot to mention that even scrolling the charts also become extremely sluggish when day separator is enabled.
With the day separator disabled, Zoom in/Zoom out and Scrolling is super fast and easy whether is is 30D, 60D, 90D or 120D chart data. Sadly, Zerodha team are not showing any interest in rectifying these errors where small errors like these create 80% of problems for traders.
I din’t noticed sluggishness as such when day separator is added, can you write to [email protected], will get this checked.
I dont know if anyone has noticed in Zerodha Pi but when the day separator is enabled, zoom out and zoom in becomes extremely sluggish. In Trade Tiger and Trader Work station zooming in and zooming out is very smooth with day separator automatically enabled. I dont know who is the programmer that has programmed the day separator in Zerodha Pi but has done a very bad job. I have not seen this kind of sluggishness due to day separator in Trade Tiger or Trader Work station.
Price line with color adjustment, Measuring tool for measuring decimal distances for stop loss, Trend line replication, Cross hair button in toolbar instead of right click, Cursor button in toolbar, Adjustable source window size, Fib level 78.6, Thickness of MACD, Thickness of MACD histogram, Change color for period separator as bright white color hinders visibility of bar chart’s bars, Removal of white squares and using add study remove study which is much more efficient than using white squares to select and edit indicators, etc but they are not interested in changing any of these. Zerodha should have focused completing Pi properly by tweaking all the hiccups but did not. All the above are the basic foundation of a stand alone platform which are incomplete. Funny thing is that Pi has little positive functionalities and Kite has some little positive functionalities but none of the both have all the functionalities which is a huge drawback for traders.
But yes Zerodha is one of the foremost and leading brokers today. Zerodha has made enormous strides as a broker using newer technologies. I have no doubt that Zerodha broker will lead the trading markets industry in the coming years.
Sir,
Please add price line in zerodha pi similar to Zerodha Kite.
I have sent many requests for the price line for Zerodha Pi but they are not interested. Also measuring tool. With measuring tool is it really easy to calculate decimal distances rather than use cross hair.
HI, Is there any option of Detaching the Chart graph from existing screen?
As opening a chart in new window and coming back and forth to chart and marketwatch screen consumes lot of time.
Thanks
Click on the chart, click on the view button on top of the Pi screen and say popout chart. Short cut key ctrl+shift+A
i’ve noticed that Renko charts does repaint. Please fix it
If Zerodha Kite was a standard alone platform instead of Pi, it would have been really awesome. But alas we Indians simply do not have the ingenuity to build a stand alone platform like Kite.
Karan, browsers today itself are very powerful unlike before. We are going to have the Kite 3.0 out in the next 10 days, do check it out.
Really? Seriously have you addressed any of the problems:
1. Kite 2.0 is heavy on resources of PC and laptop even though we traders use i7 and goo amount of RAM.
2. Automatic highlighting of drawn objects when cursor is moved in the vicinity of any drawn object which makes it very difficult to select or modify a particular drawn object.
3. Saved views: save option so we dont have to type in the name of saved view again and again to update the saved view
4. Mismatch of colors in various studies indicators. Some colors are bright and some colors are faded.
5. Customization of drawing tools so the most commonly used are shown first
6. Template option so we can save multiple templates
7. Fibonacci levels edit option to add 78.6 Fib level
I seriously doubt if Zerodha has addressed all these issues upfront or are you releasing Kite 3.0 as usual with minor adjustments like you have done for Zerodha Pi platform?
Nithin, pls add replication of trend lines in Zerodha Pi similar to Zerodha Kite web platform which is long overdue. Trend lines drawn in any time frame must be visible correctly from lower to higher time frame and also from higher to lower time frame like in Kite web platform. At the moment, any trend line drawn in M30 time frame and then switching to M5 time frame, trend line is lost in M5 time frame and not shown accurately. Trend lines replication feature is the biggest drawback I am facing in Zerodha Pi platform. All International stock trading platforms have this feature but Zerodha Pi does not. How long will Zerodha take to implement this feature? 5 years? 10 years?
BNP Paribas will be spending 70 million Euros in updating their trading platform and infrastructure to double their client base by 2020. I hope Zerodha also will also do the same to their Pi platform as it severely lags in ease of use in charting tools and trading from charts when compared to Ninjtrader, Amibroker, Metastocks, etc charting platforms
Hi,
There is no Ichimoku cloud indicator under study menu, can u do the needful, please.
Thanks and Regards
How do I add Average true range in PI and modify the number of days? Also please let me know the script for previous day close is down and previous day stochastic %K > %D… Thanks in advance…
@Nitin
Hey,
When are you going to kill this joke of a trading platform?
Any date decided for pulling the trigger?
I am all pro life and all but Euthanasia seems to be the best way to free Pi from its suffering.
My eye moistens and heart is saddened to see such a horrible fate of a someone ”Born” with gifts that none else have – backtesting, EAs, order from chart – and still couldn’t capitalize on those gifts.
Well, such a talent wasted.
RIP in advance
We are not killing Pi, the focus is also to offer backtesting, EA’s etc on Kite in a much better form.
Team,
How do I insert a dotted horizontal line in Pi Charts?
Not possible for now.
As usual and always Zerodha team reply is not possible now….not possible now….there are so many issues to be streamlined in Pi but their reply is not possible….
Not all feature requests can be accommodated at one go Shyam. Every time there’s a request, the team has to evaluate the possibility of implementing it, several rounds of testing has to happen before it can be released. We’re open to suggestions and will do our best to implement them.
In Pi I am not able to delete a indicator(like average true range) once placed on chart . I tried to selecting by left clicking it; which is working but when i am pressing delete key to delete it; Its not deleting it.
Please let me know if there is some other way to do it.
Thanks,
Pravin
During trading hours if the market is volatile the selected indicator may be unselected due to latest changes to it, it is advised to select the indicator and use delete key simultaneously. If still not able to delete then can call 080-40402020 to get assistance.
How to open chart with bollinger band by default …meanns every tym when i opened the chart I havr to set all the indicators for individual stocks … Is this possible to set them permanently???
Add bollinger band and right click and save the chart as template.
After that goto view-> user settings-> chart setting-> Tick on default template box, browse and add the saved template-> Apply. This should sort your query. For any more help on this you can write to [email protected].
Dear nitin
congratulation for the Pi as your brkg house is in forefront of transparency , really kudos to your effort to educate indian customers about technical of trading .
I request to your technical team to be more visible to sort out charting problems or new development , i am sure you will make the trading more like a professional brokerage house.
Thanks and reagrds.
Just Noticed that Vortex Indicator is not available in Pi. Also, Supertrend is not showing buy/sell arrow signal as it work well in Kite.
Any thoughts on this ??
Thanks,
Jayant
SIR, I AM UNABLE TO DRAW PIVOT LINES ON DAILY CHART.
2. I AM UNABLE TO DELETE AN INDICATOR.
JAI SUNDHER
1. There seem to be no issues. Can you share a screenshot to [email protected]
2. Place your cursor at the top or bottom of the indicator and you will be able to right click and delete it.
Your crosshair must be on:
right click and remove check on cross hair first.
then try clicking on indicator and press del or right click and delete it.
Hi Nithin,
A few suggestions that i would put forward as suggestions as well as requests,
1. Would the new version of Kite and Pi incorporate MP? This is a must study.
2. Can we have customized indicators, something as making our own indicators and strategies with scripts on Kite (like on tradingview.com).
3. A market screener for screening as per studies in Kite (screening for above, below and crossovers).
4. News indicator (for selective stocks as per user ) with sentiment analysis.
All of my above mentioned suggestions come for the betterment of the Kite platform. I truly love all that has been put up for us (traders) to use with Kite.
I hope my suggestions would be incorporated. Looking forward on using them.
When will you introduce measuring tool in Pi similar to Kite? When will you also introduce market price line for Pi like in Kite? With price line it is very easy to see where price is currently.
May I know when you will enable trend line replication for all time frames? Trend lines replication is long overdue for Pi. For example: If I plot a trend line in hourly chart, I should be able to see the same trend line in 15 min chart. Tradingview.com India charting layout is brilliant. I wish you would introduce add study, remove study, modify study rather using white squares to select an indicator which hinders drawing support and resistance lines and scrolling with mouse.
Hi,
I using latest version of PI (1.0.0.6).
In Pi charts, when i select Time frame as 1day and whatever duration it may be, I couldn’t see the last trade day’s candle in graph. Is it some sort of bug or am I doing anything wrong?
No bug as such but if you select 1 day it means one calendar day and not trading day so select more number of days.
Sir, Pls develop the PI platform like FXCM TRADING STATION and KITE like FXCM web version at present both (PI & KITE) are very much incomplete
Even Zerodha knows there are lots of problems with Pi and deliberately they are not fixing the issues. This is how we Indians do business everywhere.
Hmm.. not really. Can you email [email protected] with issues you are facing. We will check it out.
1) please try to solve the mystery of disappearing trend lines earliest.
2) when i draw horizontal study lines and if CMP is very close to study line, the price flags on right side panels overlap and only one of them is visible and another hides behind. Please modify this to make it visible all times without overlapping.
3) Gradient colors of charts disappears and is not saved as default even after saving as default templet. Every time it is to be selected makes its useless.
4) Horizontal line on chart is not changeable/ editable if crosshair is ticked in user settings.
5)- Horizontal line values still keep changing on zoom/ scroll.
6)- A buy/ Sell/ SL line must appear on chart if placing order from charts and must be editable/ variable by draging.
7)- Crosshair values must be visible on X-Y panel. Similarly, EMA/ MA values must also be visible on Y panel.
8)- Bottom Date/ timeline/ Date seperator line is not synchronised.
9)- While using Fibonacci retractments, Chart gets shrinked. Need fixed. Also, % and its corresponding values to be on seperate ends of lines to avoid congestion.
10) Study line values on right side panel of Chart
Among a few. Are they looked upon ????
Dear Zerodha Team,
In Pi Chart, when i draw horizontal study lines and if CMP is very close to study line, the price flags on right side panels overlap and only one of them is visible and another hides behind. Please modify this to make it visible all times without overlapping. Its creating too much embarrassment on charts.
Right, will check for alternative on this, but for time being just keep the horizontal thickness to 1.
Also please try to solve the mystery of disappearing trend lines earliest.
Completely disappointed with todays update
1)Continuous NFO FUT daily data ,shortcut is Shift+D from Market Watch
2)Weekly and monthly charts,can be viewed from opened charts.
3)Line charts.
4)Spot currency pairs can be added on to MW.
5)Quick market orders.view->user setting->chart setting.
6)Zoom in changed to latest candles instead of center zoom.
7)Able to save space bar on market watch.
8)Color Highlight of scrips on MW for : view->user setting->market watch
Day High / Low
Year High / Low
9)Other fixes and enhancements
——-
1) Already available with previous update
2) Already available with previous update
5) Already available with previous update
6) Already available with previous update
8) Already available with previous update
Necessary and easy update needed are not addressed and after so much suggestions and prolonged wait, the concerns are not ammended. Disappointing indeed by developers.
I didn’t find Ichimoku syatem in Pi. Is it not there?
When shall we have tick chart and volume chart in pi ?
Hi Nithin,
Candles are missing in Intraday Charts in Pi.
I use 15 min chart, but due to missing candles, all indicators show wrong data. For e.g., Bollinger values are different in same scrip in Kite and Pi. Ikeep losing out on trades. Please correct it immediately or else we have to move out of Pi.
Regards,
Noorun Nisha
ZR8197
Hi Nitin,
Why cant I see the charts in Pi after market hours to do some study or research.
Charts are working fine after market hours. Can you please write account specific queries to [email protected], we’ll have this checked.
Hello Zerodha,
My previous querries not even responded. Thats how it is. Fine. Got some new points in charting. i.e. I am using Pivot (Woodies) 15 min in candle charts. After some time on suspecting the charts, when reloaded, complete candle form changes, levels changed across timeframes. Candles missing in between timeframe changes (15 min/ 5 min to 1 hr) causing a lot of emberrassment and the reliability of this platform. Do something that can be trusted upon.
Dear sir,
I need 30 seconds intraday in pi charts for find small divergence.
THANKS
Hmm… not possible for now.
Zerodha Kite Charts Are Delayed By Maximum-10Seconds And Minimum-2Seconds.
Make it Real Time.
Hi Zerodha Team,
I have a query on PI charting.
Can we have in PI charting a feature in which if we draw some drawing using drawing tool say a trendline on one time frame say 15 min chart, automatically appears on another time frame say 1h chart if we change the time frame??
I suppose, it is not there rt now.
Ya, as of now it is not possible to save a trendline drawn on one timeframe to another, but horizontal lines will stay, will check on this possibility.
Nice required update in Pi. Hope can contribute a bit by providing inputs @ ur end if u can to implement.
1- Horizontal line on chart is not changeable/ editable if crosshair is ticked in user settings.
2- Horizontal line values still keep changing on zoom/ scroll.
3- A buy/ Sell/ SL line must appear on chart if placing order from charts and must be editable/ variable by draging.
4- Crosshair values must be visible on X-Y panel. Similarly, EMA/ MA values must also be visible on Y panel.
5- Bottom Date/ timeline/ Date seperator line is not synchronised.
6- While using Fibonacci retractments, Chart gets shrinked. Need fixed. Also, % and its corresponding values to be on seperate ends of lines to avoid congestion.
Regards,
7- Also, trendlines drawn disappears while zooming in/ out. Also, it must be visible accross timeframes once drawn.
8- Gradient colors of charts disappears and is not saved as default even after saving as default templet. Every time it is to be selected makes its useless.
i had added w R% in pi, but it is not showing anything & i also not able to remove it from chart, secondly i am also not able to remove volume from it, & how to move pane up or down, pls suggest
No changes at all done in 16 Dec 2016 Pi update. Very disappointing! It will take another 10 years for proper updates to happen with Zerodha Pi. Basic charting platform foundation must be strong so traders can feel as ease with their day to day trading. Pls fix the following problems asap in the next Zerodha Pi version: 1. Remove the white squares and introduce study with sub menus such add study, modify study, remove study, etc 2. Introduce an option for scrolling such as scroll bar at the bottom of the chart or provide an option to switch from mouse cursor scrollling to mouse wheel scrolling. 3. Drawing and modification of horizontal lines (support and resistance) should be with ease and not cumbersome as price, indicators, etc get selected showing white squares and mouse cursor gets hooked to the white squares when trying to adjust horizontal lines. 4. Trend line, horizontal line, vertical line replication is a must for technical analysis. 5. MACD Indicator should be able to increase and decrease thickness of histogram and MACD lines. Make it a color MACD indicator. 6. Chart scrolling is very sluggish in Zerodha Pi and not smooth. 7. Traders should see an price entry line once price has been executed at market price or limit price has been executed. Similarly stop loss line and target line should be seen on charts when stop loss or target has been placed. Users must be able to customize the colors of the lines similar to Metatrader 4. 8. Price movement should also be seen as a moving line on chart and also price movement should be highlighted on Y axis. I will continue to trade with broker Sharekhan until the above problems are fixed in Zerodha Pi.
Is it possible to see the charts for more than 100 stocks with the saved template. Such as 30 stocks on one screen and next 30 stocks on another screen and so on. Please advise how to do that if possible.
Not possible currently.
Sir
We have to invoke charts for different scrips and then go through the whole process and many windows are opened or we have to close one window and then open another.
Why not open one chart window and within that window we get a list of all the scrips from our workspace. So to see charts of different scrips we just select the name and the same chart window shows the chart with same settings for all the scrips one by one.
Hope my language is understandable to you
Thanking you
error on adding 200 sma or 200 ema on 1hr , 2hr , 4 hr, or daily chart .
error pop ” invalid period for indicator”
please help .
I believe there are no enough candles or data to get 200 ema applied, try to open maximum data and then apply, if still getting same error you can write to [email protected] with screenshot.
how to put alert on pi for NFP script,is it work with Indiactor(Macd,Bollinger band Etc…?
does it place the order also or if i wan to crete alert only to come on my break out buy/sell???
Check the below link and once the alert is generated it will be displayed in generated alerts window under alerts column.
https://zerodha.com/expert-advisors/code/big-3-buy
Hi,
I am using the PI and i am trying to plot a horizontal line on the RSI peak/ bottom but i am unable to do so. The only option is that it says insert horizontal line but if i do that it plots a horizontal line on the rsi but not at the point i want. Can you help?
After inserting horizontal line, select it and drag it to the point you require.
Sir, pi has the facility of different time frame charts, but there is no tick chart, range bar chart or volume chart.It will good you provide 100 tick, 200 tick chart or 1000 volume, 5000 volume chart etc in pi. Do you have any plan?
It is on our list of things, but some time away.
Hi Nithin,
Zerodha Pi charts are sinking when the stock went for complete gap down. It happened recently with GAIL on 09-Mar-2017. I was watching the GAIL futures(Expiry Mar’17). When the future gap down,
then all the candles were shrink and not able to zoom it properly and could not bring the chart to normal way. what needs to be exactly in this situation?
Our team is looking in to this, we’ll have this checked and resolved.
Hi…..I am not getting Ichimoku Cloud in Pi……Please help….
does pie have volume at price indicator
I assume you are asking about just volume, Pi does display volume bars along with price chart.
Dear Mr. Nithin,
This is Ganesh Banda, this is my first appearence here.
I just want to back test the ready Artificial intelligence which are already there in pie. I think i could not find all the Expert advisers, in the back test page, which u have given codes(buy script -sell script) Because we need to know the accuracy of the expert advisers which u people had already inserted in the pie app. Please do the needful.
Thanks:)
We don’t recommend anything, just given few as examples, one need to find which is suitable for them by themselves. Also one can visit this page for further queries on coding. https://tradingqna.com/c/algos-strategies-code.
Hi,
It will be great if you can please add all the missing indicators in PI which are available in Kite. For example Ichimoku is available in Kite not in PI.
You will agree, having consistency on platforms is good.
Regards
Abhijit
Both use different charting libraries so it may not be possible.
Hi zerodha,
In zerodha PI how to increase the levels in Fibonacci retracement, level of 127.6 & 161.8
Pi not possible currently, login to Kite kite.zerodha.com
Pi is great… But how in this great package you guys left out weekly and monthly time frame… And daily charts have no data before June 2016… These thing are just basics without overall time frame analysis what’s the use of all fancy different type of charts which people only uses 3 4 kinds… Can’t you plz think about it for a moment… Just Basic requirement analysis anyone can do for you… Plz make it the best ever trading platform…?
Weekly and monthly charts will be available in next release, also we have 10 years of data on daily charts, can you let us know the scrip you are checking for.
Mcx goldm silvermic crudem…. Chart shows data from June 2016 onward in pi and kite both
FYI those are future contracts, once the contract expires the data is lost and new contract will come in to existence, anyhow we are working to provide continuous data even for future contracts but will take sometime.
Sir but previous data of past contracts define most of the strong s/r zones which market follow preaty well.. and if you add weekly and monthly chart but data is not there than how much candle do monthly chart consists… Plz do consider maintaining data as it is most important and other Brocker like sharekhan too have data from I think yr 2000 onward… So only drawback you have now is only these things…rest is best…
hI,
Please can u incorporate a simpler way to manage the indicators. Getting them on is an effort after that u can neither edit the parameters or even remove them. Try left click, hitting the delete button nothing works. Only way to remove is to close the chart and reload again.
Indicators loading editing and removing is a breeze on kite. But kite sometimes has problems loading the chart especially the hourly charts. So to do some checking and back testing is not possible with Kite. If i start using Pi and want to test some indicators the above problem is a big bother and very frustrating.
Why cant to u have it incorporated in the right click menu ???
Rgds
Bopanna
It is very easy to delete indicators on Pi, try the below.
1. Select the indicator you want to delete.
2. Once selected it will be highlighted in small squared boxes.
3. Click delete key on keyboard to delete the selected indicator.
Also there is no issue on loading hourly charts on kite.
If you need any assistance on this you can write to [email protected].
Hi,
Its the step no.3 that does not happen.
The indicator as mentioned gets selected the small square boxes appear thats it, after that press the delete key nothing happens. Tried repeating the steps no luck. Only reloading the chart helps. The hourly chart problem is with Kite and not PI.
Rgds
Thanks
Bopanna
hi,
Ok , I tried something different and may be you can update this in your deleting the indicator section above.
If you double click on the indicator the edit dialog box opens up where in you can change its settings and also delete the indicator. This is far easier. try it.
Rgds
Bopanna
You can double click and delete the drawings as of now, can you elaborate the issue on hourly charts you are facing. It would be appreciated if you can also share a screenshot to [email protected].
1) Pi = Drawings – Left Click & Delete does NOT work.
2) Pi = Study / Indicator – Left Click & Delete does NOT work.
3) Similar Study on KITE & Pi are not consistent. Seems like both are showing a different study !!!
4) Kite = Point & Figure Charts, no way to change the parameters & Zerodha support does not know what are the default parameters !!!!!!!!!!!!!!!
1. Pi- select it and use delete option or select and right click to choose option to delete and not left click.
2. Same as point 1, select and right click.
3. For few it may vary as both pi and kite use different charting libraries, some studies may vary across charting libraries. It is suggested to use any one for consistency.
4. Yes, this issue we have already raised with our vendor and will try to get a fix soon.
Hi Nithin
i am a swing trader and if i will set scripted price alert on particular stock in Pi & i will close Pi.. Shut down PC also…
after some hours after starting PC, Pi… if i will Go to generated alerts, i will find the alerts or again i have to create alert and keep PC on till market close ??
Please Reply as soon as possible
Thank You
You will have to keep the PC and Pi on to get alerts.
Hi,
When is the next release of PI..?
Does the new release support Market Profile indicator?
Thank you….
please add Fibonacci Price Extensions, Channel and Equidistant trend lines in Chart Tools.
1. It is not possible as of now.
2. Goto view->user setting->chart setting->tools->select pivot points->Apply->ok.
thanks!!
1)I am unable to make heikini ashi chart as idefault in default chart template.
2)I am unable to make pivot lines as default in default chart template.
Every time i need to change them.
Hi! thank you for your continuous support. i just want to ask that how can we apply patterns in charts, like shooting star, bullish harami, bearish harami, hammer etc.. Like NSE Tame has got the option where if any chart pattern gets created it highlights automatically. is this option available in Pi or kite?
thank you in advance for your response.
Currently not available.
weekly charts not availble on PI, whereas the same is available on Kite. please provide it PI also.
It will be available in next release.
please add Schaff trand cycle function FOR trade script (NOT INDICATOR) .
or help me to make my function.
its easy to you becouse you have “Schaff trand cycle” indicator , so make it as a function for trade script .
I’ll pass your feedback.
What is the ideal range in a renko chart?
how to see get month chart on PI?
Monthly charts aren’t there currently. It should be there in the next release of Pi.
Dear sir, does Pi have option of square scaling ? Also is it possible to export data from Pi to text files?
Regards
Gaurav
Pi to excel is possible. No square scaling option for now.
Is it possible to view multiple charts in single window? If yes, then how? And, could you please make it possible to set chart scale as log or semi-log?
You can pop out the chart and resize it to accommodate more than one chart.
Will pass on your feedback to the Pi developers.
Sir Please add a ICHIMOKU CLOUD on pi it’s very important indicator for trading please add ICHIMOKU CLOUD in next pi software update
Not yet as an indicator. But there is an expert advisor to generate buy/sell signal based on Ichimoku, check this post.
Ichimoku is not available on pi?? its only available on kite. how long would it take?
Hello Sir, मेरा नाम राजेश्वर है. मैं पिछले ५ साल से trading कर रहा हूँ. मैंने पहले Angel broking के द्वारा trading करता था। , और technical study उनके प्लेटफॉर्म speed pro starter से की थी . जो की ODIN Diet (Financial technologies) का मॉडिफाइड version है। इस सॉफ्टवेर मैं एक functionality थी की , इसमें आप आपने स्वयं के indicator बना सकते थे. और इन्हें chart पर उपयोग कर सकते थे , ३ साल fail error और learn की क्रिया के बाद मैंने एक indicator बनाया जो ९५% से ज्यादा success था , किन्तु मार्च २०१६ में उन्होंने आपना plateform update किया जिसमे अब यह fuctionality नही है। मेरे friend ने मुझे आपके pi software के बारे में बताया ,और रिसर्च के बाद मैंने पाया की आपके pi मैं भी वही function है as a artificial intelligance and trade sctipt .
किन्तु मैं ७ months बाद भी अपनी script लिखने में सफल नही हुआ हु। क्यों की आपकी ट्रेड स्क्रिप्ट में schaff trend cycle का उपयोग करने के लिए कोई function नही हे। प्लीज मुझे बताये मैं क्या करूँ । क्या आप यह function जोड़ सकते है। या क्या आपकी technical team मेरा यह indicator बना सकते है यदि आप यह indicator आपने प्लेटफॉर्म में add करेंगे तो यह दूसरो के लिए बहुत उपयोगी होगा।
please add Schaff trand cycle function in trade script .
or help me to make my function.
its easy to you becouse you have ”Schaff trand cycle” indicator , so make it as a function for trade script .
How to set the Buy & Sell signal or vice versa on Kite or from Pi chart?
Please help me in this regards,
hello sir,
please tell me, pi trading platform in built free 80 indicator (Charting )
You can login and check all the 80+ indicators. Don’t have the list on me.
There appears to be a charting error in Pi for Karnataka Bank November futures. On 22nd November, an intraday low of 100.1 was hit as per NSE data as well as per real time observation. When i use 5 min chart, then low is shown as 100.15 and while using 1hour chart, low is shown as 102.65. Is there something wrong with my settings cause I have noticed this discrepancy a few times.
I restate my problem. Upon further investigation, the low of 102.65 is showing for 23rd November and not 22nd November. The hourly data for 22nd November is missing. My chart settings are: Candle Chart, 1 hour, 30 days
There is no issue from our end,it would be appreciated if you can share details with screenshot to [email protected], anyhow will send more details on this to your mail.
Please try to provide following features in chart to make Pi a complete charting software :—-
1. Add weekly , monthly, quarterly chart option.
2. Provide increase or decrease of thickness of different study in chart.
3. Provide dragging facility of different study in chart . So that we can do up and down, also on price line.
4. provide Line chart type option in chart.
5. Provide chart linking facility of scrips in chart, so that when we click a scrip in marketwatch then automatically same scrip is opened in all the opened charts of different time frames.
6. provide refresh option in chart.
7. provide shortcuts for chart time frame and chart type.
Indian brokers charting platforms lag behind the international brokers platforms very much. Indian broker charting platforms are 10 years behind when comparing to international broker platforms. Indian broker charting platforms do not have tick charts or range bar charts. They have a long way to go. I am quite happy that they are improving. I think in a few years time, they should be as good as international broker platforms.
Have you seen the kite charts: https://kite.trade//docs/kite/, the charting library is from chartiq, they drive a lot of big broker/exchange websites.
”One cannot change time interval in same chart, always you have to open new chart for changing time interval.”
I totally agree with AK on this. In all broker platforms internationally, it is possible to do this easily but not in Pi. May I ask why this was not enabled in Pi?
Kumar/AK, if you are using the latest release of Pi, you can change time interval from the same chart.
Zerodha Pie is very tradition software in charting little bit advance than NEST. Zerodha should learn from Sharekhan Trade Tiger software. Zerodha is not even 25% of sharekhan Trade Tiger in Charting. There are many problems in Zerodha Pie , few of them are —
1. Unable to change the thickness of technical indicators.
2. One cannot change time interval in same chart, always you have to open new chart for changing time interval.
3. one cannot change another scrips in the same chart , always you have to open a fresh new chart for a new scrips.
4. Technical indicators are not customisable . you cannot easily change it position up or down according to your need in the Chart.
Overall Zerodha Pie is lacking some basic features to become a good Charting software. Zerodha Pie cannot claim best software unless it improves this basic features in charting.
Hi.
When can I expect: 1) MONTHLY time frame charts 2) GTD for Equity with validity of 30 days or more.
These are the 2 features I had requested & have been waiting for since I’ve opened an account.
I would love using Zerodha platform for my trading but have been unable to do so for the lack of these features.
Could you please give me a time line.
PS: I am a Swing trader.
Gautam, both will most likely take more time.
Thanks Mr.Kamath,
Would appreciate if you could get some-one to intimate me once this becomes available.
Dear sir,
I want to bring into your notice to add monthly and weekly chart of scrips asap in pi software, as well there are many place of improvement in alerts features as well in artificial intellengency.
Thnaks and regard.
Is kite charts are available in apple device ??
We have a lite version of Kite for iOS. Check out in the apple store. We are working on a native app as well.
when will u provide fibonacci time n fib extension in KITE
Quite a coincidence that you asked today, we just updated a new version of charts, fib time is on it. https://zerodha.com/marketintel/Bulletin. Also in fib retracement, using a -ve % is an extension. So fib retracement also can be used as an extension.
1. Pi——Charts are not opening in Pi ? it allowed me to add scrips in default watchlist but when i am right click on scrip name and select last option of Chart , then nothing happens ….what should i do ?
2. Kite——-Visibility of Pivot points on Kite is very very bad..pls improve it as early as possible
3. Kite —–I could not found Nifty Spot Data on Kite ?
4. Please take much efforts to improve Kite rather than pi
1. Can u send an email to [email protected] with your client ID. someone will check this, no issues ideally.
2. hmm, checking
3. Search for index on kite, you will see all indices. Add it on the marketwatch, we have data from 2010.
4. Yep
How can i measure a Bar in Pi ?
Is there a ”Measure” option provided in Pi software similar to the one in Kite ?
Not available on Pi as of now.
HOW CAN I PERMANENTLY ENABLE” GRID COLOR” ON EVERY CHART THAT LOAD ON CHANGING STOCKS?
For now one has to change it on every chart but in next release will give the option to user to set a default color.
PLEASE GIVE INTRADAY FORMULA FOR BACKTESTING IF CURRENT MARKET PRICE (CLOSE) CROSS NEW HIGH
Hello Nitin Sir ,
In Zerodha Pi software i can not add moving average . in web based zerodha kite it is easy to add 10 20 50 100 200 etc DMA , but in zerodha pi there is no option . i saw your http://zerodha.com/z-connect/tradezerodha/nest-plus-for-ztrader/charting-adding-multiple-indicators this link and searched all but didnt find moving average option anywhere . if it is there in the pi pls show me or if not pls update the software . i am getting difficult to watch . thank you . otherwise pi is 7star software .
Open any chart,click on study and type exponential or Simple moving average and apply.
How do i get Moving Average on zerodha pi?
i can just see the moving average envelope on pi
Hi..First Update Zerodha Pi Software and Just Go to Study and Add Exponential Moving Avg . It was not available in older version they might updated in this week .
Dear Zerodha,
i cant find VWAP indicator in your list. Are you planning to add this indicator?
please add this one.
yes, in our list of things to do.
is the VWAP indicator added now ?
Hi,
Is there anyway I can see historical charts of Nifty options (2015-16). I tried to add old contract to pull up charts but it is not working on Pi as well as Kite. Please advice. Thanks.
Not currently possible.
how do i get crosshair in pi?
Right click on any chart and select cross hair,keep left click selected on chart and move the cursor as you want and the values will be displayed in databox.
if i plot a line for support or resistance or trendline then it should be extending beyond the point i stretch it.
On Pi, it doesn’t automatically stretch, but you can drag it.
Pi is great but still needs to mature…
Here are some questions and some quick improvements for accessibility that i think will make pi better.
– How can we view weekly / monthly charts ?
– There must be pre-defined market watches atleast for Exchange defined indexes, its really cumbersome to add the stocks.
– shortcuts for viewing different time frames (w – weekly , h – hourly etc..)
– Cannot delete studies
– Show / Hide, remove multiple studies at once
– Boxed layout for managing market watch & charts
Thanks.
yes i also have similar queries.
Pi chart is not updating. But snapquote and market watch and indexes are updating. When I called Technical support they asked me to add an exception in the antivirus. Done it but no use. Can you please tell me what to do. Please respond as soon as possible
Please check the system date and time , time zone to indian standard time in you PC time settings, and also you can synchronize the internet time in time settings.
pi is a good one but it requires to include the open interest graph for its fulfillment.
Sir when can I expect weekly/monthly charts?
Hmm.. this will take time.
Hi,
When Chart Template is saved, it does not remember overlaying of indicators? Because when I re-load saved chart template, I have to again do the overlaying of Indicators. Please let me know if there is way to save overlay. Also I could not find Moving Averages (price) indicator in Pi, is it available?
Thanks
Ah yeah, currently the overlay settings don’t get saved. Search for simple or exponential moving average.
Can we compare charts of 2 different scripts in single screen
Not on Pi, but on Kite you can. Check this: https://kite.trade/docs/kite/#compare-scrips
HOW TO SAVE THE DRAWINGS DONE IN A CHART ? CHART SAVED IN TEMPLATE DOESNOT CONTAIN THE DRAWINGS WHEN RE OPENED
Dear Team,
can you guide me in creating a script for a strategy.. it involves more than one indicators like bollinger bands, rsi and intraday MTM. where I can find the guide for the same.
Hi Nithin,
i am not sure if we have weekly charts in Pi.
No we don’t.
Dear Sir,
Have started to trade on Pi for quite some months and have observed some serious issues with Pi Platform and a few suggestions in Pi Charting for implementation.
1. Pi Charts stops updating whereas MW keeps working. So unless we keep a continuous track, its a very awkward situation when we find after some time the chart was not updated and we keep on holding positions based on bad charting live.
2. Bracket Order: Stoploss and TSL is not getting updated in order window and inspite of +ve directional movement, initial applied SL and TSLs remains same in Order window. Thereby, SL applied only hits. The case is not with Zerodha trader terminal.
3. No option for MW refresh: If due to some reasons, Internet connection goes off, MW refresh needs to be invoked. The same to existing in Pi.
4. In Pi Charting, Trend lInes once drawn, can not be altered or deleted. There is only one option left. i.e. Delete all drawings. This way, the other study line also get deleted which which was not required.
5. Cross hair value @ price should be visible in Side & lower panels.
6. Day Seperator line is not aligned to the bottom panel of charts so creating confusion.
7. While Zooming in/ Out in Charts, In should be from left size. Last candle should always be visible during zooming.
Keep up the good work.
Regards,
Sending this to our team. Thanks
1) Charts will be updated only if LTP( last traded price) is changing where as market watch update will happen even if best bid and best offer changes and this is how it works every where and it is no issue with charts on Pi.
2) There is no difference in functioning of BO order in Pi to Nest trader, would appreciate if you can write to [email protected] or call 080-40402020 and ask for me ( Siva) when it happens and show.
3) Can do cntl+R.
4) Make sure you are using latest version dated 29-07-2016 by going to about zerodhapi under help menu. Double click on any trend line or horizontal line to edit it or to delete it.
5) Point noted, but as of now it can be seen in databox and it can be moved to the desired place.
6) point noted.
7) Working on this.
Ridiculous and weird answers.
1) Isn’t it a weird and irrelevant answer by the technical team ??? How come price in MW can differ from Charts even after long time????
4) What the clients are saying, do u really listen and understand ? What the terminal at ur end acts is the same at other ends also ? I have checked, re-checked and re-re-checked. Don’t think the people at other ends are sitting dumbs. See urself what people are really facing.
Will reach you on this in sometime.
Got the support team working on this and ratified the issue. Later, issue re-occurred. On further dig, observed following on trendline issue:-
1) This problem occurs when Crosshair is enabled. When crosshair is unticked, issue gets sorted out. Needs a fix.
2) Horizontal line value still keeps on changing with chart scrolling. To be fixed.
Will provide fix in coming releases.
”Horizontal line value still keeps on changing with chart scrolling. To be fixed.” I also faced this problem when scrolling using mouse cursor. Keyboard scrolling is very slow. Its even difficult to scroll through the charts with moving averages present on the chart because while scrolling the charts, moving averages and horizontal lines get selected and scrolling the charts becomes very cumbersome. I suggested the Zerodha chart programming team to Add Study in the right click menu and include the following sublist: Add study, Remove study, modify study (include option for macd histogram show/hide in the MACD), Hide/unhide study. Very simple but Zerodha charts programming team have made it really complicated. Selecting a particular indicator from the chart is redundant. Tools should be the only entities that can be selected. What is it with the fixed Size of your source box which is really small to see anything properly such as the parameters high, low, close, open, etc. Pls remove the source box completely and go with the above.
Provide an option to the clients to switch scrolling of the charts from using mouse cursor or keyboard to mouse wheel as Zoom in and out buttons are already there in the charting tool bar. We Indians are one of the best when it comes to programming and I cant believe that Zerodha could not produce a more superior charting platform without the bugs and costly errors which simply hampers clients day to day trading.
Points are noted but will take sometime to be implemented.
Hi Venu
Thanks for your suggestions …appreciate
Hi nithin…
Thanks for the reply.
But is there any way to trade from the options chart directly without the charts stopping.
Because sometimes ltp of a stock option dosent update for more than 5 min and there is a huge move which is difficult to predict because the chart along with the indicator would have stopped working. ..
As you know, charts are plotting data points. In case there isn’t any data point(ltp), there’s no way the chart can form.
Hi siva
As you mentioned in your earlier post about the ltp not trading and henceforth the chart stalled…
In this case how do we buy or sell from the chart as the charts along with the indicators have stopped updating ..
Is it possible to follow the futures chart for trading in the stock option.. for eg can i refer to futures chart of jet airways and use it to trade in a 540 ce of jet airways in options… since movement of both charts are almost similar and only ask and bid price of the option call are updating …
Yes, it is always best to refer to the underlying futures chart rather than options directly.
How to refresh the chart
Hi Zerodha Team,
I am using Pi for trading, while using charts.. some times Charts will update and some times charts wont update.
How to fix this issue?
Regards,
Vinod Reddy
There is no issue as such from our end, charts will be updated only if LTP( last traded price) is changing, sometimes for few seconds LTP might not be changing at all for some equity stocks and for many illiquid options, if you are facing the issue of charts not getting updated even when LTP is updating then you can immediately call 080-40402020 and report to our staff.
Hi Nithin
Please enable saving of all the study and drawings we make in the charts. That would make trading on Pi HEAVENLY.
Cheers
Prithvi
Hi,
Amazing Software with very helpful staff, Thanks Zerodha.
After Recent Update unable to see crosshair, whereas the option is available in kite. can you help me.
Vishwesh
Bangalore
Right click on chart window and select cross hair option. Make sure the date is 29/07/2016 by selecting About ZerodhaPi under help menu.
Do we have Candlestick highlighter which tells us about what kind of Candle has been formed in order to help us read the candles properly in Pi..
Have recently come across the one called Nison candle Highlighter and i feel its amazing and should be added to pi as well for the charts..
No we don’t have it.
how can i watch weekly,monthly,quarterly and yearly chart in zerodha pi
You can choose the interval at the time of opening the chart.
Intraday day data is available for 120 days and daily data for last 10 years.
How can i check weekly charts on PI .Can i add my own indicators in EA and then use it.
Please help
hi NITIN
whenever i open a graph of 60 days or more and apply two three indicators pi freezes
and if 3 or 4 graphs are opened then it doesnt work at all. Any reason for it ???? My pc has a 4 gb ram.
One more thing which i observed is as i am new to Pi. I have to open all the charts for the stocks in my workspace daily. is there a way whenever i load the workspace all the charts open automatically with the templates i have attached to the charts?
Not possible currently.
hi,
Is it possible to display two charts in one screen
yes, you can. It is explained in the post above.
Pi seems to be useful, but not very convenient:
1) The Charting Templates have to be created afresh, whenever I am creating a Chart for a new Scrip!! Not only is this time consuming, but quite a drag! In fact, one can save the TEMPLATES on KITE, then why not on Pi??
1. I’m not able to find fibonacci extensions tool in pi. is it available?
No extension for now. Only retracement is available. Fibonacci extension will be available in the future release of Pi.
sir i m new to zerodha im using kite is their any alert system in pi or kite just as certain share or commod. in buy or sale mode [previous angel software use to have] i mainly use supertrend or ichimoku cloud
Pi has alert feature, check this: https://zerodha.com/expert-advisors/
Directional Movement System Indicator is very useful, but for the almost similar blue colour codes of +DM and -DM. Hence it is very difficult to distinguish them easily. It makes very difficult to understand cross overs etc. Please make one of the DM in yellow. ( Please note that we can edit only main signal colour, which is red and is okay.. Hence the request)
i too am requesting Zerodha to fix this , if the two lines can be differentiated it will help us a lot , some dark colors could be used for differentiating
We’ve informed our developers. We’ll try to accommodate this in the next release of Pi.
line chart is not available in pi software .if it is present please let me know the path to draw it.
Not available presently.
Hi Nithin,
Any update on line chart? As of now I’m using Kite for Line charts. Can you please let me know timeline for the availability of line chart on Pi. I believe, for the intraday trader line chart is a must and it should have been inbuilt. Pls let me know.
Thanks,
Abhi
when in a short sell side, stop loss for cover orders are not updating correctly at ”zerodha.com/margin-calculator/BracketCover/. they show the stop loss for buy side only
How does one open a monthly chart or a quarterly on Pi?
You can open daily charts. We don’t have weekly/monthly/quarterly.
sir
if u dont have this capability, then please update pi with this this capabilty because it is required for long term decision-making.
Please add weekly and monthly charts capabilty as priority for the next release of pi.
The moving averages are difficult to see on the charts. Is there a way one can increase the thickness of the moving averages so that they become more visible? At the moment, one needs to strain one’s eyes to look at the averages. Thanks and regards.
Currently not possible.
Hi,
Are you guys planning to include Pivot Point Moving Average in PI in near future???
Regards
Afshin
We are working on adding a bunch of indicators, this is not included though. I am adding it to our list.
Hello,
Is it possible to see a continuous futures chart of Nifty. Not for a particular contract. For example if I wanted to see the chart of the near future of nifty for the last 3 years. Do we have that? If not do you plan on something like that?
I have used both Kite and Pi for Trading. Really liked it. Keep up the good work. I am using Spider Iris Plus for my charting and have found most everything I need in Pi. I would like to make one suggestion (just one 🙂 ).
Suppose we decide to draw a trend line on any chart we should have a button to take the point of the cursor to the high or low of that candle ( press H to take pencil to the high of that candle ) stuff like that help a lot.
Keep up the good work. Take care and God Bless.
On our list of things to provide continuous futures chart. Will take some time though.
Hi,
I was using Pi and it was working fine till 6:15 pm. later i got the ”Unable to fetch historical chart data for SBIN-EQ, only live data will be there” error popup. I’ve tried with various equities and commodities but its still the same. I’ve also tried installing pi in a different system, but its still the same. Kindly provide me a solution as soon as possible.
Thanks.
Can you logout and log back in. Working fine here. If not, can you send an email to [email protected]
Thanks for the reply Nithin. I tried logging out and log back in yesterday night, but still was the same. Now when i logged back in this morning its working fine. Thanks for the response anyway.
”Unable to fetch historical chart data for SBIN-EQ, only live data will be there” error is popping every time I try to get the chart of any security type. can you help with this….
How can I extend the charts in the second monitor ? That is I have connected 2 monitors to my PC and now to have the charts to be shown in the second monitor – how to do that ?
You can popout the chart and move the popped out charts to another screen. Check this post.
When can we expect fixed volume candles?
Hi
I opened the Zerodha account only 2 weeks back(Rk2688), love your brokerage and was willing to make any concession on PI or customer support. But both are excellent.
1. I just want to know whether it possible to plot two charts in single window like nifty and nifty future in same window.
2. If i have short position, I put a stop loss and a buy order, is it possible to automatically cancel the other order if one order is executed.
Really like the pi and zerodha charts. Thank you
Dr Kurian Joseph
1. Currently no, but on our list.
2. Ah no. If this is for intraday trading, you can use bracket orders. Check this post.
Hi,
How can I open back dated chart of any particular date? What to do if I want to open SBI-EQ chart of 16th Feb. 2016.
Thanks,
You can’t open chart for a particular day. You can open chart from 16th Feb 2016 and move to the beginning of the chart (use shortcut key Home)
It shows options upto 90 days. How to go day specific or beyond 90 days.
Daily charts are available for 10 years. Intraday chart is available for upto 120 days only.
Hi,
Charting capability is available on both Pi and kite. I new to both Pi and kite . Out of these two which is better and latest. ( Out of the three ZT ,Pi and Kite as I am totally confused) . Which has the backtesting facility.Is there any tutorial available on these. Thanks in advance
Backtesting is available on Pi. Here’s a video which tells you how it’s done: https://www.youtube.com/watch?v=3CL6XLAGmSk
Hi Nithin – Sorry to reach out to you in *crib* mode… Hopefully these are taken as feedback for improvements.
I started out using Z5 which as you would agree does not have the most pleasant UX :-). Strangely I can only use CO but no BO is Z5.
Then I moved on to Kite which has amazing UX but would not allow both CO and BO. It gives me amazing visualizations and chart studies but BO is not enabled.
So I moved to PI. First of all, it does not have a MAC version which is a big big let down. I had to use a virtual windows set up and strangely PI does not have Ichimoku study. Also I am allowed only to login to either PI or Kite and not both at the same time.
So if someone like me who wants to trade BO with Ichimoku on a MAC, it is impossible to trade. Also I cannot refer Ichimoku charts on Kite while I do my actual BO on PI because of the single login. I really don’t know how to solve this mystery!!!
I strongly suggest that be it any platform, the offerings and features MUST be unique so that users do not get into this tangle of varied options based on the platforms. Be it BETA or the actual product, experiences can be different, but not the features!
BO/CO should get enabled on Kite early next week hopefully. This should resolve your concern.
Allowing login to only one session is an Exchange requirement.
Meanwhile we’re working on offering the same facilities across all trading platforms we’re providing.
Thanks Venu. Kite is a great platform since its OS/device neutral. I use Kite on Chrome and it would be a welcome change to see BO/CO and other great features on PI on Kite. Then I need not worry about taking my laptop everywhere and can trade on any device. Looking forward to this!!!!
sir I am new with Zerodha and I am very happy. Sir all tech tools are very good. thanks to you and your team.
sir I am requesting you to please add ichimoku,hull ma and camarilla pivots in main chart of PI.
sir,
Can we scan the market for say 1) most active fno , nse, bse , option/ future script and there after store that in other window ? (Like we can do in odine )
Ah no, not possible.
At present maximum 12 charts at a time can be opened in Pi. In future are you going to add more than these 12 which can be opened at a time? It will be really beneficial if you add more because for a pattern based trader, more charts are required to scan and find trading opportunities.
is there any way to convert daily chart into hourly chart.? so we can get all suport line from daily to lower frame.
On the current version you can’t change from daily to hourly. You can change within hours/minute/day interval. The next version should allow you to change across any interval.
Sir,
Like Odin terminal, we don’t have Option Greeks in Pi.
Also, we can export price data to Excel file from charts in Pi but can we export Scripts in Watchlist and its price related data (current day and prices) to Excel file (like Odin) ?
Currently you can export only price data from charts. The other bits might start soon.
Sir,
Can we expect Live IV data in future Pi updates?
Do we have ”Implied Volatility” data or indicator in Pi (Live data for different scripts) ?
Not yet.
For option trading, it is most important for retail traders to see live intraday implied volatility of nifty and banknifty, along with OI. This is key to success or failure. No software provides that and there is a huge demand for this. People are paying hundreds and lacs to get this data. Please please please get this on charts. Just two indicators we need, IV and OI. Thats it
sir ’
what is the maximum limit for charts we put on pi
plz give me answer
What limit are you speaking about? Could you please be more clearer?
Hello,
When i use either a renko, Kagi or a line chart in conjunction with any indicator, why is it that the indicators isn’t smooth (distorted) like the way it is when using them with Candle or Heikin Ashi?
I do not face a similar issue while on kite. Do i need to change the settings on Pi ?
Thanks,
Raju Emmanuel
On Pi, a small bug around other chart types. we will have it fixed.
Dear Mr Kamath
Smoothness issue of the indicators in Renko bricks chart has still not been fixed. You commented on 20th february 2016 that you would be looking into this. This practically renders renko feature useless in Pi. Kindly bring it to the levels of Renko available in KITE.
If one wants to change the box size , same can not be done by clicking the renko tab in candle pull down. You have to call any other candle first and then call renko again when the dialogue box for keying in the box size would be available.
Please arrange to fix these issues at the earliest. These are very small technical issues and do not require much man hours of the technical team to fix.
Regards
How to insert additional Fibonacci levels like 78.6, 127.20, 161.80 and 261.80 in Zerodha Pi chart?
For now you won’t be able to enter additional levels.
Cant able to view the chart with 60 month old data with daily periodicity, only 12 month chart is showing. This is problem is occurring on every scrip.
Currently only around 200 stocks have EOD data for 5 years. We are adding more to this list.
Thanks for your response. Yes, you are right. I can see 5 year EOD data for few scrips, but not for all scrip. Hope you would add more EOD data for others scrip.
Kindly also add EOW data.
can I use Pi on my office PC which is running behind proxy server.
Pi won’t work, you can use our web based platform Kite, it has a very sleek charting platform. http://zerodha.com/z-connect/tradezerodha/kite/kite-introduction
Please help me pi chart is not working properly see screenshot
Sorry to bring up this issue again of changing candles on the chart. I understand that in 1 sec lot of ticks are received and that will cause some variation. But i have a different observation – This is for Nifty Spot. Nifty Spot’s opening price is decided 7 mins before the opening of the trade. Today’s (27-Jan) opening price was 7,469.60 but pi chart is showing it as 7474.40, where as Market Watch in PI is showing as 7469.60 (which is correct). Only while creating the charts, looks like there is a issue. This cant be attributed to slow internet connection.
Rajiv, all charts during the trading day get plotted based on ticks that we receive, including the open for the day. We sync all chart data with exchange declared O H L C for the day by end of day (after commodity market closing). So if you see it after midnight, you will see the open as 7469.6.
Hi,
How to draw horizontal lines on chart at a particular price level. If I right click and place a horizontal line it dosent come on exact price I want. It varies even if I zoom the chart.
For e.g. if I want to draw horizontal lines on Banknifty chart at 15180 and 15080 exact. Please do let me know how to do it.
Can you please add Volume moving average (VMA) on Kite?
Thanks
Soumya, you can add indicator on an indicator yourself. Check this image: http://zerodha.com/z-connect/wp-content/uploads/2015/03/chart4.jpg, choose moving average and in source choose volume. It will add moving average on volume.
Great ..
I did not know this .Thanks a ton for explaining this to me. I did check it out and it works.
a)Would you be providing a lock / unlock for the lines so that they dont change position when you scroll the chart forward backwards.
b)The other drawings like rectangle and ellips dont save . I hope sometime down the line you would do that too.
a) We’ll pass on the feedback to our developers
b) All drawings are saved. I drew a rectangle/ellipse and it seemed to save just fine.
Currently we can save a indicators as a template on Pi.
My question is : will it it possible by this quarter to save horizontal / vertical / drawings lines on a chart in Pi as template to be reloaded for a particular script.
Are you working towards it .
You can save drawings *for a particular script* by right clicking on the chart and choosing the ”Save to Disk” option instead of ”Save as template”. Click on the File Menu and choose option ”Load chart from Disk” to view drawings.
Nitin
I agree with Rajiv’s comment on Instability in Pi after the small upgrade .
In the glee for getting more attention and more customers you have taken Pi backwards and not forward . I assume there is a bandwith and server space crunch at you end. It is no use blaming customers for low bandwidth . I think the upgrade needs to be done at your end.
Whenever i wish to place a order the system chokes. I have made more losses on Pi than on any other platform this last week.On 2 meg and high end Laptop if the system chokes for Pi and no other Platform .
This means you have to get hands on Pi.
I know you would not clear my comment for moderation .If you do so it would signal your sincerity and commitment to change things for good. Either you are not prepared for expanding the system or your Tech team needs to be changed . The system cannot be half baked.
Something is seriously wrong at Pi and this is needs Immediate attention .
Hey Chandru, like I just mentioned, what happened today on Pi was only historical data, live charts were working fine. I am getting someone to call you to check what issue you are placing with order placing, we haven’t received any complaints.
The thing about running behind the idea of constantly doing something new, is that there is constant risk you have to take. We allow clients to pull unlimited amounts of data, because we do, there are people who constantly try to scrape crazy amounts of data at one time which can cause issues to everyone else. If today we go and stop the option of pulling unlimited amounts of data and just give 20 days of intraday that everyone does (even data vendors don’t give intraday data for more than 3 months), this will never happen again.
But yeah, we won’t. There is nothing half baked, we test everything out, but in the quest of constantly trying to offer something new we do take some chances of being wrong.
Lot of instability in PI this week. Today the ”charting server” is down, day before yesterday Orders were not going through – ”Adapter was down”.
Need to have a stable platform for trading.
Historical data was down for a while live charts were working fine, it was because of some people trying to scrape lots of data. Hopefully shouldn’t repeat.
pivot , R1 ,R2 , S1 , S2 NOT FOUND ON PI CHART IN COMMODITY SCRIPT
Yes, will come soon.
I can’t seem to get more than 3-6 months data on charts in pi.
Please clarify.
Thanks in advance
Which contracts are u searching for?
Nifty futures, usd/inr future, ashok leyland future, sbi future, gold future and many more.
Hello
Has the ichimoku indicator been incorporated in Pi. I am actually waiting for ichimoku in Pi to get started with trading wid zerodha.
Thanks
Jatinder not on Pi, but on Kite: http://zerodha.com/z-connect/tradezerodha/kite/kite-introduction. Many other indicators like Supertrend, etc.
SuperTrend in Kite is good but when we can see SuperTrend in Pi…
New indicators on Pi might take a little longer.
How much time adding “Nifty SmallCap Index”, “NIFTY100 LIQ 15 Index”, “NIFTY50 VALUE 20 Index”,“NIFTY GROWSECT 15 Index” in Market Watch in Indices ?
Please Reply and fix it very soon
This will take more time. Will announce once it is up.
Hi Nithin sir.
Please see the link below & try to incorporate such features in ”PI” & ”Kite”
https://vimeo.com/149023208
Regards,
Sandip
A lot of the features are already there on Kite. We’ll do our best to give you a world class trading experience.
Hi Nithin,
Can I get 30 min. chart on Pi with 1st candle close at 9.30 AM.
Regards
Haridas.
No Haridas, not possible for now.
Hi Nithin, thank you for providing all the state of the art facilities to the clients and it is something that I personally never thought anybody would do at no cost. But you do and that makes a lot of difference. I use Pi and like it very much. I kindly request whether it is possible for you to make Line Chart available to all Pi users and it would be a great help to people like me if this request is considered. Thank you once again and have a great weekend ahead.
Yep on our list of things. You can try Kite for now if you want to use line charts https://kite.zerodha.com/
There is an issue of the candles changing in appearance when Pi is loaded after the market closes. So in real time (esp during the first hour 9:15 AM – 11 AM), today we had a red inverted hammer on 10:50 AM in TATASTEEL – 5min , this same candle have become green when i opened the chart after the market have closed. Due to this a loss was incurred as a short was established on the premise of the red inverted hammer candle. This changing of candles have been happening for a long time and its still plaguing Pi even now, with the updated 11/11/2015 version. I would really like Zerodha to look deeply into this matter and solve it ASAP. This happens on random on random candles but mostly during first hour. And this happens very often if a chart is kept opened before the market starts and as the market opens and trades we have a candle that looks a certain way. This same chart if reopened during market hours or after the market closes, some candles would have changed in its appearance.
Also when will i be able to finally load a saved chart properly without the trend lines, or the horizontal lines vanishing on zooming in.
Manish, during the market hours the candles are formed using the ticks that is received by Pi on your machine. It is possible that during the trading day there were internet drops or Pi could not have been able to accept all the ticks sent by our server. When you close a chart and open it again, the historical data that you receive is from our server which doesn’t miss any data. Hence the difference between the charts. Loading chart along with drawing tools might take longer on Pi. Have you tried the charting platform on our web tool kite? http://zerodha.com/z-connect/tradezerodha/kite/kite-introduction
Yes i understand that there could be some inconsistencies due to data latency, or some internet issues from the client side. But shouldn’t there be like an auto refresh feature built internally in Pi that will refresh the data (atleast the last 100 candles) in a periodic interval, just to make sure that the data is consistent. Because data consistency should be the #1 priority for any charting platform.
Also i would like to mention that this auto data refresh is needed urgently as because Pi would skip redrawing the entire data between a period in which the machine was put to sleep. So for example say i’m working from 9:15 to 12 on a chart in Pi. And after 3 hours i’m quite fatigued and decide to take a break of an hour. So i put the whole machine to sleep as it is with Pi running, but locked. Now after an hour or so, around 1 clock i return and wake the machine from sleep, open the locked Pi. To my dismay, i’m seeing that Pi has not updated the data between 12 and 1 !!! I’m missing the whole data between 12 and 1. The last candle starts from 1 and the second last candle is from 12 right when i left the machine. I hope i can convey the issue clearly.
Also if the loading of saved chart feature worked properly , then this won’t be an issue. But that feature also suffers from another bug. As upon loading a saved chart all the trendlines, horizontal lines vanishes, or get cuts off, or is shifted. And i have to redraw them again. Now imagine doing this twice ( first during 9 o clock then again around mid-trading day) everyday for atleast 10 charts. I know, its very and utterly frustrating. But again i even can live with this issue, but data inconsistency, is something thats quite fatal , don’t you think.
I’ve made numerous complains to [email protected] ( the latest one has a video to convey the issue properly), and they said that the Developers are working on fixing this.
I really hope that they do fix this issue and make the drawing tools in Pi atleast respectable. I really like Pi. It has instant data execution, its fast, clean and gets the work done, and is the best platform in India, but these issues are just ruining the whole experience, you know.
And about Kite, i really love that platform. But i seldom travel while trading , and mainly work at the desk. So i prefer a desktop platform like Pi.
Again i really hope that Pi is free from this issues as soon as possible.
Regards.
Manish, auto refresh is not practical, and every person will want a refresh based on a particular time of his choice. None of the trading platforms or even most of the international charting platforms don’t give this option. Yes, drawing tools not getting saved is an issue and we are working on that. In today’s day and age, the performance of web platform is in par with desktop. So Kite in terms of speed and etc will work as good if not better than Pi. Until the drawing tool issue is fixed, best if you use Kite.
Hmm i understand your point. But then again fixing the saving issue on Pi will completely fix this. Yes Kite has a perfect array of drawing and annotation tool. The thing is that i prefer working on Pi. Can’t explain why maybe just a personal taste. I feel more focused when working on a dedicated desktop trading platform.
Anyways , i appreciate your help, and understand your point about auto refresh. Hope to see Pi getting overhauled in terms of them drawing tools in the upcoming versions.
Thanks
Hello Nitin,
I understand that auto refresh may not be possible; but can we have a manual refresh option; atleast we need not close the chart and open again.
The manual refresh button is on our list of things to do. Let me speak to the team on where we are at on that.
I am not able to export chart in excel. Gives me an error.”Unhandled eception has occured in your application. …etc.”
I have the latest version of PI.
Send such queries directly to [email protected] with ur client ID
How get track line in pi chart terminal. is it possible?
You have to insert line in any of the technical indicators zone, then it will extend to candle stick zone. Else it will only stay in candle stick zone.
In Pi charts, is it possible to start the SMA trend line (or any other trend lines with different time periods) from starting of the market opening candle stick for any time periods, for example SMA(CLOSE, 50) should start showing the trend line from the first candle stick onwards like the one provided in Google finance(attached screen shot). In Zerodha Pi chart, SMA(CLOSE, 50) trend line is starting only after 50 candle stick but in Google finance it is starting from the 1st candle stick onwards. I am using SMA(CLOSE, 50) in 2 minute chart for intraday. I think they are using the historical data to achieve this which is what I need, I want to see the trend line from the starting of the market opening & don’t have to wait till the number of candle sticks get formed to initiate a trade. I understand that if i take 2 days chart then I can see the trend line starting from the market opening for intraday but I need it in intraday chart itself . Please help to look into this & correct me if I am wrong.
Yeah, on Pi the SMA/any other indicators is calculated on the client side. So the only way right now would be if you have atleast 2 day intraday chart open and scroll the chart to extreme right.
when will co/bo orders available in pi charts like msi and normal
Hello Nitin,
Can you please tell me when can we get open interest charts in the kites. It will be of great help.
Is there any possibility to get volume profile soon, in PI…
We’re working on it. Should take some time though. We’ll let you know once its there.
HOW MUCH MORE TIME IS IT GONNA TAKE .STILL CANT FIND THE INDICATOR IN ZERODHA PI OR KITE
are there no monthly and weekly charts available on pi for technical analysis
No, not yet.
Can you please tell me How can I select intraday option in Stock (NSE or BSE). When I select NSE or BSE only option I get is Normal which I believe is not the intraday option. ..Thankyou
You need to use MIS for intraday equity, CNC for delivery equity.
Hello,
I had a query. When I open a chart, all I see is the selling price on the price indicator. How do I choose the option to show the buy price as well? This will be nice to have as I’ll get an idea on the spread visually as I am a new user and have done a lot of intraday trading with Trading 212 while I was in London. They had an option to show both the bid/ask rate on the price indicator on the chart. Do you have this as well?
As you can see in the image to the right hand side, all I see is the selling price.
Kind regards,
Sitara Singh.
Ah, what you see on the right is the last traded price. Let me speak to our tech team, if we can incorporate bid/ask.
Hi Nithin,
Congratz on your successful progress on Zerodha…..
Please add Range charts on Pi and make Range chart editable in KITE.
Dear kamath sir
pi is offcourse a marvelous software , chart is awesome but relevent data is missed like
data table of different time frame as we get in zerodha nestplus charts { cntrl ’D’ } data table.
As we move Cross Hair or cursor show all data of Chart, Volume, Indicators at one place or on top of
the chart , this helps a lot in viewing the direction of market , if all places put together at one place.
Link to Excel or Chart data link to Excel is missed
Chart Templete , provide option as default templete for pi charts ,to avoid every time to apply templete.
Relative Strength Indicator with Moving Average is missed.
Cannot move lines on the charts quickly & cannot delete drawn lines
when we draw fibonacci arcs or fans, it doesn’t show the percentages. I have attached an image…. i wanted some thing like this. Is it possible with PI
Adding it to our list of things to do.
Hi Nitin,
Do we have camarilla pivot point in Pi.
No
How to Pop-out Pi chart to a seperate window? Could not see any menu option to do that. Please help.
Click on any window on pi, then click on view, and click on popout active window.
Hi nithin,
Now a days , auto robot trader plugins are available for MT4 and amibroker for placing buy and sell order without being present at system, please provide similar kind of feauture to PI
We have it ready, but issues with exchange regulation. MT4 doesn’t have to answer our exchanges, but we have to. 🙂
How to get the intraday chart of Nifty Spot.
The blogpost above explains it, look right at the end of the post above.
Looking forward for Pi development like net station of netdania.com
There is frequent hanging problem in pi.
Request to resolve .
If you are loading large amounts of chart data, and your system is not powerful enough, it can happen. Can you try charts with 1 to 5 days.
Hi
How can i export the tick by tick data to excel or csv from pi.
You can’t export live data to excel directly from marketwatch. You can take out historical data – Open a chart, and under file menu there is an option export chart to excel, click on that.
Sir all option derivatives values showing as 0.8,0.6…… like this in Pi why?
Sunil, we had sent SMS/email yesterday. Right click on Pi icon, open file location, delete nse_fo_contract.bin and Relogin
Thanks you sir
can we get sound (desired sound not just beep) alert if any technical indicator gives signal..
Why is my comment of 12 july showing after my todays long comment
Thank you ZERODHA for pi and many more things. And just now I updated pi with addition of many important features. THANKS A LOT!!!
Although pi is a great software and by applying the following updates it can become greatest for me.
(I am sure you are already working on it but to emphasize my need for them, I am giving you a list of more desired pi terminal features)
I am putting importance of the points by denoting with A, B, C, and optional where A is the most import and very much desired and Optional is not important at all.lk;adulkj
1. Default currency should be USDINR. (A)
2. Commodity charts should have hourly and daily charts etc. (A)
3. Default indicators should always be automatically present in any chart opened. (A)
4. There should at least be 5 watchlists allowed. One watchlist although does the job but wastes a lot of time when other scrip charts are needed.(B)
5. During login there should be option for quick login without downloading scrips. (A)
6. Single chart should be able to interchange between daily, hourly or minute chart bars/Candles by RIGHT CLICKING ON THE CHART. (A)
7. The chart should have options for bars of 5 minutes, 10 minutes, 30 minutes, 4 hours, weekly and monthly apart from daily, hourly and minutely charts. (I saw in the new update just now that you have already included options for different minutes–big THANKS for that and now work on weekly and monthly charts please
and I am sure that you are already working on this) (A)
8. Chart loading time are sometimes too long. Chart should load seamlessly. (A)
9. There should be a built in TV screen in the pi software (Is that too much to ask for? I think it is too much and don’t mind this suggestion) Very optional feature
10. There should be list of companies that are announcing results etc. today or tomorrow. (Optional not improtant feature)
11. The sensex and nifty tape should be customizable to show sensex/nifty or anything a trader desires to have on top of screen all the time. (C)
12. In many charts I don’t know why the beginning bars of MacD Histogram indicator bars are too long only in the beginning of the histogram.when we zoom out any timeframe chart. (See attached Chart) (B)
13. The space provided for indicators is too small vertically. I always have to drag the upper boundary to make it more visible. Thank you ZERODHA for pi and many more things. And just now I updated pi with addition of many important features. THANKS A LOT!!!
I hope you will take my list constructively and work on the features listed above and make pi a wonder for me.
THANK YOU AGAIN FOR THE GREAT WORK.
I have updated but i dont find any option to see the support, resistance levels.
Arun,
Right click anywhere on the opened chart and select ”Day Separator”. You will be able to see S/R levels.
Happy trading.
Will Check Sunil, Thanks.
Yooo…. its working. Thank very much, Sunil.
Happy Trading.
Hello Nithin,
Got the latest update of Pi installed. Finally Support/Resistance is visible. Thank you so much. Now I can start using Pi instead of ZT…. 🙂
Just one request…In the next update, try to give option to have multiple Market Watch….I saw the workaround to save and load different Workspaces. But better would be to have multiple Market Watch.
Thanks.
Hi,
Changes made in settings like chart colors, grid color ,3d, x y grid, data box applies only to the selected chart but not to every opened charts so its time consuming to apply it to all the charts. Please make these settings global like ’view quick order’ .
Thanks
Hello Nithin,
Still waiting for the Support/Resistance levels to show up in Pi. When is it gonna happen?? As I had told earlier, it’s the only basic thing missing in Pi because of which I’m still using ZT and not Pi.
Dear Nithin,
Adding Time Frame on the same chart will be more user friendly / a option of Default Time frame if chart gets open in new window.
Hi Nithin sir,
For last 2 month or so I am unable to get charts on PI.
ERRORS ARE :-
1) ”Unable to connect to data server .Should be soon.”
2) ” Unable to fetch historical chart data for NIFTY15JULFUT ,only live data will be
there.
I have been in touch with your tech support for last 15 days but they were also unable to resolve this error.They told me to do all shorts of thing for this whole period. To name some of them:-
1) Download latest Pi from Q.
2) Download latest Patch.
3) Deactivate your antivirus.
4) Change your operating system from WINDOWS XP to WINDOWS 7.
e.t.c……..
I did all as they said but of no use . And I don’t know what they are going to tell me to do next.
Hope at least you could solve my problem.
Thank you
DD0864
Is VWAP indicator in available in Pi? How to add it?
Not available Sunil
Dear Team,
In graph of Nifty(spot) period of preopen market(09.00 to 09.15) is also coming. How to remove that period from graph.
Thanks & Regds,
JS
JS, if you are logged in and looking at the chart the premarket points show up. Close the chart and open it again, you will not see any pre-market points on the chart.
Thanks Sir, Its working now.
JS
Hi Nithin,
Is there a TRIN (Arms index) indicator in Pi?? I searched but couldn’t find it. Could you please make it available in Pi if it isn’t already there?
Thank you
I too am looking for that
No reply😭😭
pi chart not working – 14/07/2015
Hello Nithin ,
It’s the end of the weekend. But the latest patch to show Support and Resistance is not available yet. How much more we have to wait for it? I guess the patch is already available as I saw the Support & Resistances on your charts during the live webinar. Waiting eagerly for its release. Also the bug is not fixed yet which is preventing the indicators to be dragged where we want. You yourself experienced issues with it during the webinar. Waiting for the update.
Thanx
The indicator dragging issue is sorted, can you go to help and click on check for updates. The latest update has that sorted. S&R, few more days.
It’s already there. ENJOY it in the new patch. Go to help and make sure you have version .0.6 or above and then click on update section of the help menu.
Technical Analysis Tab is not enabled in my charts. The chart type is activated but the Technical Analysis tab is inactive. I am unable to add any indicator to the chart. I am even unable to see any indicator name.
It’s my first time trying to use the indicators. May be I have to install indicators. If so please let me know how to do that?
It’s fine now
HOW TO LOAD STOCHOSTIC LINES IN GRAPH
PLEASE EXPLAIN……
Check this video Abhi: https://www.youtube.com/watch?v=Hg5iZzvBV1A
i am using PI version 1.0.0.0….however on right clicking the chart i am not able to see the crosshair option for mouse pointer…how is this so? pl help
Make sure you’re using the latest version. To check go to –> Help –> About Pi, the date should show (07/02/2015). If its showing an older date, download and install the latest patch from here: https://drive.google.com/uc?export=download&id=0B9bX9-dSIC9AQXdfUGhlTS1mM2c
Then right click on the chart and the crosshair option should show
Nitinji,
Its working now. Thanks.
Arun
Thanks Nitinji,
Today again i updated Pi with Patch dated 06/July/2015, after the update i am unable to open intraday charts for commodities.
The Error is : Unable to connect to data server. Should be soon.
The equities intraday charts are working fine.
Please help.
Thanks
Arun
Mr. Nitin Kamath,
I watched youtube video for pi features, and its really very good software that any
broker is providing.
Many congratulations !!
Sir , please may I know the list of technical indicators, provided in pi software ,by Email.
Thanks & regards !!
Mahadev b T
9702087406
[email protected]
Pi has over 80 indicators and we keep adding newer indicators on the basis of requests that we receive from our clients. Here’s a screenshot of the list of indicators available for now
Used Pi Charts for trial and got these shortcomings that needs to be resolved for chart traders/ analyst:-
1. Invoking Crosshair should be from user settings and once invoked, must be available all time in all charts. Further, cross hair should be available all time with mouse hover (not on pressing left click) and x-y values needs to be displayed on right/ lower side panels on mouse panels.
2. When user applies some strategy i.e double ema crossover or any method on chart, it must always be applied on all charts by default instead of invoking a separate chart and applying the template again and again on every chart opening.
3. Time frame change i.e 5 min, 15 min, 30 min, 1 hr, or daily should be made available on right click instead of opening a separate chart for different time frame.
4. Chart maximize/ minimize option should be on double click of Chart tab in multiple chart environment.
5. When chart is zoomed in/ out, time drag of chart should be by slider also instead of only scroll bars which is very slow.
6. Study drawings should be available in all time frames of a any individual scrip.
Many more later. But these are frequently used tools and serves better option in charting tools. Ur good work is however appreciated in all ways.
Regards
Still awaiting some +ve response
I have downloaded and updated Pi with new patch still i don’t see the crosshair.
Thanks
Arun
Right click on the chart, u should see crosshair option. Check this webinar we had today: https://www.youtube.com/watch?v=Hg5iZzvBV1A
latest patch updated Today wear is Support/resistance Nithin?
Nithin Kamath 25 Jun 2015 at 04:26 PM
New release very soon, and yes we should have the support and resistance tool in the next update.
Last min issues with support and resistances, we should be live with it by next weekend.
hi sir
can u guide me my investmet 15000rs which trade is best squareoff or delivery..now i trade squareoff
one day profit one day loss..then i first using in pi is hanging in my system afterwords i use now…that one is same..plz tell me zerodha provided in any tips for squareoff..
If Pi and Now is hanging, my guess is that your internet speed must be less. Try to get atleast 1mbps broadband connection. We don’t provide tips as a business.
Dear Sir,
Currently, I am using Zerodha mobile app. which is worse application of Android.
When are you launching new mobile app or improved version of current app.?
Hi,
Pi looks good. But there are some fundamental things missing.
1.Support/Resistance and Pivot levels
2.Crosshairs
These two are the only things missing in Pi because of which me n my wife are still using ZT and have not shifted to Pi.
Please include this asap so that we can start using Pi.
Thanx and keep up the good work you are doing. You truly have revolutionaised trading in India….. 🙂
Sunil, we have the latest patch updated on Q, it has crosshairs. Support/resistance/pivot will be given by next weekend. 🙂
Yep, http://kite.trade/ on its way.
Hi there…I have been using Pi for some time now and I am really happy with the software. But I would like to ask you whether you are going to add the ADX, Percentage Price Oscillator, Trix and some more indicators or not??? These indicators would really help while trading.
Bipin, we are currently working on more fundamental things, we will soon start adding adding new indicators.
Hi,
I read about the weekly chart question asked by someone above and you said not right now. Could you please tell whether Zerodha will launch weekly charts for both Nifty and MCX? If yes then a tentative time frame?
Rohit, yes on our list of things, but this is still two releases away from being implementation.
Hi Nitin,
when new update for Pi is coming….??? Also please insert a feature of showing support and resistance by default it will be every help for all of us…. ; )
Regards
Abhinav Thakur
New release very soon, and yes we should have the support and resistance tool in the next update.
Hi Nithin,
I have recently joined zerodha and have been using pi. I think it is an excellent platform to trade. However I have a few suggestions currently which think would help make it better.
1. Why not have crosshairs so that we can easily see OHLC of the candles.
2.While drawing horizontal line if I want it at certain price why don’t you give me an option to enter the price at which I want the line to be at.
3. And again regarding the horizontal line, it is changing from the price I drew it at if I am zooming in or out.
Uttam, we have a new release of Pi coming up, should have all the fixes.
Sir,
How to increase the thickness of Candle/Bar while using BAR CHART?
Regards,
J.R.Julius
Not presently possible Julius
Hi Nithin sir , im using pi for past 1 month , very comfortable and useful to me , coding/ trade script is little bit tough to me as im new , but think will learn how to code in coming days , one request is it possible to add hurst band in charts ? thanks .
Shiva, we have received requests for over 100 indicators (in addition to 80 already on pi). We will add, but slowly.
NIthin sir , yes i am able to see lot of requests not only of indicators also others , but i request to give hurst band and vwap (already asked at the time when joined ) priority as you know these have most sucessfull trades (i think ), thanks in advance ji.
Have been using Pi since few days. Request you to do 2 things :
1. Show Support/Resistance levels as is visible on the charts in ZT.
2.Cross-hairs to be made available as in ZT so that all values in the vertical line are visible at a go. Will save time.
Hi! Nithin…
first of all many congratulations for giving an excellent charting platform to Indian traders.
I have few queries:
1) Maximum how many charts can be opened simultaneously of different scrips.
2) I use Mt4 for technical analysis and I have few customised indicators, can your team help me to put those indicators on pi charting platform.
Thanks & Regards,
Amit
8285162752
1. 12 charts at a time.
2. We can do this in the future for you.
Hi,
Please let us know how to ensure that the chart when opened will by default have all the studies which I included before?
Some other products by default allows us to assign the chart template in preference which will be applied the moment the new chart is opened.
Thanks
Harish
Harish, once you have added all your indicators, save the chart as a template. The next time you open any chart, you can load this template.
Please provide last 10 years history chart in pi
Has Ichimoku Cloud been implemented in Zerodha Pi?
Not yet as an indicator. But there is an expert advisor to generate buy/sell signal based on Ichimoku, check this post.
Hello sir, In Pie Chart is there any way to draw horizontal lines for support and resistance, with different colours and on exact price which i want to mention … Thanks
Different colors not possible as of no. You can add the horizontal line anywhere and drag it to your exact point.
Hi Nitin,
I’m able to draw horizontal and vertical lines but I’m not able to drag it. (V1.0.0.6)
Please can the candle interval be changed to 9-9:30, 9:30-10, 10-10:30 and so on on the 30 minute charts?
likewise 9-10, 10-11 and so on for the 60 minute charts,
Pi chart 1 hour candle time 9.15-10.15 -11.15 -…..-3.15.. there isue is last 1 hour candle only 15 minute (3.15-3.30) became.
Please fix it very soon…
Vipul, if we make it 9 to 9.30, the first 30 min candle will have only 15 min. The issue is the same. If the first candle doesn’t capture the entire 30 mins, the data for the entire day might be skewed for people trading intraday. That is why start candles at 9.15
I am taking about 1Hour Candle, 1 hour positional method is not good is this candle timing.
Please fix it….
Vipul, even in 1 hour candle, if you make it from 9am onwards, there will be 15 mins of missing data. All the candles for the rest of the day will be affected by this first candle which will not have entire 1 hour of data. By starting at 9.15, the last candle of the day will be the only one with not 60 mins of data.
This is the best way to show.
Sir,
DAY selection is not appearing in scanner. kindly add it. 8 hours considering for day is not working.
Dear sir
i can’t find your companies name in SEBI’s registered Depositary Participants list from following website. But you are offering Demat Account services. would you help me?
http://www.sebi.gov.in/sebiweb/home/HomeAction.do?doListDept=yes&deptId=9
Direct PDF Links
NSDL – http://www.sebi.gov.in/cms/sebi_data/attachdocs/1430907261207.pdf
CDSL – http://www.sebi.gov.in/cms/sebi_data/attachdocs/1430907123238.pdf
Varun we currently have a tie up with ILFS for demat accounts (they are the biggest dp in India). Trading accounts are opened at Zerodha, DP with them, but for you it is a 3 in one account, completely seamless.
Thanks for your reply for my query. For opening an account in your firm you asking 6 month bank account statement and a original cancelled check book leaf and others. my question is those are mandatory or optional and if mandatory is there any restriction for monthly average balance in my bank account or anything else ?
The 6 month statement is for income proof. You can give other proofs like ITR, Form 16 or something else if you wish. An income proof is mandatory for trading futures and options. Cancelled cheque is a proof of bank account, and yes mandatory. No restriction in terms of monthly average balance.
Ok but I’m looking for just intraday equity share Trade. Does I have to summit income proof?
If you are planning to do only equity trade, no income proof is required.
thanks for all your replies man. I’ll contact you asap to open new account. I’ve to decide which share and right time to invest. thanks once again
Does Zerodha Pi have these indicators — Hull Moving Average (Hull MA) and Fractal arrows?
No we don’t Renee
I am using Pi . But till now i am not aware of the application of the terminal that how can I get auto BUY/ Sell signal and where please help me ? what to do for this ?
Check this post on how you can use expert advisors for this.
Putting a request to include the following two indicators in Zerodha Pi:
1. Klinger Oscillator
2. Keltner Channel (default option to overlay indicator on candlesticks instead of being drawn on a separate panel)
Thank you.
Sir,
I am using PI trading platform.
Its great & Thanks for providing wonderful trading platform, esp trading directly from chart
and Quick limit order.
I am really enjoying the trading with ”Pi”. Thanks.
Mr request is while selecting Sell here or buy here, we could adjust the quantity where as modification of price befor placing order may also be provided.
i.e, price field also may be made as editable for adjustments
Thanks,
R.Ananda Ganesan
DL0007
Ananda, if we allow price change there,it will be kind of defeating the purpose of trading from the chart. But let me speak to the guys.
Nitin
Thanks for the replay
Again I request you
Mr request is while selecting Sell here or buy here, we could adjust the quantity where as modification of price befor placing order may also be provided.
i.e, price field also may be made as editable for adjustments.
This is required due to
1. Price is not picked properly while selecting from the chart
2. If it picks for example 69.10 as top of bolinger band, we may adjust the price to 68.80 as selling price for early trade
3. It would be very useful for quick orders as we can select from anywhere and adjust quantity and price and place order as it does not occupy big space in chart also
( The quick limit order does not be useful for this purpose as it is used to trade at current market price only)
So once again I request you for making the price field editable for convinience of all
Thanks in advance
R.Ananda Ganesan
DL0007
Ananda, the issue here is. Assume the cmp is Rs 100. If you point on the chart to place an order at 100.1, it automatically starts as a buying SL-M with trigger at 100.1. Because a normal buy order will get bought at 100 itself. If we let you change the price now, there will be no way for us to know if the order type has to remain limit or SL-M.
Chart based trading is done the same way on most platforms that offer you this facility around the world.
Nithin,
If CMP 100, I want to place buy order at 97.6, I pick from chart as 99 and I want to adjust it to support price of 97.6
Simmilarly on CMP of 100, I want sell at resistance of 102.6, and chart does not pick rightly, I can adjust the price to 102.6
So I need the price field also editable
Hope I explained properly.
The main problem is chart is not picking the price rightly.
If it is editable field, it will be very useful for quick orders
Any plans of adding range bar charts or tick bar charts i.e. candles that are formed on basis of ticks rather than time.
Also, current Ichimoku EA only gives Kumo cross overs. Can you please incorporate complete ichimoku strategy.
Thirdly, a doubt that if I have an OR condition for buy and first one becomes valid and it gives the signal and after some time if second signal also becomes true will it again give buy signal? Or it needs to give Sell signal before that? eg (CROSSOVER(A,B) or CROSSOVER(C,D))
Have you seen this: https://zerodha.com/expert-advisors/, will get someone to see if complete ichimoku strategy is incorporated or not.
Tick charts or range bars will not be possible for now.
You will get the next signal only after you get a sell. you won’t get two buys in a row.
Yes nithin. I am using the code provided there.
One more issue I have encountered. I think this is true after pi update.
After I learnt a EA cannot give two buys in a row, I am using two ichimoku EA i.e. 1) A and B crossovers 2) C and D crossovers. I open 5 to 7 charts and apply both the EAs , however, pi hangs within minutes.
I have used multiple EA in the previous version with no issues. So am not sure what is causing the issue. Whether the complexity of calculation, my pc, etc.
I have i5 computer with 4 GB ram and ample space.
Getting someone to call you back.
I found out the reason. There was an additional ’)’ that as causing the error. Now, it works fine
Any option of like Selector Line….. so that I can place cursor on any candle and get Open, High, Low and Close of candle at any point of time.
Just I started using PI.
Left click on the chart and hover the mouse over a candle, you can see OHLC.
hiii Nithin,
there should be cross hair in pi on chart to get information about each candle like time, high/low close
Harshal, crosshair will take time, for now left click the mouse on the chart and hover it over the candle to see the OHLC. Explained above in the post.
Hi team zerodha,
I just wanted to inform you that I have installed Pi on my system. I also have an account with IIFL.
When I opened IIFL charts it shows Zerodha Pi!! However, everything else remains same with IIFL but it shows Zerodha Pi and its settings in the charts of IIFL.
Posting a screen shot for your reference.
🙂 That is weird. Not seeing your screenshot, will get someone to call you back.
how i can open weekly or monthly charts
Not available right now.
Would be better if Weekly and Monthly chart supported added to PI .. This will help us to create long term support and resistance level . That way we need not to rely on two software for any analysis.
Retail participation goal will receive a boost if this feature is added on the software.
can the candle interval be changed to 9-9:30, 9:30-10, 10-10:30 and so on on the 30 minute charts? likewise 9-10, 10-11 and so on for the 60 minute charts
No, you can’t define the start of the candle. By default all candles will start at 9.15am when the market opens.
Thanks, I sincerely hope you implement ATR-based Renkos since it affords dynamic flexibility to trending ranges that would otherwise be restricted by fixed box size traditional Renkos. I look forward to seeing this option in Pi.
Pi is the best software till now i have used in all the terminals. I am learning more from these charts.. Thanks Zerodha
Can you please confirm if Pi has the following indicators, or if you intend to add them soon:
1. Connors RSI (different from regular RSI)
2. Least Squares Moving Average
3. ATR Bands
4. ATR Stops
5. Volatility Stop
Having these would be advantageous for both intraday and positional trading. I hope you consider this feedback.
Natraj, for now we have 80+ indicators, but there are probably 1000+ indicators that can be added. 🙂
But yes, adding this on our to do list. Thanks.
Thanks, Nithin.
One more question (and feedback), about Renko charts.
Renko charts use either a fixed (static) but random number like 5, 10, etc. for brick size or ATR (average true range) to determine a dynamic brick size.
The charts on Tradingview.com support both varieties and I’ve personally seen that using 14-period ATR-based Renko charts are hugely more accurate than the fixed-size ones.
So my question is — Does Pi support ATR-based Renko charts where the box size changes based on dynamic ATR values rather than just having a fixed static box size?
Here’s a visual example that shows the difference in accuracy between the two and why ATR Renko boxes are far better and necessary for trend trading.
Pi has the traditional renko chart, not the ATR based. Sending your feedback to our tech team.
Also in Kite, if i am viewing a renko char for Reliance infra(Spot: 587) with plot size(brick) as 0.1, if i change my chart view to JSWSteel(Spot: 1600) , i have to manually disable the renko chart and enable back with a modified brick size.
If possible, can you make this brick size as a percentage value.
Nithin, is it possible to give me a demo account to Pi so I can review the Renko charting options available? I am the blogger at renkotraders.com and I keep getting quite a few requests to look for and review any charting solution for Renko specific to NSE/BSE.
As to the other question about some people here claiming ATR based Renko is better. I beg to differ. ATR renko only helps as a starting point to select a value for the fixed box. With Renko a fixed box is always better because if you kep using ATR and the ATR value changes, all your analysis goes down to the dumps. Thus, a fixed box renko is the best solution.
Ranga, can you share your contact details on [email protected], I will get someone to speak to you and share details. Also, you should check out the charting on Kite as well. https://kite.trade/docs/kite/#charting
Hi Nithin,
Please let me know if there is any update on adding ATR based Reno chart in Kite or Pi.
Thanks,
Binoy
No updates for now.
Hi Nithin,
First of all thank you for providing us Pi a hi-tech platform for trading. In pi you have provided so many features. I want to use candle stick scanner for identifying the stocks in trending. For example I have nifty 50 stocks in my portfolio and in their hourly chart/daily chart which stocks are generating bullish engulfing and bullish piercing pattern at a particular date or time I want to see that. How will I write scripts to get the desired result.
Can you ask all coding related queries on codingqna. We also have a bunch of expert advisors here: https://zerodha.com/expert-advisors/
Hello,
I’m a Zerodha user & I want to try Pi but don’t seem to find the download link.
I assume it’s not released, but at the same time I get SMSs saying ”Have you tried it yet”….so I’m confused.
Check this link Prashanth, explains how to request and download Pi.
Dear Nithin,
I wud like to state that charting data on minute charts is not available for more than 20 days as earlier data was appearing for 3 months cud u get the problem rectified please
Yes we did a server upgrade last week, we had limited the data to check for performance. We will increase it again over this week.
pi working good but i got problem with adding indicators every time when open new chart
if i add indicator in 1 chart then 2 chart get automatically like nest plus it is possible
JSG, once you have added indicator on a particular chart, save it as a template (explained in the post above). Once saved, whenever you open a new chart, click on apply template, and select this one.
hi Nithin,
im an active trader,many kudos and thnks for this awesome initiative ie zerodha. I ws sad to learn tht entry trigger(buy/short stop) for BO/CO may not be incorp coz of volatility et al , but then wont it be really unique(and of course worth all) to offer the trailing st/st loss oder(from average exec price-if in points) and target order for MIS order(sweet leverage unlike BO/CO with bitter leverage) currently available only on BO.As MIS orders hav entry trigger/gr8.
wht say ye Nithin,wont ye oblige///
Rokko, exchange hasn’t yet approved BO/CO using triggers. Until they don’t, we can’t really provide this.
thanks Nithin but any idea bout it(2 other orders of BO) for MIS orders,lovely trigger it has got u know.same Q.
Dear sir
Sorry for this silly question.How to add a Cross hair in to the Pi chart?
Sub, no crosshair for now. Left click and hover the mouse on the candle, you can see the OHLC, there is a short video put about it in the post above.
Hello
I did not find line chart, please advise me how to get line chart. since last 3 days sensex market indices is not working.
senthil
No line charts Senthil as of now .
Hi Nithin,
Firstly, big thanks for changing the landscape of Indian broking industry with Zerodha. You shattered even the big players.
I have installed Pi in my Windows 8 Laptop and have been working with it for some time. Overall it performs good, look & feel is excellent. But when it comes to back testing, sorry to say Pi is not up to the mark. The UI and usability of Zerodha Trader (Nest Pulse) Back testing was excellent, I miss that ease of use in Pi. Let me put it point by point.
1. In Pi, the trade symbol needs to be entered manually for back testing- which is painful. Like in ZT, just load the chart, right click to back test, was much easy.
2. Saving the Back-testing script as template/profile. Tried saving a basic one line RSI script like BUY = RSI(CLOSE,14)<25. Got an error "Enter Details in correct format"-attached screenshot. In ZT, it was very simple to create and save a rule and apply that rule to any stock/index-very user friendly.
3. This problem is with charting – may be specific problem to my case- in my laptop individual stock chart is not loading (attached screenshot).
I appreciate your dream to make Pi as ultimate trading platform; but until Pi matures to a benchmark standard, I request you to still provide all the features in ZT as well. At present back testing feature is NOT available with ZT, please consider giving back the back-test feature in ZT.
Thanks.
Regards,
Arun Kumar
1. The next release has made this process of adding contracts for backtest much more easier.
2. hmm.. this works exactly how it was on pulse.
3. Getting someone to call u back, shouldn’t happen.
Backtesting on ZT in no more provided by the vendor Thomson Reuters.
Can we have Ichimoku, Market Profile and Harmonic in Next release of Pi ?
Also how lonk it will take for Next Release
Sandip next release will be on Monday/Tuesday. Next release will have bracket orders, a bunch of issues with data on charts fixed, some changes in backtesting/alerts, and more. New indicators will take a little longer.
Fibo retracement … make it editable … 70 , 78.6 , 88.6 , 113 , 127 , 140 , all these are also required as per harmonics.
PI is superb.
Thank you in advance
Shashikant for now we are working on our data server bit, once done we will start on adding and updating indicators.
Hello Nithin sir , i have some queries , is it possible to
1. add vwap in charts
2. control panel to set charts open with indicators what i set default ( i have set every time my favourite indicators)
3.how to scan charts for certain criterias in pi
thanks in advance
1. Not for now
2. Save a chart with all your indicators as a template. Everytime you load a chart, apply the template.
3. You can use the scanner option. But better way to do would be to use Backtest option for looking at historical, and use scripted alerts or expert advisor to get signals in live markets. Check this: http://tradingqna.com/algos-strategies-and-code bunch of codes on tradescript. Also this post.
Hi,
I want to launch the Index charts with few indicators as follows-
5 EMA , 34 EMA and 200 EMA. The Pi allows me to add the 5,34 EMA but gives me error when trying to add 200 EMA ..Error message -” Invalid indicator period for the 3rd exponential moving average”
Pls help me out on this .
Kirti, my guess is that you have less than 200 candles opened on your chart. If you have less than 200, it won’t be able to plot 200 day ema
i faced similar problem with 200 SMA too.. but after reading this post i increased the number of candles and it worked like magic… thank you mr. Nitin. now i want to ask u to pls help me in setting up alerts when theres an SMA cross over happening… say for instead when the 10 SMA crosses 200 SMA?? can you do that?
thanx
You can do this by selecting the Alerts option on Pi.
Go to Alerts –> Create Scripted Alerts –> Give the Profile a Name –> Buy Script = CROSSOVER(SMA(CLOSE,XX),SMA(CLOSE,YY)), Sell Scrip = CROSSOVER(SMA(CLOSE,YY),SMA(CLOSE,XX)) and click on ’Save’.
Select the scrip on which you want this alert to be active and click on Enable Alerts option. This will give you the alert on crossover.
Overall Zerodha’s Pi has a neat interface and decent features. But I would really like the following to be added so to improve the usability.
1) Market watch where we can select the index and the scrips will be added automatically. Very helpful in checking the market movements.
2) Availability of crosshair so that we can track the price, volume and indicator values easily. The present system of holding the mouse is too cumbersome.
3) Ability to select different time frames in a single chart instead of opening a new chart every time.
These are the few observations I have on my first use of Pi. Haven’t tested the trading software in real mode.
yes, on our list of things.
Hi Nitin, I have one more suggestion on the chart.
1- All the charts are available in candle stick, can we have option to see them in line also.
2- Can we have the option to define the time period (such as 5days, 30days) to see the graph, same as available in google finance?
3- Can we have max/min value of each technical analysis for a given time period?
I am attaching the pic for better clarity.
Bye Vishal
1. Not for now
2. On our list
3. Didn’t get what u mean.
sir,
i am a new trader to zerodha,i installed pi,but charts are not getting loaded even after a long time,kindly guide me what to do ….
Send such queries directly to [email protected] with ur client ID
When will ichimoku be added? Is there any timeline. I tried to code it in ea but with no success.
Ichimoku will take longer.
Hi,
Are there plans to enable saving of lines drawn on the chart (support, resistance lines, trend lines etc..) and be ale to open these saved lines on a live chart ? Applying a template only allows indicators to be applied on the chart but what I am interested in is to have the support and resistance lines available on the chart when I open it at a later date, so that I dont have to draw them from scratch all over again.
Regards,
Ram
Yeah Ram, we are trying to figure out a solution for this.
i am used to charting from amibroker. is it possible to code the same afl in pi so that it becomes easier to trade ?
Thakkar, we can give coding AFL’s on tradescript a shot. But if you are used Amibroker, why don’t you use the Pi bridge to amibroker.
Pi hangs and corrupts, when i am trying to add 3rd exponential moving average to the chart…
Balu, are u using the latest release? If you are adding an EMA for 200 days, and you have only 10 days of data, the earlier version used to give this error.
Yes Nithin i am using the latest pi version, and also i have select bar history as 2000 for day candle but still its the same issue, i have tried multiple times.
sir,
i have little bit trouble on saving applied indicators on charts, in user settings-market watch- i have tick save charts in workspace/exit but the problem is when i logged in again i got only market watch and charts, technical indicator which i applied before exit is not able to save. so everytime when i logged in i have to apply technical indicators on charts again and again everyday when logged in.
plz reply and solve the problem.
thanking you
Vipul, you have to save chart as a template. So when you login the next time, apply the saved template. It will apply all your indicators again on the chart.
In Technical Analysis, Please add ”Pivot point”…..
Yep, u will see it soon.
Hi Nithin,
when is kite release expected?
Regards
Vinay
Please unblock my PI n TRADE.COM too. Send me my TRADING CODE of PI.
Send these directly to [email protected]
Hello Nitin sir
please add Ichimoku indicator in Pi Charts .
Yes, we will add it soon.
Dear Sir,
Some problem with intraday charts. Candles missing!!
Plz look into the matter.
Regards
Aniruddha
Hi,
1. open high low close for current candle should be displayed on top of the chart.
2.Adding Pivot points manually for each and every stock is very time consuming, pls try to enable it in the next release.
3.Pls enable shortcuts +/- for Buy/Sell.
Bug
From the chart active chart window, if any scrip is selected by clicking from market watch ”snap quote” window shows up without doubleclick (this bug was actually fixed in the previous patch but again exists in this release).
Thanks
Thanks, checking the bug.
Hi,
Is there a way to get a pop-up when an order is executed. We could do it in Zerodha Trader. But in Pi only sound alert version is available.
Regards,
Kishen Uchil
Yes, on our list of things to do.
how to have a cross hair pointer on chart… ??
Cross hair is currently unavailable on the Pi chart.
my client id rj0733
pi charts not loading geting this error
please contact me
We’ll have someone from our tech team call you & fix this for you.
If this error comes ,do the following:
>Navigate to the folder where Pi is installed (eg. C:ZerodhaPi)
>right click on the file register_chart.bat ,Run as administrator
>Relogin in Pi
Hourly charts also seems not working for indices and indice futures
Hi Balu,
Will get someone from our tech team to call you and assist you with this.
Yes, we had some issues with this. We will have Daily and hourly sorted soon.
do you have supertrend indicator in this ? i tried to search but could not find it.
No, it isn’t available on the current version of Pi.
Not available as of now.
Hi Nithin
Daily charts still not working, not making a new candle at the open of the day, continuing to play in the previous day’s candle
Yes Nurith, we had made some changes to fix this, but was causing issues in other charts. We will have this fixed soon.
Hi Nithin,
charts still not working. (daily), PLease do something.
Yes, we reverted the changes made, as there were a few issues. We should have the new daily charts module by 10th of May.
Nitin sir please add Ichimoku indicator in Pi Charts .
Please add Pivot, support , resistance lines in Technical analysis.
Hi Nithin,
Is there a way to get a pop-up when an order is executed. We could do it in Zerodha Trader. But in Pi only sound alert version is available.
Regards,
Kishen Uchil
serious problem with charts on Pi as shown by mahesh. Attaching a chart me too.. plz look into it on priority basis plz.
+ and – buttons on chart for zoom in and zoom out looks good, as of no zoom in, no reset button…
If any user has prepared template. User should have the option to ”set it as default” template so that he can open any stock with same template.
You can load the template on any chart, for now there is no set as default.
On daily or hourly chart if the mouse pointer is place the candle, the time when candle started and closed and also should be with OHLC values and other EMA’s/SMA’s..etc which user has added to chart.
Yes Balu this is available, make sure that you are using the latest release of Pi.
I. It would be great if there is 4hour chart like 1 hour interval
Yes it is available, choose periodicity as hour and bar interval as 4.
Hi team,
I have just started using Pi and have a couple of questions. I do multi-year support-resistance analysis on the charts and save them to the disk. After I open a chart I previously saved to disk, It does not show me features I would normally get with a new chart. Is this only for me ?
Also, If I open a saved chart (say after a week), will the data for the new days be added to the chart automatically (while retaining the indicators and lines I had previously drawn) or do I have to start the analysis from scratch ?
Ram, you can save a chart with all your indicators as a template. Once saved, you can load that template on any chart. (but note that drawing tools are not saved, only indicators). So if you save as a template, and load it on the chart, it will be updated to latest day.
How can 1Hour time frame set to 9.00 to 10.00, 10.00 to 11.00…..
our time frame 9.15 to 10.15, 10.15 to 11.15…..
Please add “Trend” or ’Super Trend’ Indicator
Yes Vipul, on our list of things to do.
Hi,
I Don’t know why you deleted my earlier question..I am repeating the same.
I installed PI. The charting not seems to working properly. When I open a chart , it displays the chart up to that point, but not getting plotted in real time. In NEST Plus chart , the candle moves in real time. But here it is not? Is there anything wrong in my installation? Please help…
Hey Indu, someone from our team was trying to reach you today. It has to do with the installation, guess something not installed correctly. Best you send all individual queries to [email protected].
Even it is happening in my case i tried re=installing Pi, still no luck
Please help to fix this
sorry .My bad. I had mentioned ”There is image verification also”. It should be read as ”There is NO image verification”.
Ram, the new release of Pi, we have removed image verification or download of scrips for a better experience. Getting someone to call you back.
Hi,
When I try to login in pi I don’t get login screen with quick login option. There is image verification also. Though it asks 2 security questions and after answering them it allows me to proceed. But I am neither able to add scripts nor see graphs. It seems to me that scrips have not been loaded. I have attached snapshot. Can you look into this?
Hi.. Thanks for the post on pi charting. I mainly use Zerodha NEST trader. I have a question. Can I plot on chart or program in pi for real time open interest data ? Thanks.
For now there is no OI data on the chart, but we will introduce this soon.
Hi Nithin,
Any heads up when will Open Interest feature will be introduced?Approximation would do..
Thanks
Hi Nithin,
When will we get the live open interest chart in PI or kite ?
Waiting for ur response
Hmm… OI data that exchange sends is not really realiable. The clearing corporation gives the correct OI at the end of the day, what you see live is not really correct data.
Can I make my studies (technical analysis) as default which I set on pi charts ?e.g. RSI,MACD ,EMA VOL,etc
Regards
Haridas
You can save the studies on a chart as a template. So you can load the template on any other chart.
Is it possible to simulate ichimoku using EA, scripting, if it is not available by default in PI? Also, what is the estimated time frame for PI to come out of beta?
Arun, Pi is good to trade, we are still calling it a beta because we still have a lot of tools/features that we want to introduce. Yes Ichimoku, should be possible using EA. You can post the query on tradingqna, will get someone to check it out.
Dear Nitin,
Kindly let me know when will be multiple market watch list will be available in PI Software, now i find it difficult in switching from Equity,F&O and MCX market watch or i need to add in single watch list, which i find it very difficult.
Regards
Balaji
Multiple marketwatch will take some time.
SIR I ALSO WANT TO ADD STRIKE PRICE WITH OPTION,PL PROVIDE MULTIPLE MARKET WATCH ASAP
Arvind, Strike price shows within the contract name.
Hi Nithin,
Can the daily chart be made to update in real-time.
Regards,
Kishen Uchil.
Yes Kishen, very soon.
I have just installed pi and started using.The hour chart for mcx is not working . After selecting the periodicity to hour,bar interval as 1 and bar history,the charting screen opens with a black screen without loading any data.
Arun, it is working, what are you using the bar history as? If you are facing issue, send an email to [email protected].
Have a few observations on Pi,
a) The font of the indicator value should be
– in bold for ease in viewing
– the value should be brought in front ie when the indicator & the value overlaps, the value presently is not visible
b) Cross hair for ease in checking values across the screen – price & all indicators displayed. When the crosshair is slided across the screen, the time, date, values of price & indicator preferably should be shown all placed together in a box. This would help in checking / evaluating data at different points of time
c) During trading hours, if the chart is scrolled left (ie historical), then as the chart gets refreshed with new data, the chart gets zoomed out and the scroll gets cancelled
d) As and when the chart is refreshed during trading hours, the level of zoom keeps on decreasing, which has to be reset again
e) Better option for scrolling than using just the arrow keys
f) Can saving the chart template also save the placement (width set) for the price and the indicators
g) The –ve sign in the indicator value is not easily deciphered. Would prefer the option, like in excel, of putting the value is –ve in brackets for ex
+2.34 would be displayed as 2.34
-2.34 would be displayed as (2.34)
h) If possible, can the indicator colour indicators which oscillate around “0”, be different when +ve vis-a-vis when –ve. The crossovers, trend would become easy to visibly scan
i) In the DMS indicator both the +Dx & -Dx are of same colour. Which makes it difficult to view and interpret
j) In the present layout of the chart, the values – price, indicator are spread all across the screen. It would be nice if they are collated on one side (in their respective panes) say left hand side. This would make scanning faster & easier
h) Vis-a-vis the full name of the indicator on the chart, an abbreviated form of the same can be used & the chart is for which script can be mentioned once on the top of the screen
i) The provision to enlarge only one indicator amongst the lot displayed on the screen would be nice
j) Presently there is no provision to change the stacking order of the indicator for display purpose on the screen
k) On the price bar, for the font selected “6” has got a slight more closing curvature. To distinguish whether it is a “6” or “8” one needs to look closely.
l) Across all the indicators, the option to chose colour is limited to only the main indicator line. For the other relevant lines, the same option should also be provided.
m) Have observed candle labelled 0900 hrs ; which price point does this represent
n) Pl check Renko, P&F charts. The price as per the bar / box and the actual price does not always tally (diff is more than the width of the box).
sir. as u said ,when we zoom using keypad arrows its showing wrong times (ex-if we zoom chart at 1pm it will show 12 clarify
Not happening for me, will get someone call you and clarify.
sir,good but if u dont give r1,r2,pivot s1,s2 in pi by default like other brokers for intraday,its basic how can PI neglect such importantthing,ofcourse u can argue to see by indicators etc ,whatever u say its must for charts bydefault like nestplus
Narasimha, yep we have missed on that, but will come soon.
hi,
i request you to post a video on how to install MACD INDICATOR in PI SOFTWARE………..
Manjunath, it is just like adding any other indicator.
sir,when its toooooo late how to draw historical charts in PI
I didn’t get what you mean by tooooo late? Drawing historical charts is just like opening any other normal charts. Choose the number of candles you want, and time period of each candle and plot.
It has been too long since you said you are going to introduce this feature but still there is no pivot support resistance analysis in pi.
Nithin sir this is suresh, i hope u remember me. my request for a simple alert for a price closing above or below a certain EMA is not yet fulfilled. someone called me and then assured me call back but has not yet turned back. plz help me sir
Yes Suresh I remember, for now you will get an alert everytime a crossover happens and not on the close of the candle. We are making some changes to give you an option to do it on close of candle, will take longer.
Hi Nitin… Zerodha has given Pi which is good. But if we take historical data of 60 days or 90 days, it is giving full wrong data and chart. Please check and correct it immediately. You can cross check the data from the below link.
http://in.investing.com/indices/india-50-futures-historical-data
Next immediate issue is Zerodha Kite.
I am getting the OMS Connection Error when I try to login during market hours. Not only me, so many others are facing this issue from long time. Still now no action has been taken.
When I called to customer care, they said they are fixing the issue. We are facing this issue more than 3 months. I hope you can understand better than others.
Awaiting your immediate reply.
Srinivas, can you tell me which data is wrong? As in which specific stock and day? Also check this: http://tradingqna.com/8843/technical-charts-google-finance-yahoo-finance-amibroker-match
When did you get this OMS connection error? It had happened a couple of times, but that issue is sorted for now.
Sir in PI software charts are not loading
I have tried that pi-chart.bat to click on run as administrator but it is not working
Shailesh, best if you write to [email protected].
Dear Zerodha,
I am using Pi from about 10 days. Today, I have installed latest version (as per your mail). The software is indeed coming as excellent. The Speed and connectivity are good.
Following are my comments. Please take these constructively.
1. Chart Templates – save and apply. When I save the chart template, it opens folder at my desktop. However, when I apply chart template, it opens installation directory. Please make these same, preferably ”/Chart Templates”
2. Once I open the chart and apply template, there is no way to save something as ”Default Template”. So every time I open a chart, I have to apply template.
3. I am not sure in today’s version. But this comment is from previous version . First, my thinking was that we can not change the trigger price in a cover order. However, I have realized that though this can be changed, but not beyond the trading price. For example, suppose I am long in Bank Nifty at 18300, and placed SL of 18200. Now as the price moved in favour of my trade, I moved my SL to 18250 and the to 18300. This was allowed. However, when I changed it to 18350, there was no message as such, but the trigger price did not changed. Please allow this as well. (This was not in NEST trader initially, but was added subsequently.)
4. Could not find ”Basket Order”
5. Unable to change the thickness of technical indicators on chart.
6. This is something which is desired. When I have opened a chart, is it possible to change the interval and/or script – in the same chart.
regards.
Surinder
Adding to surinder points.. Need to improve in few things…
1. No shortcut key when we want to select the indicator listed in ’s’ ’letter, now we need to scroll down all the way to ’s’ , sometimes its pain to do that.
2. Not sure how to change the color for the febbi retracement, default color is blue which is not visibale clealry.
3. Loading chart is little slow, if we could tweak the software to download offline data for charting and append lthe atest data at the time of live, this would save some time at the time of loading ( we may give this as an option for the clients, if they want)
Over a it’s a fantastic cutting edge software for trading….
Thanks,
Sridhar
Yes Sridhar, all of this on our list of things to do.
Cheers,
Dear Zerodha,
Wonderful experience with pi and also great broker like Zerodha. Some technical tool i would like to suggest are
1. Fibonacci extension
2. Fibonacci time retracements (Same as FIBO PRICE RET BUT PLOTTED on TIME axis.
3. Fibonacci time extension
{1 & 3 I found on investing.com site interactive chart. But 2 is not found in any software in India. It is great tool to predict time for trade. I have read about this in Robert C. Miner’s blog. He use this tools in dynamic trader software. Also if this tools can be made editable it will be of great help so we can draw external retracements as well.
thanks,
Regards.
i am new to trading, Please let me know how to calculate resistance/support.
are any indicators/tabs in zerodha pi for this levels to know?
Check this module on Technical analysis.
could u please add empty space to drag chart above , below & to the rightside of last candle in pi exactly the way it is in kite , so we could use it to make fib extensions & extend trendlines before price action to predict support levels and set profit levels for exit
Pi is gr8, will like to have weekly chart, i found minute/hour/day.
thanks.
Dear Nitin,
Thank you for everything you are doing.
Have a humble request, Amibroker has a tool called ”Support and resistance” which is very nice, I wish something like that is there on ”PI” charts.
Thanks and Regards,
Madhan Jatapati.
We have this option already, check this post: http://zerodha.com/z-connect/tradezerodha/pi-tradezerodha/latest-updates-pi-23rd-july-2015
can u help me in pi chart
can i add any online downloaded indicater in zerodha pi
Hi Zerodha,
Why not a provide community chat functionality among pi users? this will create a community trading atmosphere and no one will feel trading of their own.
regards
manoj
Hey Manoj, we’d considered this but had to drop the idea due to some regulatory issues.
sir, I can not show the chart option in my Zerodha pi please help me, chart option was disable
Yes, Basket order is currently not there, and working on your other points.
Is Zerodha Pi is valid to the real time intraday market , because today market of ”nifty50” closed at 8622.90 but in PI it is showing as 8629.6?
Pi will be showing last traded price, I guess the exchanges will be showing the adjusted closing price.
For pi what is the delay time of intraday feeds. Please clarify. Is it real time or delayed feed.
It is real time feeds.
I’m not able to view charts and chart tools in pi.. Please help me out
Best raise a ticket on our Support Portal to get this resolved.
i cant see charts. plz can solve my problem