
Beyond misleading trading turnover numbers — the actual size of Indian capital markets
We have all heard of the lakhs of crores of Rupees worth of trading turnover that happens in the Indian capital markets every day, creating the illusion that the markets are massive. However, this post explains why they are not, and why looking at trading turnover to determine the market size is highly flawed.
Trading turnover
The most straightforward definition of turnover = Qty X Price.
100 shares of Reliance bought at Rs 2000 = Rs 2lks of turnover.
In the case of derivatives (F&O), quantity is the number of lots x lot size.
5 lots of Nifty futures sold at 14000 = 5 x 75(lot size) x 14000 = Rs 52.5 lks.
The total sum of values of all trades on the exchanges is the total trading turnover, which by the way, is a very very large number. This number gets tracked widely to measure trading activity on the exchanges.
From the time we started Zerodha in 2010, I have always been asked, “what is your trading turnover?”. The primary objective of this question is usually to estimate the size of our business. I was always forthright about this, until an incident that made us realise that talking about absolute turnover as a brokerage firm is misleading.
An uncle of mine saw a news article that said that Zerodha does Rs 10,000 crores of turnover per day and asked me – “Your revenue should be at least 1% of Rs 10,000 crores, or Rs 100 crores per day which is Rs 25,000 crores per year?” This was when we were quite small, with annual revenue of less than Rs 25 crores.
This was when we started talking about our turnovers only in terms of the number of trades per day, a better way to measure the size of a business that works on a flat fee per trade model.
Total trading turnover on Indian exchanges
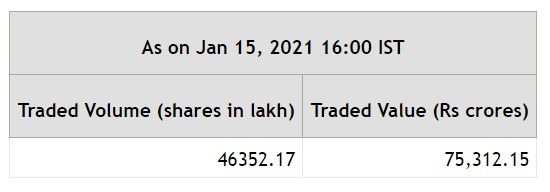
Here is the trading turnover on NSE on January 15, 2021:
Equity: ~Rs 75000 crores
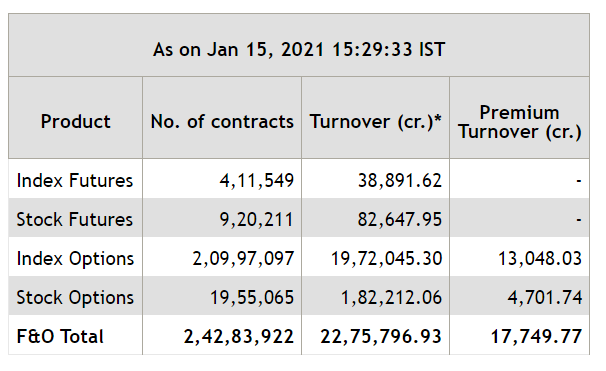
F&O: ~ Rs 23,00,000 crores (notional options turnover) or ~Rs 3,20,000 crores (premium options turnover). I have explained further in the post the difference between notional and premium turnover for options.
Yeah, that is a whopping Rs 25,00,000 crores per day (25 lakh crore rupees) across all exchanges.
For an exchange, a buy and sell side together constitute one trade, so the trading volume declared considers a buy-sell pair as one trade. But for a brokerage firm, every trade is turnover. So, if you summed up the trading turnover of Individual brokers across India, the turnover will show up twice of what the exchange is declaring.
There have been multiple times in the past where this turnover number has been compared with India’s GDP. The story typically is a version of, “India’s GDP for FY 19/20 was approximately $3trillion or Rs 210 lakh crores”. Just ten days’ trading turnover on all exchanges would be almost Rs 250 lakh crores, higher than India’s GDP. This type of comparison is ridiculous and misleading as I explain below.
Gross domestic product (GDP) is a monetary measure of the market value of all the final goods and services produced in a specific time period.
When estimating the market’s size, a good starting point is by looking at the contribution to turnover by various types of participants and retail participation.
Participant wise trading turnover contribution
Check this data below from NSE Market pulse, a monthly review published by NSE. This is from the Jan 2021 issue.
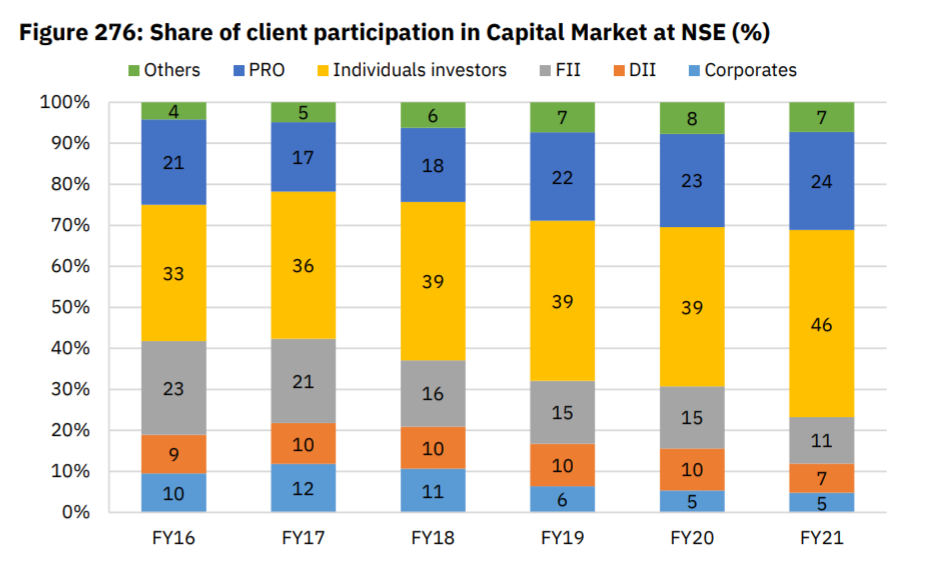
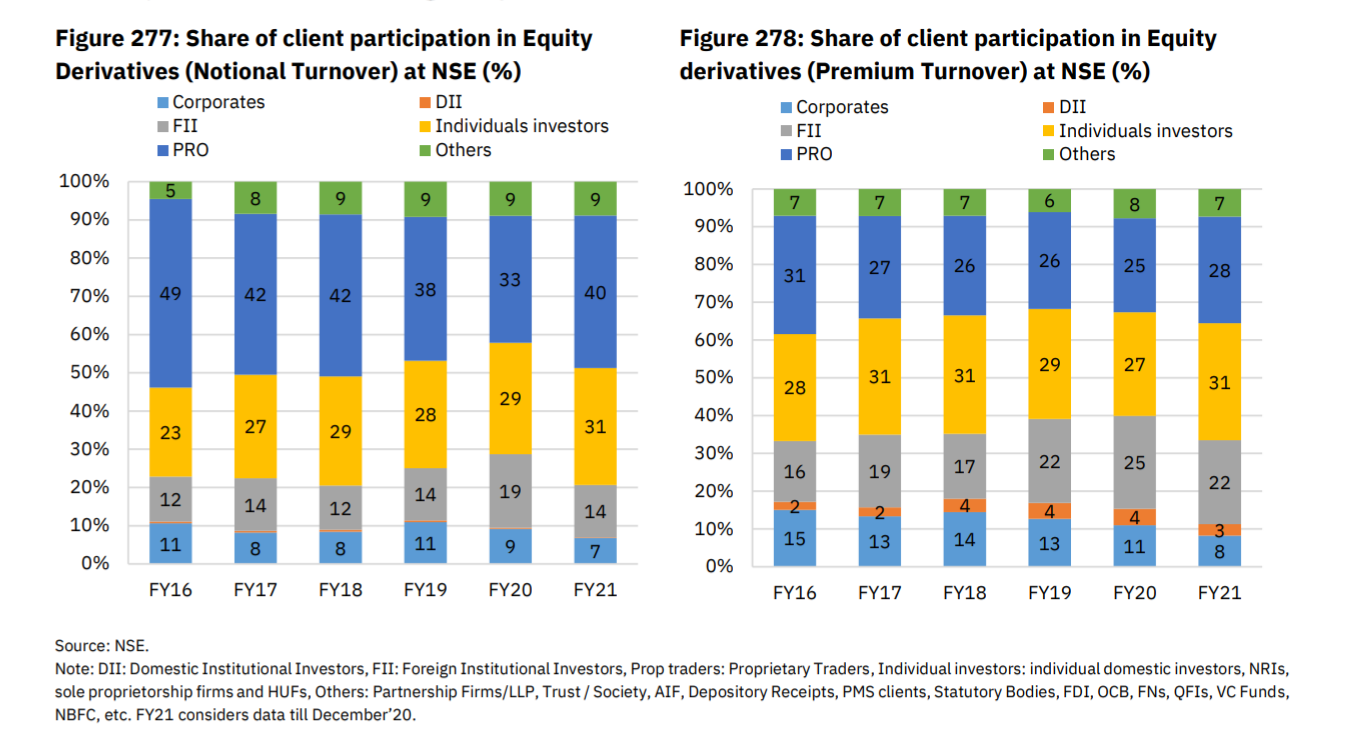
This year’s interesting development has been the increase in retail contribution to turnover by around 20% in equity and about 10% in derivatives, possibly resulting from COVID caused work-from-home. But, as you can see, the retail contribution is still less than 50% for equity and only around 30% for derivatives or F&O. This trend of increase in retail participation is not just an Indian phenomenon, but a global one.
Size of Indian capital markets – Retail
As of Jan 2021, CDSL has 2.89 crores, and NSDL has 2.08 crores demat accounts. That is a total of around five crore non-unique demat accounts. For example, I personally have over a dozen demat accounts opened in the last 20 years; most of them now inactive.
A better way to track the size of the market is by looking at the NSE’s active client data. As of Jan 2021, according to NSE, around 1.6 crores or 16 million customers had traded once a year last year (last 12 months). This again is not a unique count, so if a customer had traded with two brokers, it would show up twice. By the way, this number has almost doubled from two years ago thanks to markets performing well in this period.
Zerodha today is the largest retail brokerage in India by all measures of trading activity. Extrapolating our active client data, we believe that the current size of retail in India (unique customers) is:
- Yearly active: 1.2 crores to 1.3 crores
- Monthly active: 70lks to 80lks
- Daily active: 30lks to 40lks
Is shallow retail participation an opportunity?
If you look at the above active retail participation numbers, the yearly active customers are just ~1% of India’s population. This if you would compare to developed markets, is ~ 20%. The first reaction from most is that there lies a huge opportunity, but here is something that you need to know.
I had shared this on Twitter last year. People who can invest or trade in the markets need to have money to trade or invest. There were only 5.78 crore people who filed income tax returns last year. Out of that, 75% earned less than Rs 5L/year. While there still exists a substantial parallel economy where income isn’t declared, it is difficult for such money to flow into capital markets. This parallel economy may be one reason for India’s very expensive real estate market and what spurs the massive demand for gold.
With this data in mind, if you looked at the target market size, it would seem like it has to be a subset of 5.78 crores. At 1.3 crores active investors, that is an almost ~20% penetration of the realistically addressable market and not ~1%. The real problem for our country is to enable the significant majority of the population to be able to earn more.
Intraday equity & active F&O traders
Coming back to turnovers, any conversation on this topic has to first start by talking about intraday equity and active F&O traders. They contribute the majority of turnover on the exchanges.
One of my favourite questions to ask people who are just starting to invest is – “What do you think is the turnover contribution of equity delivery trades?” Most people think that the stock market is the business of buying stocks, holding it for a while and selling. Many don’t realise that only a small portion of turnover comes from equity delivery trades and that the majority comes from intraday equity and F&O. While the majority of people around you are investors who buy and hold stocks, a small community of intraday and F&O traders contribute most of the turnover on the markets.
Again, extrapolating from our client base, we believe this community is not more than 10lks in size at any given time. This community is typically buying and selling frequently, sometimes many times during the day, providing liquidity and reducing impact cost for investors. They also execute arbitrage trades to ensure there aren’t any price inefficiencies. The liquidity they provide reduces the volatility in the markets significantly. This community is made up of retail traders, prop shops (brokers who trade only for themselves), hedge funds, high-frequency trading firms, institutions looking to hedge/arbitrage etc.
While everyone in the capital markets from exchanges to brokerage firms loves this community, it is extremely tough to grow this market, especially the active retail traders. This is because profiting from active trading is extremely difficult. It has almost the same odds of building a sustainable and profitable business — meagre. Most active traders stop trading within three years if they are not profitable.
Leverage is the reason why we see high turnover
The main reason why the much smaller active community of traders can generate the majority of turnover is leverage. Leverage gives the ability to buy or sell for much more than the money in hand. For example, to buy Rs 1L of Reliance equity delivery, you’d need Rs 1L with you. But to trade Rs 1L of Reliance intraday, you’d need only about Rs 10,000 in your trading account, or need 10% margin, or trade with 10x leverage. For most stocks, brokers offer intraday leverage of at least 5x. With leverage, the per trade value goes up exponentially.
Until Oct 2020, brokerage firms were giving upto 100 times intraday leverage. SEBI brought in the peak margin regulation capping this to reduce risks of high leverages. As per this regulation, the maximum leverage for trading stocks starting Sep 2021 will be only 5x and as you’d imagine, this might reduce trading turnovers if there is no growth in the number of traders.
Brokerage firms offer intraday leverage because this results in higher value and the number of trades, which means higher revenue for the firm. Traders love leverage because the higher the value of the trade, potentially higher profits. However, most forget that it is a double-edged sword that can lose money fast as well. When a brokerage firm offers leverage, the firm’s risk goes up as well as there is a potential of the customer losing more than what is available in the trading account. This risk is generally lower for intraday leverage trades as positions can be forcibly closed by the brokerage firm if there are losses, unlike overnight leveraged trades that can’t be risk-managed after market hours. This is the reason why brokerage firms have historically given higher leverage for intraday trades.
As you would have seen in the first two images, most trading volumes on the exchanges are due to futures and options (F&O). And within F&O, index derivatives contribute over 70% of the turnover. In F&O, leverage is an inherent part of the product. For example to buy 1 lot of Nifty futures (75 Nifty) at say 14000 or 10.5L of Nifty, you’d have to put up only around 15% or 1.6L as margin. In case of options this leverage goes off whack for an option buyer. For example, instead of Nifty futures, if you bought Nifty 14000 call options, you might need to put in just Rs 100 per Nifty call or Rs 100 x 75 = Rs 7500 per lot instead of the margin of Rs 1.6L in case of futures to get an exposure of Rs 10.5L worth of Nifty. Or essentially you get exposure to a contract worth Rs 10.5L with just Rs 7500.
In case of options, this Rs 10.5L is the notional or contract turnover, and Rs 7500 is the premium turnover. Looking at the premium turnover is the more appropriate, as premium is the money that actually gets traded. Exchanges declare turnover both as notional and premium (check image 2). As you’d imagine, most people like to quote the flawed notional turnover to create sensationalism. Rs 21L crores of notional turnover on Jan 15th 2021 = Rs 20k crores of premium turnover. Or premium turnover = 1% of notional turnover.
So all F&O inherently has leverage, and almost all brokers have been giving additional intraday leverages. This again as explained earlier in the peak margin regime will have to stop before Sep 2021.
Trading turnover in Indian capital markets
Below is a guesstimate based on the data we have analysed in Jan 2021. Trading turnovers change significantly based on market volatility, and hence the range mentioned below is broad.
Equity delivery
Approximately Rs 10,000 to Rs 20,000 crores per day.
Intraday equity
While the absolute turnover is around Rs 50,000 to Rs 70,000 crores per day, we need to consider leverage. Considering that on an average intraday trader gets at least seven times leverage, the actual money that gets transacted will be less than 15% of turnover. So turnover in terms of the value of actual margins (money used per trade) traded is between Rs 7500 to Rs 12,500 crores per day.
Futures
Like intraday equity, while the absolute turnover is in Rs 1L to Rs 1.5L crores range per day, all futures come with leverage. So the right way again to maybe look at this turnover is not the contract turnover but how much money or margin was used. Also, brokers have been offering additional intraday leverage over on top of what futures already have — so assuming 15% margin on average, between Rs 15,000 crores to Rs 22,500 crores per day.
Options
As I explained earlier, the correct way to look at option turnover is to look at premium turnover. The industry hasn’t really been giving any additional intraday leverages on option premium, so between Rs 15,000 crores to Rs 25,000 crores per day in turnover.
If you add up all of the above, between Rs 50,000 crores to Rs 100,000 crores per day. So, Rs 1L crore and not the Rs 20L crore per day that usually gets reported.
But wait, isn’t Rs 1 lakh crores per day still ridiculous?
In the exchange business, a turnover of Rs 1L crore is actually quite normal. As I mentioned earlier, the majority of trading volumes come from the smaller group of very active intraday and F&O traders. These traders constantly enter and exit trades seeking for small moves in the price of the underlying. For example, with a few lakh Rupees in their accounts, some traders generate crores worth of turnover by trading many times intraday using leverage.
Market size by revenue pool
A better way to estimate the size of the Indian capital markets is by looking at the revenue pool and not trading turnover. There are 400+ retail and institutional brokers in India doing clientele business. Another 1000+ brokers who trade for themselves. The estimated revenue pool from all of them put together is not more than Rs 30,000 crores for FY 2019/20. For the same FY, the three exchanges together had combined revenue of less than Rs 5000 crore and the depositories NSDL and CDSL together had revenue of less than Rs 500 crores. So my guess is that the revenue pool of the entire capital market industry would be lesser than Rs 50,000 crores in FY 19/20. If you had to compare for the same period, revenue of Reliance Industries was Rs 6.59L crores, and Infosys was Rs 94,000 crores; 14 times and 2 times more respectively compared to the entire capital markets industry. Charles Schwab, the largest brokerage firm in the US single-handedly had $10billion or Rs 75,000 crore in revenue.
So, the size of this revenue pool, and not the inflated lakhs of crores of daily turnover numbers, is the better way to estimate the size of the capital market industry in India. The markets will expand as the country’s economy grows and people move up income brackets.
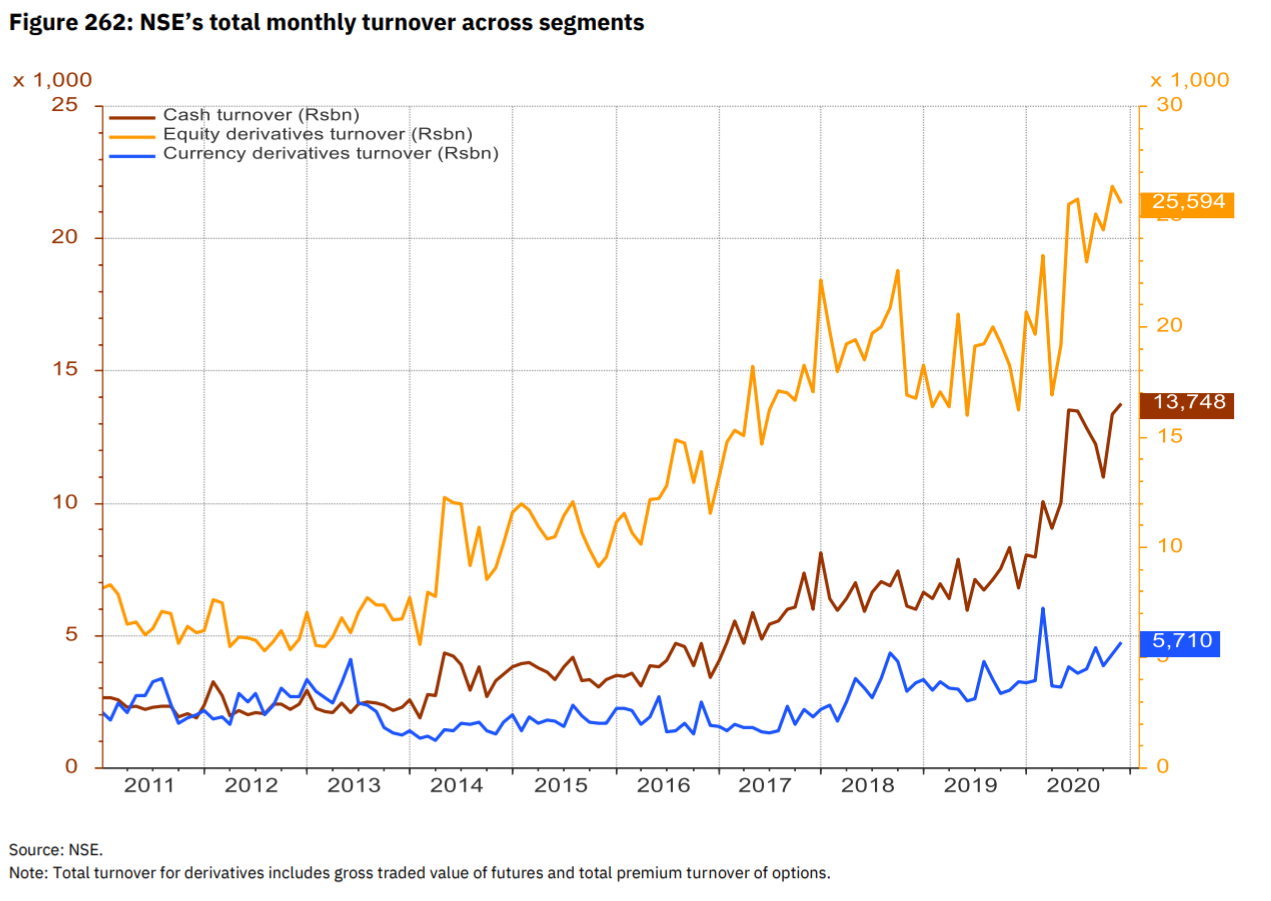
The only real use of tracking trading turnover is determining the change in our capital markets’ trading activity. For example, this graph below shows that the trading turnover has gone up almost 4 times in the last 10 years, and nearly 60% in 2020, indicating participation in Indian capital markets has gone up at a similar rate.
Phew! That was a long one. Hope you find this useful.
Good and insightful post. Actually the news and talks around trading turnovers relating to GDP of country is mostly bogus.
Hi Nithin,
I have a query and will be glad if you answer it. Per this report https://www1.nseindia.com/products/content/equities/equities/historical_topbrokersyearwise.htm published by NSE, top 100 members contribute to ~90% (of turnover, presumably); this rate was only ~82% 3 years back. These members should be FPIs / DIIs / some Proprietary accounts and UHNIs / HNIs and Retail participation would be within the remaining 10%, which was earlier ~ 18%.
During last 2 years, which Retail participation had gone up, their pie share had actually come down and the trade turnover of big + mighty 100 members had infact gone up both in volume and pie share terms.
Kindly confirm / correct my understanding. Thanks!
May you please clarify this point, Nithin? (you may also send your reply to my email ID, pls)
The term Members in some contexts are used to refer Stock brokers by the Exchange / SEBI; however considering the fact that top 5 brokers would be having a fairly large proportion of business (>50%), I understood that members in the given context would mean the trading / investing members collectively – including Institutions, Proprietary accounts and Clients. Will await a response from Nithin. Thanks!
Have raised a ticket just now [#20220717448673] as my queries probably wouldn’t have been seen by Nithin. Will be really glad if it is taken up to him and I get some clarity via his response. Thank you!
When exchanges say ”members”, they are referring to stock brokers who are registered on the exchanges. Brokerage firms and not customers. Brokerage firms are of three types – Retail brokers (like us), Institutional brokers (those who cater to FII, MFs, etc.) and Prop brokers (those who trade on their funds and don’t have any customer business). Hopefull this answers the query.
Thank you very much Nithin. I wasn’t aware that that institutions have different set of brokers and this point also clarifies my 2nd misunderstanding as mentioned in this thread dt 03-Jun-2022.
These queries were bugging me as I wanted to get a sense of the count / size of market movers & shakers, but I couldn’t find a reliable source and hence thought of approaching you. Many thanks to your team as well for their superfast ticket resolution!
Very insightful post. Thanks Nithin for sharing!
You explained Very well sir, Hope official also understand this.
Some person ( traditional old 90s speculator) don’t want to this go on
They spread rumour about turnover and say they worry about Little investors
Actually they don’t worry about any small investors. really they jealous because small investors now days can also make huge profit.they also jealous from zerodha company due to its success..
Such a cheap people
Hey god give them kindness for others
Jay shree Krishna
Barot Tushar
wow. well researched
Thanks for such an insightful post this post is very helpful for young Indians and i am follower and admirer for your work in this field of investments
Amazing! Valuable insight and perspectives. Thank you!
So the Equity turnover (75,000 cr.) is due to high leverage? And the 20L Cr. in F&O is due to leverage and spot price rather than premium? Please correct if I am wrong? Thanks in advance
Amazing work!
Thank you Nitin for the insightful post, time the focus shifted to fundamental rather than turnover. I feel that high turnover (vs actual delivery + margin) also indicates a rise of algorithmic/bot trading.
Would be interesting to compare this ratio for developed markets like US
Is FII turnover included in the calculation ?
Yes it is. Check the 3rd/4th images.
Missed it. Thanks Nitin.
As opposed to general perception that FIIs move the market, FII volume contribution is less than 1/5th and shrinking in the last 5 years. Is this a good sign ?
Dear Nithin, Every piece you put out improves our understanding of financial markets by a great percentage. Truly grateful that you find time to share knowledge every now and then. Look forward to more!
Enjoyed this review.
What a detailed review bro. Just spot on prediction of actual capital market in India. Always been your fan both as an enterprenuer , writer and human being. This article was inspired by the interview with kunal Shah I suppose. Please write a book on financial freedom. Thats the next step ahead for u is my gut feeling. All the best . Keep inspiring . Cheers!!!!
Excellent article. Such data driven article helps retail investors to not fall for misleading information from other media. Thanks for explaining in simple words
Thanks. It was a good read.
What would be the % of profitable traders among active intraday equity and F&O trading over a period of more than 2 years?
Thanks,
Ragav
2%
Occassional 10k / 20k profit – many people make. Consistent net P&L growing over any 2 year period: Very low.
Too high an assumption to take 2%.
2% of 2 crore people would mean 2 lac people making money consistently, I would estimate that number to be less than 10,000, even lower.
Brilliant article…..there needs to be a multiplicity of other kinds of products, such as REITs , fractional asset ownershipz etc which need to be created
Very beautifully explained.
… though we know the numbers are huge just because of leverage , the article is well written . ..
.. the comparison note with US capital market ( % people participating vs population), I was thinking , we are lagging. But your note on comparing with %people paying taxes , gives a picture, we are not lagging … we already have a comparable participation … thats the take away for me …
.. An article articulated well..
Too Good. Very Insightful 😀