Introducing the all new option chain on Kite app
When trading options, one of the most important tools you can use is the option chain. It provides a complete view of all available option contracts for a stock or an index, showing key details like strike prices, premiums, open interest, option greeks, and more.
The option chain helps traders determine market sentiment, identify trading opportunities, and make more informed decisions about their positions.
We had already redesigned the option chain on Kite Web to make your trading experience smoother. We have now added the new option chain to the Kite app as well. With the new option chain, you can now view all options contracts for the underlying asset, check prices and option greeks, place orders, and more, all in one place.
Getting started with the option chain
To open the option chain on the Kite app, tap on the instrument and then select Option chain.
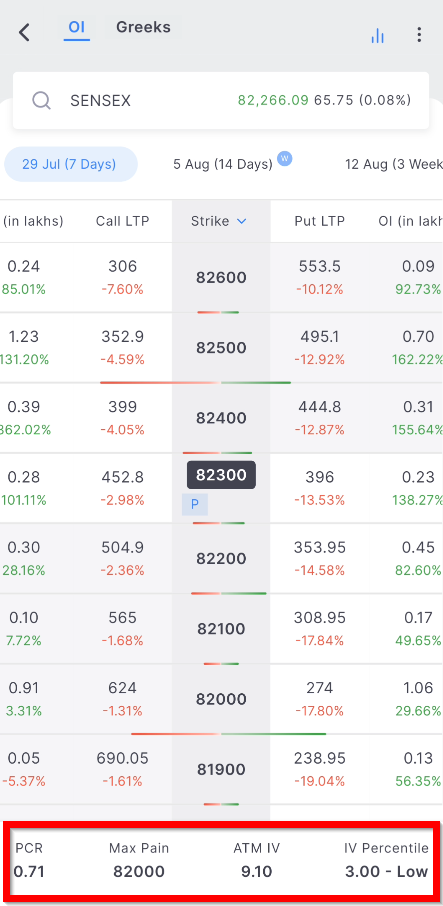
Once inside, you will see all the contracts for the currently selected expiry date. To analyse different expiries, simply select another date by tapping the expiry selector. You can check the option chain for all available expiry dates by swiping from right to left.
The option chain also displays the remaining number of days until expiry. This helps traders compare near and far contracts to get a better understanding of market expectations.
Navigating strikes and market data
You can scroll up or down to view all the strikes of the contract on the option chain. Tapping on the highlighted at-the-money (ATM) strike price resets to default, showing the strike prices that are nearest to the spot price. The red and green bars show call and put open interest (OI), respectively.
Strikes can also be sorted in ascending and descending order by tapping the sort option.
Quick trading and order management
Trading options has become easier with the new design. When you tap on any strike price, you will see quick options to place buy or sell orders, allowing you to act quickly when you spot a trading opportunity.
Additional features available for each strike include:
- Adding the particular contract to your watchlist by tapping Add to watchlist
- Setting price alerts
- Viewing the chart for a specific strike
- Placing good-till-triggered (GTT) orders
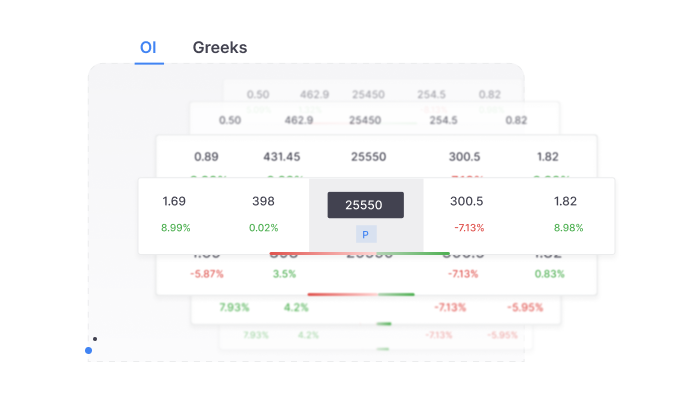
Position tracking and management
If you have taken a position in any option strike, you will see a P icon alongside that strike. You can track the profit and loss (P&L) for that particular strike in the market depth window by tapping to open it. To add more quantity or exit the position, tap Add or Exit, respectively.
Key market indicators
At the bottom of the option chain, you will find essential market indicators, including the put-call ratio (PCR), max pain, at-the-money implied volatility (ATM IV), and IV percentile.
Option Greeks analysis
For more detailed options risk and pricing analysis, the Greeks feature is available. Tap Greeks and slide your finger from right to left, or vice versa, to view the different metrics. These greeks include Delta, Gamma, Theta, and Vega, which help traders understand how option prices may change based on various factors.
Switching between instruments and customisation
Once you have opened the option chain for a particular instrument, such as Nifty, and want to view the option chain for Bank Nifty or another instrument, simply tap the search icon and enter the symbol.
To quickly examine the underlying chart and check the price trend, tap the chart icon.
The option chain allows you to view price changes based on absolute values or percentages. To switch between these views, tap the three dots menu and select either Absolute change or Percentage change options.
If you have questions about using the new option chain on Kite mobile, please post them below.
Any plans to introduce auto entry based on combined premium trigger similar to Kotak Neo Strategy Bot?
How can I apply ipo by minor acc online by HDFC ASBA app
Hi Hemant, the IPO application process for minor accounts remains the same. However, if UPI is not enabled, you will have to apply using NetBanking ASBA. We’ve explained this in detail here: https://support.zerodha.com/category/trading-and-markets/ipo/ipo-application/articles/minor-ipo
All these details are given in API too ? ATM IV And IV Percentile ?
Not yet, Sameet. This is on our list of things to do.
Excellent.Please add to my App or how can I get this facility.
Hi Rajiv, the option chain is already available on the app. https://support.zerodha.com/category/trading-and-markets/trading-faqs/f-otrading/articles/option-chain-on-kite
Good but fast trading on chart with all features is must necessary of current market time demand, so do about it. it’s a request from a me thankfully your one customer
Hi Ravi, trading from charts feature is currently available on TradingView and ChartIQ charts on Kite web. We’re working on adding this to the app too. We’ll keep you posted.
Kite has to conduct online training programmes which will help new users to use this feature without hesitation.
hay team zerodha please add predefined watch list of sector, fno stock etc in kite app (jaise web me group hai ese )
Hi Jay, new watchlist features will be available on the app in coming updates.
Firstly, sincere thanks to Mr. Kamath and entire Team Zerodha for constant improvement and making user friendly app. Understand it is not an easy task to have all requirements accommodated immediately but the Team works out to have these things for users and looks with an approach – there is always a room to be better and include features of other brokers too.. Thanks a lot.
Excellent
Sir please also give basket option in option chain so that it will easier to buy or sell orders of different different strike price..(hedging perspective)…hope you understand what i want to say…
Hi Jitendra, we’ve noted your feedback. Thanks.
Nice dude this is amazing👍
Thank you team zerodha
Nice one.
Very nice app sir ji🌹🙏🙏🙏
Really like these features. Thankyou Zerodha
Kindly update the stock adding option in the watch list.
For example
Suppose muje meri watchlist me koi stock add karna he to jab me stock add karta hu to wo stock watchlist me last me jakar add hota he lekin ye esa nhi hona chaiye…
Isme improvement karne ki jarurat he jase koi bhi stock jab add karna he to jis stock ke niche ya uper add karna he us stock per click karke add stock above or below ka option hona chaiye…jase trading view me he
Hi Rahul, your feedback has been noted. We will check into the possibilities.
Add exit all positions in Intraday and options
Hi Krishna, you can use the quick exit feature on the Kite app to close your positions quickly https://support.zerodha.com/category/trading-and-markets/general-kite/kite-holdings/articles/quick-exit-holdings-and-positions for multiple different positions, we’ve noted your feedback.
1) kindly add the feature of target and the stoploss (if possible trailing stoploss too) at the entry time itself in normal orders. i am not suggesting the already available feature of GGTT orders.
2) kindly add the feature to place buy/Sell orders from index price chart itself as it is done in price chart.
3) in option chain the earlier feature to switch from one index to another by clicking on the same box and obtaining drop down menu was more easier than this as one has to type index name manually.
4) Kindly make all the above features available in mobile app of kite too.
Hi Vivek, we’ve noted your feedback and will look into this. Thanks.
Hi Nithin
Hope u will see this,I have been using zerodha for past many years and it was good i would like u to make an update on the UI jn such a way that it’s friendly for many of the traders who are doing traiding on options or infurure.can u make the charting suitable for doing live traiding on the chart by making the system like drag and drop for making trades easier.This system are available in new brokers would like to go forward with zerodha and please do the needful
Mobile aap chart trading kab ayenga?
360 chart trading kab ayega?
Sab broker me available hai kite zerodha me nahi.
Hi Arshad, TFC will soon be available on the app. We will keep you posted.
Sir option chain mai puri tarah samajh nahi paya. Alfa beta gama greeks ye meri samajh me nahi aaya. Kya aap mujhe detail me samjha sakte h.
Hi Abdulkadir, you can learn about option Greeks here: https://zerodha.com/varsity/chapter/the-option-greeks-delta-part-1/ For further clarifications, you can post your queries on our forum here: tradingqna.com and our team will assist you.
Please include scroll down with important symbols in search icon instead of manually entering.
Why can’t we see volume profile in index &
Why there is no io profile in chart ?
Trading chart beta version for option trading on mobile app kab tak aayega
.
Very good 👍👍 thank you
I am interested
Where I will get long buildup short buildup details in kite mobile app ?
Please add there change’ in Oi Also.
add basket options as well. So we can see ovrall margins and etc.
Hi Priyansh, we’ve noted your feedback. We’ll look into this. Thanks.
Help me how to perfect analysis option chain
Yes intrested
ஜிரோதாவில் கடன் வழங்கும் திட்டம் உள்ளதா அதில் நான் எப்படி கடன் வாங்க முடியும் அதைபற்றி விளக்கம் வேண்டும்
Ye kaam like hai
I like this feature but ye bahot pehle hi start ho jana chahiye thi
Very good application user friendly
Thank you very much.
I heard some days ago that new kite version is coming with more than 15 watchlist…. Any update on this update?
i like it new feature
Good
pleace try do order in main chart what is my p&l
please enable to place option orders directly from future or index chart at pre defined levels this will help and great to see improvement in zerodha you are lacking lot of functionality in comparision with dhan trade management on charts once zerodha use innovative but looks like taken back seat may be too happy with sucess.
Is it possible to punch SL & TARGET SIMULTANEOUSLY.
Hi Nageshwar, yes. While placing a regular order, you can place both Stoploss and Target using the GTT option in the order window.
I used GTT. But target is hit but not exited by the app or SL is hit but not exited by the app. Not at all trustworthy.
Good fro improvement
For technical analysis, charts are more important than option chain data.
Would be really great if weekly charts are displayed for every strike (CE & PE).
Hi,
Add the basket orders too , so that it is easy to check the margins and execution at a time.
Hi Rajesh, we’ve noted your feedback. We’ll look into this. Thanks.
you have missed out on the main feature of adding the option strike to basket using option chain.
We’ve noted your feedback, Chandrakanth.
Please add change in open interest also.
Please consider adding alert based on pnl. This will help users to get alert at right time for exit the trade.
Add (change in open interest inside OI)
i like it new feature.
Old option chain is best view for every segments.
OI and Change in OI is best part to every F&O trader for entry and exit…
This chain is new headache.
Is it possible to group the positions based option strategy. Like if we have so many open selling/buying options positions and want to group the positions based on its strategy (Eg. Position Group 1 “Strangle”, Position Group 2 “Iron Condor” etc.,) This will be beneficial to track the status / profit / loss within the strategy and helpful take decisions on exit the entire group / continue as the case may be. Kind request to develop this feature.
betterkite
Once again you missed two important change required. First most important greek is DELTA. It should shown in OI itself, next to OI itself. Other greeks may be shown in grgreek selction. Most required change is show option price in red if it is below previous day and blue if it is above previous day high for respective strike.
AND
Most required and very important indicator above all the indicators for intraday trading is missing—–VIZ Previous day close line on chart, Previous day High and low line of previous day on chart. Please provide this indicator urgently becaus Previous day high/low/ close are major decision points for intraday trader.
RAJ KUMAR JAIN
Ok its best
Make entry sl and target visible and customized on chart also for fast execution
Hi Pradeep, trading from chart feature is currently available on Kite web, on both TradingView and ChartIQ charts. We’re working on adding it to the Kite app too.
But it asks for confirmation and then it’s too late to exit.
fine but kindly ensure charts dont slow down due to this OI data addition
Add to basket option can be added along with add to watchlist.
Hi Hemant, we’ve noted your feedback. We’ll look into this. Thanks.
Please show the Greeks in Pnl page.
Jai hind sir ji
FnO scrips can be shown with different colour code so we know only those have option chain.. else the ”option chain” text to click itself can be made available only for FnO scrips
Few changes required.
1. Can you make PUT on the left side and CALLs on the right side. Its more intuitive that way.
2. Also can I see FUTures current, next, far next month somewhere in that.
can you make changes and redesig the basket order add strike price, changing expiry, lot size quickly from, drop down menu once added,
its a must feature, as searching everytime, and sometimes in hurry takes lots of time
Nice initiative. One more thing try to plot put and call combined chart in one graph
Please add a auto trail Stop loss
Hi Amit, trailing stoploss feature is on our list of things to do.
Can you make PUT on the left side and CALLs on the right side.
Otherwise it is so good and useful.
nop, this seems okay and industry standard, call on left and put on right
Profit and loos in the chart shoo the live trad.plase.exaplan