Managing your Script
Traders,
We are taking all your queries on writing your script/strategy on algoZ in the blog, “Code your Technical Analysis Strategy”. I have gotten a few queries like, “Once you have written a script, what next?” Though it is explained in the user manual, let me show you below how to take the strategy live, how to run/stop it, how to have a preset stop loss, and more…
In the simple example, we had used a really basic strategy which was on a 14-candle EMA. So, basically, the strategy is “buy” if the price of the stock goes over the 14 EMA and “sell” if it goes under. The problem with a strategy like this is that if you are looking at a 1-minute/5-minute/hourly candle, this crossover will happen quite frequently giving a lot of trades. In the simple example, we had gotten 823 trades over a 22-day period in the backtesting report which is pretty high by any standards.
To explain how to manage your script, I will use another example, the one that has been asked in the tutorial blog by one of you.
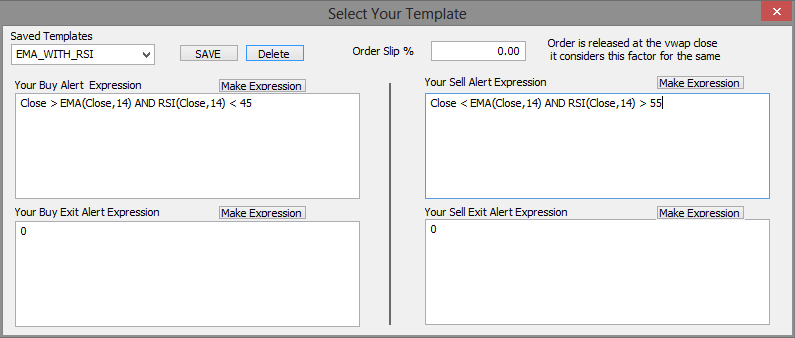
Strategy: The same 14 EMA crossover as mentioned in the example above, but we use RSI as a filter. Typically, RSI below 30 means that it is getting oversold and if above 70 it is getting overbought. So what we want to do is buy/sell on 14 EMA crossover but buy if RSI is below 45 and sell if RSI is above 55.
Here’s the script:
Buy Expression: Close>EMA(Close,14) AND RSI(Close,14)<45
Sell Expression: Close<EMA(Close,14) AND RSI(Close,14)>55
Buy exit : 0
Sell exit: 0
Contract: Nifty Futures.
The script window will look like this:
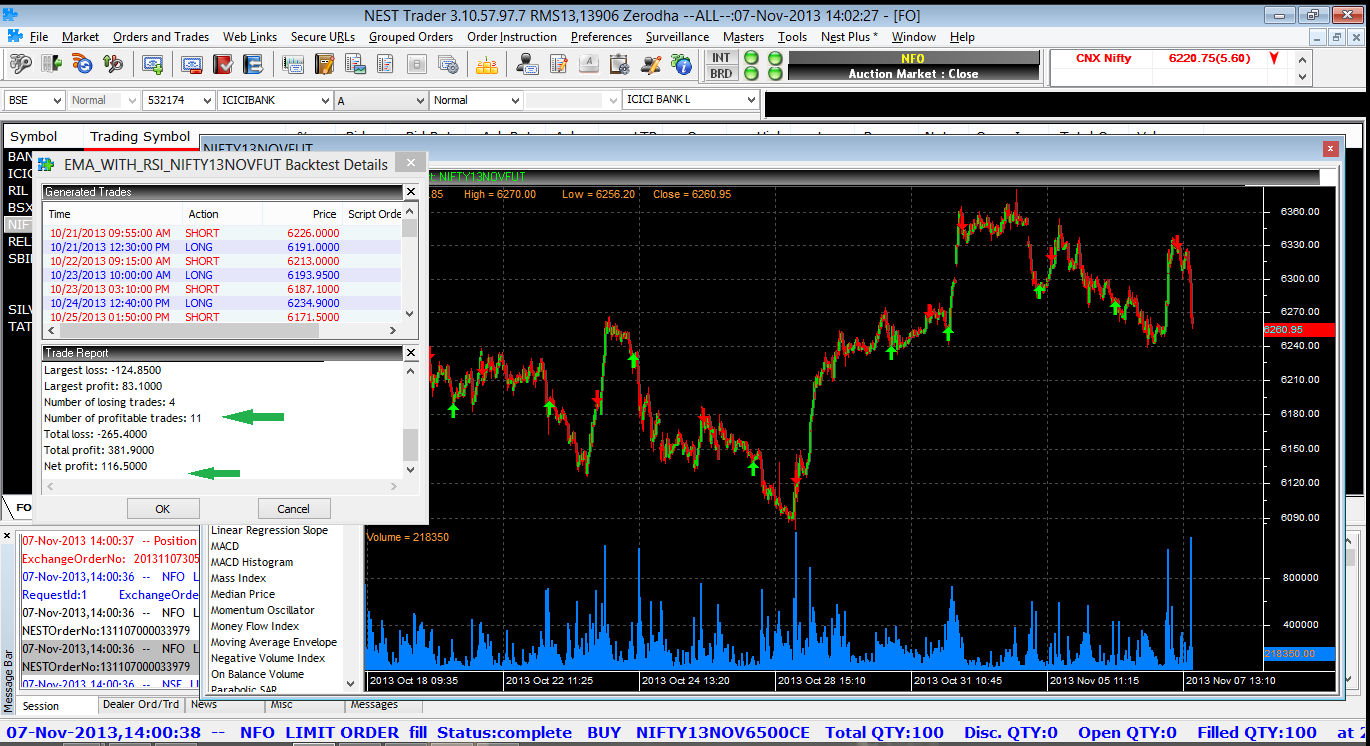
Backtest Window: You will see that by having the RSI condition, the total number of trades in the 22-day period has dropped from 823 to 19, but the net profit on backtesting shows only 43 points. See the pic below. Also, if you notice in the backtest report the largest loss making trade was 200 points and this could have been controlled at 50 points by having a SL which would have improved the profitability of this strategy.
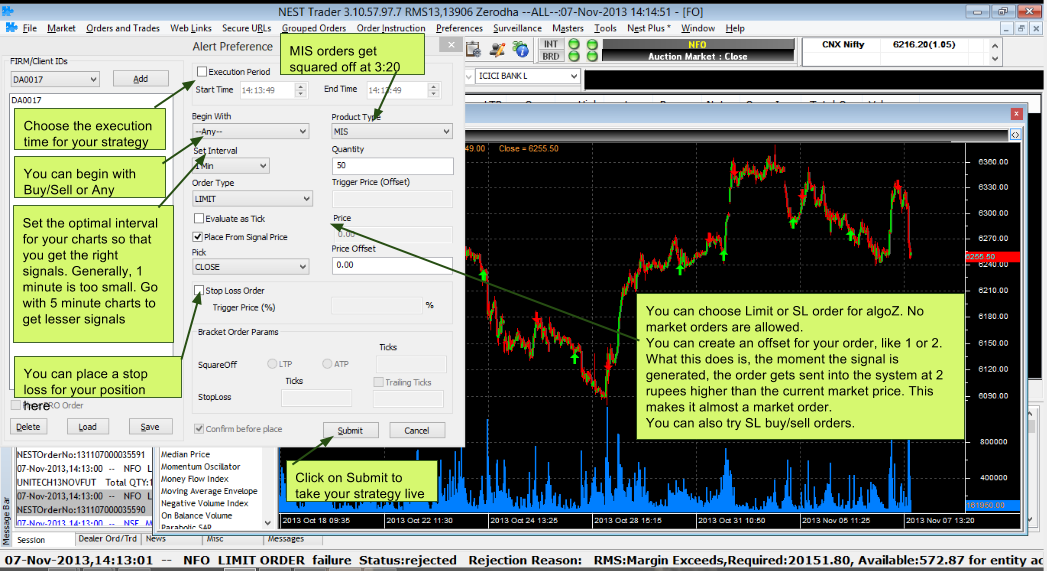
Taking it live/Alert Preference: As shown in the first example, when you click on the Live button you get a new window “Alert preference”, which is the menu to preset the Quantity/SL/Type of the order you want to execute when the strategy gives you a signal.
Managing your script once you have taken it live:
In the pic above, once you have clicked on submit, the strategy goes live. To see all the live scripts/strategies that you are running on your account you can go to the link shown below:
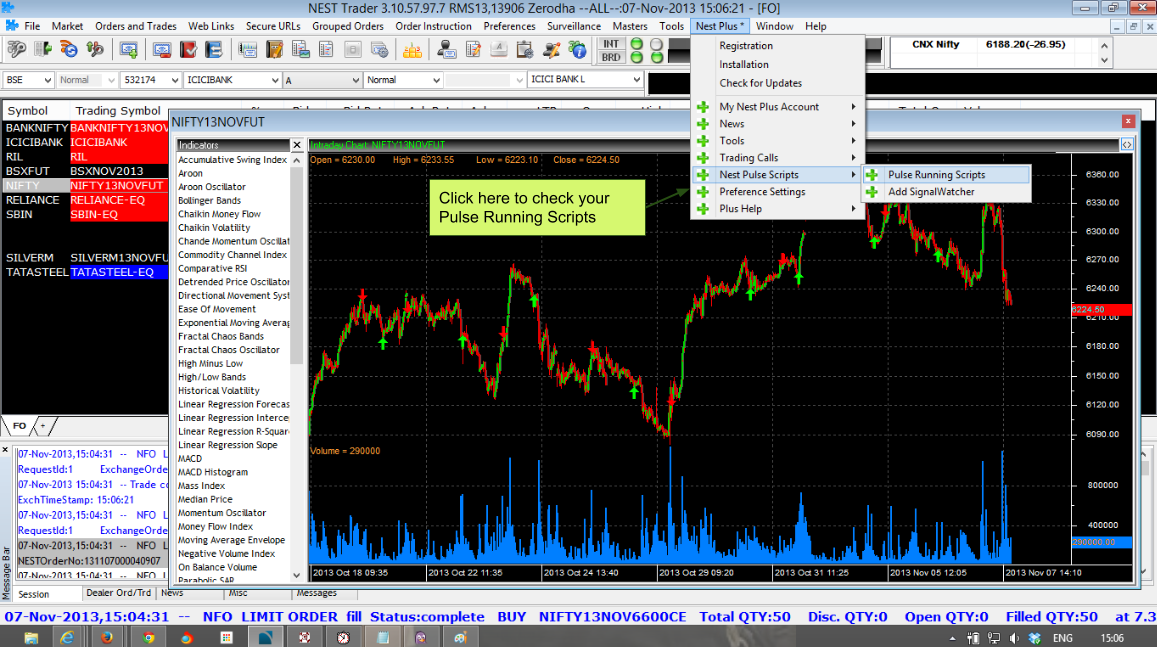
Once you click on Pulse Running Scripts you will get the window as shown below:
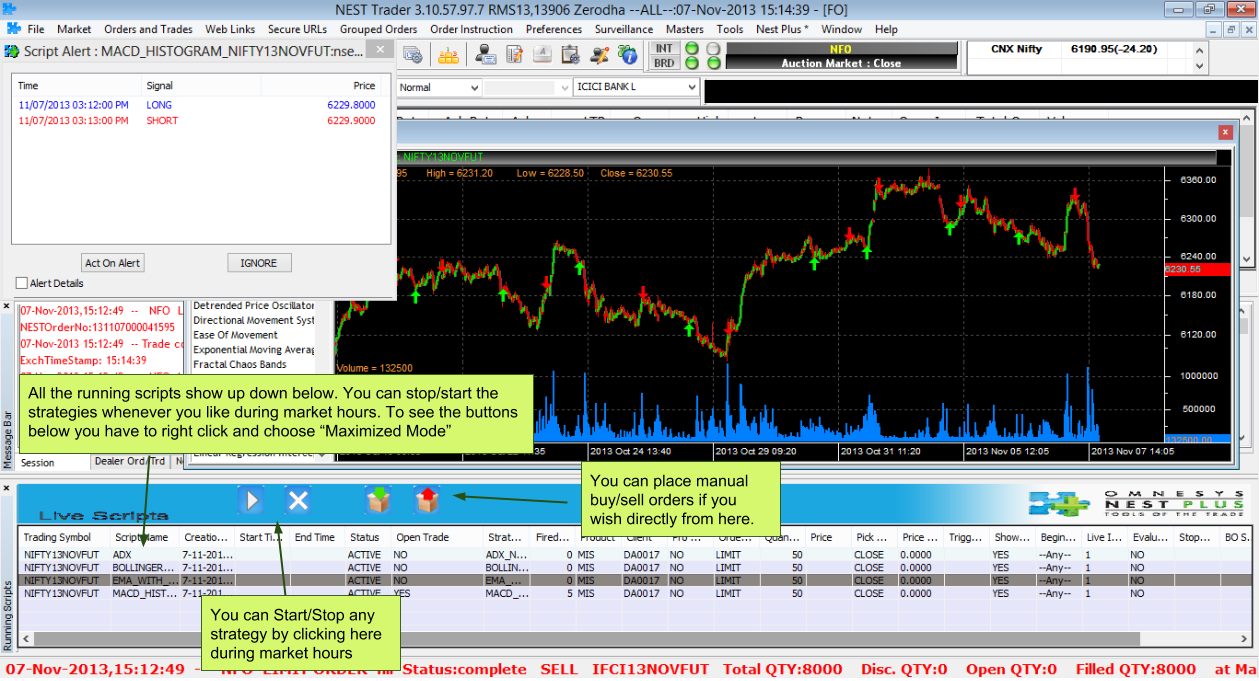
Once you have taken a strategy live, all you have to do now is wait for the buy/sell alerts to pop up. If you click “Act on Alert” an order is placed based on your alert preference as shown above.
Happy Coding,
Can someone tell me how to get days high or low
Hi,
Thanks in advance for your great help!
I need a script to exit NIFTY options BUY position at immediate market opens. Lets say if i bought 11500 CALL Options at Rs.50, While opening (9:15 AM) i wanna exit this script.
Since always i am exiting little late which makes me to loose my profit / Creates more loss
Regards,
Gokul Vel.
I need Algo code for below logic:
Buy when
Monthly RSI > 60
Weekly RSI > 60
Daily RSI > 35
Daily RSI < 45
Why Hathway is kept in BE script.Can you do intraday in this?
Dear Sir/Mdm,
Do you provide service for customize tradestation scanner?
Regards,
Alfred
hi, is there a code to find the highest of the last 21 candles while backtesting???
I need to backtest Renko chart intraday 5 minute chart with box size 15. Buy on first green candle and square off as soon as red candle appears.
Sell on red box and square off as soon as green candle appears.
Kindly give me script for above strategy to backtest in Pie
Best post your query here. A fellow forum member may be able to help.
No alerts on Pi Scanner>>
I have added the following code for BUY and SELL
1) BUY Script
REF(CLOSE,1)/REF(CLOSE,5)>=1.003 OR
REF(CLOSE,1)/REF(CLOSE,4)>=1.003
2) SELL Script
REF(CLOSE,5)/REF(CLOSE,1)>1.003 OR
REF(CLOSE,4)/REF(CLOSE,1)>1.003
But there are no ALERTS generated on the SCANNER.. The Alert Time is same for all the STOCKS symbol selected..
Why is the Pi Scanner not Generating Alerts? but when I BACKTEST this same script is workdin..
This is for 1min Bar Interval
Hi Nitin,
I need your urgent help – its very basic technique , I hope you will help me out ASAP
Technique:-
Let Suppose XYZ stock or Nifty 50
> Buy = when second candle (9:45 am) closes above the high of first candle (9:30 am)
same with SELL signal
> Buy = In a intraDay , if any 15 min candle closes above High of first 15 min Candle (9:30 am)
for eg:- we have a stock – its first 15 min(9:30 am) candle (open – 98 – High 101) then its start falling but in mid of day a rally comes , lets suppose 1:30 pm candle closes above High of first 15 min candle then a buy signal generates
same with SELL signal
Looking forward to your help
Thanks
Durga singh
I need a Expert advisor script to buy if price touches above 5 min candle opening range .Please help.
Best post this on Trading Q&A. A fellow forum member may be able to help.
Hi,
Is there any way in which I can put trade at a specific time?
Thank You
Not right now.
sir i need a atr trailing stops indicator function trade script in zerodha pi..
Best post your query here. A fellow forum member may be able to help.
Dear sir,
i need Pi script code for below condition,
1. first 5 min candle volume breakout by any next candle and last price grater than open and it should be above VWAP.
I am going with trex{2) strategy whenever it is above 0 i will buy and below 0 sell but the problem is i don t want to buy or sell at closing price to be specific i want currnt market price of the bar how can i code this trust it i bactested it
and it give 65% profit
so please help me to code it with more precious buy and sell current market price
i am entering trade for long with parabolic sar with setting of 0.03,0.0.2 my strategy is to exit with second candle with the buy of first candle with parabonic sar please code for me and yes the candles are heikin ashi with 1hour candle
hi zerodha
welcome.
9.15 high-9.15low=1% ( range =1%) and 9.15candle,9.30 candle should formed inside candle.
pls send pi code
Is there a way to to give reference of buy script into sell script.
For e.g.
My Buy script is:
CLOSE>REF(HIGH,1) AND RSI(CLOSE,14) >45
After my Buy signal is generated i want the sell script to be at some percentage point above my buy price and my exit long should be some points below buy price. How can i achieve this?
Hi Mr. Nithin,
Whats wrong in this script for Scanner? It generates an error..
CROSSOVER(BBT(CLOSE, 8, 1, SIMPLE),BBB(HIGH, 20, 1.5, SIMPLE))
AND
SMA(CLOSE,8,WEIGHTED) > REF(SMA(CLOSE,8,WEIGHTED),1)
You should post this here. A fellow forum member may be able to help.
Hi
Can any one please let me know
1) Using EA, which signal will be produced first, a buy or a sell ?
2) Assuming the first signal is buy & I executed the order, what will be the the next signal, will it be sell ? or it can be any ?
3) If answer is any then what is the maximum limit to produce back to back buy signals provided that all the signals are being executed, apart from the margins required.
AND
How the exit strategy can be automated in this case.
4) If answer of the query # 1) is “any” then
Writing an EA for buy & its exit condition AND a separate EA for sell & its exit condition, can there be a case where first signal is generated based upon the exit condition without having the actual trade in place. How that can be handled, do I have access to the last trade/order executed using the EA ?
Sir, please provide a button when handling multiple chart to open the chart in full screen.
how to put super trend and stop loss on pi script
please give me code which gives opening of stock which is more than yesterdays high or low
Best post your requirement here or check out Streak.
Hello Mr. Nithin,
I am a Zerodha user.
Is there any possibility i can see develop trade script and deploy to PI or Kite?.
my concern is, I wanted to see correlation of 2 or more potions and execute when its come a particular level.
Please help.
Best regards
Hi there
I am a trader and understand trading only. It is almost impossible for me learn new coding and create my own indicators.
Is there a PAID SERVICE within Zerodha (authentic) which can create a very simple indicator for me based on a one line formula I provide?
Your support will be highly appreciated.
Thanks
I need code for sell in 3rd Candle from buy candle..
ID ZU8722
(8608877088)
Need help on below strategy if someone can give the codes.
Buy
EMA 13 crossing EMA 34 and price should be above 55 EMA
RSI above 30
ADX above 35
Sell
EMA 34 crossing EMA 13 and price should be below 55 EMA
RSI above 80
ADX above 35
Hi,
I recently came to know about the screener functions and expert advisor functions in pi. Really amazed at it.
First of all, great job Zerodha <3 <3
Second, I have back tested a strategy with which im very comfortable.
It consists of 3 indicator scripts. Tried to incorporate into the screener but could'nt.
Seems like it will only take a single indicator script.
So, here's where i need help. I would like add all 3 indicators into screener.
Please guide me how to do it, if one could do it.
Third, is there by any chance i could link that screener to an excel sheet.
It would be very helpful for me if you guys can give me a solution.
(I have only tried implementing the screener during off-market.
Thanks in advance.
Regards,
Joshua
Buy for this condition
14 ema crossover and next candle will high previous candle
Sell – opposite above for zerodha pi
You should check out Streak, Kiran. Coding your strategy was never easier.
Hello, Can you help me with the script / coding for Average true range trailing stop loss??? And I see this is available only on Kites and not on Pi..
Hi. Is it possible to have for example script / strategy like : 6ema crossing 20 ema stop loss 10 pips or 10 dollars profit target 20. How would it look like? Also for example when I test it in trading view to see what percentage it wins
Mir, I suggest you check out Streak.tech.
What is the function to get current price(bid/ask) of symbol?
Let’s say I got a buy signal for ABAN at the close of the latest signal at Rs. 192.
Then, as per my question, how can I simultaneously get a Sell signal to exit the Buy at Rs. 190.08?
Is there any mechanism by which the price will be calculated automatically and give an alert (when used in EA)? Also, I need this for backtesting.
How can i access trade book by trade script?
How can I get price at which stock was bought/sold in my trading script?
Dear sir,
i want a coding for following condition
1.i want to find last 3 Macd histogram crossing with its 0 line
2.i want to find high price of share in macd histograme in \”+\” region and low price of share in macd histograme \’- \’ve region.
3.BUY when the share price goes above high of + ve region high of macd histogram and sell when the share price go below the – ve region low
if you want any clarification mean you can ping me in mail id i will send you the image for referance,
regaurds,
Mathan V.
Mathan, you can post this query here.
sir i have a account in zerodha,
i want few small coding each seperatelly,
1) share which fall continouse from last 4 days,
2) yesterday candle doji,
3) last day bullish engulfing and today share open > than yesterday close and below yesterday high, after that share cross up yesterday high, and share cross down yesterday close,
4) after making high and low at 10.15 or 10.00 am , like low is 90. rs and high is 100 rs , share comes to 95 rs and alert again crossing 100rs and when it touches 106 rs. for all share in market watch.
5) share crossing up or down 5 days norrow range.
pls give me coding i am not able to make them.
thanks in advance.
Can you post these on tradingqna.com
Is there any trainnig regarding options trading particularly in nifty and banknifty.
Pls send me details
Have you read through the F&O module here: http://zerodha.com/varsity/
Hi Support,
Trying to create scanner in Pi based VWAP. Below script is running but does provide the desire output.I am running this script on 5 mins interval for 5 day period
LAST > VWAP and VWAP> hhv(300) and VWAP > open
PS: I do not find VWAP indicator in Pi tool but it is available in Kite chart.
Can you please help me to find out what is wrong in the script
Hello,
Can anyone plz tell how to write a code for a 5 min bar moving 3% more?
I tried it like \”HML()>LOW*0.03\” but its not working.
(ref(high,1)-ref(low,1))/ref(low,1)>3% I tried this also.
Expecting for a fruitful reply.
Rajiv, you can post this on TradingQnA.
Im trying to develop code for following strategy buy getting erroe. Please help me out in correcting this.
Strategy: (Daily EOD Charts)
BUY if all following conditions meet
1. Current EOD close is greater than average of highest high and lowest low of last 5 days (counting current candle as 1st day)
2. Average of highest high and lowest low of last 5 days is greater than that of 10 days (counting current candle as 1st day)
3. Current EOD candle close should be greater than High of PREVIOUS 10TH candle (counting current candle as 1st day)
4. Current EOD candle should close above highest high of last 10 days (counting current candle as 1st day)
Code im trying to use is
SET A = (HHV(5) + LLV(5))/2
SET B = (HHV(10) + LLV(10))/2
CLOSE > A > B
CLOSE > REF(HIGH, 9)
CLOSE > REF(HHV(10), 1)
Im getting error as No results. Make sure that atleast Buy and Sell scripts are typed in.
Please revert asap.
My exit long will be
Exit when closed below EMA 34.
Can you post this on tradingqna, we are taking all these queries there.
How can I install pi and work through pi ?
Yes
Hello sir
can you help me to create a scanner of +DI crossover -DI of ADX (S,10, Close) for a time frame of 60 minutes, during last trading session?
………………with thanks.
Hello sir
can you help me to create a scanner of +DI crossover -DI of ADX (S,10, Close) for a time frame of 60 minutes, during last trading session?
………………with thanks.
Dear Sir
Pl give tradescript formula for supertrend
Not possible on Pi.
Hello sir
can you help to create a scanner of +DI cross over -DI of ADX (S,10, Close) for time frame of 60 minutes, during last trading session.
………………with thanks.
Dear Mr. Nithin,
i would like to use Pi artificial intelligent(AI) for trading.
can i use AI to close the existing portfolio?
kindly let me know
thanks and regards
Pi AI tool can be used for alerts to close portfolio. Not really exit is automatically.
Dear Nitin,
What are the minimum system specs which can successfully backtest expert advisor on Pi ? On my 5 yr old Vaio with Core I3 (?first gen,i\’m not sure …) 2Gigs of RAM, NVIDIA Graphics card,Genuine Win 10, 320GB HDD, the backtesting data is displayed,but the Chart does not display….
Regards And Thanks
Configuration is fine but I believe your are not selecting Backtest chart under data source box in backtest window, try that and if still facing any issue you can write to [email protected].
Dear Sir,
i am using zerodha pi for trading and when i back test any stratrgy like crossover 20 EMA to 50 EMA then if i want to enter exit long strategy above where i buy +200 point. then how can i do that?
EX.
if buying signal generate at 18300 and i want signal for exit long 18500(18300+200) how can i do that?
And if alert generate and i want that execute that automatic, is it possible with zerodha(any platform)?
You can\’t set the condition based on your buy price. Trade script will throw an error if you set such a condition. You can define the price & generate alerts using the price alert indicator.
https://zerodha.com/expert-advisors/code/price-alert-indicator
Dear Sir,
I want to work on MACD along with HA chart pattern, when both indicates buy it should be buy signal and when sell it should generate sell signal. kindly help me for code. As I have recently opened account at zerodha, much things are not known to me. kindly do the needful. I want to work on intraday plus 5 mins chart.
lalit, can you ask all your coding related queries on tradingqna.com
Dear Sir, how to get nest platform, i do have pi.
dear sir,
is it possible to apply strategy on market watch directly ?
Could you please provide the trascript setup on Pi for the following code:
MACD 12,26,9
CCI 10,-100,100
RSI 14,70,30
Hello
can u please provide me a trade script for screening days open = days high or days open = days low for intraday for pi module.
thanks in advance
Hi Nitin
Please give me your advise on following:
Which is the BEST TIME FRAME for the candles i.e. 5, 10, 15 or 30 mins for the HIGH reliability of alerts from \”Scripted Alerts\” and \”Expert Advisers\” for INTRADAY trading?
Thanks for your valuable time.
There is nothing as such like one best timeframe for intraday trading, it depends on individual, scrip, overall volatility, risk reward ratio and various other factors. Best way to find it out is via experience. Also can check this http://tradingqna.com/ for more answers from experts on coding and market related stuff.
Hi Nitin
I need your comments on this:
Back Testing of Script
1. Why the back test always generates orders at the close price of the Candle when the script conditions are met, even when I do not tick the option \”At end of candle\”?
For example for the script CROSSOVER(SMA(CLOSE,7),SMA(CLOSE,14)), orders are always generated at the close price of the candle when crossover takes place. This happens even if I use \”OPEN\” as the VECTOR in the SMA script.
2. Whether this script will also generates alerts at close price when put to LIVE MARKET? If no does it generates alerts, at any given moment of time when crossover actually takes place?
Kindly explain the logic of the working of the script in LIVE market.
Thanks
1) It is because if the conditions are met same signal can be generated any number of times during the candle formation and it does not make any sense to get back-test results based on that.
2) In live markets, the alerts are generated when conditions are met, but when selected at close of candle signals are generated approximately at close of candle but for sure only once signal will be generated for the same candle.
How to check all the stocks under NSE with RSI below 30 at 9.30 and buy the top 5 stocks and to check all the stocks with RSI above 70 at the same time?
You can use scanners on Pi. You can use this code: https://zerodha.com/expert-advisors/
SIR
ALGO Z IS AVAILABLE ONLY FOR F&O AND NOT FOR EQUITY INTRADAY ?
BRACKET ORDER CAN BE INITIATED THROUGH ALGO Z ?
ALERT PREFERENCE REMAIN SAME FOR ALL STRATEGY OR IT CAN BE SET ACCORDING TO EVERY STRATEGY WISE
There is no more algoz. On our desktop platform, there are EA\’s now. Check more here. Brackets can\’t be initiated through this.
Nitin Sir,
Gd Evg….
I am new to Pi….
Could u plz give your favourite script for intraday trading ( Future Script Only )….Which I can copy and paste in Artificial intelligence and try to work out on it….
Hi Nithin,
Can we generate the below strategy for BUY Signal?
Todays Volume>1500000 shares
Relative Volume > 5
Float 200 %
Todays Range >150 %
Thanks in advance.
aarthik, only technical indicators can be coded and that too only on price. What you asked is currently not possible.
Hi Nithin,
Can you please give me the formula for the market watch with the below filters?
1. Stocks with price less than 500 rupees
2. Stocks with float less than 1000000
3. Stocks gapped up 5% from yesterday\’s close.
4. Relative Volume > 2
5. Volume 5 min %
6. Today\’s Volume (Shares)
Ah.. these things are currently not possible. Tradescript allows you to code based on technical analysis only.
can we have them as BUY signal instead?
hello Nitinji,
The market depth shows only the best 5 bids and offers.
International brokers like ThinkOrSwim do give tape data where in the name of best 10 buyers and sellers are shown. Is it possible to implement the same in Pi ?
In India exchanges don\’t share market depth data more than 5 to brokerages. You could go out and try if any data vendors provide this, this requires level 3 data from exchanges which costs quite a bit. More here.
Buy Script:
SET MA1 = SimpleMovingAverage(CLOSE, 28)
SET MA2 = SimpleMovingAverage(CLOSE, 14)
CROSSOVER(MA1, MA2) = TRUE
I want to to test different exits
1. Stop Loss if price goes down by 1%
2. Take Profit if price goes up by 2%
3. Exit when the gap between MA1 and MA2 reduces.
please help code the exit.
Also is there a way to carry the entry price from the Buy script to the exit script.
Can you post all coding related queries on : http://tradingqna.com/
Nitin Kamath,
I have a simple strategy. But I dont know how to code. Please help me.
Suppose Market is 7000. My strategy is to
buy at 7010.
Buy sq. Off at 7000.
Sell at 6990.
Sell sq. Off at 7000.
Please provide code for pi.
Thank you.
Vimal, on Pi you can\’t code strategies like these. They are all more for technical analysis based.
How can I use a script to run on multiple stocks that generates alert whenever a stock fits that script. For example I have a price volume script that alerts me when there is 2x volume traded on a stock. How can I use that script to tell me which stock is being traded at 2x volume instead of just placing the script on 1 stock.
You can use scanner with the same code and add your list of stocks to it.
[…] The following introduction is taken from TradeScript Use in trading terminals […]
Is there any function for previous day close,high,low,open ,volume in Pi trade script?
If not then how to write them?Please suggest.
Hi Nithin,
Is it possible to send alert via email when the coded trading strategy is triggered. For working people like me, it would be of great help, if we can set an e-mail alert.
-Midhun
For now it isn\’t available. Do understand the convenience it provides. We\’ll pass on the feedback to our developers.
Hi Nitin,
How can create scanner or back-testing buy script based on days same open and low price on hourly candle and vice versa.
Buy if days open and low price is same on hourly candle with 2x buy volume than sell volume.
Sell if day open and high is same on hourly candle with 2x sell volume than buy volume
Thank you
Monal, ask your coding related queries here: http://tradingqna.com/algos-strategies-and-code.
Also, any bridging with Metastock in future ?
Yes, we will start working on this soon.
Hi,
Need help in following:
1) In back testing, need to know the code for \”Exit Long Script\” if I want to exit at xx% of Entry value.
2)There are no Buy and sell symbols generated when i run my Expert advisor.
Thanks and Regards,
Amit
1. You can\’t really code a x% of entry value.
2. When running EA, you don\’t get a buy/sell symbol, you get alerts on the generated alerts window.
Dear Nitin,
We are high frequency trader in NFO
I went through your site and we are in process to implement fully automated algo.
As per our strategy requirements we need tick by tick or you can say trade to trade data to form moving average calculation say tic by tic MA of XXX tics.
Same way we need tic to tic volume data. (to set as on certain volume to trigger strategy start to run)
So is it possible with your platform ?
If yes we would love to avail your services.
Sunil, if you are looking at high frequency trading using tick by tick data, you can\’t really get access to tick by tick data over the internet. To get tick by tick data you will need to be on our colo (host your computer on our rack within the exchange). NSE colo charges are quite expensive, the running cost of a setup like this including server, colo charges, API charges, can run upto Rs 70k to Rs 1lk per month (apart from the brokerage). If you are interested, send an email to [email protected] with your contact, I will get someone to call you back.
IPO apply service is available on zerodha? in early 2014 it was posted that in a couple of months it would be started, but I dont see that yet.
Online IPO not available yet. This will take longer.
Nitin,
Can you please send a link for a write up on how to \”Managing your script\” in Pi ?
I am unable to enter the exchange in the box provided in alert screen of Pi.
Please help.
Rajan
Yes Rajendra, looks like a small bug on Pi. But as long as you are putting up the right contract name in the top box, disregard what you mention at the bottom left. It takes what is on top by default.
I am not able to run zerodha trader platform on my windows 8 system. I am getting error as shown in screenshots attached.
Looks like your root folder of Zerodha Trader has been modified or you have a very meddling antivirus software. One of our tech experts will get in touch with you soon and help resolve this.
1.For Buy :Ema13 crossover Ema 34 .
2.Macd : only 12,26 value should reach above +0.01 to 0.35 which can be adjusted in parameter window.
3.RSI(14) : above 40 to 60(only). which can be adjusted in param window.
If any two condition satisfy on same candle but third conditon doesn\’t satisfy then in next 2 candles should be taken into consideration.(Again it should be adjusted in param window) BUY ARROW WILL COME.
For Sell : Ema 13 crossunder ema34.
2 Macd : only 12,26 value -0.01 to -0.35
3.RSI(14) : from 70 to 50(only) which can be adjusted in param window.
If any two condition satisfy on same candle but third conditon doesn\’t satisfy then in next 2 candles should be taken into consideration.(Again it should be adjusted in param window) SELL ARROW WILL COME.
Trailing stop loss: 1% from the trade buy/sell signal generated.
Target : 1% or trailing stoploss.
Time Frame:1min, 5mins.10min,15min
Can you ask this on tradingqna under the algos category. Also tag the question with tradescript.
what is the supertrend trade script ??
hi could you please help me with script which would alert me after three consecutive higher/lower closses.
Regards
Amit, can you ask this on http://tradingqna.com/
what is the supertrend trade script ?
Dear Nithin,
I am a frequent trader in Options. Generally, I short sell options and I hedge my losses in call/puts by either buying or selling the futures.
For eg, if I short sell Nifty 8800 call and Nifty moves above 8800, I buy Nifty future to hedge the loss and when Nifty moves back below 8800, I cover my long position.
Can there be an Algoz script to auto execute my trades ?
Regards
Niket Sampat
Niket, it won\’t be possible on tradescript, but if you are using any professional programming tools like Python, C#, AFL, etc it can be. You could even do this on an excel. You will need to have programming knowledge for that.
Do you have code that integrates Amibroker with zeroda application
For our new trading platform which is in beta, \”Pi\”, we do. Check this post.
1. What do i need to do to become AP?
2. What is the approx running cost of Amibroker? (Cost of software?)
1. Check this.
2. I think between Rs 1000 to Rs 2000 monthly for data feeds. Check out Global data feeds or Neotrade, they both have special deals for Zerodha clients.
then how to set the targets to exit ? i have target as some price movement based on some % of Opening or closing price of a candle stick.
What is AP ?
AP means authorized person, similar to a sub-broker. If you want to code more complex strategies, I guess you can give a shot at Amibroker or Ninjatrader. Tradescript will let you code only technical analysis strategies. We have just launched beta of Pi, our new trading platform. We plan to customize tradescript to be able to do this, but it will take a while.
i do not hold zeroda account;
i have a strategy which works on 2 min candle stick.
if the price is moved above the .6% of opening price of the first 2 min candle stick then buy and target being 1.2 % of the opening price of the first candle stick
ex : opening price of 1st candle stick is 100 at 9:16 and at 9:18 or whenever the price reaches 100.6 i will buy and selling it when the price reaches to 101.2
1. can this be coded ?
2. where do i need to put this code ?
3. whether the system gives only the buy and sell signals or even it can trade automatically ?
please advise
888 489 9364
Shashi, buy above 0.6% of opening price of first 2 candles is possible to be coded. Target as 1.2% of the opening price is not possible.
The system gives buy/sells signal, we have auto trading facility but not for a retail account. You will have to register with us as an AP.
Hello Nithin,
What\’s wrong with my script below. I\’d like to buy/sell, if the OPEN is between 0.5 % and 1.0 % compared to the previous day\’s closing.
(((OPEN > REF(CLOSE,1) * 1.005) AND (OPEN < REF(CLOSE,1)*1.010) OR (((OPEN REF(CLOSE,1)*0.990)
Thanks
(((A > REF(CLOSE,1) * 1.005) AND (A < REF(CLOSE,1)*1.010) OR (((A REF(CLOSE,1)*0.990)
Hi, I am new to zerodha algoz. Infact my Algoz account has still not been activated. Have just sent an request to the admin to activate it.
Do you have any video tutorial on how to activate this and how to use Algoz effectively? It would be great to know about this. Kindly let me know. Thanks.
algoz/pulse is no more supported by our existing tech vendors Reuters. We are about to release our new trading platform Pi which has a much more advanced version of the same. We will have something out soon.
please code
rsi (14)crossover on it\’s moving average 9 . upside and downside crossover
u cant actually overlay RSI over SMA/ EMA in nest plus chart. But coding is possible
Code-
CROSSOVER( RSI(Close,14), SMA(CLOSE,9) )
Indicator crossover is not possible in nest plus but the code will work.
Hi,
In Pi charts, one of the indicators is Ease of Movement.
I want , if possible, the following :
1. Allow me to see the indicator in the form of a HISTOGRAM.
Thanks,
Rakesh, the customization of indicators on Pi, we will do after the final release.
What are the internal time lines for releasing final version ?
Before Dec 31st for sure. 🙂
Great,
All the BEST
Can you help me code the following :
Indicator : 14 Period Ease of Movement
Buy
Condition #01: when indicator turns up from -ve to +ve, mark HIGH of that particular price Bar (the signal bar)
Condition # 02: Buy once that HIGH is crossed
Sell
Condition #01: when indicator turns DOWN from +ve to -ve, mark LOW of that particular price Bar (the signal bar)
Condition # 02: Buy once that LOW is broken
Buy Stop :
Low of the Signal Bar
Sell Stop:
High of the Signal Bar
BUY-
EOM(CLOSE,14)>0 and LAST> Ref(HIGH,1)
BUY exit-
LOW
SELL-
EOM(CLOSE,14) Ref(LOW,1)
SELL Exit-
HIGH
I want for PI.
Is this code valid for pi?
Yep, it is the same scripting language, \”Tradescript\”
In new version Pi , parabolic backtesting is giving wrong signal . backtest signal are not macthing real chart signal. please verify it. It\’s better to plot backtest signal in the main chart , not in a seperate window. main chart window candles are not matching
backtest window candles
Will check this out Manu and let you know.
Ticket #361180 account id- DR2148. Still not able to use algoz due to some registration issue with nest plus. waiting for around 1 month for this issue to get resolved. Request your intervention for getting this resolved. Lost faith in your support team. Every time I check with them they give the same answer \”We will fix it in 3-4 days\”. But, no solution yet. There are times the support team is not replying to my queries posted in the ticket. For instance no reply is there from support for my last query till now.
Ramu, some issue with algoZ from NEST side. I\’d say get on the beta release of our new platform PI, it has the same scripting language. Check this post on Pi. You can send an email to [email protected] asking to enable you for the beta.
Thanks Nithin
Is it possible to trade using the PI beta? If so, is it advisable to do so while the product is not yet lauched?
Yes Ramu, you can trade on NSE, NFO, NSE-currency.
please code below strategy
Long positions should be closed when the price sinks below the SAR line,
short positions should be closed when the price rises above the SAR line
Can you ask the question here: http://tradingqna.com/ in the algos category.
I ASKED IT BUT DIDN\’T GET ANSWER. CAN YOU PLEASE CODE IT
I am using parabolic SAR however, Its giving me weird results
CROSSOVER(CLOSE, PSAR(0.02, 0.2)) = TRUE,
I want to use this for both Buy/Sell, and Buy should signal only when stock price is above Parabola and Sell should signal only when stock price is below Parabola. Please suggest
Thanks in advance
This should work for you.
Buy:
CROSSOVER(CLOSE, PSAR(0.02, 0.2))
Sell:
CROSSOVER( PSAR(0.02, 0.2),CLOSE)
For Buy Exit and Sell Exit, please enter 0
Backtest and then go live.
MY ID :RB0701
Hello zerodha Team,
I want to know Supertrend code which I want to backtest and live on algo z..
Super trend, can\’t really be coded on algoz.
MY ID :RB0701
sir can u write one another strategy for me..?
A=yesterdays High -yesterdays Low
B=A/3
Buy= yesterdays closing + B
Sell= Yesterdays closing – B
Hello,,Sir…plz write strategy for this if it is possible..
Karen, Can you ask the same on http://tradingqna.com/ in the algos category.
Hi Nitin,
In my previous post i asked for US commodity trading time and u sent me this link http://www.cmegroup.com/ but i am unable to understand the timings. I cald zerodha customer care they even doesn’t know the exact timing. I heard that metals,agri,energy commodity starts at different timing in US. So kindly update me only,when Crudeoil opens in US market in Indian standard time (IST). Please help me out for this query. Thanks…………………
Om, this is the link http://www.cmegroup.com/trading_hours/ , it has the start/end time for all the commodities. So if you visit that page and check for energy, you will see Crude oil, and you will see Open outcry from 9.00 – 14.30 ET (Eastern standard time), that is basically the open and close time. 9.00 AM EST is basically 7.30 PM India time and 14.30 EST is 12 midnight India time. But this changes when daylight savings is taken off, at that time it becomes 30 minutes early, 7pm IST to 11.30PM IST.
Similarly for all the other contracts, you just have to do a little research.
Hi Nithin,
Could you please write a Intraday stradgey for me , my conditions is very simple , Buy only when RSI is below 25 OR RSI above 50 and less then 60.
I would like this should be semi automatic .. iI just need to generate only Buy Signal then i will decide to buy or not .. for selling i would like to do manually exit .
Can i apply this script for group of scripts which i would like to watch for?.
REgards,
Venky.P
Venky, already asked and answered here, can you check.
YOu can\’t apply for a group of scripts on ZT/NEST, but you will be on our new platform which is in beta presently, \”Pi\”
Dear Nitin,
I have a script and when I go live for 7 min time frame, alert pop up for buy/sell shows for 1 min time frame ,why ? I have tested for 5 min time frame 15 min time frame , I am not getting correct time frame live popup.
Venkatesh, we are stopping support for algoZ. We are launching a much more advance trading platform called Pi. Check this out. I\’d ask you to wait for a couple of weeks, can answering all your queries on coding on Pi.
Hi Zerodha,
I am interested to purchase NEST PLUS API. Can you let me know the proceeds..
Mohamed Maideen M
934 509 6914
Siva from our team will call back.
can u pls write a code for this,
Buy when- MACD Histogram 26,13 and period- 9 is above Zero.
Sell when- MACD Histogram 26,13 and period- 9 is below Zero.
Thanks in advance.
Buy:
((MACD(13, 26, 9, SIMPLE)) – (MACDSignal(13, 26, 9, SIMPLE))) > 0
Sell:
((MACD(13, 26, 9, SIMPLE)) – (MACDSignal(13, 26, 9, SIMPLE))) < 0
Sir, can we create algo expression for pure price based charts like renko instead of time frame charts.
can u let me know the strategy, we can give it a shot.
Hello Nithin ji..
I am a software engineer, my ID with Zerodha is DD0793, in order to use my technology to predict market, I need the bar chart from nest plus to Excel.
So that excel I can use to code my logic in my technology.
Please suggest me the way of linking data
from nestplus chart to excel continuously.
You input will be of great help.
Thanks,
Durai.
There is an option to link NEST to excel, do send an email to [email protected]
@Nitin:
I need some clarifications on AlgoZ.
I\’ve a strategy EMA_Crossover. Here when I tried Backtesting, trades were taken weirdly. There are more Entry Short positions than Exits. Similarly Long positions.
My script is very simple. Enter at one cross over and exit at other cross over. I\’m not sure why there are different number of entry and exits in Backtest result.
Here are my doubts:
1. How do I set target profit for each trade?
2. How to back test multiple symbols?
3. How to force entry at open and exit at close?
Regards,
Ravikiran.
Kiran, This is our new in house platform: https://www.youtube.com/watch?v=Pd66QOQwykQ , if you can give it a couple of weeks, you will be able to run backtesting/Scanners/alerts on this. Much more advanced than what we have right now. We will very soon not be supporting algoZ.
Hallo Nithin How To Wright Pulse ALGOS ZIGZAG Indicator Formula Codes ?
Dear Nithin,
I was wondering if the upcoming terminal from zerodha, will have the WEB platform as Z5, with chart\’s, EMA & RSI levels, enable in it for back testing??
Sam for now it will be a desktop application, the web will be released in due course of time.
dear sir,
Is Algoz facility (partial automation) is available for mcx trader terminal ?
Not as of now.
Hi,
I am new to this trading system. how will get to know if the stock is over bought or over sold in ZT??
Sam, Overbought or Oversold are conditions that you will have to determine. If you tell the conditions, they can be coded on algoZ
Hi,
I read a lot about the algoZ and other related stuff on this page, I am new to F&O trading and need to know if there is any training available which can be used for my benefit. I need to gain some confidence before I get to trading.
we have something coming up, but it might take a while.
what u charge for algoz service sr?
Hi Nithin,
The ALgoz system is great, I really appreciate that I can write my own strategies and take it live. I just spoke to your support staff right now. Looks like we have to take the strategy live on every script individually everyday, For example if I have 4 strategies and 10 positions I want to take live. I need to do this 40 times individually every morning. Please advise if there is a workaround or if this can be implemented in the future versions of NEST trader
Nikhil, we are hoping to have a fix for this in the future release.
Hi,
I tried copying and pasting the same code you mentioned in the article but I keep getting the error when I try backtesting the code : Backtest Scrip Error, Scrip Generated No Trades. I have the same error when I write down my code. I think it might be the following reasons : 1) I dont have Algoz or 2) I am testing this after market hours. Please advise
Can you send an email to [email protected] asking to enable alogz on your account.
Can One save the strategy of n number of scripts on logout?
Can one open the same strategies of n number of scripts on login the next day?
thanks.
The strategy can be saved, but you will have to re run it once you logout and log back in.
Hi Nithin,
Is the Beep sound feature enabled on the newer version ?
Yes, the beep sound is enabled on the new version of ZT. Go to Preferences (Ctrl+P) and choose the \”Event\” section. On that you can choose to receive Beeps for various kinds of events like order execution, cancellation, etc. on ZT.
Well actually I did activate beep option on latest ZT terminal..but it doesn\’t work.Also i asked CC abt it and der rply is :
Dear vinit,
Thank you for writing to Zerodha Support.
There is no beep sound feature activated on the latest version of Zerodha Trader 3.11.2.1.
how to calculate Change in OI using nest trader data?……please explain
how to place order using excel………?…….any external programming or api needed?
Any specific hardware/software requirement for the same?
Any monthly charges?
thanks
There is a Plus API using which you can trade from excel, will cost you around Rs 300/month. Send your query to [email protected], he will send you the API docs.
How do I delete or stop a running script once it is running? Also can I edit a script that is running? If I edit the script, will it also reflect in the running script?
sir, is it available in commodity, if yes then pls activate it on my id dv1063, pls reply.
No Vijay, not available for commodity trading.
How do I code a standard Slow Stoch based algorithm i.e; buy when slow stoch moves from oversold region and sell when slow stoch moves from over bought region.
Also, is it possible to code MACD divergence strategies.
sir, is it available in nest 3.11.2.1 version. If yes then pls activate it on my id B0462
I have tested almost all algo Script and all are generated false trading alert. I have purchased algo script from Nest plus for Rs.2000, even this script also generated false trading alert and I have raised the ticket to fix this issue, no one from Zerodha and Nest team take responsibility on this. They are simply playing with retail investor money.
I suggest to all Zerodha clients to stay away from this Algo script.I also welcome the feedback from other zerodha client to make sure about my feedback and also make awareness to other client to away from this.
Palani, what we offer is completely free and it is tough to have issues fixed with a vendor product, one of the reasons why we are focused on getting our new platform out as soon as possible which is built in house and should be much better for scripting and backtesting. If you have paid Rs 2k to Omnesys for this, you would have to follow up with them directly for this, we will have no track of this payment you have made to them.
When do we expect ZeroDha Platform ?
Hi Zerodha,
I have tried your algoz and I believe this algoz is full of bucks and unreliable trade and poor liable back test result.It completely unreliable, its triggered trade even though strategy is not fulfilled and not to trade when condition is satisfied.
example:
I applied the strategy for two script.If any one script condition satisfied both script order is triggered. and aslo many unreliable trade.
could you please investigate further?
Palani, we have been investigating on this and within a few weeks you will have something available that is a lot more advanced.
Hi Akshay,
It works now.Thanks for your help.However I dont want to initiate fresh order as I place\”0\” on buy exit and sell exit.
Is there any way to stop the new fresh order from buy/sell exit field?
Hi Nithin,
Please help me to code my below strategy,
buy: High of last previous three candle stick with reference to current bar(4th candle)
sell: Low of last previous three candle stick with reference to current bar(4th candle)
This is working properly.
Buy:close>ref(hhv(3).-1)
sell:close<ref(llv(3),-1)
Sorry typo…need to have 1 instead of -1
Buy:close>ref(hhv(3).1)
sell:close<ref(llv(3),1)
Hi Nithin,
I have couple of queries w.r.t AlgoZ :
1) Can we build in various stop losses (like : Initial stop, Profit target stop, Trailing Stop)while coding the system ?
2) Can i use the Martingale strategy of doubling trade quantity, every next trade, using AlgoZ ?
3) At any given point, how many stocks can be traded using AlgoZ ?
4) Does it allow different strategies for different stocks to be run at the same time ?
5) How many days intraday data is available for back test ?
Thanks,
1. You can have an exit and stop loss condition while coding.
2. No
3. Depends on your system/internet speed, and since it requires charts
4. Yes
5. 22 days for now
Thanks.
6. Can i have buy/sell signal on Nifty but trade, accordingly, in options ? For buy signal, BUY Call and for SELL signal , BUY Put..Possible ?
7. Can we build in Trailing stop loss function in to strategy ?
8. Can a bracket order be initiated from ALGO signal ?
sir, waiting for your reply.
Thanks,
7. The coding interface gives you Buy, Sell, Buy exit, Sell exit. So you can code a Buy with a Buy Exit which could be your SL which can also act as a trailing SL (but note that it cannot be an absolute value, it has to be some kind of strategy). Similarly you can code a Sell strategy
8. No, for now
Hi Nithin,
Is it possible now to initiate a bracket order from an algoz script?
I have new ZT and BO enabled. I tried submitting a BO after hours
(from algoz script) and it looks like it gets submitted. But since
auto square off is already over I get errors regarding that.
(Rejection Reason: BO: auto square off executed)
Could you please confirm if I can initiate a BO order from algoz?
I am trying this on NIFTY Futures.
Another question is: Is the square-off & stop-loss values for BO in
\”alert preferences\” window is TICKS only? Should I be putting 200 instead of 1.00 for nifty future?
Thanks,
Kars.
Kars, I\’d suggest you to not use BO from algoZ. I will have that disabled immediately in any case if you are able to place now.
Hi Nithin,
Please help me to code my below strategy,
buy: High of last previous three candle stick with reference to current bar(4th candle)
sell: Low of last previous three candle stick with reference to current bar(4th candle)
Assuming you want to buy/sell above the highest high/lowest low of last 3 candles.
Buy:close>hhv(3)
sell:close<llv(3)
I have backtested above code , but got error message \”Backtest scripterror:Error:Script generated no trades\”.
Could you please help me to fix this issue?
Hi Kamath,
Please code me for my strategy and this is for 30 min candle chart
consider 10.30 to 11 clock candle stick
range = High – low (10.30 to 11 candle)
buy= High of the 10.30 to 11 candle
sell = Low of the 10.30 to 11 candle
Buy Exit(target) = buy + range
Sell exit(target) = sell – range
Palani, in the present version there is not time function as such, so you cannot define a time point to buy. But our new platform that we are working on should have this.
Cheers,
Hello Nitin,
I am a beginner so it may be a silly question but please tell me, where I can write and implement all those scripts you are talking about above and want to know is there any way to buy and sell automatically with help of these scripts?
Thanks
Praveen
DP0972
Check this post, shows you how to initiate the interface to code strategies. Buying/selling automatically is not something retail is allowed in India.
Hi Nithin
I have coded a strategy. I have back tested the strategy with 5 min chart and it works fine. When i am putting it live on the 5 min chart, the pop up also gets triggered in the 1 min chart too. That is really creating a trouble for me. Suggest me a solution so that the strategy works only on the 5 min chart.
Dear Nitin
Can you write strategy for
Buy :Increase in OBV at least 100000 than OBV of previous period.
Sell: Decrease in OBV at least 100000 than OBV of previous period.
Thanks
Rajeev:ID DS2513
Buy script:
OBV(close)-ref(OBV(close),1)>100000
Sell script:
OBV(close)-ref(OBV(close),1)<-100000
Dear Nitin
The signal generated through above strategy and many other strategies are not correct signals when I do back testing.It seems the programme itself is faulty.It does not take cognizance of defined scripts correctly.One can not do trading based on these faulty signals.Sir we dont want a thing in charity that does not work.Lot of money is at stake continued losses can lead to stoppage of trading.Is any trader trading actively using Algoz strategies and making profits consistently.Why cant you post some successful strategies that works at least 75% times on algoz or provide plugin from metastock and amibroker AFLs for generating semi auto trading signals on your trading platform.
Please reply.
Thanks.
Rajeev
Sir
Can you please code this strategy for me
BUY – When 12 periods RSI 65 EMA crossover vice versa
And also tell me if i put only Buy or sell expression can I sold or buy that manually.
Buy: crossover(rsi(close,12),65)
Sell: crossover(65,rsi(close,12))
Yes Avinash, algoZ is semi automated, so order placing still happens manually.
Cheers,
Nithin I would like to manage below show script. can you help me out.
buy:Close>EMA(Close,14) AND RSI(Close,14)EMA(Close,14) AND RSI(Close,14)<55
1) using support and resistance lines order should generate.
2) when the market is in sideways the order should not generate.(is there any option the using upper line and bottom line.) the two lines are placing by manually.
3) when the market is moving one (up are down) directions consider last 2 candles % high and low. then generate a signal.
what are the possibility's and can we manage the script like this.?
Didn\’t get what you are trying to do on the script. Can you explain me the buy logic firstly,
1. Orders will generate based on the conditions in the script, so you will have to write the code for what you think is support/resistance linke
2. Again, you will have to define what you mean by market is sideways
3. You have to define by what market is going up.
sorry Nithin,
i will send you mail. what i am expecting explaining with chart. i have one more question.
Buy is when Stoch(14,3,3) cross level 20 from below.
Sell is when Stoch(14,3,3) cross level 80 from above
can i have code for this indicator.
Sharan,
Buy: ((Ref(SOPK(14, 3, 3, SIMPLE), 1)) 20)
Sell: ((Ref(SOPK(14, 3, 3, SIMPLE), 1)) > SOPK(14, 3, 3, SIMPLE)) and (SOPK(14, 3, 3, SIMPLE) > 80)
Hi Nitin,
This is Milind, I am getting error of \”NEST Initialization failed for Interactive engine :<>\”
Please do let me know what would be the cause of this error?. Also i want to know is there any planning to make web based charting software which will be very convenient to access from any where.
Hello,
I am a non technical person, just resigned from my day job and wish to do full time day trading. I noticed as not much has been discussed about the Currency Trade or say the least which I am into. I am new to AlgoZ and the technicalities around the same. Well the following is my idea or say strategy:
Eg – EUR/INR – Opens at a certain price for eg – 85.99, low is 85.55 and the high is 86.35. Here I have a 80ps range which I hope to cash in as follows:
Whenever the price moves up or down, I should get an indicator to place an order which should give a 0.05 paisa margin/unit OR say Rs 50 per lot as gross profit. Depending on the trend I will decide the number of trades per day.
Please help me with a proper strategy or code for the same.
FYI- I am in talks with your team members – Linekar & Sumanth, very helpful, am awaiting the AlgoZ to go live on my account. They have assured to train me
Regards
Selva Mohan V
Selva, algoz is used for coding, backtesting and going live on technical analysis strategies. What you have mentioned is very generic, \”when it moves up or down, I should get an indicator which should give Rs 50/lot as gross profit\”, if you have an indicator it can be coded using algoZ, but you will have to tell us what that indicator is, or tell us for what exact condition should you get a buy, and for exactly you should get a sell…
How to find exact price when CROSSOVER happened?
Hi all,
This is my first post.Trying to code a scrip.Need help.The code is not accepted by NEST.I am new to this so there is
some fault.Kindly help to correct it.
The code=
# BUY ALERT
CROSSOVER(REF(C,1),REF(MA(C,21),1)) OR CROSSOVER(REF(C,1)>REF(EMA(C,8),1))
AND C>MA(C,21) AND C>EMA(C,8)
AND REF(C,1)>REF(MA(C,21),1)
AND REF(C,1)>REF(EMA(C,8),1)
AND H>REF(H,1)
# LONG EXIT
H>=ENTRY PRICE*1.0082 OR LOW<=ENTRY PRICE*0.999975
thanks & cheers
PKJ
Dear team as per above image i want a startegy whenever macd(26d,12d) crosses above signal(9) and RSI crosses above 30% buy signal to be generated.
For sell whenever macd(26d,12d) crosses below signal(9) and RSI crosses below 80% SELl signal to be generated.
Hi Amit:
Try this and let us know if it works for you. Always backtest your strategy before taking it live.
For buying: MACD(26,12,9,EXPONENTIAL)>MACDSIGNAL(26,13,9,EXPONENTIAL) AND RSI (CLOSE,10) > 30 AND REF(RSI(CLOSE,10),1)<30
For selling: MACD(26,13,9,EXPONENTIAL)<MACDSIGNAL(26,13,9,EXPONENTIAL) AND RSI (CLOSE,10) < 70 AND REF(RSI(CLOSE,10),1)>70.
Dear team,
i want a strategy with ADX,MACD, stochastic & RSI in combination.
when ADX value is is above 20 & +DI is also above 20 & RSI is above 40% and MACD 26d crosses above signal line BUY signal should be generated.
and
when ADX value is is above 20 & -DI is also above 20 & RSI is below 40% and MACD 26d crosses below signal line SELL signal should be generated.
Please backtest the strategies before applying live to assess the performance.
Dear Zerodha,
When i make my strategy live and logout, all my live strategies disappear. Is there any way where i can define number of days for which i want the strategy to be live? Also you have the option of exporting strategies to excel to keep a track of which strategy you have used for which script. Is it possible to make it 2 way and also import strategies so that you dont have to manually make all strategies live?
Aquif, what you\’re talking about is the next level of algoZ. 🙂 Right now, we have limited features and functionality on it and more developments will happen in time.
1. There\’s no way for us to keep your strategies running if you\’re not logged in. You have to be logged in and the scripts should be running.
2. Again, the whole idea of importing your strategy or making it live through Excel is a next level development for algoZ and it should happen in due course of time.
Thanx a lot. Hoping for a better algoz with coming versions
Hi Zerodha,
I have tried below strategy which are throwing above mentioned error.
When 14 period ADX is above 25
MacD with 26,13,6 values shows a buy/sell crossover respectively, and then the move is confirmed by below criteria to open a buy/sell position respectively
Stock retraces at least 3 days from up/down trend (It can be between 3 and 5 days retracement) and then to take buy/sell position respectively when the price
goes above/below previous days High/low respectively
The ADX should be above 25 and rising from lower levels and not falling from higher levels.
Buy Expression:
CLOSE > REF(HIGH,1) AND ADX(14) > 25 AND REF(ADX(14),1) < 25 AND MACD(26,12,9,EXPONENTIAL) > 0 AND CLOSE < REF(CLOSE,-1) AND REF(CLOSE,-1) < REF(CLOSE,-2)
AND REF(CLOSE,-2) < REF(CLOSE,-3)
Buy exit: 0
Sell Expression:
CLOSE < REF(LOW,1) AND ADX(14) > 25 AND REF(ADX(14),1) < 25 AND MACD(26,12,9,EXPONENTIAL) < 0 AND CLOSE > REF(CLOSE,-1) AND REF(CLOSE,-1) > REF(CLOSE,-2)
AND REF(CLOSE,-2) > REF(CLOSE,-3)
Sell exit: 0
Hi Friends/Zerodha,
Can you please let me know the parameter values for EMAs, ADX and Slow Stochastics for 1 min, 5 mins, 15 mins, 30 mins and 60 mins.
What ever default values I am trying for these indicators giving me wrong patterns and signals. It will be great if you provide me values or any reference material where I can get these parameter values.
Check out this document. It has most of your answers on parameters and other strategy coding related terms for algoZ.
Hi Zerodha,
Whatever strategies I am trying either getting Error stating script generated no trades and couple of strategies giving so many buy and sell signal though testing in 30 Mins interval. Could you please advise me on this quickly.
Thanks.
Varesh, we\’ll have to visually see your strategies and understand what could be going wrong before we decide how to move forward with helping you fix it.
I suggest you call our office and ask for Hari or Linekar and then discuss your strategy. Or send us your strategy by email or post it up here so we can look it up and find a solution for you.
If you\’ve already posted it here, then you\’re on the right track. Our experts will look at it and get back to you. 🙂
Hello zerodha,
(I posted the same Query in other page also.)
Pls tell code for
Buy : if 5min candle closes above 13SMA(high) and RSI > 60.
Buy Exit: when 5EMA(close) crosses 8EMA(close) and RSI <40.
StopLoss: Or if Candle closes below 7EMA(close)
(Also pls tell if we want to exit on 2 points automatically after buy entry )
Buy : if 5min candle closes above 13SMA(high) and RSI > 60.
Close>SMA(High,13) AND RSI(Close,14)>60
Buy Exit: when 5EMA(close) crosses 8EMA(close) and RSI <40.
EMA(Close,5)>EMA(Close,8) AND RSI(Close,14)<40
StopLoss: Or if Candle closes below 7EMA(close)
(Also pls tell if we want to exit on 2 points automatically after buy entry )
Stop loss cannot be entered as a strategy, you can enter the trigger in terms of % as shown above.
You cannot have a strategy like exit 2 points after buy entry, because the buy entry price is not captured.
Firstly, i really appreciate the answers from zerodha care and also algoz initiative
Please give me the algoz code for below strategy
Buy : Stochastic % K period 14, % k slowing 3 and % D period 3 with % K Crossing % D above 30
Sell: Stochastic % K period 14, % k slowing 3 and % D period 3 with % D Crossing % K below 80
Please give me the algoz code for below strategy
Buy: RSI crossing 30 from below
Sell: RSI Crossing 70 from above
Please give me the algoz code for MACD Histogram with signal line (12,26,9).
Please keep me updated about the sms alerts as discussed earlier.
Thank you
Balu,
There are many queries on strategies answered on this blog.
Buy : Stochastic % K period 14, % k slowing 3 and % D period 3 with % K Crossing % D above 30
SOPK (14, 3, 3, EXPONENTIAL) > SOPD (14, 3, 3, EXPONENTIAL) AND SOPD (14, 3, 3, EXPONENTIAL) > 30
Sell: Stochastic % K period 14, % k slowing 3 and % D period 3 with % D Crossing % K below 80
SOPK (14, 3, 3, EXPONENTIAL) < SOPD (14, 3, 3, EXPONENTIAL) AND SOPD (14, 3, 3, EXPONENTIAL) < 80
Please give me the algoz code for below strategy
Buy: RSI crossing 30 from below
RSI (CLOSE, 14) > 30 AND REF (RSI (CLOSE, 14), 1) < 30
Sell: RSI Crossing 70 from above
RSI (CLOSE, 14) < 70 AND REF (RSI (CLOSE, 14), 1) > 70
Please give me the algoz code for MACD Histogram with signal line (12,26,9).
SET HIST = MACD (26, 12, 9, EXPONENTIAL) – MACDSIGNAL (26, 12, 9, EXPONENTIAL)
HIST > 0
Hi,
I have a query regarding one of the default script in NEST Pulse. If someone could just post that script here. It was named something like RELSTR and probably has combination of MACD, RSI and STS. It would be great if someone can post that script. I can utilize my weekend in a fruitful way. Sorry, I do not have much more information regarding this script then what I have already stated.
I would also like to share something regarding the issue that I experienced today. Till last night when I logged out from NEST Trader. All my script, both default as well as the one I tried creating were present in NEST Pulse >> My Strategy. Today when I opened the Zerodha terminal all my script vanished. I contacted NEST Pulse regarding that but was informed that it cannot be retrieved. They asked if I have updated anything. I didn\’t updated anything. Everything was fine till last night and now its all gone. If they that its an issue, that is, if somehow if these scripts gets vanish (which seemed to me very likely from the customer care executive), then they should have atleast give us an option of local PC back up/restore. It would have certainly save lot time for customers.
Thanks
mave_rick
This is what we used to offer as a sample strategy:
RELSTR WITH MACD
Your Buy Alert Expression:
SET MACDSIG = MACDSignal(13,26, 9, SIMPLE)
SET MACDCOND = MACD(13, 26, 9,SIMPLE)
SET COND_1 = MACDCOND > MACDSIG AND REF(MACDCOND,1) < REF(MACDSIG,1)
SET COND_2 = RSI(CLOSE,14) >50
SET COND_3 = RSI(CLOSE,14) < 30
COND_1 AND (COND_2 OR COND_3)
Your Sell Alert Expression:
SET MACDSIG = MACDSignal(13,26, 9, SIMPLE)§SET MACDCOND = MACD(13, 26, 9,SIMPLE)
SET COND_1 = MACDCOND < MACDSIG AND REF(MACDCOND,1) > REF(MACDSIG,1)
SET COND_2 = RSI(CLOSE,14) < 50
SET COND_3 = RSI(CLOSE,14) > 70
COND_1 AND (COND_2 OR COND_3)
Your Buy Exit Alert Expression:
SET COND_1 = CLOSE < REF(CLOSE,1) AND REF(CLOSE,1) < REF(CLOSE,3) AND REF(CLOSE,3) < REF(CLOSE,5)
SET COND_2 =LOW < REF(Min(CLOSE,7),1) and Close < Open
COND_1 OR COND_2
Your Sell Exit Alert Expression:
SET COND_1 = CLOSE > REF(CLOSE,1) AND REF(CLOSE,1) > REF(CLOSE,3) AND REF(CLOSE,3) > REF(CLOSE,5)
SET COND_2 = HIGH > REF(Max(CLOSE,7),1)
COND_1 OR COND_2
About losing strategy data…
Dear Madam / Sir,
I use Stochastics and MACD in technical charts for buying and selling options on a one / five minute chart depending on the time of the day.
Parameter used by for the indicators are as follows:
Stochastics (3,3,3) for slow and fast
MACD (9,8,18) where 9 the signal and 8 and 18 are short and long exp moving average
I want an alert for the following conditions:
Fast and Slow stochastics are less than 30 and Fast crosses over Slow from below
Fast and Slow stochastics are more than 70 and Fast crosses over Slow from top
Trading decision
Buy when the the Fast Exp mavg. cross over Slow exp mavg from below
Sell when the the Fast Exp mavg. cross over Slow exp mavg from top
Apreciate if you would write the necessary script for the above mentioned strategy.
Please also clarify the following doubts:
Would I able to use the scripts for 1 minute / 5 minutes simultaneously or only 1 time chart is possible ?
Would I able to use it for multiple charts ?
What is the bandwidth required for using the trading decision alerts?
Please do the needful at the earliest.
Thanks and Regards
Mira
Here\’s the code for the first part of your strategy…
SOPK (3, 3, 3, EXPONENTIAL) < 30 AND SOPD (3, 3, 3, EXPONENTIAL) < 30 AND SOPK (3, 3, 3, EXPONENTIAL) > SOPD (3, 3, 3, EXPONENTIAL) AND REF (SOPK (3, 3, 3, EXPONENTIAL), 1) < REF (SOPD (3, 3, 3, EXPONENTIAL), 1)
Here it is for the second part
SOPK (3, 3, 3, EXPONENTIAL) > 70 AND SOPD (3, 3, 3, EXPONENTIAL) > 70 AND SOPK (3, 3, 3, EXPONENTIAL) < SOPD (3, 3, 3, EXPONENTIAL) AND REF (SOPK (3, 3, 3, EXPONENTIAL), 1) > REF (SOPD (3, 3, 3, EXPONENTIAL), 1)
Remember that only alert is not possible, but what you can do is, create a strategy with the expressions given above for buy and sell, apply it in live and ignore the signals.
Buy when the the Fast Exp mavg. cross over Slow exp mavg from below
EMA (CLOSE, 8) > EMA (CLOSE, 18) AND REF (EMA (CLOSE, 8), 1) < REF (EMA (CLOSE, 18), 1
Sell when the the Fast Exp mavg. cross over Slow exp mavg from top
EMA (CLOSE, 8) < EMA (CLOSE, 18) AND REF (EMA (CLOSE, 8), 1) > REF (EMA (CLOSE, 18), 1
Don’t see where MACD figures in this, although its mentioned in the parameters.
Answers for your other doubts:
1. Would I able to use the scripts for 1 minute / 5 minutes simultaneously or only 1 time chart is possible ?
-You can use scripts for multiple intervals simultaneously.
2. Would I able to use it for multiple charts ?
– Yes.
3. What is the bandwidth required for using the trading decision alerts?
– This would depend on the terminal usage, like number of scrips added in marketwatch, which subscribe for broadcast, number of charts invoked in the screen etc. Typically, a broadband connection with 256 kbps should be sufficient. If there are frequent disconnections, it will create issues in chart updation, ultimately affecting the signals generated. Also, when a script is taken live, you don’t have to keep the chart for the same open. This will reduce bandwidth consumption.
Dear Madam / Sir,
Thank you for your reply.
My MACD parameter are 9,8,18 where 9 is the signal line and 8 is the slow moving average (sma) (RED) and 18 is the fast moving average (fma) (GREEN) of MACD.
What is the code for MACD crossover of fma and sma:
BUY for fma (GREEN) (18) crossing sma (RED) (8) from below
SELL for fma (GREEN) (18) crossing sma (RED) (8) from top
Also is it possible to get alert for the following conditons:
– GREEN LINE > RED LINE (Bullish) and the signal line (Histogram) changes colour from GREEN to RED …indicating the price would fall in the future
– GREEN LINE < RED LINE (BEARISH) and the signal line (Histogram) changes colour from RED to GREEN …indicating the price would fall in the future
I have another requirement where I calculate the break out and break down prices of 150 cash scrips of NSE and feed it in the system and get alerts when :
– when share price become greater than break out price and scrips sorted in descending order starting with highest volumes on top
– when share price becomes less thant break down prices and scrips sorted in descending order starting with highest volume on top
You have informed that I should apply the strategy to various charts and do not open the charts to reduce bandwidth requirement.
Thanks and Regards,
Mira Mitra
MACD (18, 8, 9, EXPONENTIAL) > MACDSIGNAL (18, 8, 9, EXPONENTIAL)
SELL for fma (GREEN) (18) crossing sma (RED) (8) from top
MACD (18, 8, 9, EXPONENTIAL) < MACDSIGNAL (18, 8, 9, EXPONENTIAL)Also is it possible to get alert for the following conditons:
– GREEN LINE > RED LINE (Bullish) and the signal line (Histogram) changes colour from GREEN to RED …indicating the price would fall in the future
MACD (18, 8, 9, EXPONENTIAL) < MACDSIGNAL (18, 8, 9, EXPONENTIAL) AND (MACD (18, 8, 9, EXPONENTIAL) – MACDSIGNAL (18, 8, 9, EXPONENTIAL)) > 0I have another requirement where I calculate the break out and break down prices of 150 cash scrips of NSE and feed it in the system and get alerts when :- when share price become greater than break out price and scrips sorted in descending order starting with highest volumes on top
– when share price becomes less thant break down prices and scrips sorted in descending order starting with highest volume on top
Dear Madam / Sir,
Thank you for your reply.
Regards,
Mira
Dear Sir / Madam,
Please send me the code for the following expression
Exit BUY = MACD>MACDSIG, CROSSOVER of Fast & Slow Stochastics & both are>70
Exit SELL=MACD<MACDSIG,CROSSOVER of Fast & Slow Stochastics & both are<30
Trust you would do the needful.
Thanks and Regards,
Mira
Exit BUY = MACD>MACDSIG, CROSSOVER of Fast & Slow Stochastics & both are>70
MACD (26, 13, 9, EXPONENTIAL) > MACDSIGNAL (26, 13, 9, EXPONENTIAL) AND SOPK (9, 3, 9, EXPONENTIAL) > SOPD (9, 3, 9, EXPONENTIAL) AND SOPD (9, 3, 9, EXPONENTIAL) > 70
Exit SELL=MACD<MACDSIG,CROSSOVER of Fast & Slow Stochastics & both are<30
MACD (26, 13, 9, EXPONENTIAL) < MACDSIGNAL (26, 13, 9, EXPONENTIAL) AND SOPK (9, 3, 9, EXPONENTIAL) < SOPD (9, 3, 9, EXPONENTIAL) AND SOPD (9, 3, 9, EXPONENTIAL) < 30
Sir please help me my strategy code-
Buy condition – if nifty price crosses 8 Day exponential moving average from below. Stop loss should be 27 points of execution price or 8 Day EMA
Sell condition – if nifty price crosses 8 Day exponential moving average from above. Stop loss should be 27 points of execution price or 8 Day EMA
Exit long script – 65 points gain from execution price or 8 day exponential average
Exit short script – 65 points gain from execution price or 8 day exponential average
Ask all coding related queries on tradingqna
Hi Zerodha, Can I put one click/one key press Entery+SL+TP order? Like, if I wish to put 10 lots of nifty future long order at 5710 + SL at 5700 + TP at 5730, is it possible to do with one key press/2or3 key combination?
If you are talking about doing this using algoZ, then you cannot put a buy at 5710, but you can have a buy condition and also have an exit condition, plus you can mention a stop loss %.
If you just want to put numbers, you will have to place 3 orders separately. First buy it and once executed put the SL and the target price.
Hope this clarifies.
Thanx Zerodha for reply. If I put a horizontal line on zerodha/nestplus chart and I wish to go long/short once the price crosses above/below the line automatically and I wish 10 points SL above/below of my entry and 15 points target automatically placed after entry. Is it possible?
Presently you cannot really draw a line on the chart and hence this won\’t be possible.
Sir,
Can we use algoZ on Windows based Phones/Tablets with 3G connection for our trading.
Presently not possible on phones..
Hi Zerodha,
Could you please provide better strategy to buy and sell Nifty Future?
Varesh,
Presently we are not getting into telling strategies, just providing the tool and helping you write any strategies that you have.
But we have plans to soon start sharing profitable backtested strategies.
Cheers,
Once i buy using any particular strategy. Is there a way I can set an alert to exit \”when the price moves up by Rs.10\” from my buy price?
If the above is not possible, can I set a trigger using percentage value – something like \”exit if the price moves up by 10% from my buy price exit\”?
The thing is that your buying price as such cannot be captured in an algo.
What you can have thought is that whatever is your buying condition, you can have a selling condition which is an increment of your buying condition
could you please code me this strategy
RSI period-14
Exp.Average-20
I want buy signal(when RSI crosses the average from bottom) & sell signal(when RSI co happens from top) to be generated on every crossover happens. buy & sell exit-0
thanks & regards
Buy Alert Expression:
RSI (CLOSE, 14) > EMA (RSI (CLOSE, 14), 20) AND REF (RSI (CLOSE, 14), 1) < REF (EMA (RSI (CLOSE, 14), 20), 1)
Sell Alert Expression:
RSI (CLOSE, 14) < EMA (RSI (CLOSE, 14), 20) AND REF (RSI (CLOSE, 14), 1) > REF (EMA (RSI (CLOSE, 14), 20), 1)
Buy Alert Expression:
RSI (CLOSE, 14) > EMA (RSI (CLOSE, 14), 20) AND REF (RSI (CLOSE, 14), 1) < REF (EMA (RSI (CLOSE, 14), 20), 1)
Sell Alert Expression:
RSI (CLOSE, 14) REF (EMA (RSI (CLOSE, 14), 20), 1)
PLEASE EXIT LONG AND EXIT SHORT FOR THIS
You can post such queries here.
Exit long and exit short can both be 0.
WHEN BACK TESTED THE SIGNAL IS NOT GENERATING PROPERLY IN ANY TIME FRAME.(15/30MIN/60 MIIN)
Hi Rs,
Can you put up a snapshot of this, seems to be working alright when I am testing it at my end.
Hi Zerodha,
Is there any expression for \”BUY\” using PARABOLIC SAR??? would you help with that?
Krishnan,
Code for parabolic Sar Crossover: CLOSE > PSAR (CLOSE, 0.02, 0.2) AND REF (CLOSE, 1) < REF (PSAR (CLOSE, 0.02, 0.2), 1)
You can also look at our tutorial blog, bunch of queries on parabolic SAR already answered. http://www.zerodha.com/z-connect/blog/view/code-your-technical-analysis-strategy
Hi Zerodha,
When i was trying to live my strategy in commodity suddenly shutting down my nest trader.Please provide me a solution for this issue.
Regards
Anil
Anil,
We still haven\’t received approval for algoZ from MCX. You will have to wait till it comes through to be able to use this.
Hi Team,
I want to write a strategy using scripts based on below details
suppose Nifty is trading at 5808
I want to buy 100 shares at 5808 and do not want to sell if it is going towards up.
whenever it is going down,I want to sell 200shares at 5807.
If it is going to up 5808 again,I want to buy 200 shares and sell 200shares whenever it is down at 5807 and repeat the same process till end of the day.
Can we do this strategy using this scripts or not?
As I was busy office work,I will place this strategy morning and see the output of this strategy end of the day.
I hope that we can do this strategy using scripts.
I just want to follow above simple steps and please write the strategy and send it to me.
Please feel free to contact my number 9916172221 if you need any clarifications on the above strategy.
Thanks in advance.
Regards,
ssrao
Srinivas,
In algoZ you will need a strategy to buy or sell. Buying at a particular price is not a strategy like what you have mentioned.
algoZ is for technical analysis strategies, as such what you have mentioned cannot really be coded. There has to be a reason to buy and sell.
Hi,
Just I gave example based on 5808 but that price is current trading price at that time
Initially I will buy 1lot at current trading price and if it is going up then it is fine else if it is going down below one point then sell 2lots(i.e.one is for covering and another one is fresh order).
After sell order is executed,if it is going up one point then I will place buy 2 lots and this process will repeat till end of the day.
How to mention the quantity of both buy and sell orders while placing the script.
Buy Alert Expression: CLOSE > 5808(i.e. currently trading price at that time)
Buy Exit Alert Expression: 0
Sell Alert Expression: CLOSE < 5807(i.e. currently trading price at that time
Sell Exit Alert Expression: 0
As I am new to scripting,please tell me detailed steps including placing script,backtesting and live .
Thanks in advance
Awaiting your response
Srinivas,
You cannot really write a strategy this way. A strategy is typically a technical analysis strategy where if a condition is met you take a buy and sell..
In your case, you have just mentioned a price and for what you are planning to do , algoZ will be of no help.
How to take a strategy live, backtest and take live is shown in the blogs above. The most important thing is for you to have a strategy.
Check this blog where we have explained how to write codes for various strategies, you will get an idea of what I am talking about.
Sir,
after many emails and post from 2nd may, repeat request \” Please enable me for algoz.
prabit
Sir,
Is it possible to place cover orders using alogz, Live Strategy or Running Script ?
Devendra
Sir,
When we can expect new version of AlgoZ and what are the features of new version. Can we run this new version on Android.
The new version will have more data for you to backtest on and additional features like a beep sound etc. The new version would still need a computer and will not be possible on a mobile/tab.
I want a template with script to have price alerts (1) with 0.05 paise intervals (2) with Re.1 interval from the current market price ( >, as well as < for both the directional price movement), along with a beep sound when the price cross over the alerts set and a pop up windo should appear in the computer screen on my zerodha trading platform. can anybody write the script.
r.ramakrishnan
01.06.2013
Ram,
The beep sound will be possible in the next version. Presently you will get a popup with a preset order whenever your condition is matched.
What I am not able to understand is your strategy, when do you want to buy and when do you want the sell to appear??
Sir,
I wrote ema strategy given as example in this blog and named it as \”A\”.When I selected this strategy for backtesting only \”EDIT\” appears on right clicking it.Please point out my mistake.
Thanking you
Gilari Decosta
Gilari,
If you are not seeing a backtest option, it means that you are not enabled on algoZ yet. Send an email to [email protected] asking to be enabled for algoZ.
Cheers
There could be a couple of reasons why you may be getting only an edit option. The best thing to do would be to call our office for assistance, but I\’ll give you a couple of tips. Maybe they\’ll help you.
1. Can you check the version of Nest Plus? Do this by going to Tools < Nest Auto Plugins. The version should be 1.5.1.0 at least. If it\’s not, please go to http://plus.omnesysindia.com and download it.
2. You may be trying this on MCX scrips. Please note it works only for NSE.
I also faced the same issue and upgraded to 1.5.1.0 a little earlier, but the issue persists. Please suggest alternatives
There was a temporary issue with the backtest option. This has been fixed now.
Do we allow SL-Market orders / SL-Limit Orders while coding strategies in Nest Pulse
RD,
You can put the SL in terms of % in your alert preference window.By doing this what would happen is, whenever you click ok on a prompt to buy/sell based on your strategy, a stop loss order will automatically be placed based on the stoploss% you have mentioned.
While coding a strategy you cannot really put a stop loss..
Hi Zerodha,
We have some queries.
1. Suppose Data1=SBIN and Data2=NIFTY (Say).
I want write a code like Variable1=correlation(data1,data2,50); //50 is barsback
if variable1>.3 and close>ema(close,50) then buy at this bar.
My Question is that,
Case1:
How can I defined the function \”correlation\” if it is inbuilt?
Case2:
If i want create a own function , is it possible? if yes, How?
2. How i can change the back testing time duration, there is given only 22 days.
3. Your strategy is based in which language…C++, Easy language or any other….and we can test your strategy on other plateform like trade station or multi charts…….
4. In your nest pluse software Indian VIX data or chart not available.
Please replay ASAP, If any clareification, Let me know…..
Regards
Sitaram,
Presently on algoZ you cannot run any correlation strategies.You can basically run strategy per scrip.
This is a beta version and the backtesting is available only for 22 days for intraday data. We should have the new release in the next couple of weeks where you will have intraday data upto a year. 1 min for 1 month, 5 min for 5 months and 10 min for 10 days.
The language is called PULSE developed by Omnesys. The language is pretty simple, but if you are using a professional charting software, algoZ may not be as powerful as that.
We have a plugin developed in partnership with amibroker, where you can connect the amibroker to ZT using a trading plugin. Read this for more..
The VIX data should be up in our new version of ZT which should be available by the weekend.
Cheers,
Sir,
Even after 2 emails, I have not been enabled for algo-z.. Please do it and advise me.
Thanking you.
Prabit
Prabit,
Guess some issue with your installation, can you send the email again to [email protected] with cc to [email protected]
i am planning to use my strategy but it is not showing any option to go live and also i want to take backtest of my strategy
how to enable the options of backtest, go live and alert of my strategy
Guess algoZ is not enabled for you, send an email to [email protected] to have this enabled..
Hello Sir/Mam
As i understand it is semi automated system i use Ema for trading.
1.My question is when system give an buy aleart and i taken postion at 6005 price goes up 6025 condition met for sell will it give me aleart again or it will square off by itself and vice versa.[this is same trade ]
2.Can you provide me one click trade for buy and sell as now for trade i have to press F1 then popup appear then fill to transaction password.
Buy if you 3Ema Corss above 39
EMA(Close,3)>EMA(Close,39)
sell if 3 Ema cross below 39
EMA(Close,3)<EMA(Close,39)
Vasim,
Firstly, your strategy is correct,
Vasim, this is semiautomated so you will get prompts to execute. So you will get a prompt with preset order size and type that you would have mentioned in your alert preference as shown in the blog above.
Once click trade is not possible, but here is the way out. Run your strategy as mentioned in the blog above and in the live scripts window, right click and execute. This would work like a one click trade.
Try it out and see if it makes sense..
Dear Sir/Mam
Thank You for reply
But a question is on my i havenot exit strategy if i use 0 for exit then my entry and exit point will same [10 point up or 10below] look this ss
However 0 exit stragtegy is gud when ema does zigzag but i face zigzag problem 1 or 2 time only in a day
SO can i book my profit at the peak ?
If you think that EMA crossover for exit is too late as you have mentioned, you can have a separate exit strategy.
Typically an EMA crossover will make you a lot of money on days when the market is moving up and down quite a bit, otherwise it might be choppy..
So you can think of some other condition to exit, if you let me know the condition, i can help you with the code.
Well my question was that if i bought Nifty @ 5930 through algo and the now price is up 5960 can i book it manually through admin position without stopping strategy and it will not take any effect.
i would try to backtest this
Long exit if 3EMA cross below 13EMA
Short Exit if 3EMA Cross Above 13 ema
Yes Vasim,
You can always exit it manually from the admin position or by taking an opposite position using the sell order window..
Please make this exit formula i want to backtest it
Long exit if 3EMA cross below 13EMA
Short Exit if 3EMA Cross Above 13 ema
and can you provide any parameter for avoiding false zigzag signal. it would be great for me. i am newbie
Thanx alot for every reply
Vasim,
The above code for your original query, instead of 39 make it 13 that\’s it.
Dear sir first thank you for each and every reply
i am getting some problem and little bit worried its generating too much false singal please take a look
Vasim,
Can you email this snapshot to [email protected] with your client id. Will have it double checked.
Hi zerodha,
As per my understanding following happens in the above example. Please correct me if I am wrong.
Suppose buy signal is generated at Rs 100 so system buys at 100(say 1 lot). When Sell signal is generated at Rs 105 the system sells 2 lots at 105, one each to cover previous position and initiate fresh short?
Thanks in advance.
Akh,
It depends on how you write the strategy.
If you have a strategy with Buy expression and a buy exit expression and you keep the sell and sell exit as 0. Only buy trades will be taken and sell won\’t be.
But yes if you keep a buy expression and sell expression & keep the buy exit and sell exit as 0. Then like the way you have explained at 105 it will sell 2 lots, one to cover and one as a fresh short…
Hope this clarifies..
Please provide code for my strategy:
It involves 2 previous candles and current candle
Buy : if (Close of previous candle > High of previous to previous candle) and the current price > High of previous candle.
Sell : if (Close of previous candle < Low of previous to previous candle) and the current price < Low of previous candle.
Thanks in advance
Minakshi,
Buy: REF (CLOSE, 1) > REF (HIGH, 2) AND CLOSE > REF (HIGH, 1)
Buy exit: 0
Sell: REF (CLOSE, 1) < REF (LOW, 2) AND CLOSE < REF (LOW, 1)
Sell exit: 0
Now please help me in understanding what type of order will be placed once this condition is met.
Minakshi, no order is placed automatically , you will get a prompt to place an order since your strategy has initiated an order.
If you click ok on the prompt, the order is is placed based on the detail you enter in the alert preference window as mentioned in the blog above.
Cheers
Minakshi, no order is placed automatically , you will get a prompt to place an order since your strategy has initiated an order.
If you click ok on the prompt, the order is is placed based on the detail you enter in the alert preference window as mentioned in the blog above.
Cheers
Minakshi, no order is placed automatically , you will get a prompt to place an order since your strategy has initiated an order.
If you click ok on the prompt, the order is is placed based on the detail you enter in the alert preference window as mentioned in the blog above.
Cheers
The code you have suggested, gives trigger only when current candle closes above the previous candle high.
My strategy is different:
It should trigger when current price goes above high of previous candle and this previous candle should have closed above the high of earlier candle.
Sir,
I don\’t see backtest and live menu on my chart, I have already written a script. I sent email twice, for both reply received \”will be enabled end of today\”., But not yet enabled. Please enable me for algo z.
Yours truely
prabit
Prabit, it usually takes up to 24 hours to have algoZ enabled on your account. My presumption is that it could be enabled already. Are you trying algoZ for MCX? Because it doesn\’t work for MCX.
Alternatively, can you go to Nest Plus < My Nest Plus Account < Plus Dashboard on your trading terminal. Once your Plus Dashboard is open, on the left-hand side please look for Nest Pulse. Choose it and look for \’subscribe\’ on the top. If it says a validity date, you\’re enabled. If it doesn\’t show a validity date, then it most definitely is not enabled.
Hi,
Could you please code me the following strategy?
STOCH (40,1,1)
RSI (14)EMA(12), EMA(34)Entry for long: EMA(12) crossover EMA(34), Stocha > 50, RSI > 50 (All conditions should be satisfied)
Entry for short: EMA(12) crossover EMA(34), Stocha < 50, RSI < 50 (All conditions should be satisfied)
Price should be considered on candle closing basis. No buy & sell exit.
thanks
Buy:
EMA(CLOSE, 12) > EMA (CLOSE, 34) AND SOPD (40, 1, 1) > 50 AND RSI (CLOSE, 14) > 50
Sell:
EMA(CLOSE, 12) < EMA (CLOSE, 34) AND SOPD (40, 1, 1) < 50 AND RSI (CLOSE, 14) < 50
Buy exit: 0
Sell exit: 0
this code error seen …..
Don\’t see any screenshot here. Best to post coding/script related queries on http://tradingqna.com/
Hi,
How do I code Aroon indicator? I mean aroon up and down? Is there is index page which gives code for each of the indicator?
AroonUp(25) >
AroonDown(25) >
_SECTION_BEGIN(\”Ichimoku Cloud Charts\”);
GraphXSpace =1;
prds = Param(\”Standard Line Periods?\”, 13,5,26,1);
prds1 = Param(\”Turning Line Periods?\”, 3,3,10,1);
prds2 = Param(\”Delayed Line Periods?\”, 12,4,25,1);
prds3 = Param(\”Spans Periods?\”, 16,10,52,1);
TL = ( HHV( H, prds1) + LLV( L, prds1) )/2;
SL = ( HHV( H, prds) + LLV( L, prds) )/2;
DL = Ref( C, prds2);
Sp1 = Ref( ( SL + TL )/2, -prds2);
Sp2 = Ref( (HHV( H, prds3) + LLV(L, prds3))/2, -prds2);
SetChartOptions( 0, chartShowDates | chartShowArrows | chartLogarithmic | chartWrapTitle );
_N( Title = StrFormat( \”{{NAME}} – \” + SectorID( 1 ) + \” – {{INTERVAL}} {{DATE}} Open %g, Hi %g, Lo %g, Close %g (%.1f%%) Vol \” + WriteVal( V, 1.0 ) + \” {{VALUES}}\”, O, H, L, C, SelectedValue( ROC( C, 1 ) ) ) );
Plot( C, \”Close\”, colorBlack, styleCandle | styleNoTitle | ParamStyle( \”Style\” ) | GetPriceStyle() );
if ( ParamToggle( \”Tooltip shows\”, \”All Values|Only Prices\” ) )
{
ToolTip = StrFormat( \”Open: %g
High: %g
Low: %g
Close: %g (%.1f%%)
Volume: \” + NumToStr( V, 1 ), O, H, L, C, SelectedValue( ROC( C, 1 ) ) );
}
PlotOHLC (Sp1,Sp1,Sp2,Sp2,\”Cloud\”,IIf(Sp1>Sp2,ParamColor(\”Span1 Color\”, ColorRGB(0,255,0)),ParamColor(\”Span2 Color\”,ColorRGB(255,104,32))),styleCloud);
_SECTION_END();
Please let me know the script code for the above strategy
Joy,
This would not be possible on algoZ presently, if you are using amibroker, then I\’d suggest you to use the trading bridge for this. http://www.zerodha.com/z-connect/blog/category/zerodha-amibroker-plugin
Hi,
I want to change the back testing duration. how I can change. please update.
In your any Zerodha software India VIX date and chart not showing. please update it.
In your Mobile software Nifty Date is not updating. it show 5496 from last 1 month. and INDIA VIX Index data is also not shown on scree.
Sitaram,
The backtesting for now will be on the entire data available on the chart that you are backtesting on. Whatever is the duration of chart you are looking, the result will show for that.
The next version will give you a lot more intraday data to backtest on, this should be launched by end of month.
About vix and mobile, can you send an email to [email protected]
Please send sreen captures for the below example.
If i bought a share at Rs.8 and i want to set sell price it @ max.Rs.10
and i want to set stop loos @ Rs.6.
regards,
pavan
Pavan,
This query of yours has nothing to do with algoZ. Check the blog on how to place orders .
Place a selling order with limit price 10 and place selling stop loss with trigger at 6. Make sure you cancel one when the other gets executed, otherwise it will be considered as a fresh order.
Hi Nitin,
I just opened my account with Zerodha….. I want to write one script in \’Create Scripted Alert\’ option that when the price in one BSE listed shares drops to a certain point, then buy so much qty…. Is it possible ? If yes, Can you tell me what will be the Code ?
Thanks in Advance
Manish
Check the code for price alert: https://zerodha.com/expert-advisors/.
How to Stop the Running Script ?
I have done as stated above. but it still shows under STATUS as \”ACTIVE\”
Thnx got it .
ok sir. i got mail. so i thought to where i have to send.
here is the formula sir
this formula is for intraday purpose and based on previous day close high and low and current day open
this is for nifty fut
this is normal buy when current day open is near to buy area +/- 10 points
buy =close – (0.275*(high-low))
tgt = close + (0.275*(high-low))
sl for this buy , sl sell = (close – (0.55*(high-low))) – 5 points
but if this sl hits means that is called sell breakout and then it will lead to
tgt1 =close – (0.786*(high-low))
tgt 2=close – (1.45*(high-low))
this sell breakout is sure trade on down side
for normal sell when current day open is near to sell area +/- 1- points
sell = close + (0.275*(high-low))
tgt = close – (0.275*(high-low))
sl for this sell is
buy = (close – (0.55*(high-low))) + 5points
if this sl hits means that is called buy breakout and then it will lead to
tgt 1 = close + (0.7773*(high-low))
tgt 2 =close + (1.41*(high-low))
and this buy breakout happends then it is sure trade in up side
please code it for me sir…….
thanking you
ramzamma
Buy:
SET B = REF (CLOSE, 1) – (0.275 * (REF (HIGH, 1) – REF (LOW, 1)))
OPEN > (B + 10) OR OPEN < (B – 10) OR cLOSE < (REF(CLOSE, 1) – (0.55 * (REF (HIGH, 1) – REF(LOW, 1)))) + 5
Buy exit:
SET BT = REF (CLOSE, 1) + (0.275 * (REF (HIGH, 1) – REF (LOW, 1)))
Close > BT OR CLOSE < (REF (CLOSE, 1) + (0.786 * (REF (HIGH, 1) – REF (LOW, 1)))) OR CLOSE < (REF (CLOSE, 1) + (1.45 * (REF (HIGH, 1) – REF (LOW, 1))))
Sell:
SET S = REF (CLOSE, 1) + (0.275 * (REF (HIGH, 1) – REF (LOW, 1)))
cLOSE < (REF(CLOSE, 1) – (0.55 * (REF (HIGH, 1) – REF(LOW, 1)))) – 5 OR OPEN > (S+10) OR OPEN < (S – 10)
Sell exit:
SET ST = REF (CLOSE, 1) – (0.275 * (REF (HIGH, 1) – REF (LOW, 1)))
CLOSE < ST OR CLOSE < (REF (CLOSE, 1) – (0.786 * (REF (HIGH, 1) – REF (LOW, 1)))) OR CLOSE < (REF (CLOSE, 1) – (1.45 * (REF (HIGH, 1) – REF (LOW, 1))))
sir i taken this code.
i just copy paste in buy expression area and sell expression area and buy exit and sell exit
..
when i back tested it says undefined varieable ST
what to do sir?
ramzammaMay 6 2013, 11:47 pm
when taken this back test it gave me 2394 points negative sir .. how to correct this?
[ Click to thank ]Reply
ramzammaMay 7 2013, 9:52 am
sir when i check with live giving some undervalues… how to send the print scrren png. here?
[ Click to thank ]Reply
ramzammaMay 7 2013, 10:36 am
sir when i give live test.for nifty fut….i recommends to buy at 889 level 11370 levels …short at 600 levels…so many levels are showing…really what mistake happend dont know… but it is like fun ..
[ Click to thank ]Reply
Ram, when you are backtesting what chart are you opening, 1 min, 5 min, or historical chart?
Also, instead of posting a fresh comment just reply back to this post itself..
Cheers,
sir i am opening nest plus chart with 5 min time frame. i didnt use historical chart.
sir where to send my formula? to this id <[email protected]>or any other id?
How do I get the historical chart for Index spot values like Nifty, Banknifty? I want to backtest on spot values.
gr8,
Presently you cannot run this on index spot values. You can run only on futures.
sir i want to apply camarilla levels.. but i dont know how to use that . when u will contact i will give that formula nothing but simple.. but dont know how to code that.
thank you in need of your help
ramzamma
Ram,
Share the formulae here, we will code it for you,
cheers,
Hi Nithin,
How to calculate Camarilla Pivot points? Can we have a readymade Camarilla plotting in Technical Analysis section?
To calculate Camarilla Pivot points all you need is previous trading day’s high low and close value. Below are the equations for calculation various levels.
C = Previous day close
H = Previous day high
L = Previous day low
H4 = [0.55*(H-L)] + C
H3 = [0.275*(H-L)] + C
H2 = [0.183*(H-L)] + C
H1 = [0.0916*(H-L)] + C
L1 = C – [0.0916*(H-L)]
L2 = C – [0.183*(H-L)]
L3 = C – [0.275*(H-L)]
L4 = C – [0.55*(H-L)]
Regards,
Ashutosh Raje
We could get someone to check the code and assist you with it. Its best to post code related queries on tradingqna.com. Someone from the community will help.
Hi Venu,
Please publish code for Camarilla strategy.
Forwarding this to our tech team to add on the list of indicators that we intend to provide.
Even I am looking forward for camarilla indicator from technical indicator. Kindly let me know whats the progress on this indicator.
Thanks in advance
Prabhu
Nitin,
Can we please have Camarilla Pivot Points?
I have to maintain a excel to calculate, if you make it a indicator on chart it will be excellent help to visually use it.
The equations are quite simple & for your technical team it should be a piece of cake.
Please help.
Thanks.
Why I am not getting backtest menu button under my strategy. I tried both intra day and historic charts. Print screen is attached.
Regards
Vasanti, this means you are still not enabled for algoZ. Send an email to [email protected] .
hi,
First of all you guys r dng an awesome job…. my query is that is it possible to set up a sound alert when a signal is triggered?
regards
APT,
The next version will come with a sound alert..
Cheers,
hi,
once i have gone live, how can i edit my alert preferences
You can go back to take live and edit it. But make sure that you have stopped the previous script before making the change..
How does my strategy work on 1- minutue chart and 5-min chart.
The result will be different or not? The same result should I get?
If I put 10 EMA ,on 1-min-chart,it would be 50EMA on
5-min.chart?
Sasi,
Check out this blog: http://www.zerodha.com/z-connect/blog/view/managing-your-script
You cannot 2 time frames on one strategy. You can either use a 1 min or a 5min.
10 SMA on 1 min chart won\’t be like a 50SMA on 5 min chart, it will be very different.
Dear Kamath sir,
I am nagesh here, my id is RN0699, ZERODHA trader. I have few questions please resolve.
As i read about ALGOZ Trading, i enquired your office regarding this(ph:08040402020), they are unable to answer my questions. please clarify my questions below:
1) How to back test algoz for free without losing my money in trading ? presently i am trading equity delivery, \”CNC\”, Using ALGOZ, Is it possible to trade in \’CNC\’.
2) I would like to apply quantum economics in algoz, how to code it . please send me e book to code my strategies.my mail id : [email protected]
3) Is algoz is free for ZT customer ?
4) As i am new to this trading field, if you have any suggestions when to buy and sell , please advice and educate me with your knowledge and ebook.
Thanks for your valuable suggestions sir,
nagesh
I made one of my strategies live yesterday (April 30) and when I checked it today using Nest Plus>Nest Pulse Scripts>Pulse Running Scripts, I was not able to see any strategy running there. Do we need to make it live again every day morning? Thanks in advance. Nehal.
Yes Nehal,
You will have to take it live everyday, actually you will have to take it live once again, if you logout and log back into the trading platform.
is this algoZ is available for mcx also or only nse only
In this version on equity and currency, we are hoping to have the approvals for MCX by the next version, hopefully by month end.
Dear Sir,
How do I put an Exit Long, when the price of Nifty future reaches 20 points from my buy price?
example:
Buy Long -> CROSSOVER(EMA(CLOSE, 10), EMA(CLOSE, 30))
Exit Long -> 20 points from the above triggered price.
You cannot mention a formulae saying exit if 20 points from buy price. Exit has to be a strategy in itself, a technical analysis strategy.
I think if we can write a sellexpression: Close > x + 20 where x can be replaced by buy price or buy price can be saved in x when we write a Buyexpression
How to save the buy price in a variable? Or how to put a stop loss of 1% on buy price?
Not possible currently on tradescript.
Is it possible using LOOP function?
Is it possible to exit @ 50 points from buy price?
Please let me know how to write a Script if I wan t to buy Nifty Future if it crosses a particular certain level say 5900.
algoZ is based on technical analysis , so you can\’t define to buy above a certain price like 5900, you could just use the stoplossto enter if you know the price.
But if the price is based on a technical analysis strategy, yes it can..
I think it can be Buyexpression: Close > 5900
hi, I have a strategy which creates pivot points. I enter at 1 with a fix stop and with every increasing interval the stop would trail. Can this be done? Also, if i buy 3 lots at a time and want to define the stop diffrent for each and it would trail, would it be possible? Pls guide…
It will be tough to do this on tradescript. But you can use the Kite connect API\’s for this, and run the strategy even on something as simple as an excel sheet. We will not be able to support you on developing this though. Check this: https://kite.trade/
Hi Nitin, is it possible to do backtest using the 3rd candle of the day (open high low close value), or any particular candle of the day (means it stored the value of the same candle buy or sell above or below value) its candle based value, I tried but I failed to do backtest
Hi Nitin,
Thanks for the update…I am still awaiting on my query below
I am using parabolic SAR however, Its giving me weird results
CROSSOVER(CLOSE, PSAR(0.02, 0.2)) = TRUE,
I want to use this for both Buy/Sell, and Buy should signal only when stock price is above Parabola and Sell should signal only when stock price is below Parabola. Please suggest
Thanks in advance
Hello Nitin ,
I am Zerodha user id ZT9357
can you please help in giving tradescript code for Pi alert and scan for BUY SCRIPT SELL SCRIPT EXIT LONG EXIT SHORT
Logic:
low price = A, open price = B, high price = C
B-A=D
B-C=E
IF D<E generate a Buy call
IF D<E generate a Sell call
IF {(B-(B=C)-1} generate Exit long and generate Sell Call
IF {(B+(B=A)+1} generate Exit Short and generate Buy Call
IF {B+(B*0.75)} generate Exit long
IF {B-(B*0.75)} generate Exit Short
How can get the code for zig zag ? I want to create a expert advisor using this in pi
Please help me with the code for zig zag as it appears in normal zerodha under studies section