
View option strategy charts on Sensibull
When you are trading straddles, strangles, or other multi-leg option strategies, it becomes difficult to see how the entire strategy is performing if you plot each leg separately.
For example, in a straddle, the call premium might go down while the put premium goes up. If you look at each of them individually, you will see what happened to each option, but you won’t at once know how the total premium has changed.
The Multi Straddle-Strangle Charts on Sensibull let you plot the total price of the legs on a single chart.
You can find this under Analyse > Multi Straddle-Strangle Charts on the Sensibull website or app.
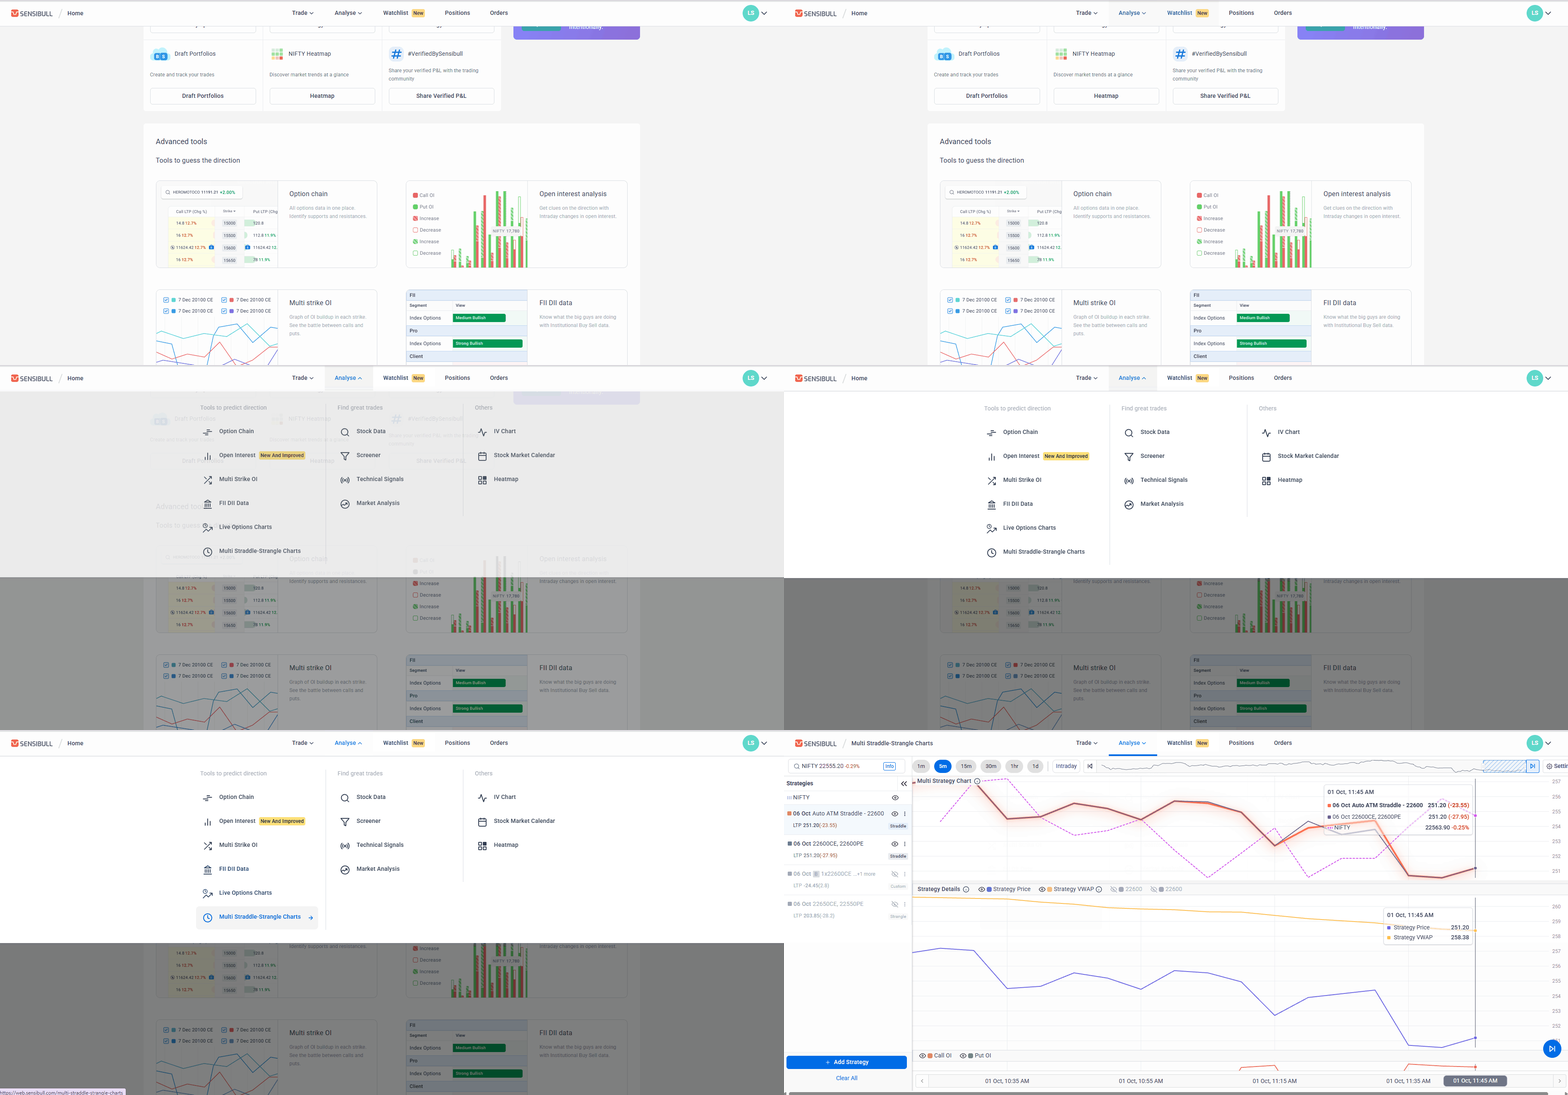
You can track:
- For straddles, you can select a fixed strike, a strike in relation to the at-the-money level, or Auto ATM, which mirrors the at-the-money straddle as the underlying asset moves.
- For strangles, choose the call and put strike prices that you want to track together.
- For custom strategies: you can add your own option legs, decide whether to buy or sell, and set the quantity for each leg.
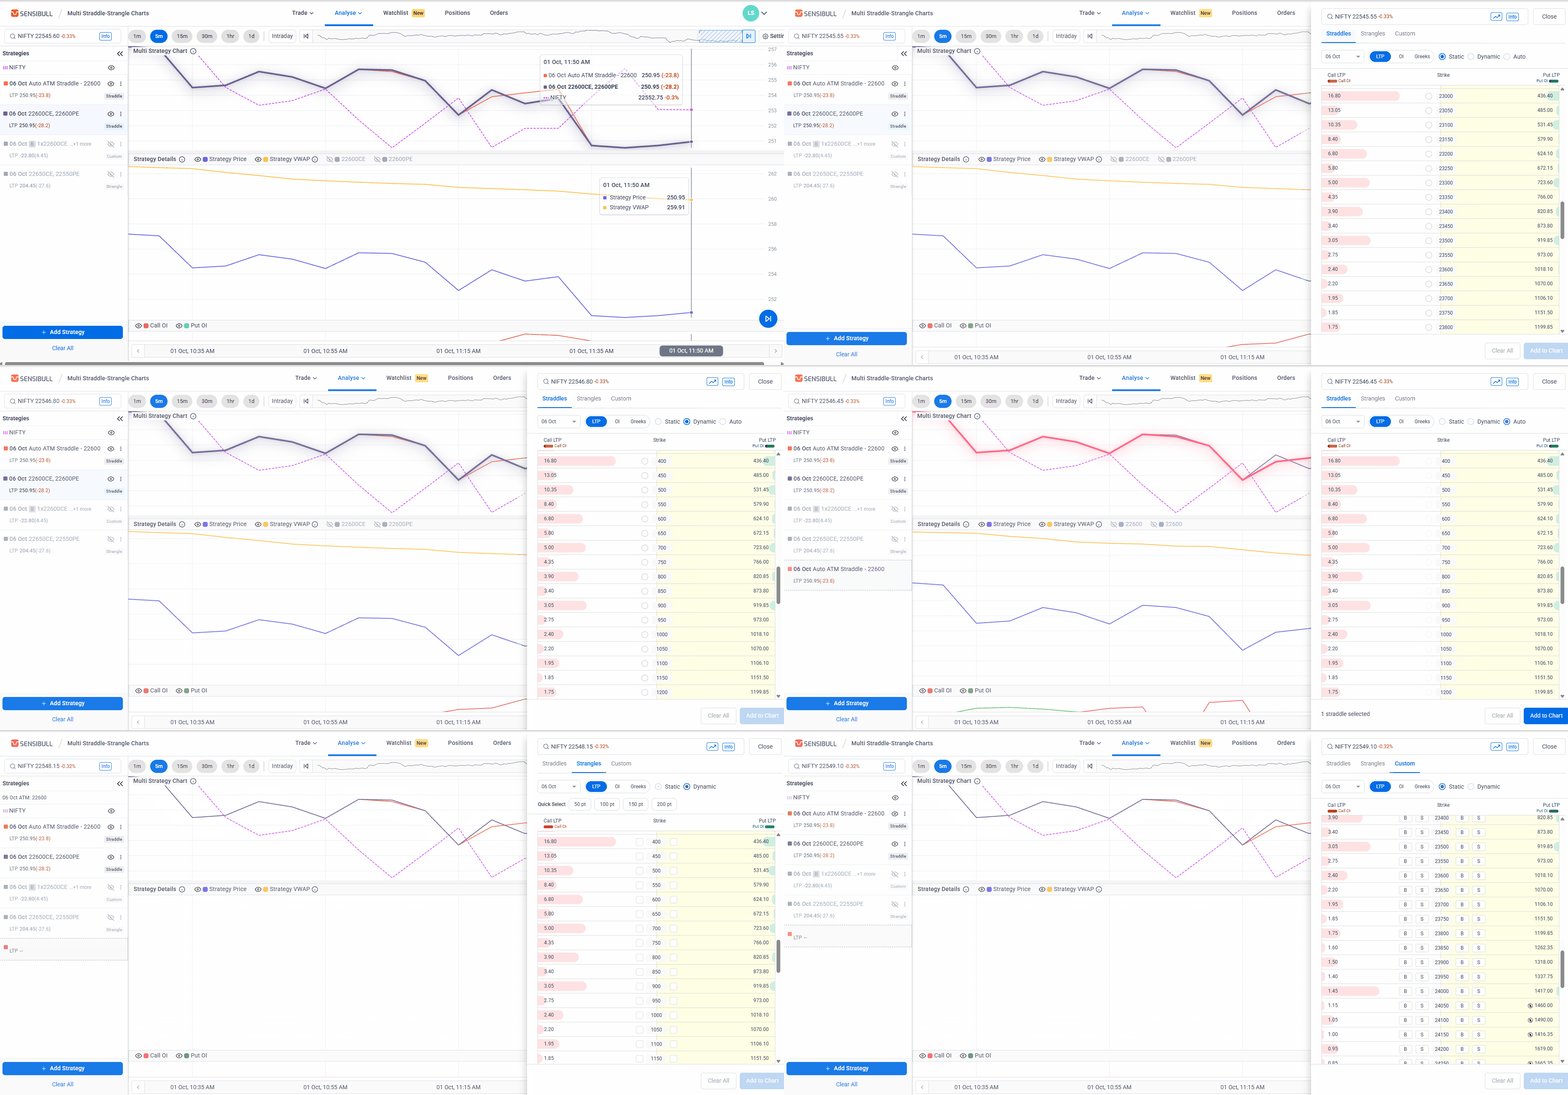
You can also include several strategies on the same chart, such as comparing two straddles, a straddle with a strangle, or different custom strategies over the same period.
After you have added them, you will be able to see the details of each strategy, hide the individual charts, change the timeframe, and zoom in on a specific period.
This makes it easier to track how a strategy’s combined premium changes, rather than keeping multiple option charts open and adding up the legs yourself.
