What the data actually says about F&O in India
I started working at Zerodha in 2017. When I joined, the stock market in India was more or less a sideshow. Nobody really cared about capital markets apart from the obvious people for whom they mattered. The stock market was not part of any mainstream conversation.
But all of that changed after COVID. This is not to say that COVID was the only trigger (I’ve written elsewhere about the other factors that preceded it), but COVID was a tipping point. People were locked inside their homes, bored out of their minds, and looking for cheap thrills. By then, the stock market had gone fully digital, and thanks to online brokers like us, people could instantly open accounts from their smartphones.
What followed was probably one of the greatest speculative episodes Indian markets have seen. But this was not just an Indian phenomenon. The surface area of speculation expanded globally. People started speculating on everything: equities, futures and options, crypto, fantasy sports, real-money gaming, sports betting, and god knows what else. This is what happens when you are locked in at home and bored out of your mind.
This rise in speculative fervor created a lot of anxiety among everyone from the government and financial regulators to market observers. Predictably, this led to a whole host of part-time messiahs and stock market philanthropists who were willing to set aside their jobs of failing to beat the Nifty in their PMS, AIFs, and mutual funds to save retail investors from themselves.
And look, the worry isn’t baseless. The 90%+ loss stat is real. The SEBI warning on Kite is real. People are losing money in F&O. That’s not in dispute.
But the problem is in how this entire conversation has been framed. The one data point people constantly latch onto is that more F&O contracts are traded in India than in the US, a capital market ecosystem worth well over $100 trillion compared to India’s roughly $5 trillion. People use the number of contracts, cash-to-equity ratios, and other measures to argue that Indians are basically betting away all their savings, their houses, their futures, and perhaps even their bodily organs.
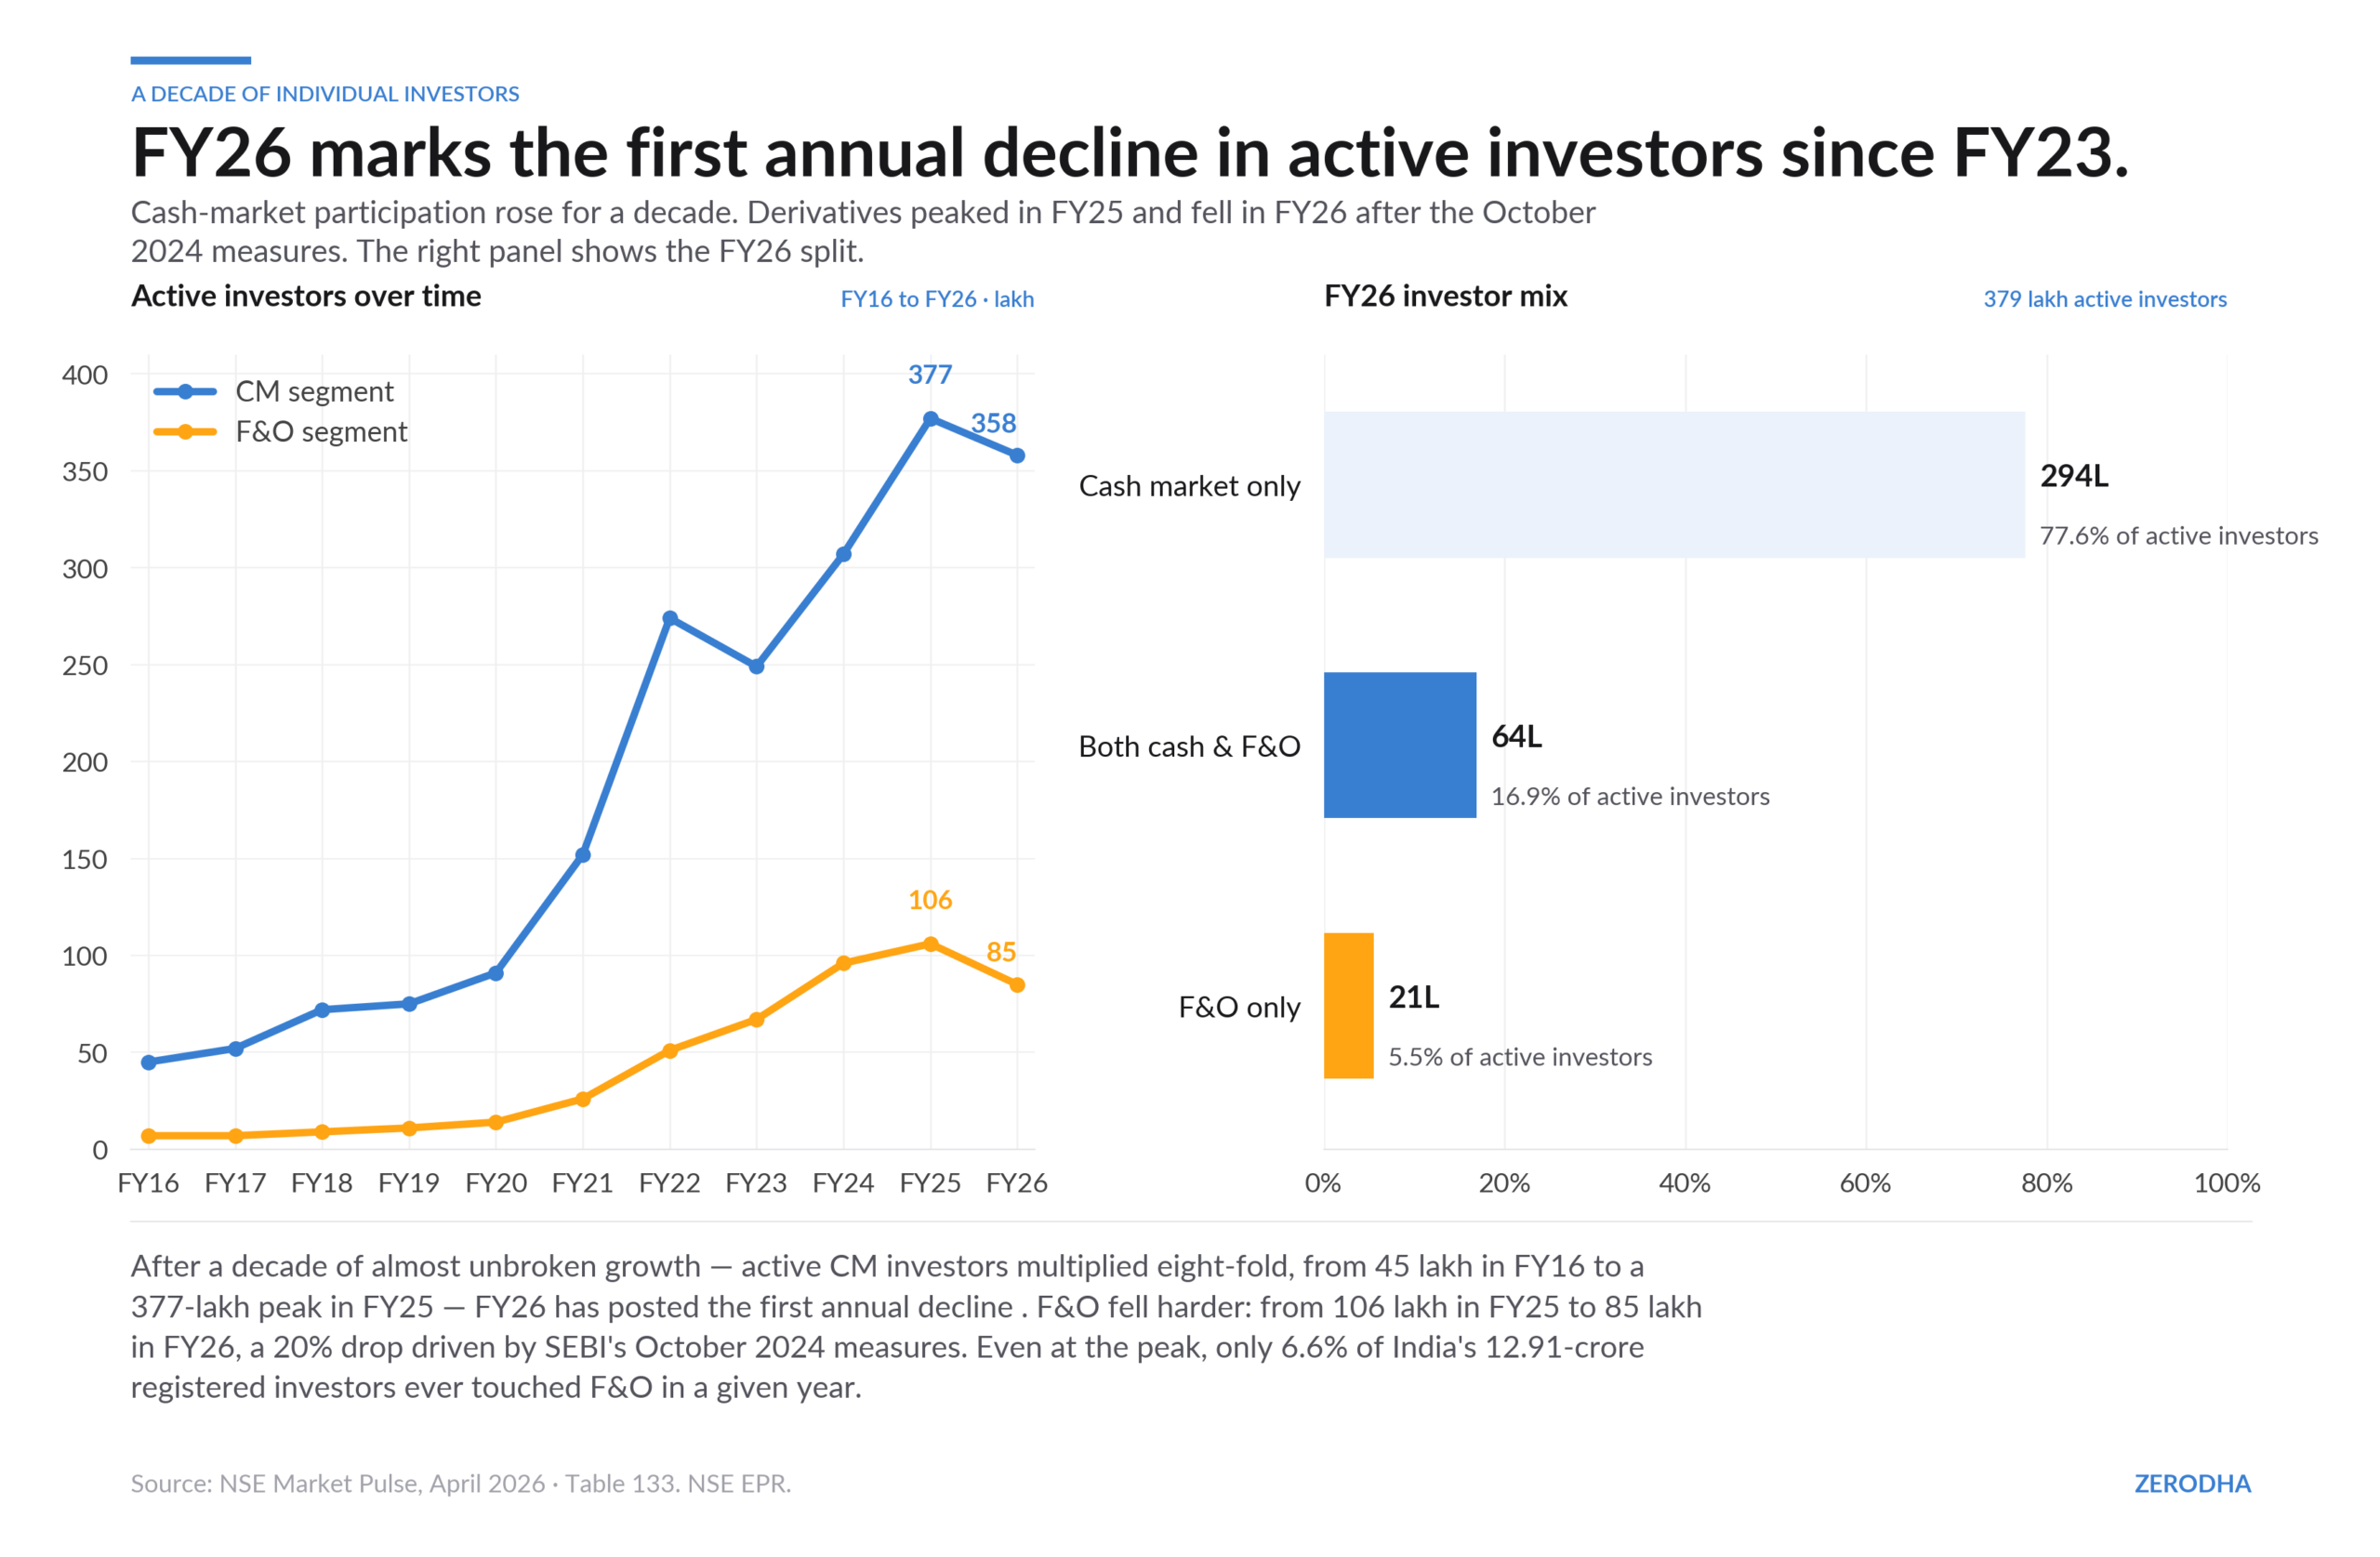
 Two things can be true at the same time. Yes, there was a huge spike in speculative activity in the post-COVID period. But that was an aberration, not the steady state of the market. Speculation always rises during bull markets and falls sharply when markets turn. Many of the tourists who entered after COVID have already left. And two: the scale and scope of the problem are vastly overstated because the numbers everyone keeps citing are, at best, misleading, and at worst, completely meaningless.
In this article, I want to add context to the notion that Indian investors are simply gambling their money away in F&O. Let me start with the big number people latch onto: the number of contracts traded. Comparing the number of contracts is like comparing the absolute number of farts. It is not the absolute number of farts that matters, but their pungency, or the strength of the smell, that ultimately matters. The same logic applies to F&O contracts.
If you look at actual premium turnover, i.e., the real money exchanged when F&O contracts are traded, the entire claim begins to fall apart. If you then look at the number of people who are actually trading, the argument becomes even sillier, because 90 percent of the people who have accounts don’t really trade at all.
Here’s the data.
The number of contracts tells you nothing
The most common data point you see when people talk about the scale of India’s F&O problem is the number of contracts traded. The NSE has been the world’s largest derivatives exchange since 2019. In 2024, over 12,397 crore contracts were traded, over 82% of global volume. Even after SEBI’s measures cut volumes sharply, NSE still commands 51% of the global contract count.
This number has zero information value.
The number of contracts traded is a function of contract size. Smaller contracts mean more contracts for the same capital: mechanically, automatically, with no additional speculation implied. A smaller contract size allows more trading activity for the same quantum of money at hand. That’s it.
Look at the contract sizes:
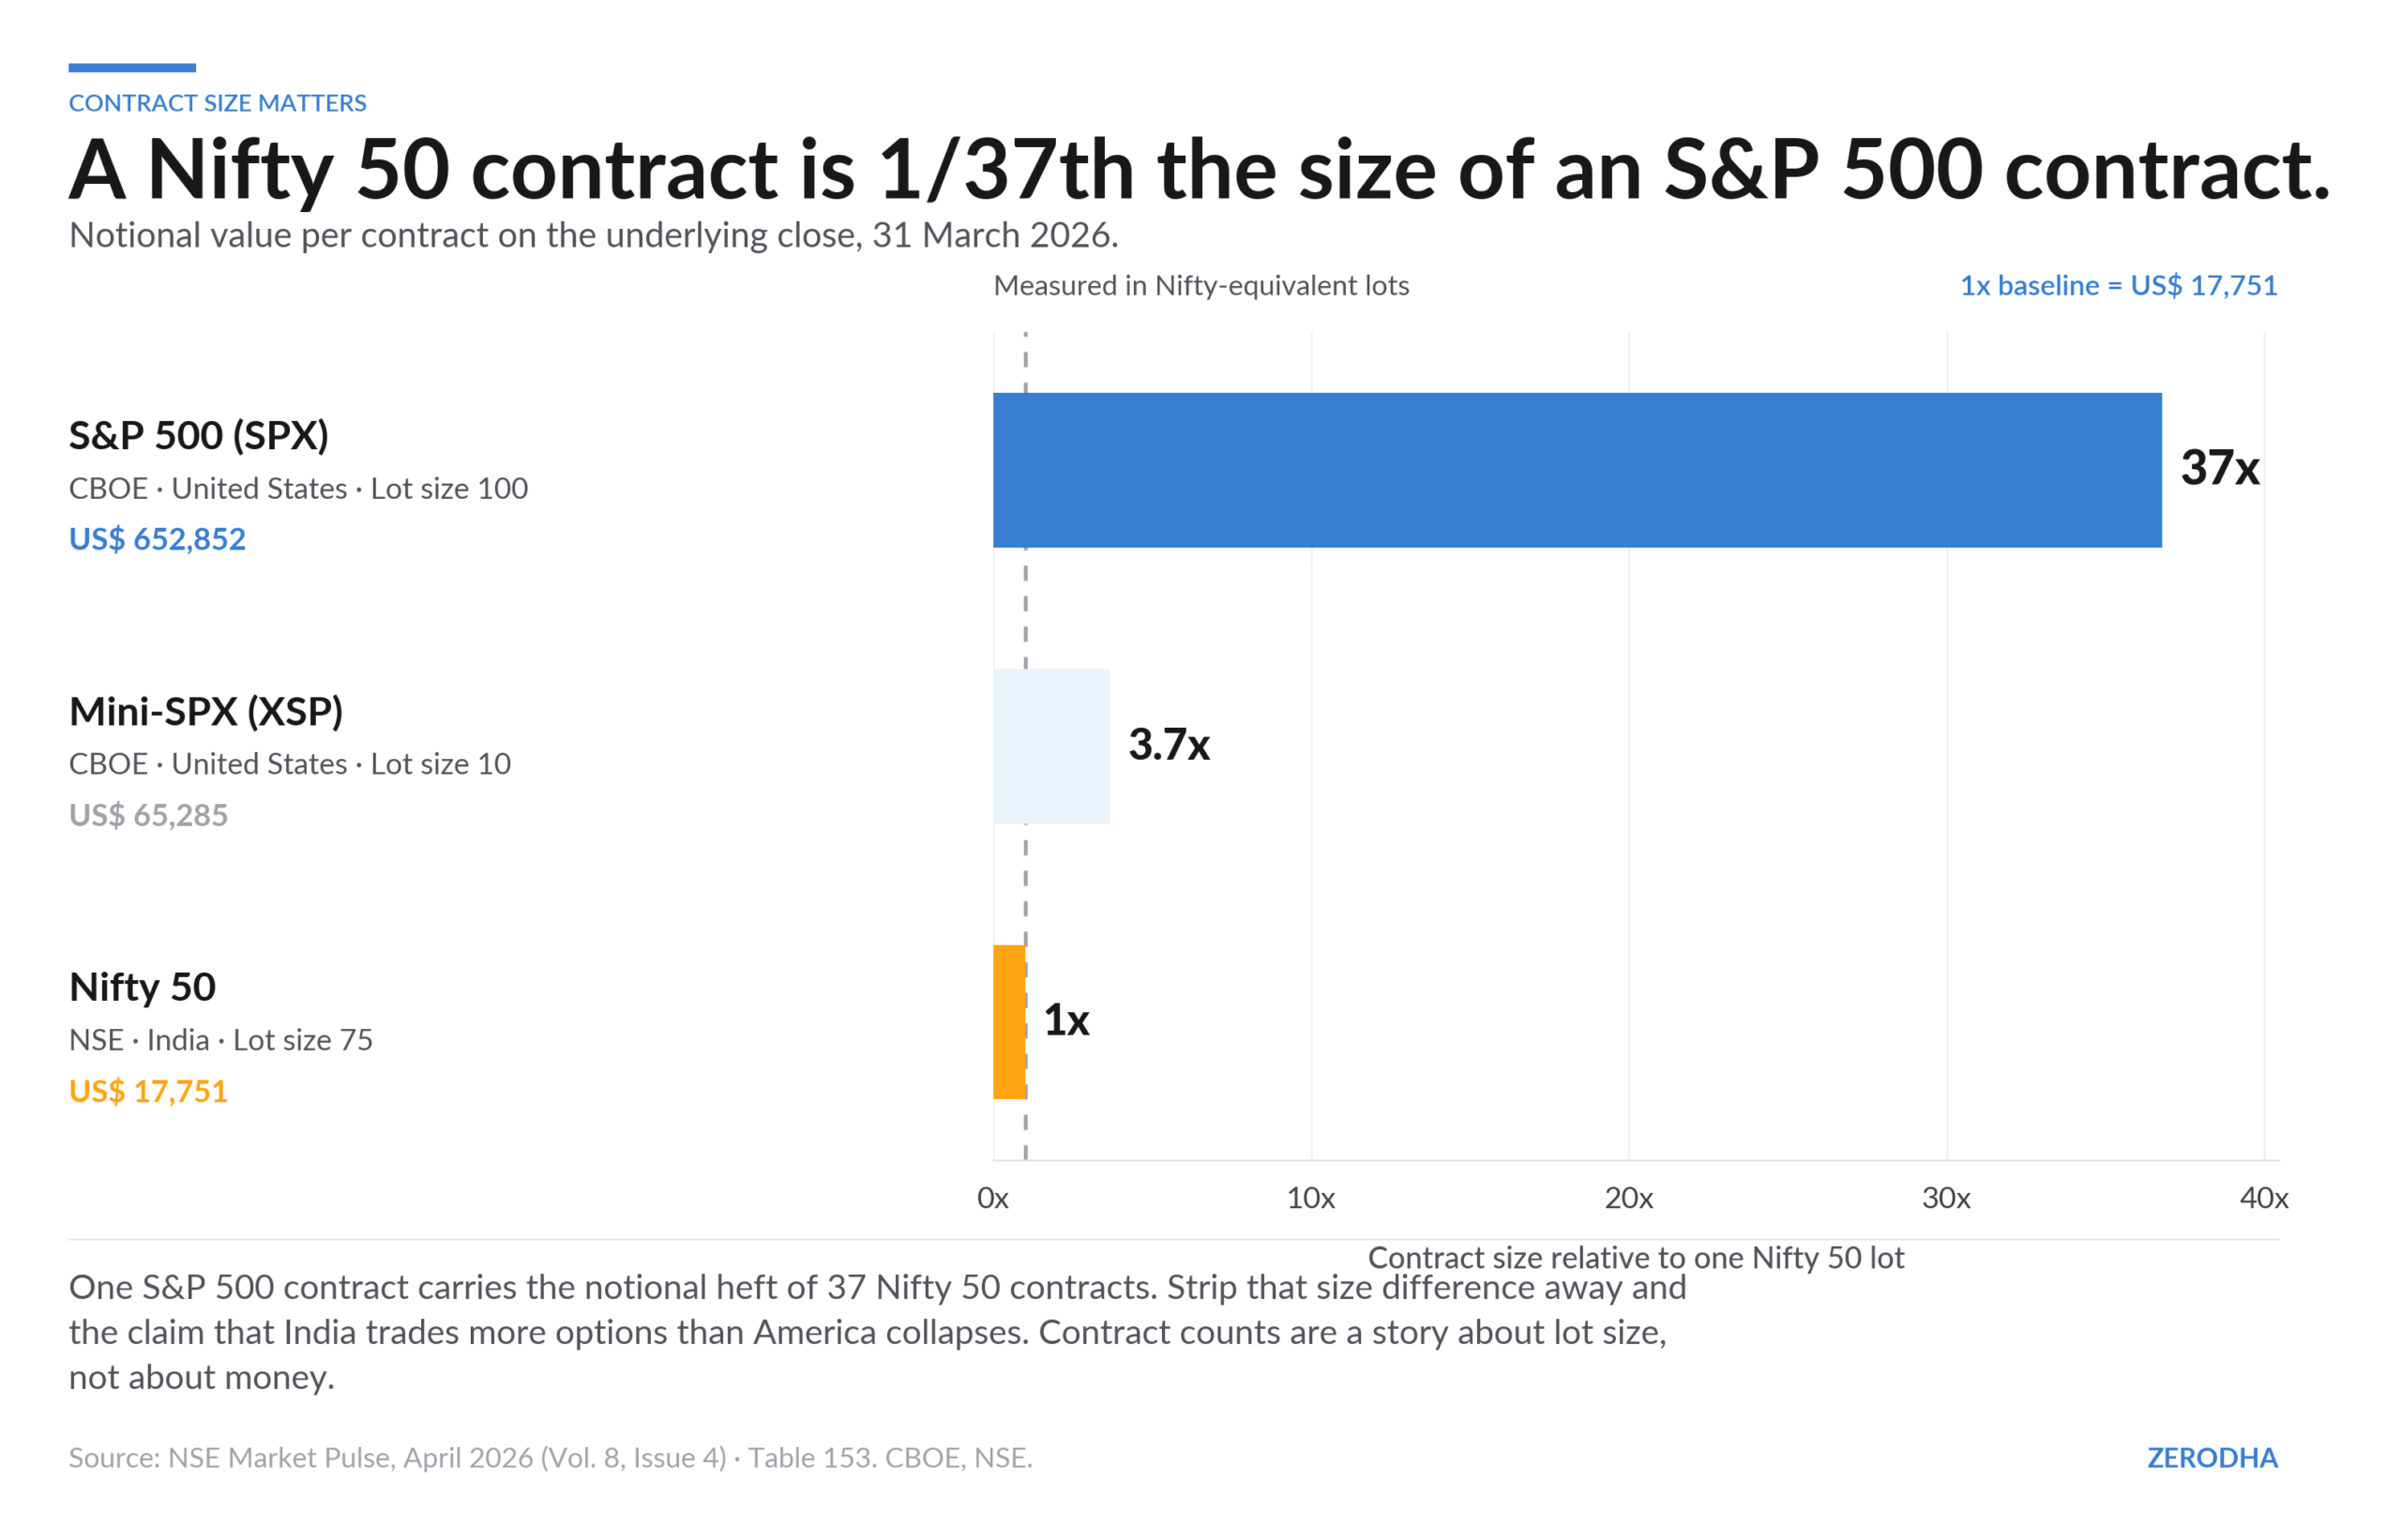
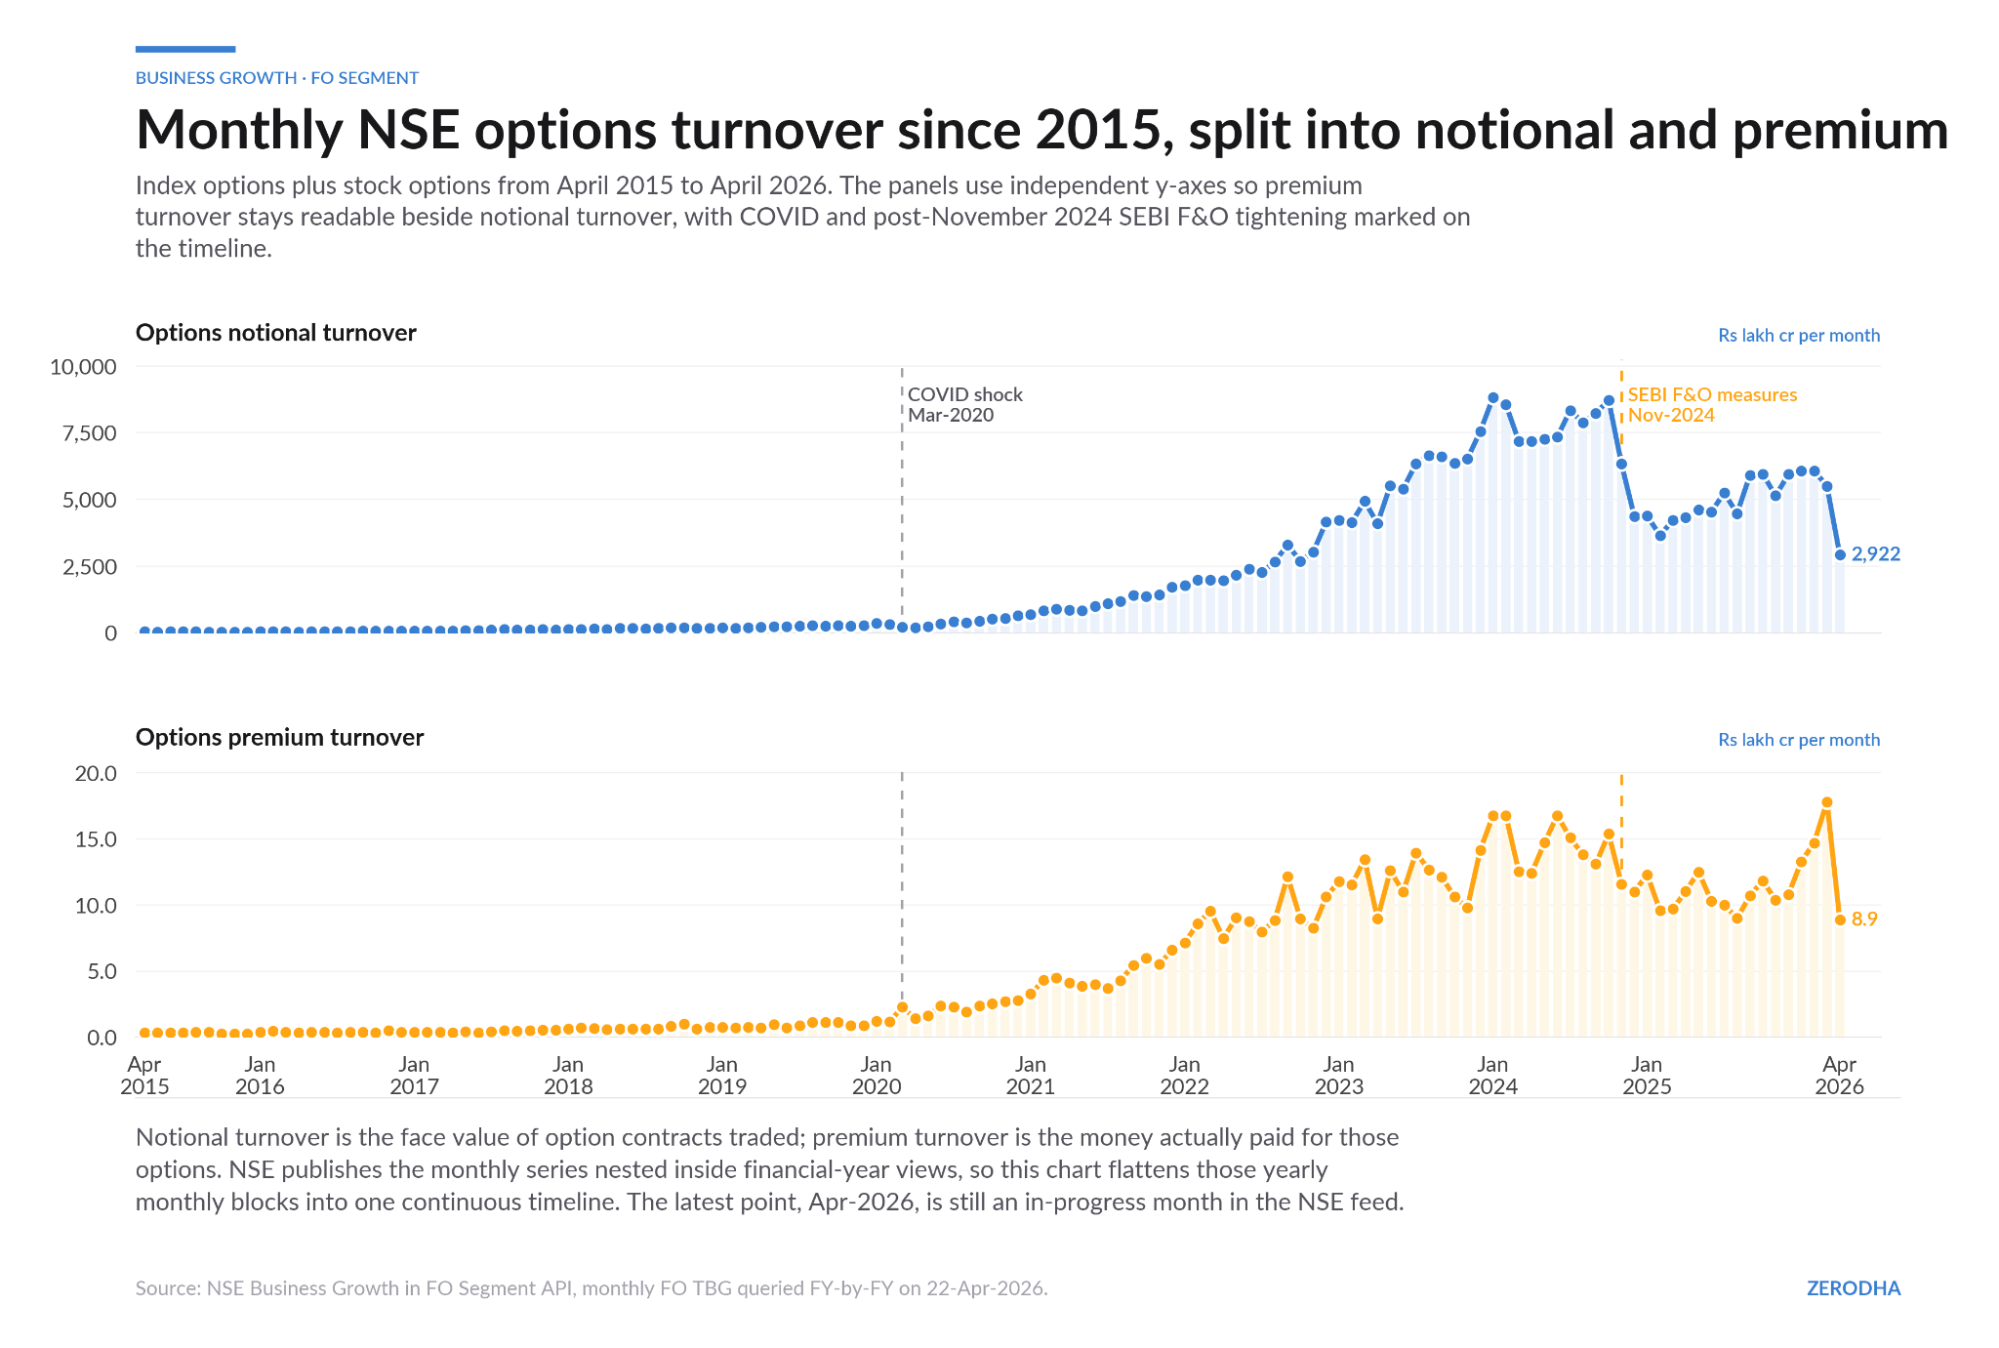
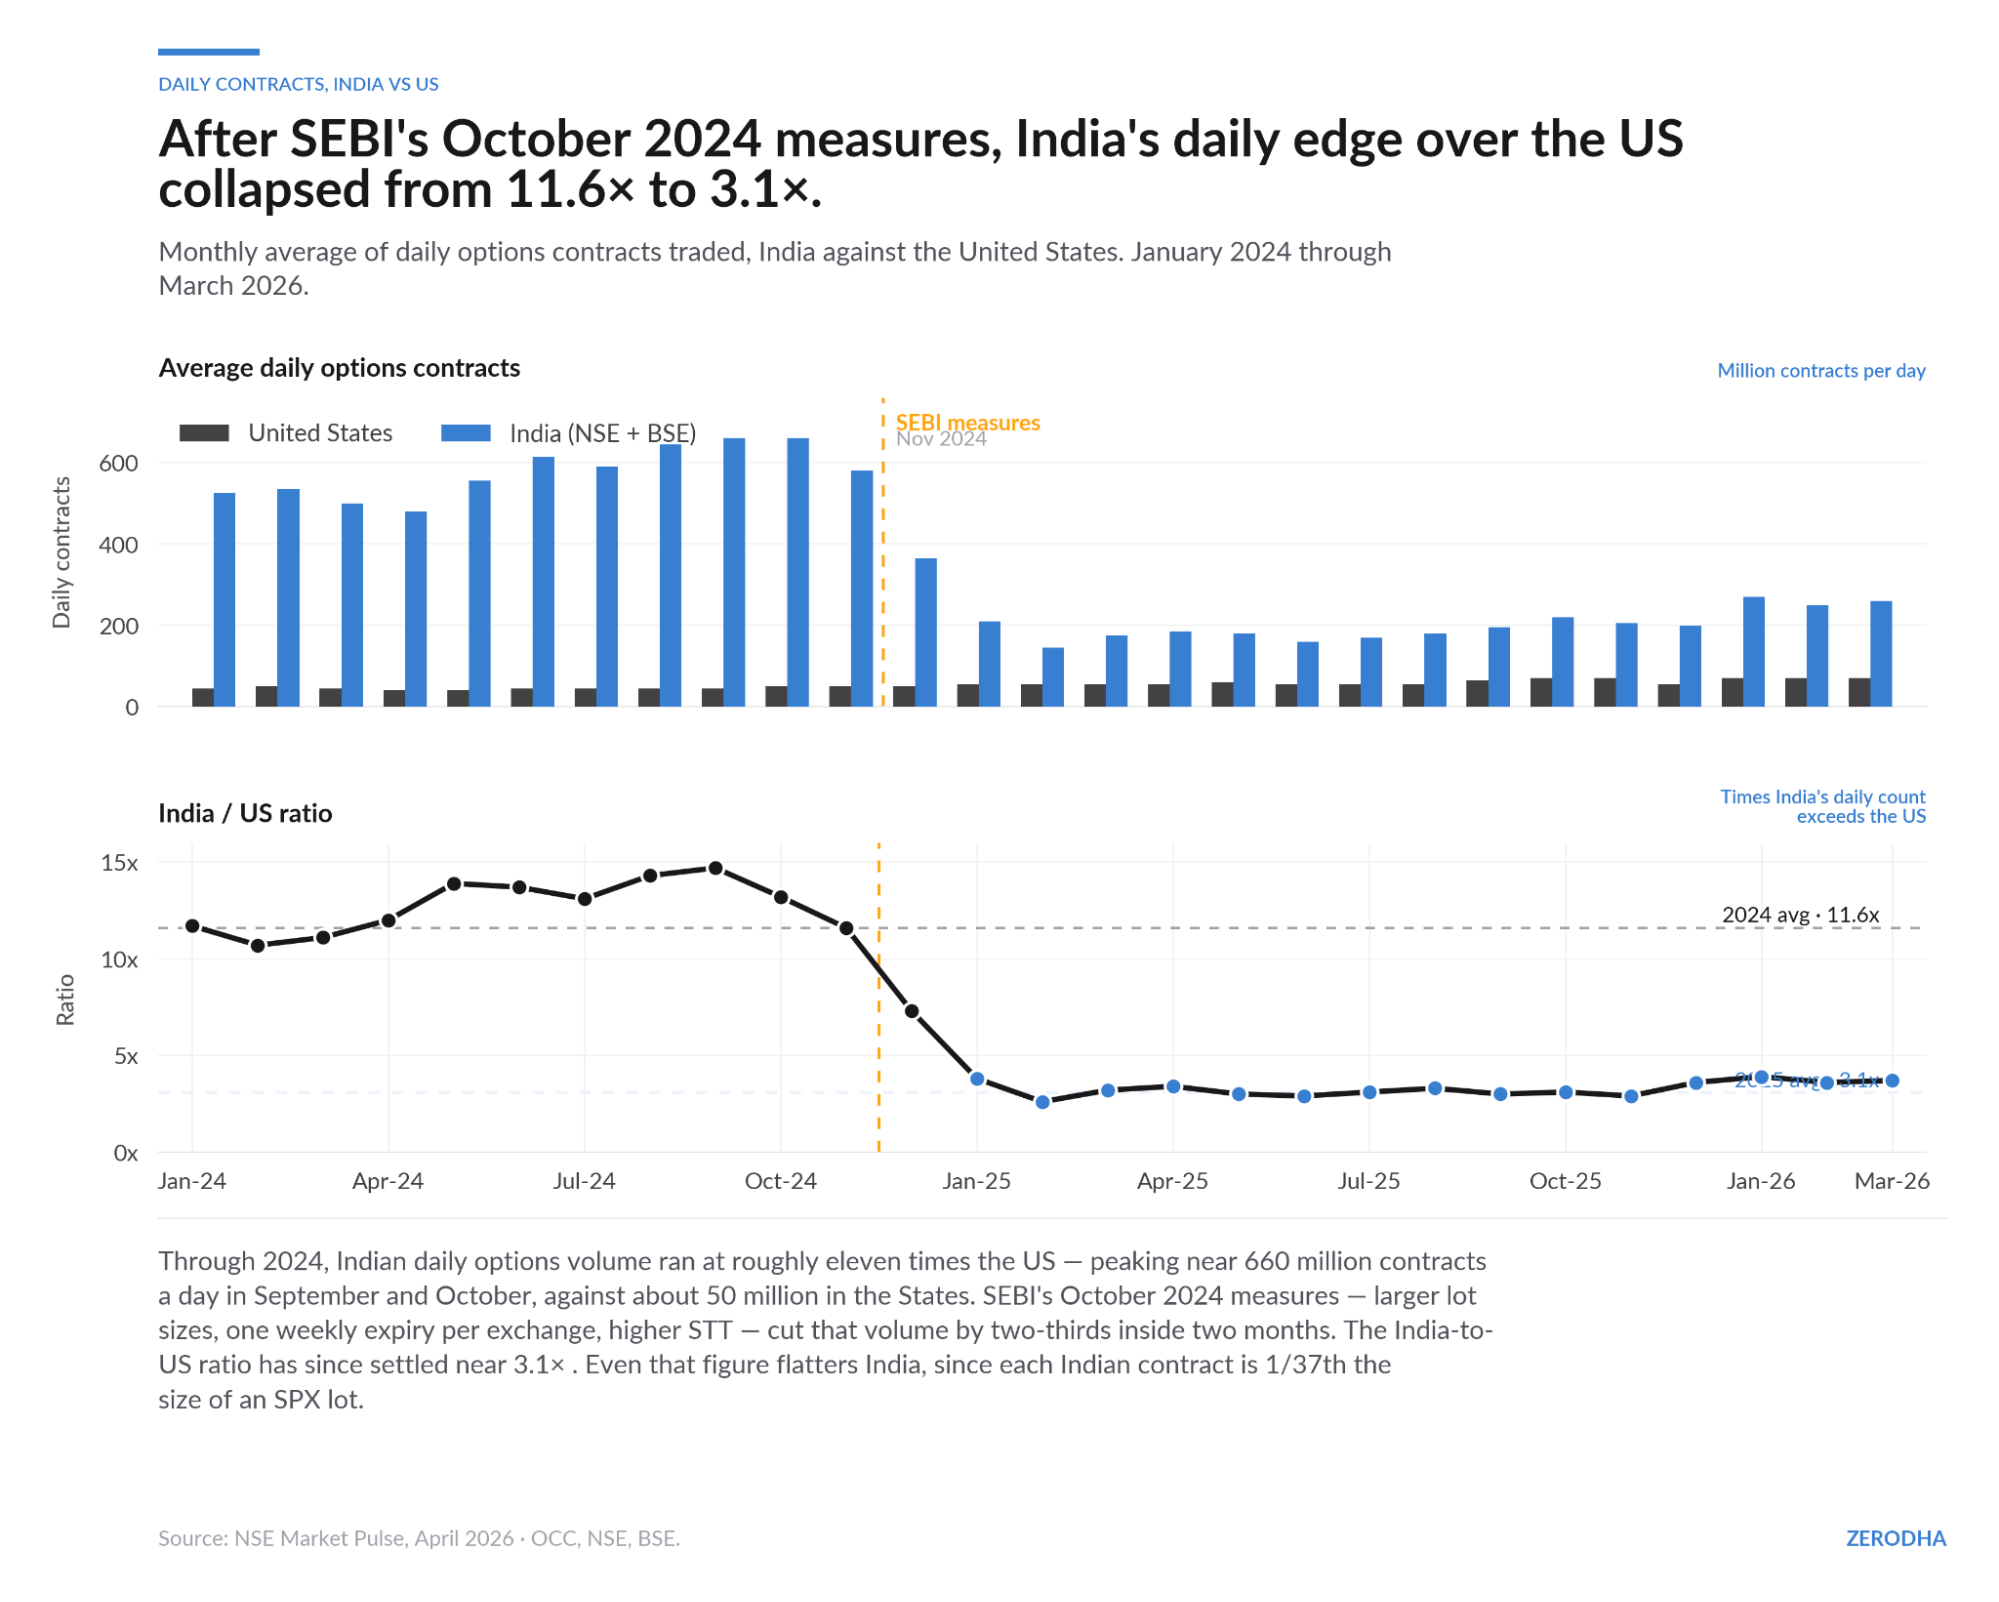
One SPX contract is over 31 times larger than a Nifty contract. Even the mini-SPX (the smaller one) is over 3 times larger. So when India trades 3.8x the US in number of contracts (in 2025, post-SEBI measures; it was 12x in 2024), it’s actually trading a fifth of the premium value. The contract count comparison is not just misleading; it’s backwards.
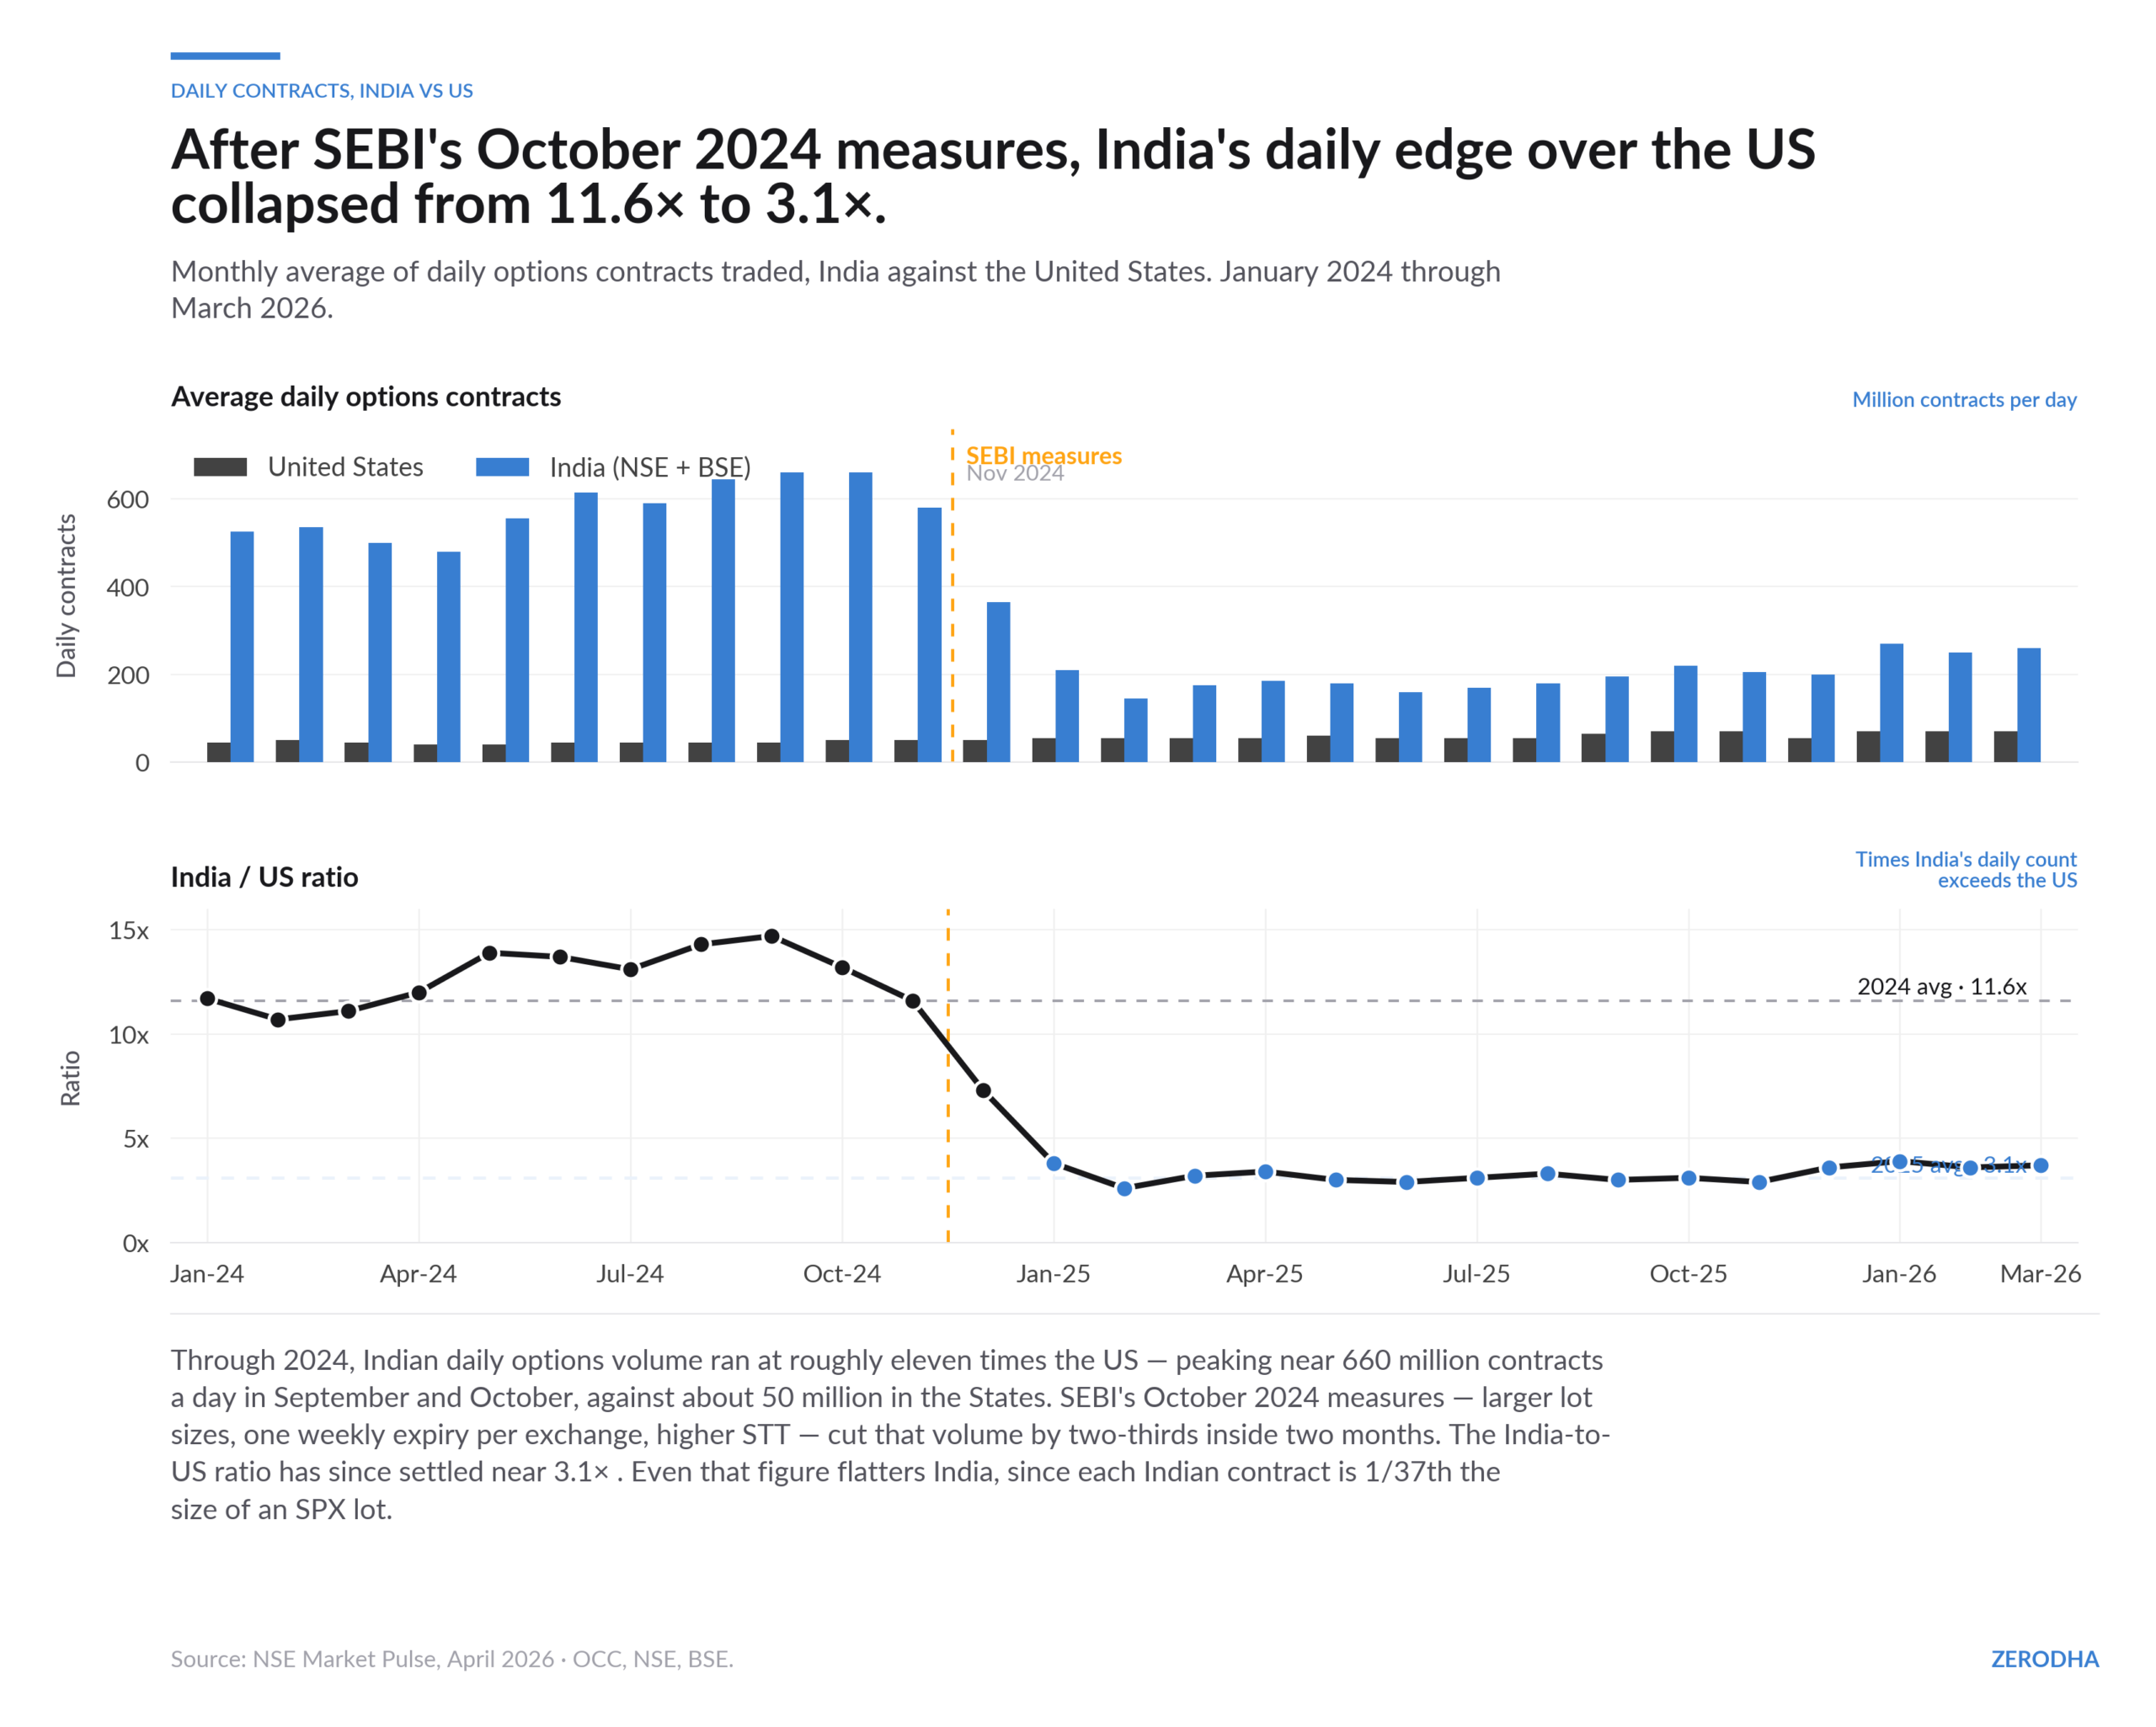
India peaked at 650–680 million contracts a day. It’s now at 150–250 million following SEBI’s measures. The US trades 50–80 million contracts a day. Does that mean India is still 2-3x the US in any meaningful sense? No. Because the contract sizes are not comparable. You’re comparing different units. It’s like saying India produces more bricks than the US produces skyscrapers and concluding India is building more.
Brazil proved this, in real time
If you needed a cleaner demonstration, Brazil’s B3 provided one in early 2025. B3, the largest futures exchange in Latin America, slashed its index options contract size by 99%. The multiplier went from 1x the Ibovespa to 0.01x. Contract value dropped from ~US$22,050 to ~US$220. The average traded premium fell from ~US$871 to ~US$8.71, and contracts traded jumped 56x.
Same traders and same capital but 56 times more contracts. Before the change, Brazilian contracts were 3.2x the size of Indian ones. After, they’re 0.03x. The contract counts are now completely incomparable, and yet people will cite both in the same breath as if they’re measuring the same thing.
The right number: Premium turnover
When you’re trading options, you don’t pay the full notional value of the contract. You pay the premium. So premium turnover is what actually tells you the economic scale of an options market: not notional value, not contract count. This is the number that reflects actual money changing hands.
And here, the numbers look very different.
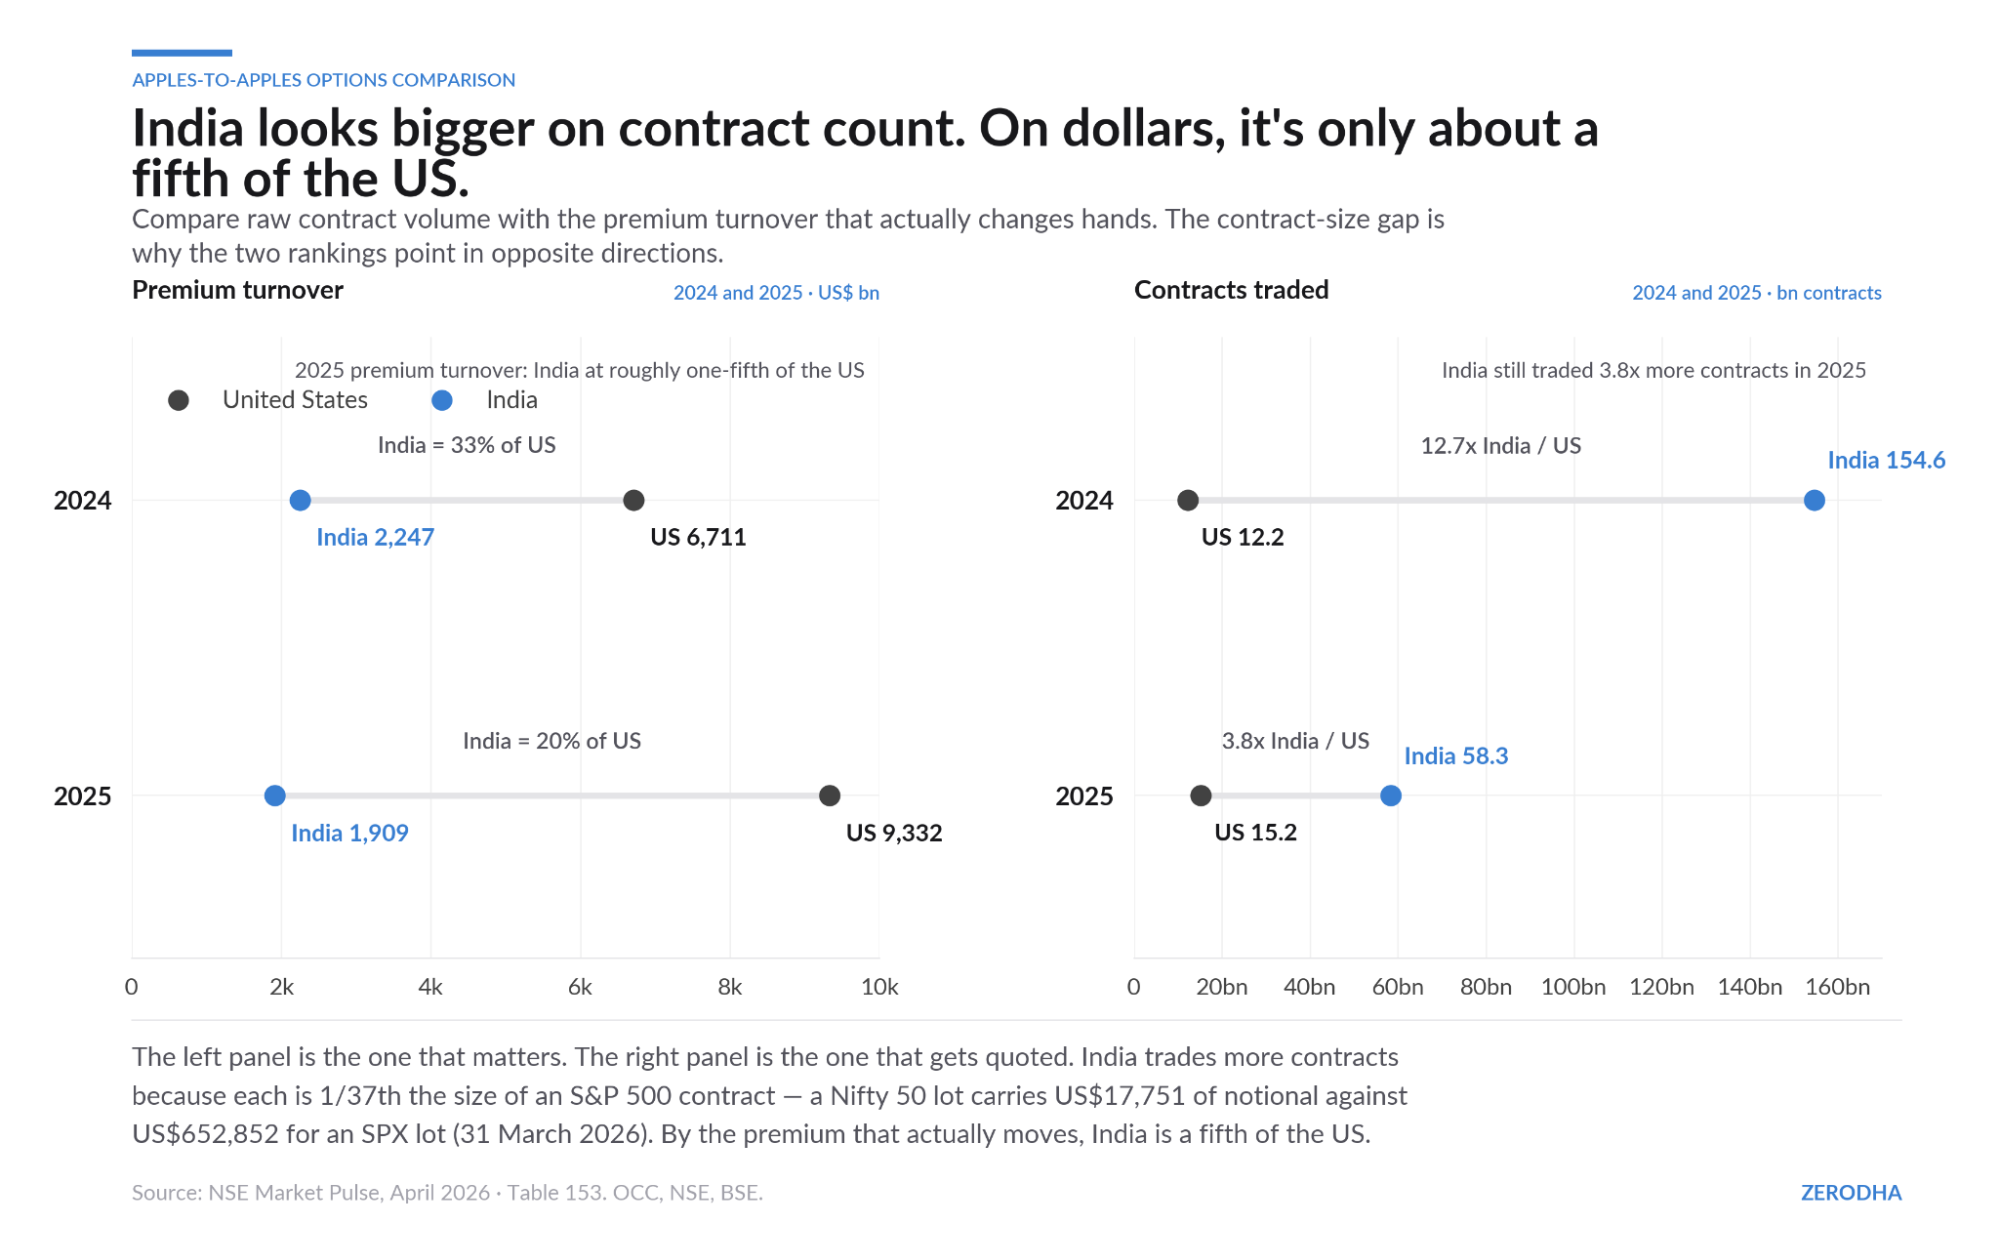
India’s total options premium in 2025 was US$1,909 billion. The US was $9,332 billion. India is at 20% of the US and falling. It averaged about 35% in 2024. In daily terms, the US does $25–45 billion a day in premiums. India does US$5–10 billion. US premium volumes are growing. India’s are flat or declining.

Stock options are just 5% of US premiums. Even index options (where India is supposedly the world’s largest market) are at 48%. And India has no ETF options at all. The US has US$1,630 billion in ETF options premiums that India can’t even be compared against.
And this comparison still understates how small India is, because the US number itself is an undercount. The OCC data covers 18 exchanges but doesn’t include off-exchange venues, dark pools, or CME derivatives on index futures, which add another ~25% on top.
How many people are actually trading?
This is where the narrative of an epidemic really falls apart.
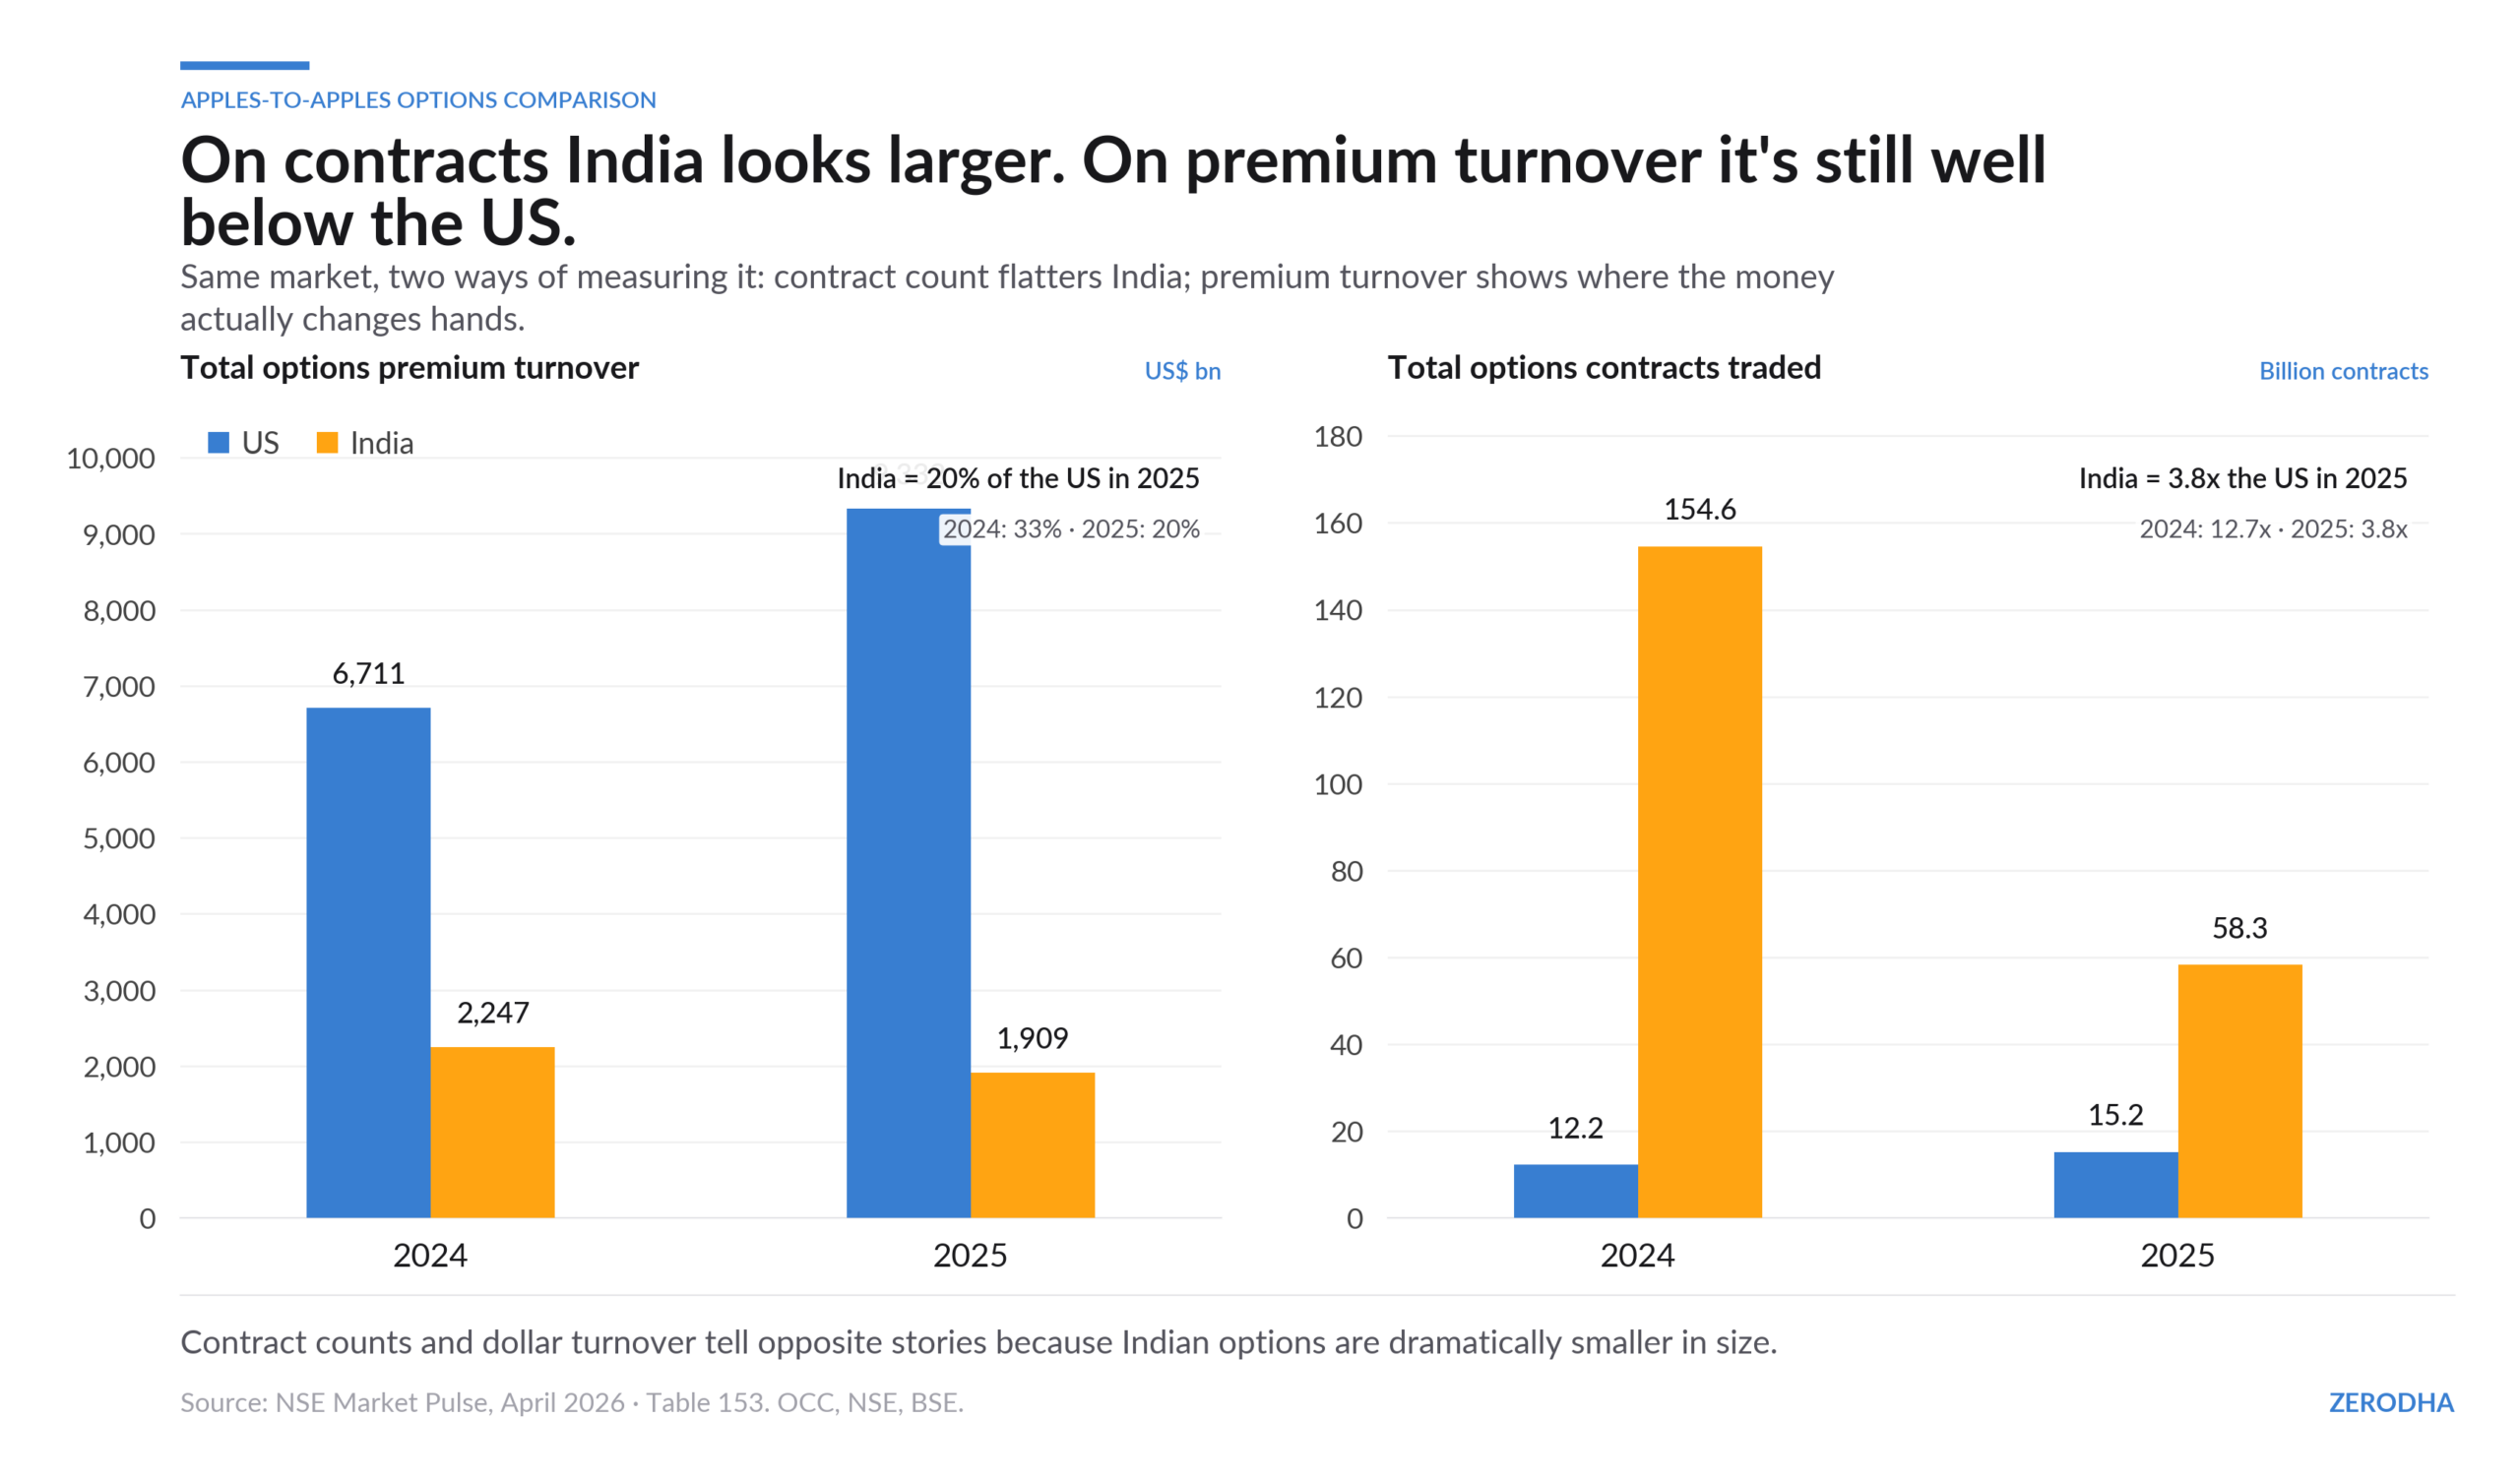
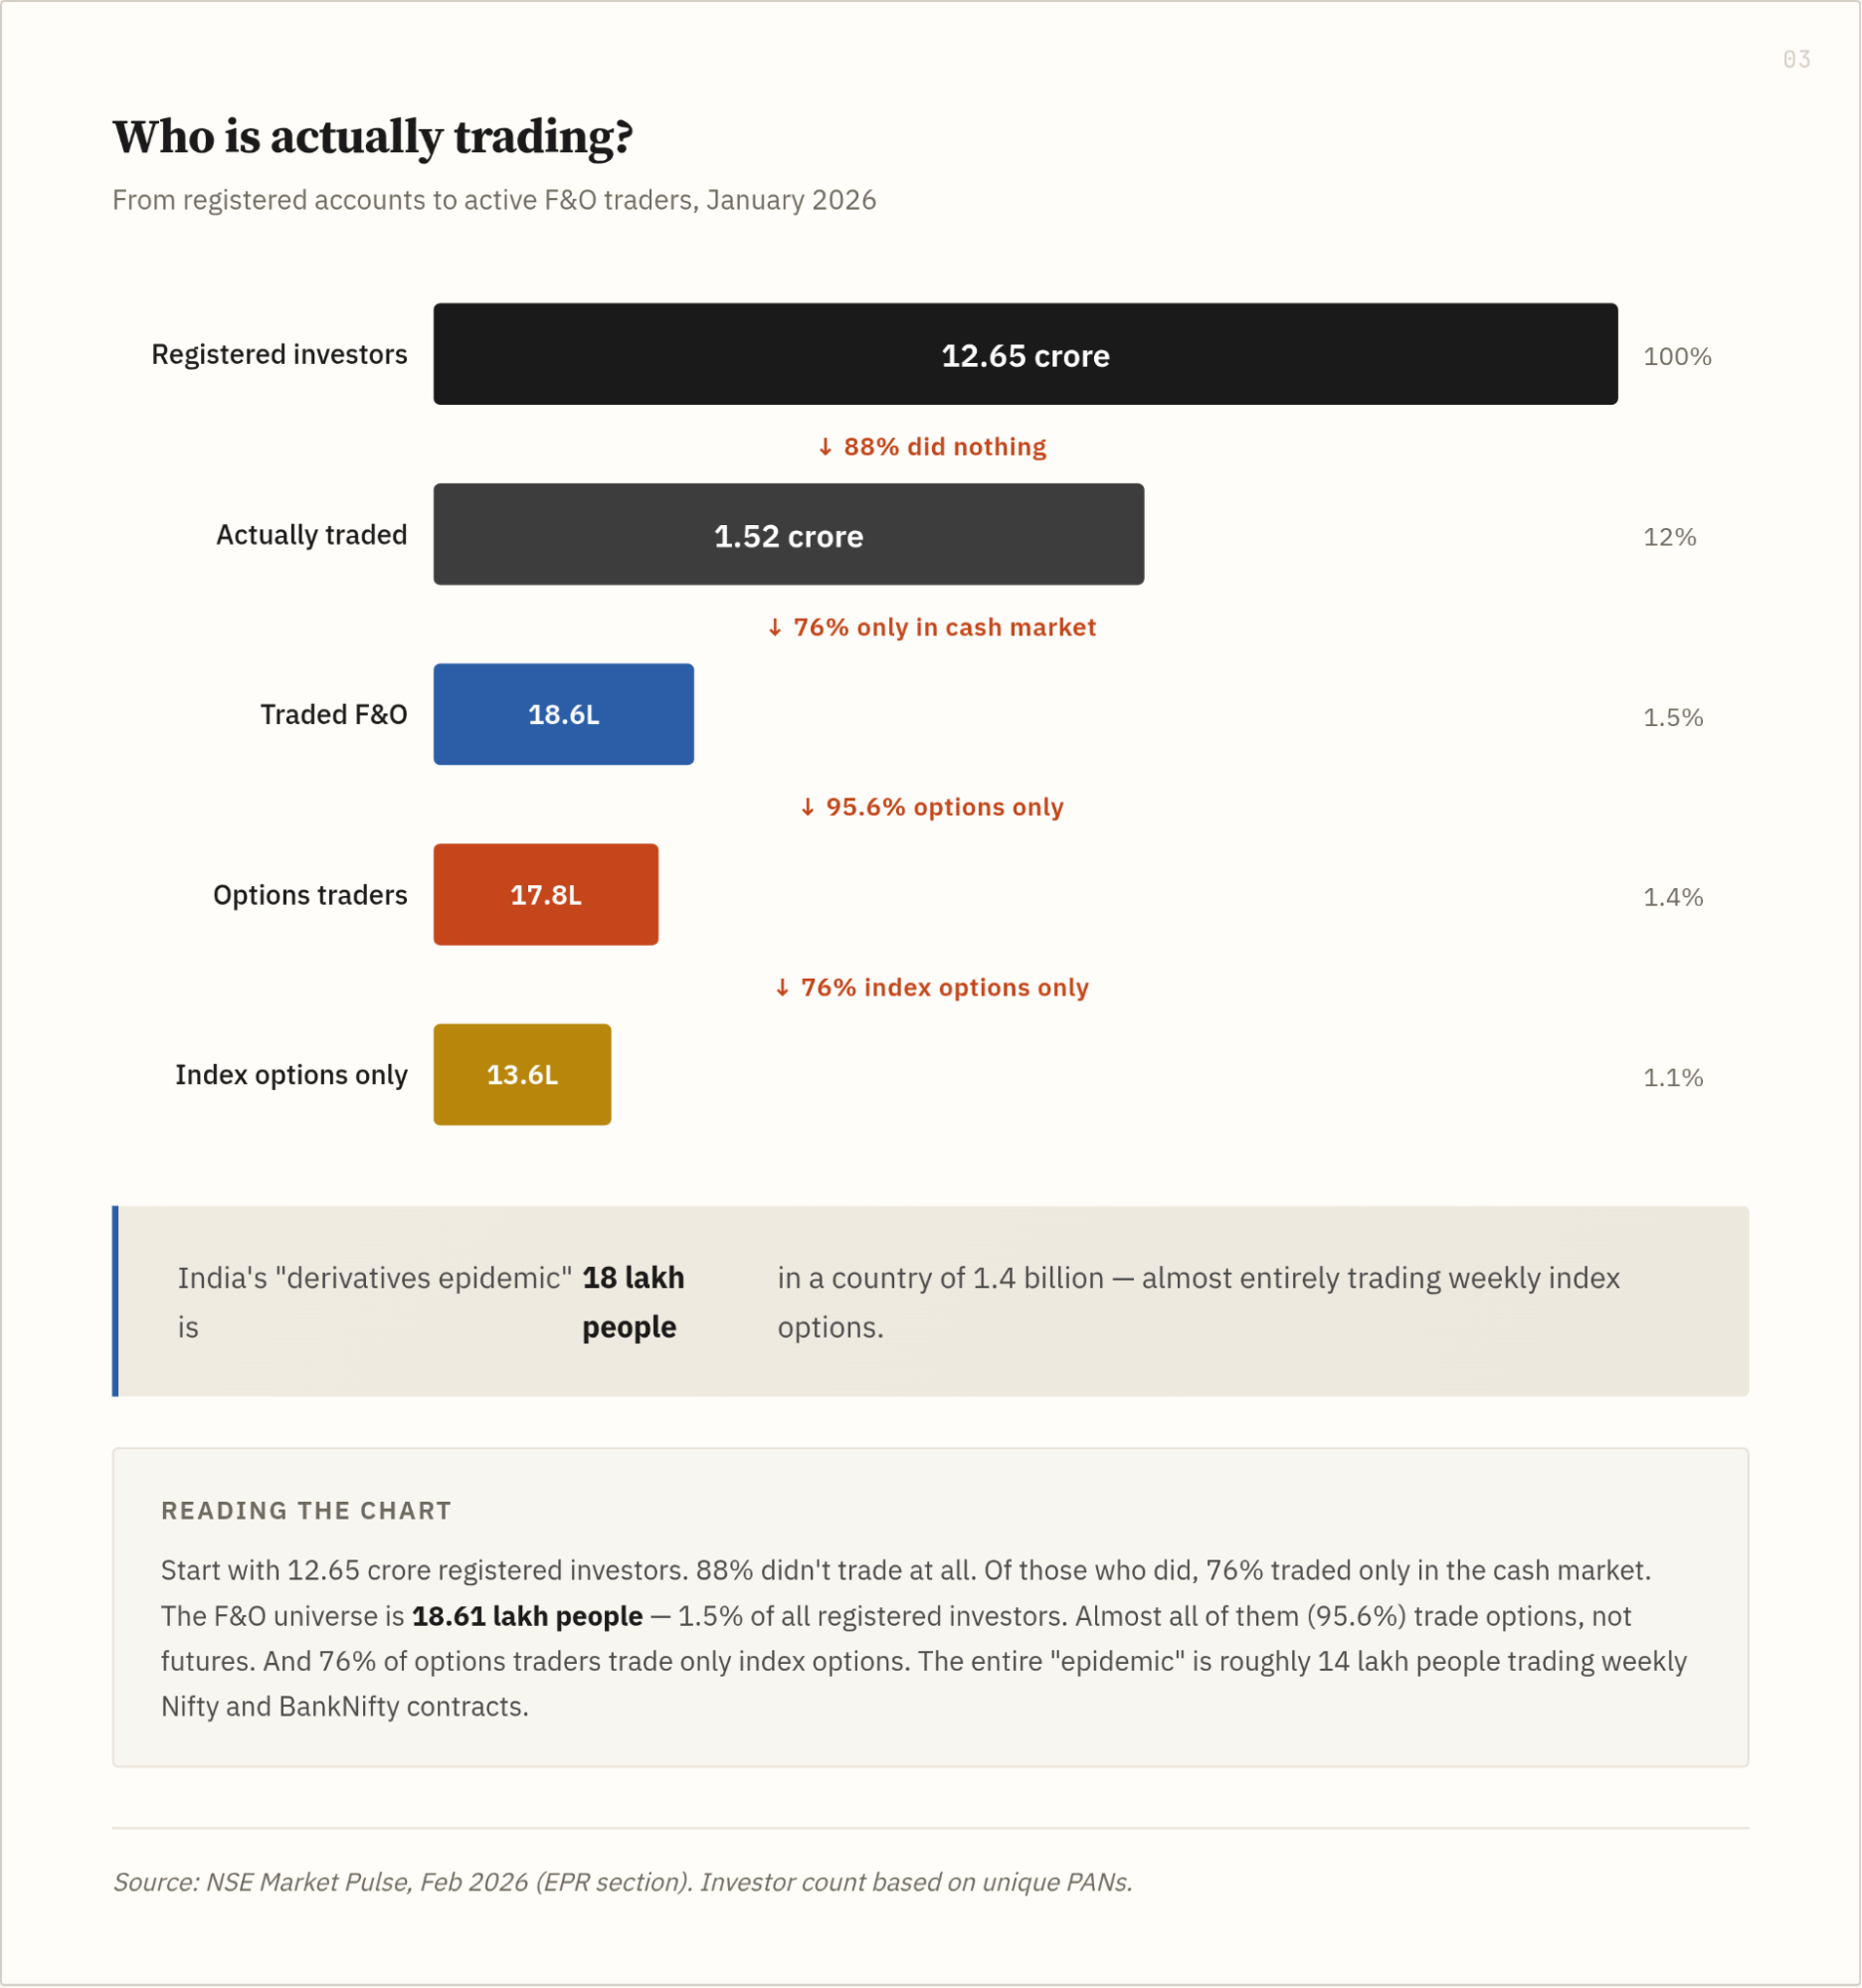
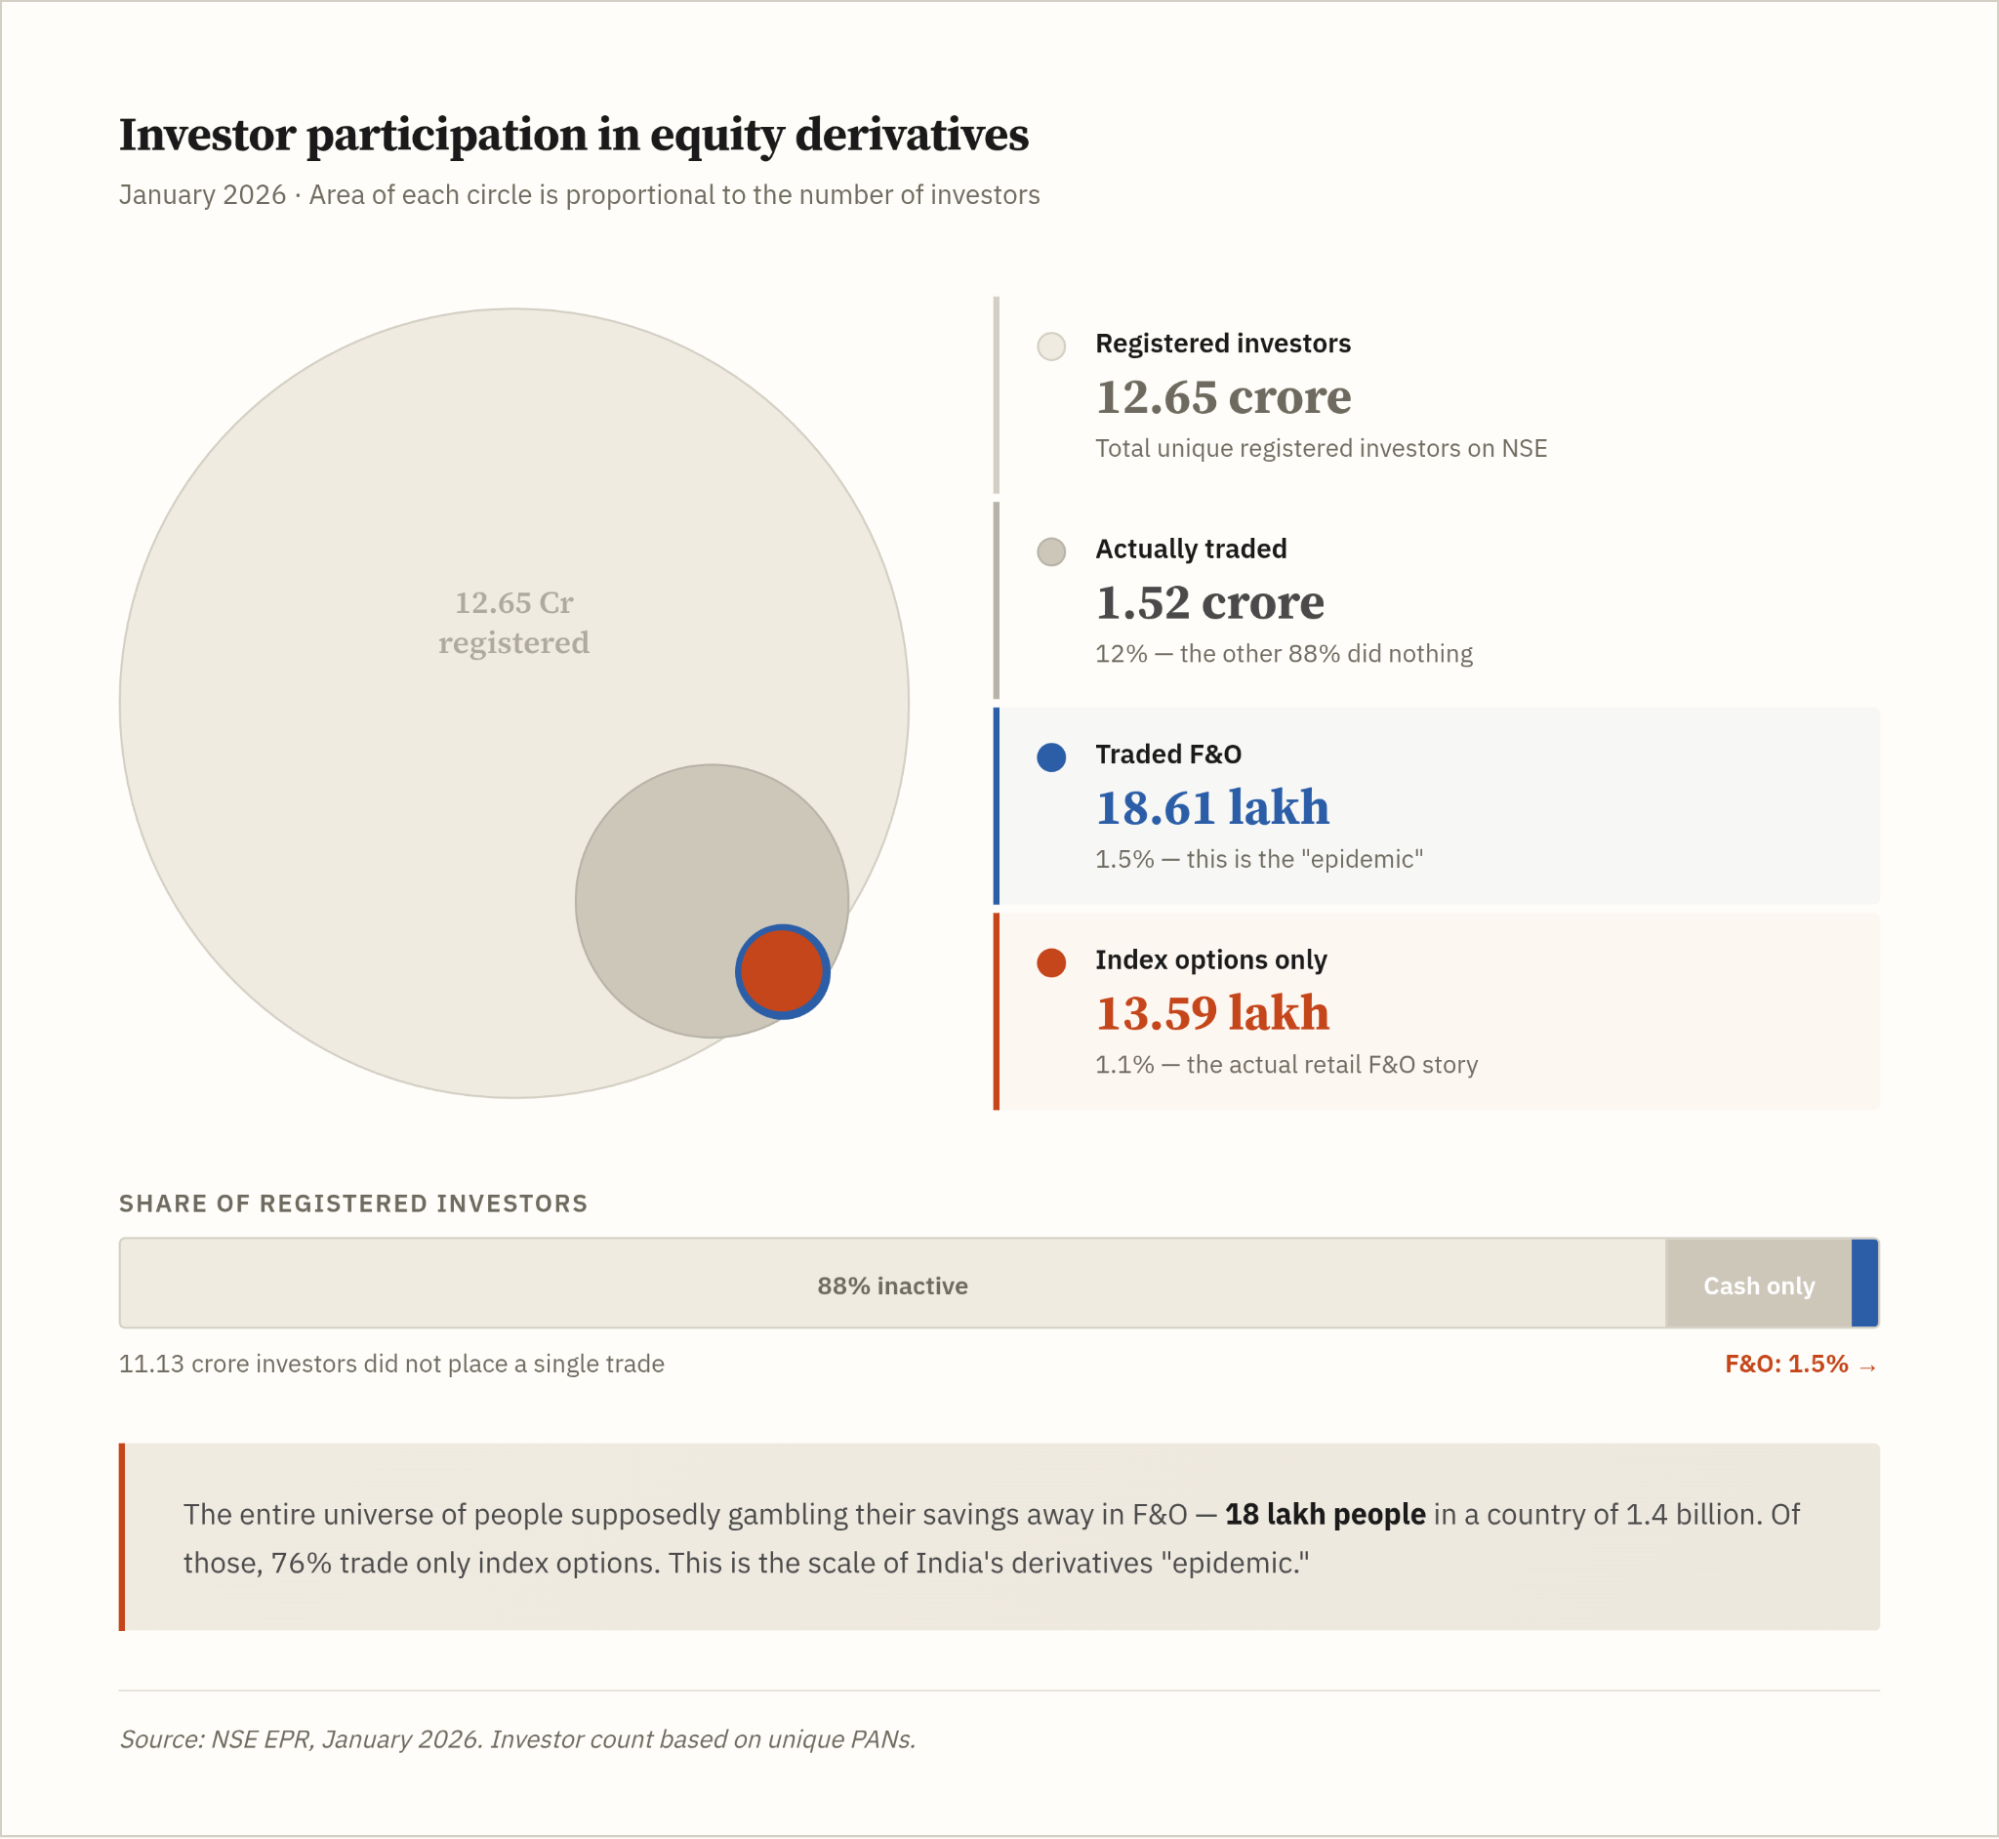
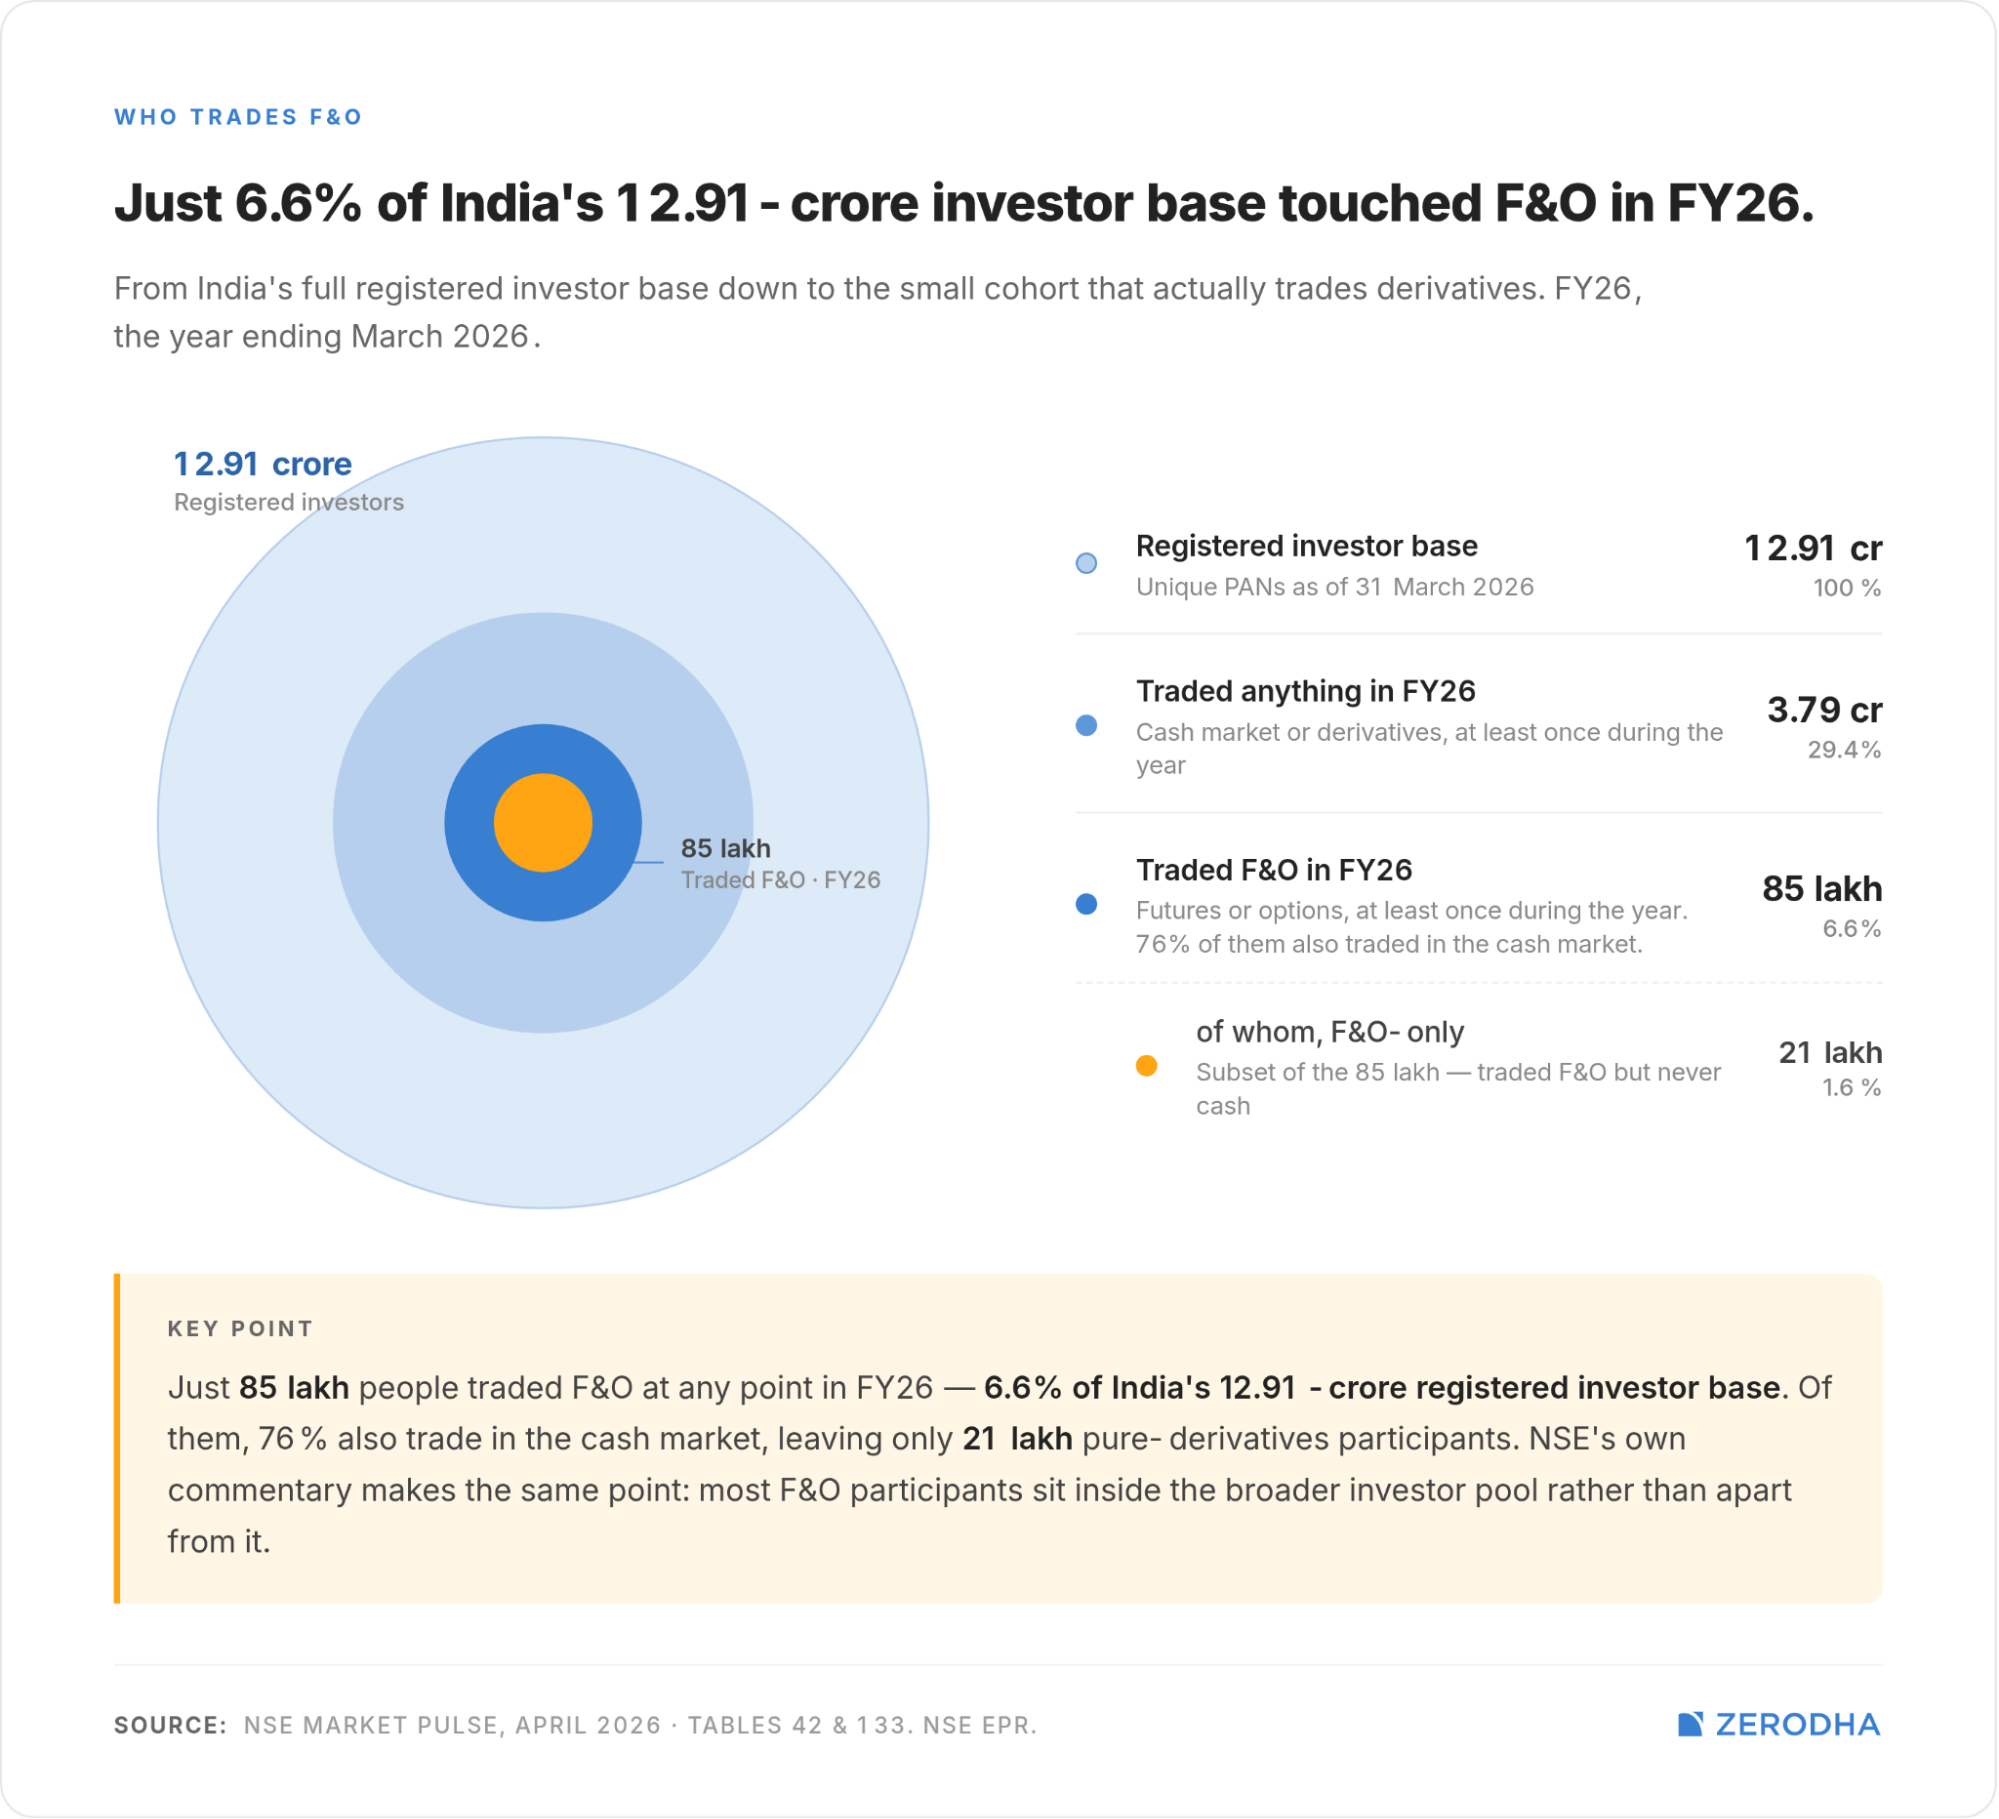
As of January 2026, India has 12.65 crore unique registered investors. Of these, 1.52 crore people actually traded during the month, 12% of the registered base. The other 88% did nothing. Not all registered investors need to actively trade in a given month, of course. But even so, 88% of accounts sitting idle is a useful corrective to the idea of a nation in a trading frenzy. NSE hasn’t yet updated the numbers as of March so, I’ve used Jan numbers but the conclusion doesn’t change, and the data will be similar.
Of those 1.52 crore active investors:
Data as of March 2026
The entire universe of people supposedly gambling their savings away in F&O—donating money to Jane Street and funding the carry of global prop desks—is 18-20 lakh people. In a country of 1.4 billion. That is the scale of India’s derivatives epidemic.
Almost nobody trades futures
Of those 18.61 lakh F&O participants:
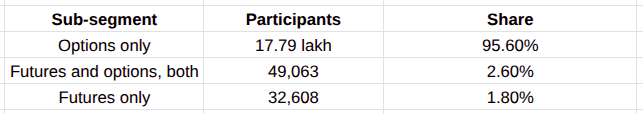
Source: NSE EPR
Almost everything is index options
Of the 17.79 lakh options traders:
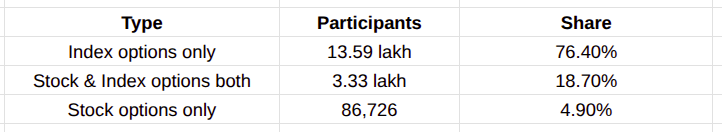
Source: NSE EPR
76% of options traders never touched a single stock option. They traded Nifty and BankNifty weekly contracts, almost exclusively. The retail F&O story in India is, in practice, almost entirely a story about weekly index options.
Data as of March 2026
Turnover concentration: The market looks retail but runs institutional
Even within the small universe of active traders, the turnover concentration is startling. This is probably the most important set of numbers in the article.
Equity Cash Market—March 2026
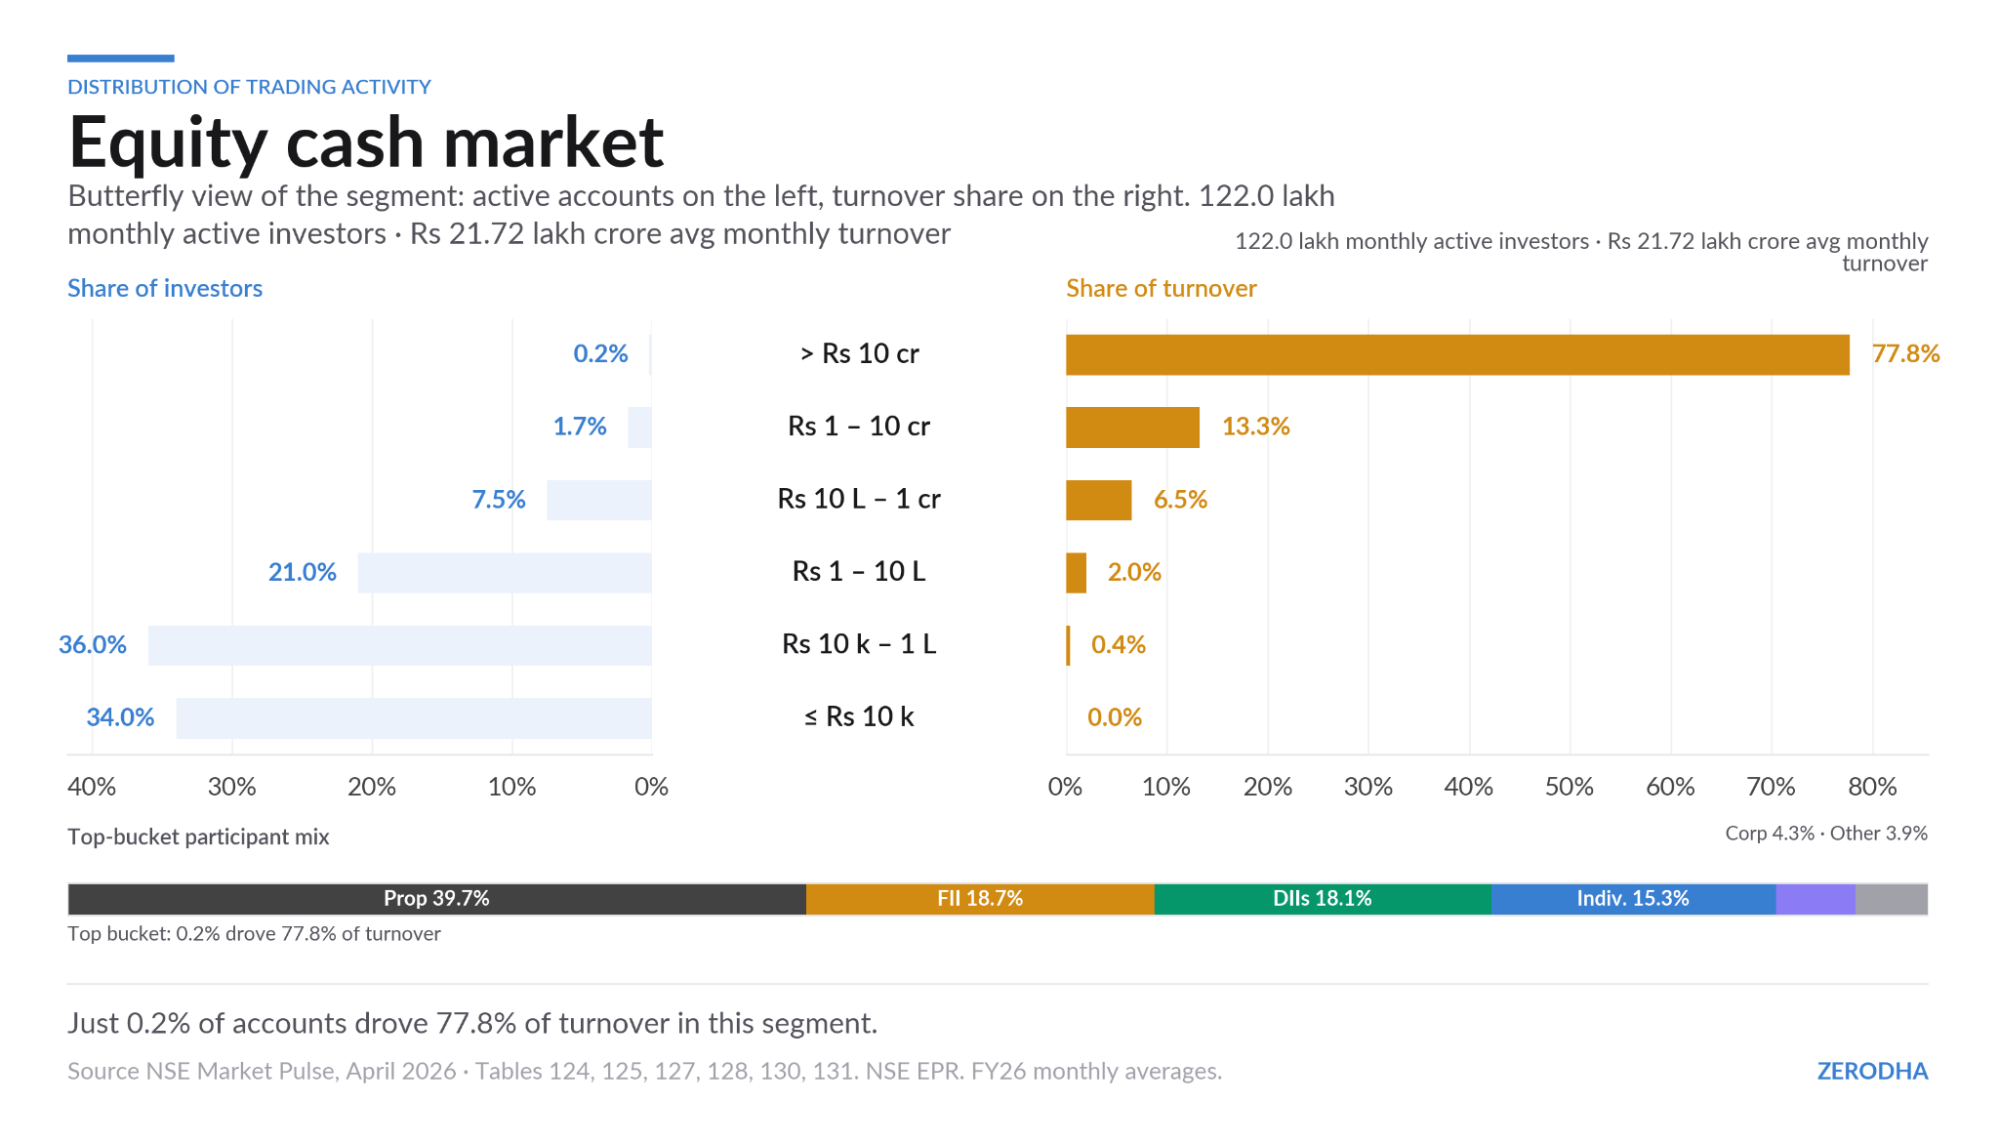
Turnover in the NSE cash market is heavily concentrated in FY26. The top 0.2% of investors, those trading more than Rs 10 crore a month, accounted for 77.8% of average monthly turnover, up from 77% in FY25 and 75% in FY24. At the other end, nearly 70% of investors traded less than Rs 1 lakh in a month and collectively contributed only 0.4% of turnover, underlining the long-tail nature of participation.
The top cohort was also institutionally dominated: proprietary traders accounted for 40% of turnover within this bucket, foreign investors 19%, and DIIs 18%, together making up 76% of the turnover in the highest trading bracket.
Equity Options—March 2026
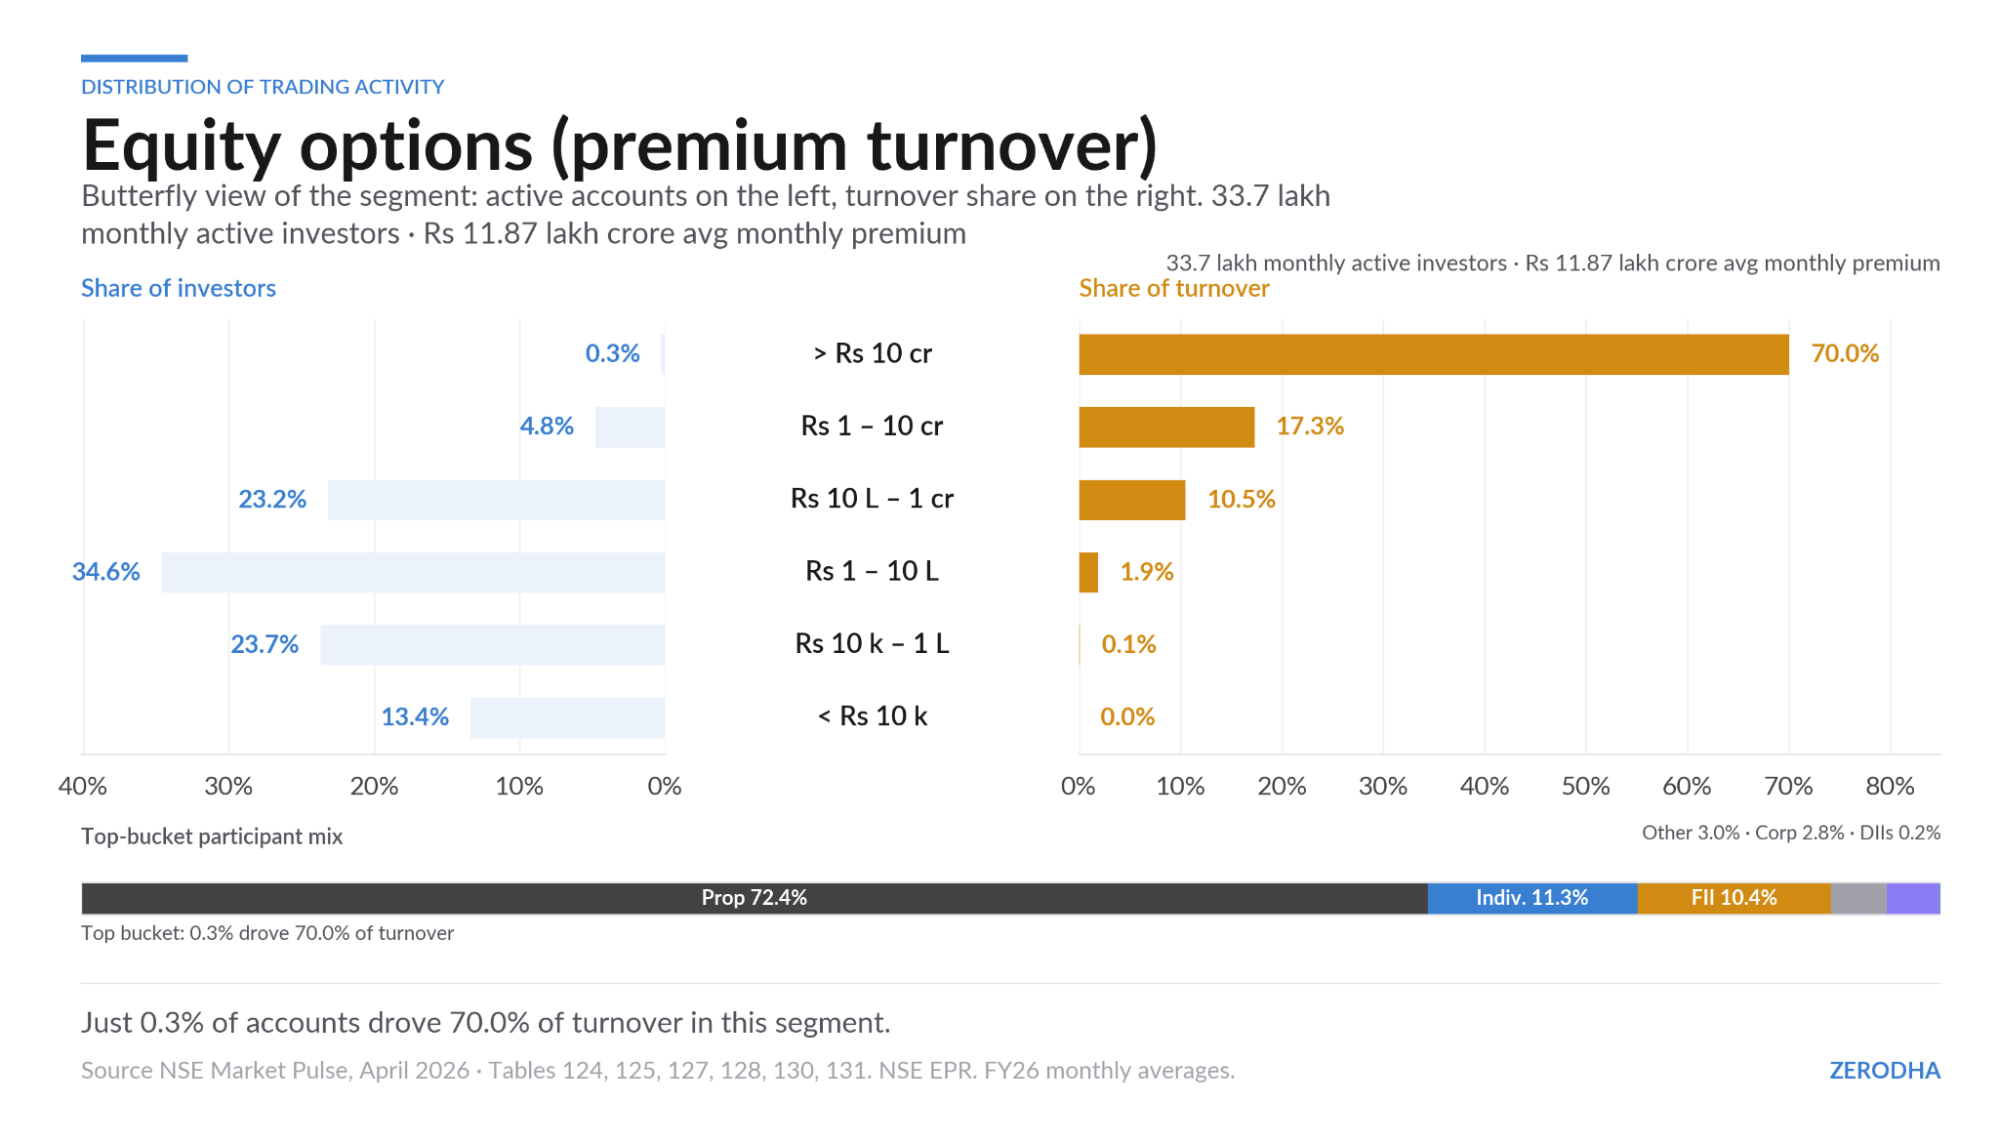
In equity options, the concentration story remains similar. In FY26, the top 0.3% of investors, those trading more than Rs 10 crore in monthly premium turnover, accounted for 70% of average monthly premium turnover. Another 4.8% of investors in the Rs 1 crore-Rs 10 crore bracket contributed 17.3%. Together, just 5.1% of investors generated nearly 87% of total premium turnover.
At the lower end, around 37% of investors traded below Rs 1 lakh and accounted for only about 0.15% of premium turnover. The top options cohort was dominated by proprietary traders, who contributed 72% of premium turnover, followed by individual investors at 11% and foreign investors at 10%.
The market looks retail in participation. It is institutional in economics.
What SEBI did
SEBI has been at this for a while. In January 2023, its first study found that 9 in 10 retail traders lose money in F&O. Budget 2024-25 raised STT on both futures and options. Then came the October 2024 circular formalizing six structural measures, implemented through November 2024: one weekly expiry per exchange, lot sizes tripled (from Rs 5-10 lakh to Rs 15-20 lakh), Nifty going from 25 to 75 units, and a 2% ELM on expiry-day short options. February 2025 added upfront option premium collection and removed calendar spread benefits on expiry day. April 2025 brought intraday position limit monitoring.
The measures worked. Daily contracts fell from ~650 million to ~200 million. The ratio of India-to-US contracts dropped from 11.6x in 2024 to 3.1x in 2025.
In July 2025, SEBI issued a follow-up study: retail traders lost Rs 1.05 lakh crore in FY25, an average loss of Rs 1.1 lakh per trader. The same month, SEBI’s interim order banned Jane Street and froze Rs 4,843 crore, the largest impounding order in SEBI’s history, after finding that Jane Street made Rs 36,500 crore in net profits from Indian markets between January 2023 and March 2025 through alleged intraday index manipulation on expiry days. The ban was lifted pending investigation. The investigation is ongoing.
Compared to What? The speculative surface
Here’s where things get interesting. A lot of people compare Indian speculative activity to the US. It goes without saying that the comparison itself is flawed, for obvious reasons. India is a poor country; the US is a rich country. GDP per capita isn’t in the same ballpark. The comparison falls flat if you don’t account for the starting trajectories.
But since people are already comparing the number of F&O contracts traded in India vs. the US, let’s go with it anyway. Let’s take the argument to its logical extreme and compare what is actually happening in both markets. When people say Indians are gambling their minds away, if you actually look at what’s happening in India versus what’s happening in the US, calling the difference a comparison is like comparing an apple to a rhinoceros. It makes no sense.
In the US, literally every element of life has been gamified and financialized. People can speculate and gamble on stocks, options, futures, and around-the-clock crypto derivatives through all sorts of avenues. And then there are the things that don’t even have equivalents in India.
The US speculative surface
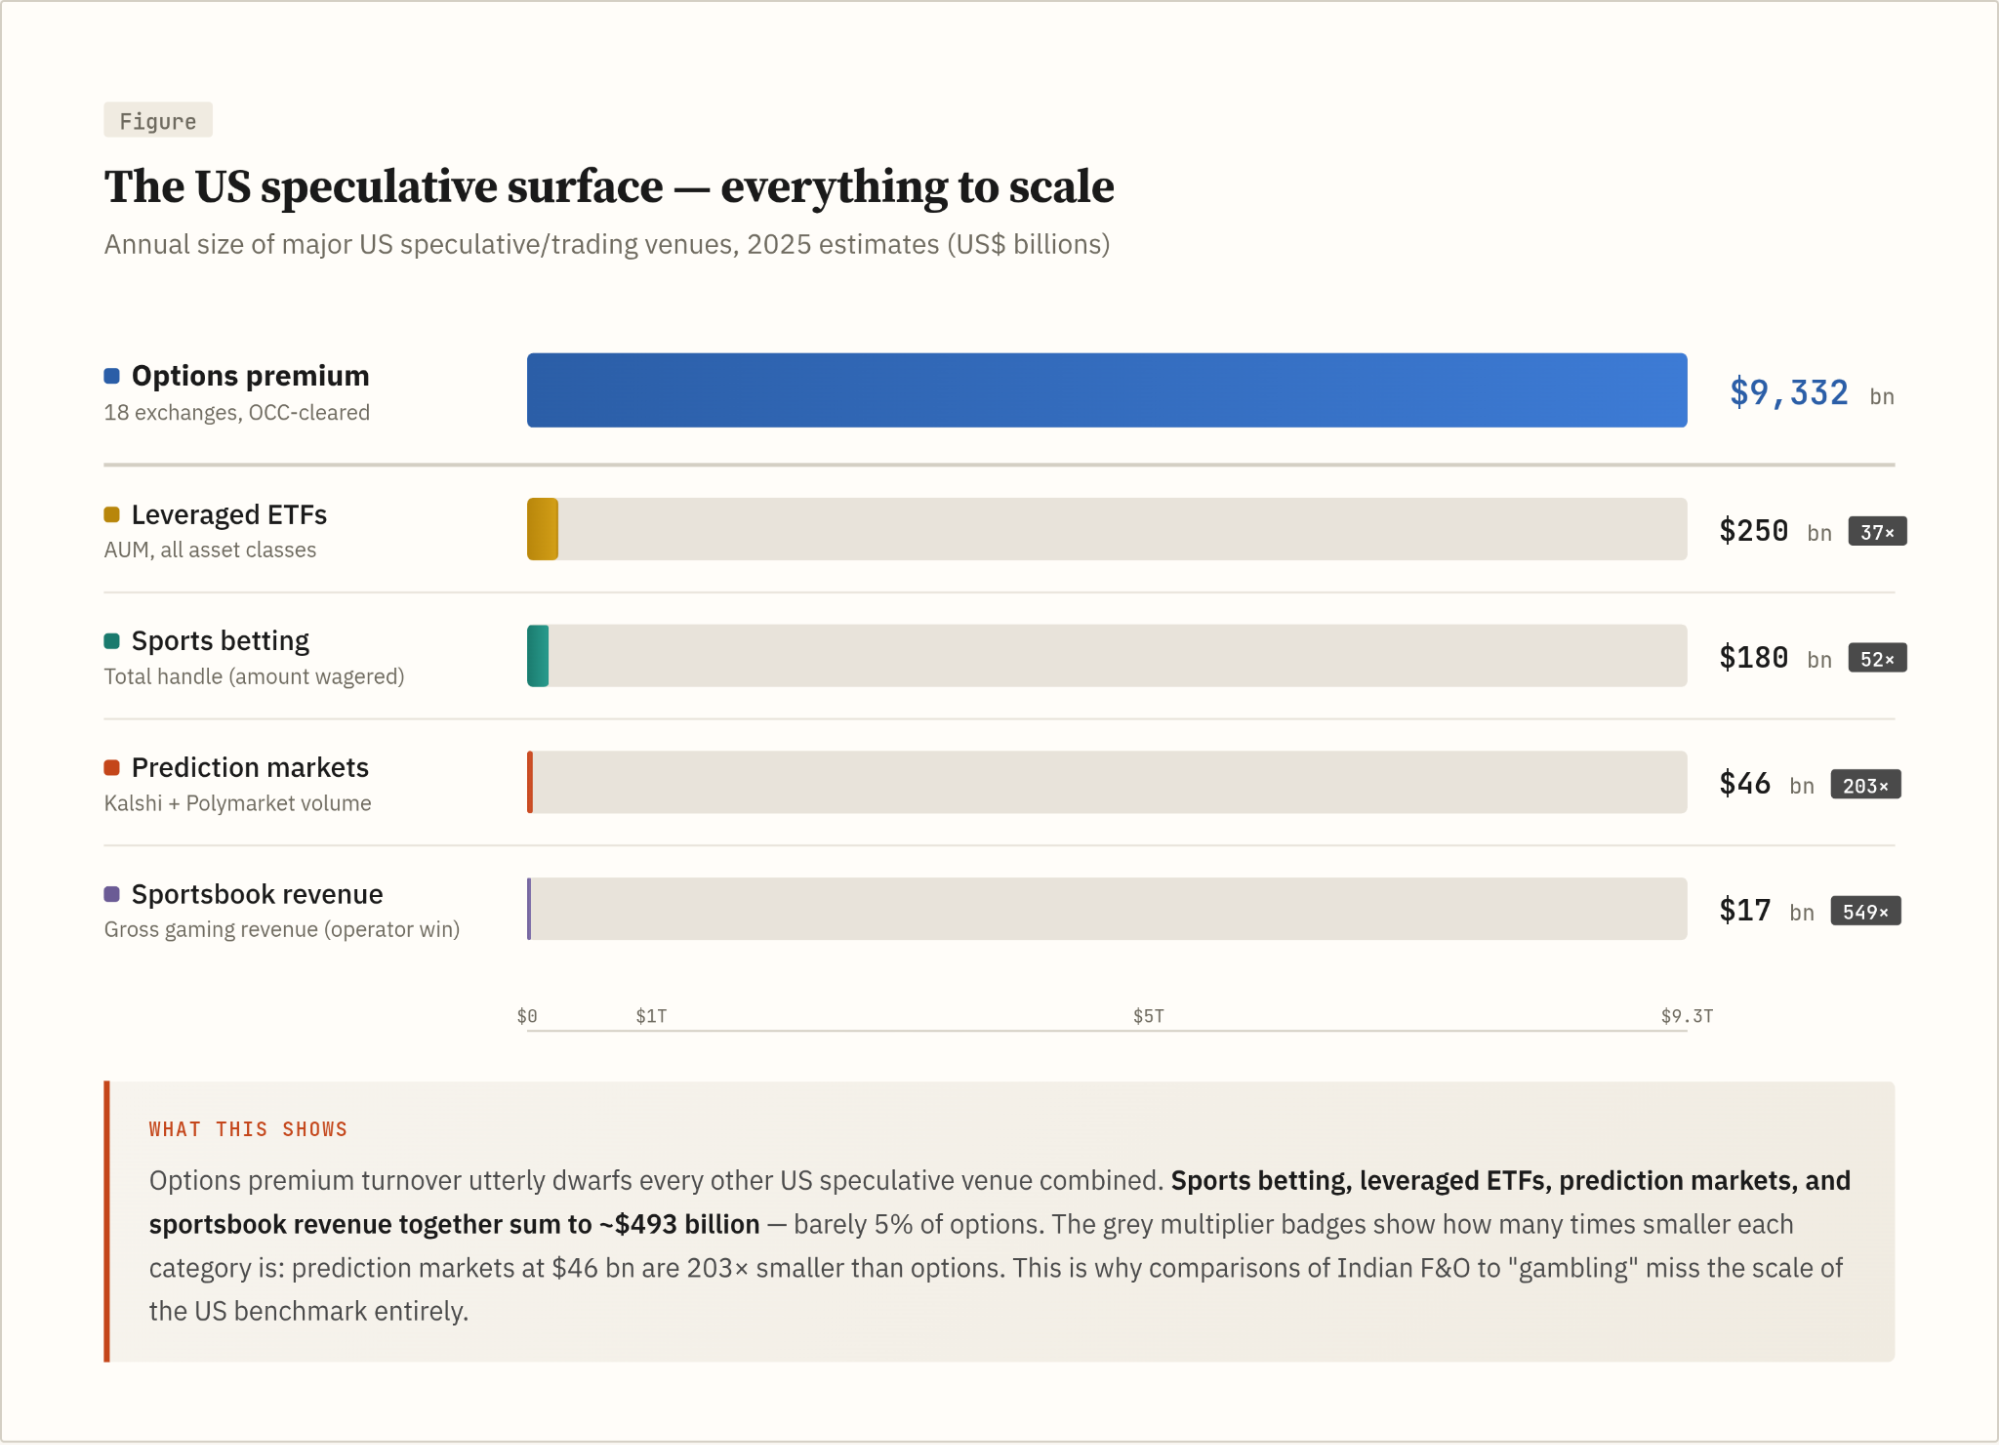
All figures from primary sources: OCC (Options Clearing Corporation), AGA (American Gaming Association), ETFdb (fund filings aggregator), Kalshi, and Polymarket (exchange-reported). Excludes daily fantasy sports (no primary source), off-exchange derivatives, and crypto.
Sports betting is legal in 38 states, marketed on every major broadcast, with FanDuel and DraftKings spending over a billion dollars on marketing. The AGA reports 21% of American adults placed a legal sports bet in 2025. Leveraged ETFs include single-stock 2x products on Tesla, Nvidia, and Palantir that didn’t exist before 2022 and are now mainstream retail instruments.
Prediction markets went from essentially zero to $46 billion in two years (Kalshi and Polymarket combined); DraftKings has launched a standalone prediction markets app, and both Nasdaq and CBOE have signaled interest in binary bets on traditional market indices. And this doesn’t even count 0-DTE options, which now account for ~59% of all S&P 500 options volume.
India’s speculative surface
Now look at India’s side of the ledger.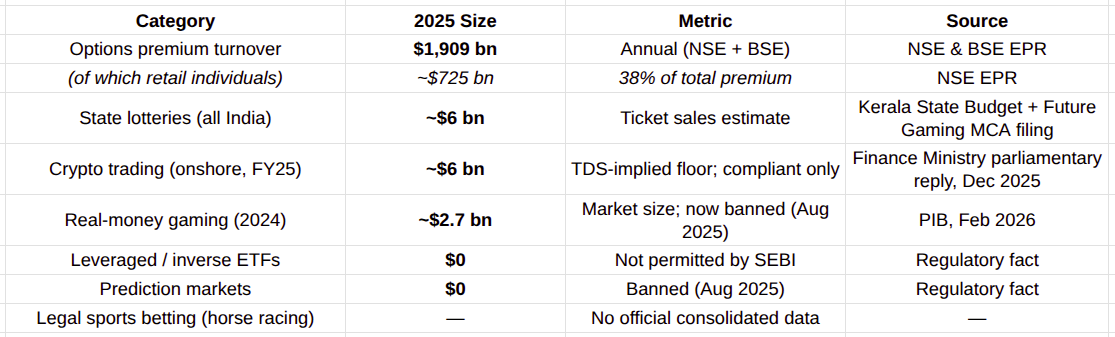
Options from NSE & BSE EPR. Crypto volume back-calculated from 1% TDS collections (₹511.83 crore in FY25, Finance Ministry reply to Parliament, Dec 2025). Lotteries estimated from Kerala state budget (₹14,121 crore BE FY26) and Future Gaming’s MCA-filed revenue (₹22,965 crore FY23) — no consolidated all-India figure exists. RMG from PIB press note (Feb 2026, NoteId 157440).
India has no leveraged ETFs. No prediction markets. No legal sports betting to speak of.
Real-money gaming was sizable before it was banned in August 2025. Crypto trading has been crushed by the 30% tax and 1% TDS. Onshore compliant crypto volume is roughly $50,000 crores based on TDS collections. The domestic speculative infrastructure, other than F&O, is either banned, taxed to irrelevance, or trivially small.
That doesn’t mean there are no avenues for Indian gambling. After the real money gaming ban, activity seems to have migrated to illegal offshore apps. CFD platforms continue to be popular among a section of people, and of late crypto derivatives have become popular. While I don’t have numbers for these, they’ll still be rookie numbers compared to the US.
State lotteries are the largest non-F&O speculative avenue; Kerala alone sells ~₹12,000 crore in tickets annually. A rough all-India estimate is probably ~$6 billion in ticket sales. But this is government-run, physical, and entirely invisible in the capital markets conversation.
Yes, there is a massive illegal cricket betting market, but that is entirely underground, untaxed, and outside the scope of any capital markets comparison. If anything, its existence is an argument for regulated speculation: give people a legal channel, or they’ll find an illegal one.
The point is simple. India’s total speculative surface across at least the visible one across F&O, lotteries, crypto, and the now-banned real money gaming industry is big in absolute terms but tiny when compared to the likes of the US. The overwhelming majority is options premium turnover, dominated by prop traders and institutions. The US speculative surface across options, sports betting, leveraged ETFs, and prediction markets is massive by comparison.
India is a 2-year-old toddler. The US is a university for the higher studies of speculation.
And then there is where all of this ends up if you follow financialization far enough down the road.
On February 28, 2026, US and Israeli forces killed Ayatollah Ali Khamenei. Within hours, it emerged that traders on Polymarket and Kalshi had placed bets on his removal in the minutes before the strikes were announced, with blockchain analytics pointing to accounts funded hours before the attack. Kalshi froze its “Khamenei out as Supreme Leader?” market entirely, citing a “death carve-out” in its terms, which sparked a class action lawsuit.
A military strike, a human life: reduced to a financial contract, priced in real time on CFTC-regulated venues. Think about the grotesqueness of the moment. A large enough death market creates a financial incentive for the act that triggers the payout. If that doesn’t make your stomach turn, I don’t know what will.
India’s retail investors are losing money on weekly Nifty options. That is worth fixing. But the financial system running the most aggressive speculation on the planet, on war, on death, and on geopolitical outcomes, is not in India.
On speculation being inevitable
I’m not here to make moral judgments about whether speculation is right or wrong. I’m just here to point out that it’s impossible to stop.
Can you have a market where 100% of every single rupee goes to productive uses? I don’t think so. The future is unknowable. Uncertainty is traded, hedged, and becomes a bet. Speculators provide liquidity, absorb risk, and make hedging possible. Remove them entirely and you get an illiquid market. The reality is that the ideal amount of speculation in any functioning market is nonzero. All of this gets into messy questions about the nature of capitalism itself, which I’m not qualified to answer. But if you take a reasonable middle ground, the answer is obvious.
Humans have been speculating and gambling since the dawn of time. The oldest known dice were astragali, the ankle bones of hoofed animals, and they go back at least 8,000 years. The first people throwing them weren’t gamblers. They were shamans using them to divine the future and know what the gods had in store. The Mahabharata hinges on a dice match where a man loses his kingdom, his wealth, and his brothers. This instinct to put something at risk on an uncertain outcome is not a product of the smartphone or the zero-brokerage app. It is as old as humanity.
I think the goal isn’t to stop speculation; that’s not possible. I think the goal should be channeling speculative tendencies toward transparent, safe, and regulated venues—into the light. The simple truth is speculation is like water; it will find a way through.
India just ran a prohibition experiment in real time. In August 2025, Parliament banned all real-money gaming: rummy, fantasy sports, poker, the lot. Within months, the same demand had migrated offshore. A survey found offshore platform usage among former real-money gaming users jumped after the ban. Four offshore platforms received 1.6 billion visits from Indian users in just three months, outside Indian jurisdiction, with no consumer protections, no age verification, and no tax contribution.
Banning domestic platforms just drives users offshore, where there is no recourse. This has happened time and again, in every market, in every era. The right answer isn’t prohibition.
What a suitability framework looks like
The challenge for policymakers isn’t stopping speculation; I don’t think that’s possible. It’s finding the balance between letting markets do their job of allocating capital and protecting people from obvious harms. That’s never been easy, and it never gets solved permanently.
Every mature derivatives market has some version of a suitability framework. In the United States, brokers slot customers into tiered options trading approval levels based on experience, net worth, and investment objectives; Level 1 is typically covered calls, while higher levels allow naked options only for customers with substantial experience and capital. In the European Union, MiFID II requires an appropriateness test for non‑advised complex products such as derivatives; if you fail, the broker must warn you, and many firms choose not to let you proceed.
In Singapore, the Monetary Authority of Singapore requires a Customer Knowledge Assessment before you can trade any specified investment product; if you fail but still wish to trade, firms typically need additional safeguards and internal approvals. Japan simply keeps derivatives out of its tax‑advantaged NISA savings scheme entirely. In India we don’t yet have a suitability framework, although there’s no shortage of rumors about it.
Instead, the policymakers and regulators have been using measures like increasing margins and lot sizes, increasing STT, and reducing the number of weekly expiries to raise the price of entry and curtail speculation. But the problem is that these measures make no distinction between a seasoned trader who can absorb losses and someone who cannot. The former gets priced out unnecessarily; the latter finds a way in anyway.
A suitability framework would do what the current measures don’t: screen on understanding and risk capacity, not just wallet size
So what’s actually going on?
People losing money in F&O is a real problem. The 90%+ loss rate isn’t made up and SEBI was right to act.
But the scale is being dramatically overstated, because people are using contract count, a number with zero information value, to draw conclusions about market size and systemic risk. Use the wrong numbers, reach the wrong conclusions, and end up with policy responses calibrated to a problem that doesn’t exist in the form you imagined.
Here’s the correct picture: India’s options market is about 20% of the US by the only measure that matters: premium turnover. The “epidemic” involves 18 lakh people in a country of 1.4 billion, almost all of them trading small amounts in weekly Nifty options. 70% of premium turnover is generated by 12,000 accounts, and prop traders alone account for more than half. SEBI’s measures have already cut daily contracts by 70%. India’s entire regulated speculative surface is a fraction of US sports betting alone.
This is a retail investor protection problem, worth taking seriously, worth addressing carefully, and worth building a proper suitability framework for. It is not evidence of a runaway speculative market that dwarfs global peers.
When you’re analyzing a problem, you need to be very clear about what’s actually happening. Your conclusions are directly dependent on the data points and the inferences you draw. And considering the fact that regulators and policymakers are actively shaping the rules of the game, looking at the right numbers is important.
The part-time messiahs would do well to check the numbers before mounting their pulpits.
”Comparing the number of contracts is like comparing the absolute number of farts. It is not the absolute number of farts that matters, but their pungency, or the strength of the smell, that ultimately matters. The same logic applies to F&O contracts.”
Great one 😂👍 and very well written article.
Deeply insightful, well researched and superbly written article. By raising the transaction costs to an inordinately high level,the regulators and policy makers have ensured that the percentage of loss making traders goes up even higher, defeating
the very purpose of their ridiculous policies.They have virtually killed the futures market for retail people, which is, ironically,less risky than options trading. I think the attractiveness and vibrancy of the Indian stock market has got eroded considerably and could get worse.
This is a lose- lose proposition for everyone concerned.
Brilliant! One of the best posts I have read recently. Regulators and policymakers often frame policies based on data that may not be fully relevant, yet they leave no stone unturned when taking strict actions based on such information.
Brilliant post, very well researched. My worry is our government and regulators keep increasing STT. Futures trading has become completely out of reach for retail with the excess margins and fees. I was just doing a simple brokerage calculation on Zerodha for Index Futures. It was shocking what I found, 14pts is what is needed to be breakeven on a NIFTY Index Futures trade post 2026 budget STT increase. This is shocking and Futures trading is now completely out of reach for retail.
I am sure there are people who would argue that retail should not be trading Futures, and the purpose of this product etc. But that said if you look at ES i.e S&P 500 Futures or Spread Betting on UK’s FTSE or German DAX they have much lower breakeven. But yes one thing they have is they have some form of User Suitability maybe that’s something worth giving a serious thought in India instead of just bring draconic laws and increasing taxes which we as a nation are sadly really good at!
Spot on Vikas, even to trade in Banknifty options only due to STT alone the cost of business has increased exponentially making it very difficult, the liquidity had dropped, the bid ask spread has increased in BNF futures drastically, lot of slippages. STT itself is illegal to be levied , but the draconian government keep on increasing every year instead of abolishing it.
Hello Bhuvan,
Not really related to the topic, but I was curious which library you use for plotting.
The plots look clean and beautiful.
Matplot lib and a whole lotnof claude instructions 🙂
Out of 18 lack active fno traders how many are profitable in FY26.?
Brilliant and insightful.
Perhaps you and Nithin should make this into a presentation and give it to SEBI and the Finance ministry so that they stop taking stupid decisions.
Can you help us with one more stat? 90% of retail traders lose money in India. What is the equivalent number for US and other developing economies? I would be very surprised if 90% of retail traders make money in other markets.
It’s the nature of trading that the uninformed, unequipped (retail) lose to the Institutions. SEBI and the government should be focused on reducing the mismatch in the playing field rather than eliminating retail traders from the market.
The Mahabharata hinges on a dice match where a man loses his kingdom, his wealth, and his brothers. This instinct to put something at risk on an uncertain outcome is not a product of the smartphone or the zero-brokerage app. It is as old as humanity.
I stood up and gave this a standing ovation 🫡