Quant – Market Trends
Traders,
If you are looking at Quant for the first time, I’d suggest you to start with our introduction on Quant – Time Based Analytics and Equity Curve.
There are traders who perform better in bullish markets compared to bearish, and vice-versa. Do you know which category you fall in?
The new Quant – Market Trends will help you figure this out based on your trading history. It will not only tell you the number of times you have been profitable in bullish/bearish markets, but also the quantum of profits/losses made. This should give you that edge as a trader to know what conditions to avoid and when to be aggressive.
Determining Bullishness/Bearishness
Bullishness/bearishness is a relative term, and hence we have given each one of you an option to tailor the conditions to your definition. Since this analytic is based on the market trend, we will be using Nifty Index to help determine if a day is bullish or bearish.
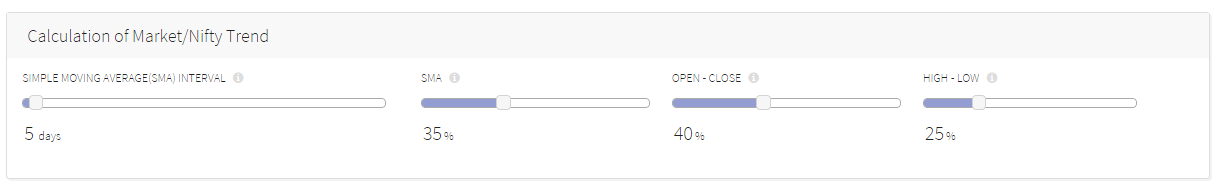
Determine Bullish/Bearish Day
- SMA: Choose a time period for simple moving average (SMA) of the Nifty. Higher the trading day’s Nifty closing price above this SMA higher the bullishness and vice versa. By default you will see a 35% weightage for this SMA metric to calculate if a day is bullish/bearish. If you want to give more importance to this, you can increase the %.
- Open-Close: Day is Bullish if Closing price > Open price and Bearish if Close < Open of Nifty. Higher the range ( Open – Close) , more the bullishness/bearishness. By default this factor contributes 40%.
- High-Low: Bullish if High of Nifty is near the closing price of Nifty for the day, and Bearish if Low of Nifty is near the closing price of Nifty for the day. Closer the High/Low to the closing price of Nifty, higher the bullishness/bearishness respectively. This by default contributes 25%.
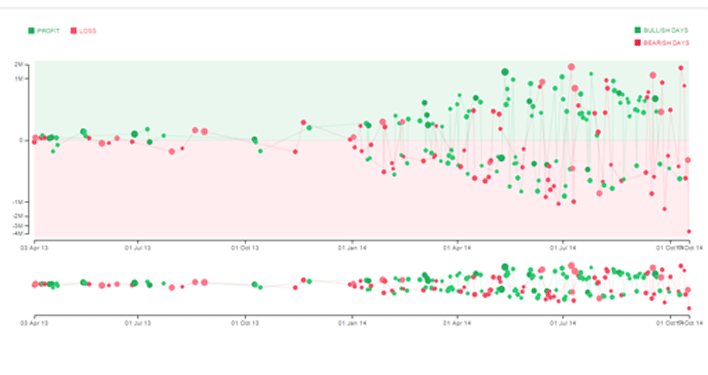
Based on the SMA period and the weightage for each of the three options that you choose, we will determine if a day is bullish or bearish. You can see in the picture of the scatter plot below that the size of each point on the plot will depend on how bullish/bearish that day was for the market (Nifty). Big green dots represent very bullish days, and big red dots represent very bearish days.
Your Historical Trading Performance
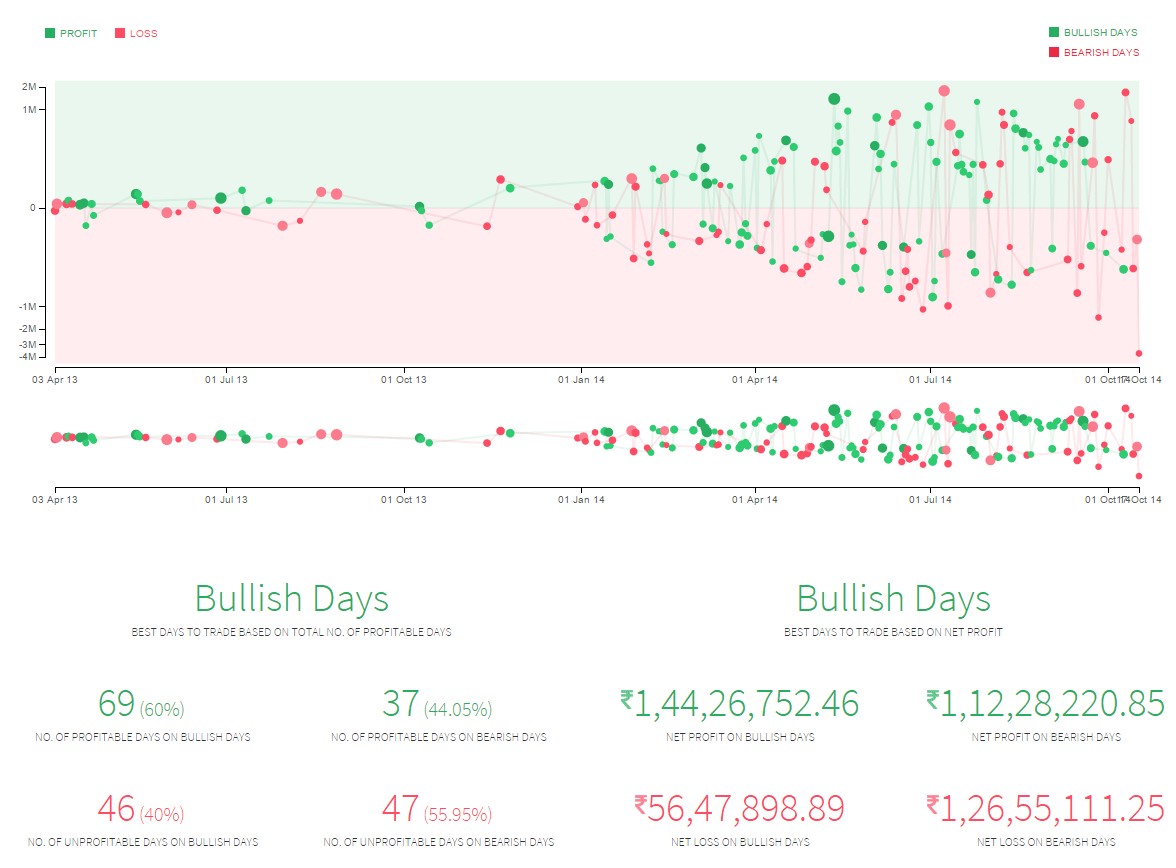
Once we have determined bullishness/bearishness, your trading performance on each of these days are plotted against them. All points above the 0 (x-axis) coloured in green are the days you were profitable and the ones below the x-axis in red are loss making days.
Quant – Market Trends
The following inferences can be made looking at the above plot and data shared:
- The client is profitable on 60% of the days when market is bullish, compared to only 44% when market is bearish.
- In terms of Rs profits made, 30% more profitable trading bullish days as compared to bearish days.
- In terms of Rs losses made, a 200% increase in loss trading bearish days as compared to trading bullish days.
- Clearly, the odds of this client winning are much more trading when market is bullish compared to when markets are bearish. So, it might be a good idea to reduce trading size when market is bearish and increase when markets are bullish.
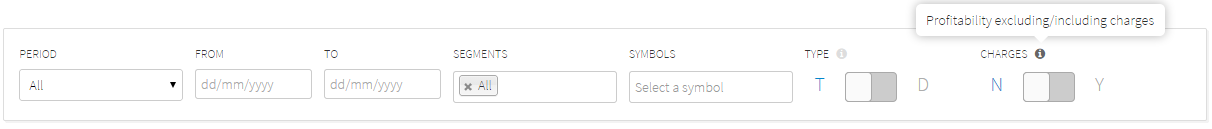
Note: Check this post to know the difference between Type – T and D, while generating Quant. All these reports are on a gross basis only (excluding brokerage, taxes, and all other charges). Use higher Simple moving average day interval, and give a higher % weightage for SMA to determine your profitability during longer bullish/bearish market trends.
***Update – 3rd Nov 2014. By popular demand, we have decided to include approximate trading costs before displaying the quant. Computing exact costs is not available right now, but is planned for the future. Also, since all quants are meant to show you relative performance, we believe that it is reasonable enough to help you make decisions based on approximate trading costs. If you want to see your normal P&L statements with exact costs, it is available in the report section under Q.
Approximate Trading Costs
Hopefully these insights will help improve your trading performance. We will have many more of such interesting analytics released in the next few months on Quant to help you learn & improve as you trade, do let us know if there is anything in particular you would like to see.
Happy Trading,
Dear Sir, Please try to introduce VTC(Valid Till Cancellation)/GTC(Good Till Cancellation) order system like ICICIDirect. So that we do not have to place same order every day.
I lost about more than 8000 Rs due to your network failure. approx 5000 during next day of gov bank recapitalization on 25 Oct 2017 and 3000 on 29 Jan 2018. this is unacceptable in live market you should know that and this is not going to help you either you in long term or me in short term. check your system daily before market opening so that never happen it again since your sorry messages are not going to compensate for my loss, so think it seriously.
I had purchased ten stocks of Rain industries on 09-11-2017 and 15 stocks on 13-11-2017. The average price has been adjusted accordingly but am able to see the qty as only 15 under T1. The 10 stocks bought earlier aren’t reflecting under Qty
Dear Sir,
I have opened an account with Zerodha today. I am totally new to this Share Market and trading business. What is your advice / suggestion to be a successful in this Field.
Hmm.. learn as much as you can. http://zerodha.com/varsity/ is a great starting point.
Sir How Can I update my annual FATCA detail online.
Plz tell me before 30 april
Go here: https://q.zerodha.com/user/financial_proofs/ and click save.
Data not getting synced from last 1 year…
Where to report the issue..??
Please get this updated…ID : RD1186
Can you send an email to [email protected]
Dear Zerodha Team,
My Client ID ZZ9365, I am not able to Sync the latest data (i.e from Jan) in my Quant. Kindly look into this.
Thanks in advance.
Can you email this to [email protected]
Hi Nitin,
Hope you are fit & fine.
I’m a new client for ZERODHA & hope I will continue this relation for a long time. I am yet to explore all facilities & features of ZERODHA. Today, I just stumbled on this discussion & like it. Though this may not be the right platform, still I like to tell you that I am in service and face difficulty in monitoring market on day to day basis. Mostly I act as an positional trader. Do you have any plan to incorporate GTC order facility soon? It will be immensely helpful for traders like us.
Thanks
Arup
Yes Arup, GTC for equity trades is something that we are hoping to have it up soon.
Thanks Nithin..for your positive response. Already you are doing a great job. Adding this feature will really be a value added service to a huge section of traders who are as such keenly interested in equity trading but unable to spend time & focus on market movement on day to day basis. I will be eagerly waiting for GTC order facility. Thanks once again.
nitin ji OCO order also required. (one cancell other)
These are considered algo in nature and hence aren’t made available to retail traders yet.
recently i opened the account with zerodha. it is really interesting. i still lose money on futures and options. ithough attended several classes, still i need further training. When there is a training on Technical analysis please inform
Have you gone through our very popular education initiative http://zerodha.com/varsity/
sir!
I can programme of shares for sale frommy DP before market open in your website or PI ? please explain how?
I didn’t get your question.
sir!
if I will sale shares in T1 & T2 period, DP charges are applicable or not? and DP charges depend on per stock or per quantity? please explain.
If you’re already holding such shares in your demat account, then we’ll debit your demat to avoid possible auction risk. In such cases DP charges will be applied.
sir!
if I will sale shares in T1 & T2 period, DP charges are applicable or not? and DP charges depend on per stock or per quantity? please explain.
sir! can I sale shares T1 & T2 period ?
Yes.
Hello Nithin,
We keep reading news articles like “market crashed due to profit taking”, “market raised due to short covering”, “market did abc due to xyz”.
I was just wondering are these articles written with correct background or knowledge about what caused the movement or just written for the sake of writing?
What’s you opinion on market related news in general?
Thanks
Sukesh
Stopped reading news a long time ago. Except for a few journo’s, most of what comes in news.. hmm.. is not worth the time.
why not stoploss buy and sell facility not getting while in BRACKET ORDER.
Entry using SL order on brackets is still not approved by the exchange.
i want a demo on how to trade . i am a new customer of yours.
Hii nitin sir,
Currently I am working in an MNC along with this I am a part time trader and does trading in derivatives options as I like this trading alot. Is it better option to become a full time trader as doing trading along with job is something hard to focus on one thing. And if it is possible then does zerodha provide training to its customers ?
Akshat, being a full time trader is something you should do only if you are being able to stay consistently profitable trading part time. Also, if you are trading full time, make sure to have a deep stack (sizable trading account size), and always have a plan B. We are running our education initiative online, have you checked this: http://zerodha.com/varsity/
Really you are making remarkable efforts in giving me the data based statistics of my trading.Now I am able to go in right path to get maximum benefits.I once again appreciate your entire team.I am expecting many more new ideas from you.
Hi Nithin,
How are you ?
I have changed my trading product and pattern for the last 60 days with fair degree of success. I have also managed to avoid wrong trades.
Could you please spend time on my trades and advise me.
regards
A.S.JOSHI
Hi Mr Joshi, All good and hope everything is good with you. Very happy to know that you have been able to avoid wrong trades. Will take a look and get back to you.
Hi,
Trying this for last few days. Still it is showing the same error that is reported by Vikas.
Thanks for your efforts to bring up such reports and new insights on our trading.
Regards
Vijay
Same error as in? , can you send an email to [email protected] and also keep [email protected] in cc with the error you are seeing.
Can you arrange for a demo session for your clients HOW to use Quant and PI Charts for a better understanding of technical and system operations. Thanks CHANLEO
Sure, makes sense, we will have a webinar 1st week of July. We have the latest release of Pi scheduled on 2nd July, so we could do this on 3rd july. Will keep you posted.
Hi Nithin,
Along with discount brokerage and this feature i am now your new client.
I have started trading on zerodha just few days back – made around 10 trades till date.
When i go to Quant it says – we are preparing your report and will email once ready.
and within Analytic Type menu all 3 option are there but none of them is working for me.
Any particular reason?
and one more thing in todays Gujarati Economic times edition got a news that IIFL is coming with Discount brokerage concept of 9.99 per executed order – same like Zerodha is providing.
your comment on it Nithin.
Vikas, we had a lot of people trying out Quant at one time which slowed it down. Give it time till evening, will be fixed. About IIFL, it will be interesting to see how it goes. 🙂 Competition is always good.
Nithin ji , bit out of the track for this discussion room may be, but I need to discuss so writhing here only. After quite a long observation of technical and fundamental of the market I started trading on paper and real time also and standing on the result like “gained less and lose more” kind of situation and definitely I admitted already to myself that whatever I lost due to my fault only. I am still whole heartedly with the market. Now my question is not that, I guess I am now shifted in the category like having more fear than the greed, I reduced my profit taking target drastically becoz of fear even my analysis getting right now a days to a good percentages. I want to share with you , I have come across with some set of Indicators which is giving good percentage of results what I am observing now , but I m afraid to take position most of the time , If I m taking position and exiting well before target. Basically I m fully Intraday trader. Please suggest some solution if any with you, or even some book on it that i can make up my mind to have a make over to my trading style. Thank you for your platform , I m a ZERODHA trader forever.
Never thought on these lines. I just realized that I have lost on 70% of the days when markets have been bullish. Guess, could have saved a lot of money, if I had this earlier.