The 20 Market Depth (level 3 data) Window
I’ve driven a car for many years and I’ve even changed my car a few times now. Each time I changed my car, the engine remained more or less the same, but the features within the vehicle and its aesthetics continuously changed. Air conditioner, power steering, and power windows were all luxury features in the car at one point, but today, I guess no one buys a car without these essential features. The game-changer for me though was parking assist. The little camera at the back of the car gave me complete visibility of the parking space available. I was no longer required to pop and twist my head out and struggle to park the car, nor did I have to bug my co-passenger to get down and help me navigate my way into a parking spot. The parking assist feature did everything and helped me execute a perfect parallel park. The parking assist feature was my edge for hassle-free car parking.
I feel the same edge while trading the markets with the level 3 data 🙂

Level 3 or the 20 market depth feature is unique and has multiple uses. You’ll probably appreciate the level 3 market window if you have traded at an institutional desk. A regular retail trader would not understand this feature anytime soon, simply because this feature was unavailable all these years until we introduced it for the very first time to the Indian retail traders.
The purpose of this chapter is to help you understand how useful this feature is and get you started on building trading strategies around this feature.
If you are entirely new to this, I’d suggest you read this blog to understand what the level 3 data is all about.
Assuming you know what it is, this chapter will help you understand the multiple uses of this feature.
Contract availability
For the option traders, the 20-depth order book gives great visibility into the availability of contracts to trade and help identify better price points to execute these trade. Without this visibility, it becomes really hard to trade illiquid contracts. While I’m specifically talking about options here, you can extend this to Futures contracts as well, especially the illiquid ones.
Let us put this in context, have a look at the regular market depth (i.e. the top 5 bid-ask) of the 13000 CE expiring in Jan 2020.

We can see narrow bids on the left and a notch better offer on the right. You’d probably hesitate to trade this contract if you are someone looking at trading a few lots of Nifty.
But check what’s hiding under the hood here by opening the level 3 data –
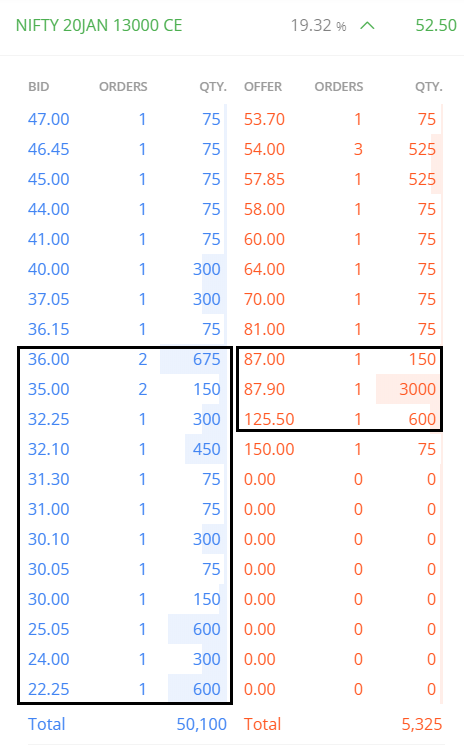
As you can see, there are many contracts available, but they are not visible in the regular market depth. In fact, the bid and offer quantities are heavily concentrated below the 8th row respectively.
Given the availability of the contracts in this strike, the perspective to trade or not completely changes and will now depend upon your trading strategy.
Execution control
Level 3 data gives you full visibility of the approximate execution price for your trade. This is particularly useful when you decide to scalp the market. When you scalp the market —
- You trade large quantities, i.e. buy and sell large amounts in quick succession to profit from small tick moves in the stock
- Since these are quick trades, you place market orders only
Let us say you want to buy and sell 5000 shares of Hindustan Zinc; the regular market depth window gives you the following information —
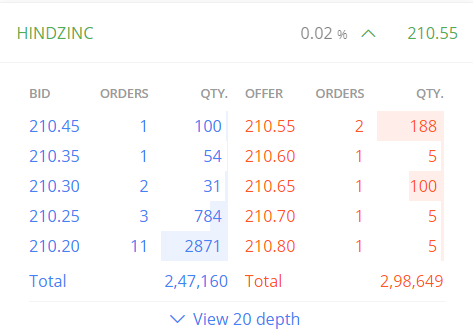
As you can see, there is no visibility on how these 5000 shares will get filled. Now, take a look at the 20 depth window —
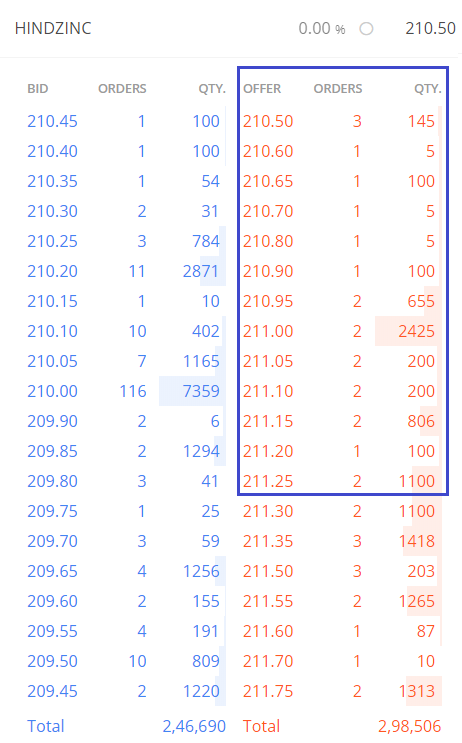
The 20 depth window paints an entirely different picture. It not only tells me that I’ll get the 5000 shares, but it also gives me information about the approximate buy price. If I were to place a market order for 5000 shares, I’d be buying this order book from 210.5 to 211.25. I also see at 211; there are 2425 shares available, so I can expect the average price is at or around 211.
Now, my decision to scalp the stock should depend on the pop I’d expect over and above 211. Maybe 211.5 or so. Of course, you’ll get the exact breakeven (post charges) if you were to use a brokerage calculator.
Position sizing
Level 3 market window plays a critical role in ‘guesstimating’ the number of shares to trade, given the liquidity of the stock. For the sake of this discussion, we will assume that the availability of capital is not an issue.
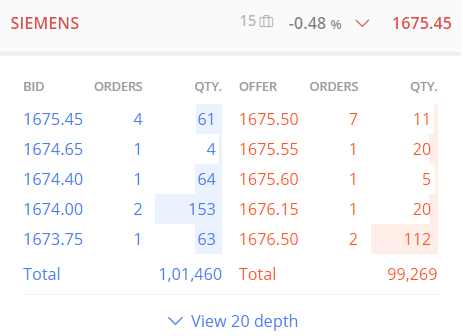
Now, have a look at the regular market depth —
You expect Siemens to move from 1675 to about 1690 over the next hour. So, given the fact that you are not constrained by capital, how many shares will you buy for this intraday trade?
The regular market depth window suggests that you can buy close to 175 shares. However, the 20 depth opens up a different perspective altogether —
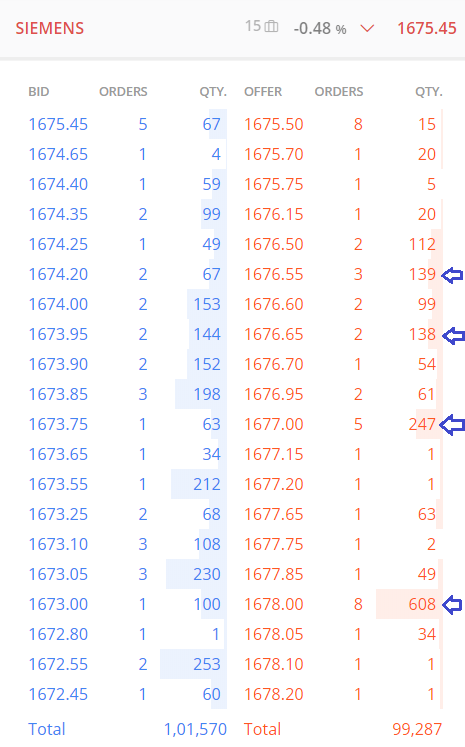
In fact, the liquidity in this stock lies below the best five bid and ask, and the impact cost is reasonable. The regular market depth window fails to capture this information. Assuming you intend to buy about 1500 shares, the buy price will lie somewhere within 1675.5 to 1678, which is spread of 0.149%.
In this case, assuming you are sure about the target price (1690), you can go all in and buy through whatever is available at that moment.
Order placement
You can extend the position sizing concept and use the 20 depth market watch to place a stop loss or a limit order. Assume you have an intraday buy position in VST Tillers at 1313.8.
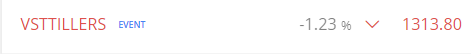
The question is, where you would place the stop loss for this trade? Can the 20 market depth help us with this?
Of course. Have a look at the 20 depth window for VST Tillers. As you can see, there is a concentration of bids in 1290. The good part is that the number of order count is also the highest (35) in 1290.
This implies that several traders have placed an order at 1290, indicating some sort of price action at that level. This perhaps builds a case for placing the stop-loss.
A prudent trader would probably place a stoploss not at 1290, but maybe at a price just below it.
So I was a buyer in this stock, then purely based on 20 depth I’d probably place my SL at 1290 or below, maybe at 1287 and by the same logic, set my target at 1340 or at 1338.8.
Validate the support and resistance level
I find this extremely interesting. In the example above, we identified 1290 as the stoploss price, simply because there was a concentration of bids. In other words, we expect 1290 as a support price.
If this is indeed true, then it should show up on the charts as well, right? Have a look at the chart below –
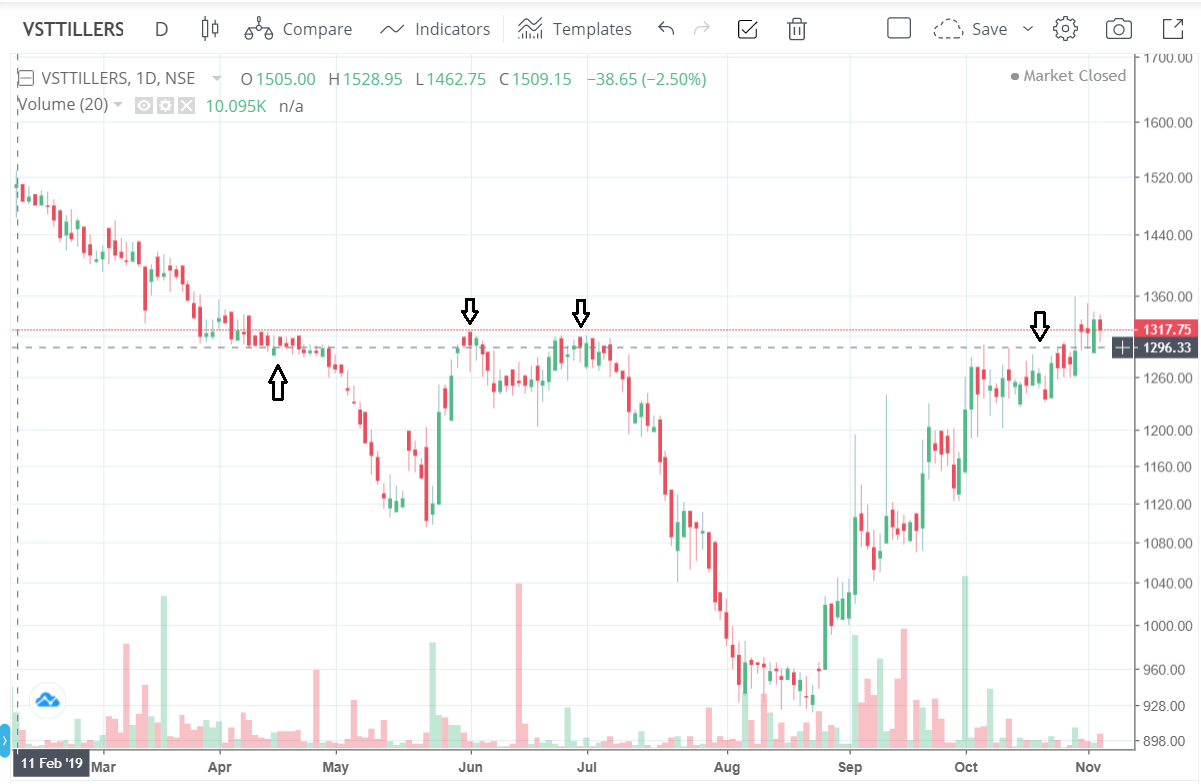
Clearly, there is some price action around 1296. Remember, support and resistance is not one price point, but rather a range. Therefore 1290 – 1300 marks as an intraday support for this stock.
This is a perfect example of seeing the price action concept play out in the market.
Another way to look at this is first to identify the S&R level and then check the 20 depth to figure if there is a concentration of bids/offers in that zone.
Hopefully, by now you’ve started to appreciate the immeasurable value 20 depth order book brings to you while trading.
Remember, irrespective of which technique you use to develop a point of view (technical or quantitative analysis), things boil down to price, and the action trades take at that price.
The 20 depth market window is essentially your ticket to validate the truth of this price action. Make sure you use your card wisely!
Do post your comments and tell us how differently you will use the 20 depth window for identifying trading opportunities.
Good luck!
cannot see market depth
You need to have generated at least 100 Rupees in brokerage to see the 20 depth. Please check this – https://zerodha.com/z-connect/featured/introducing-20-depth-or-level-3-data-beta-on-kite
Very nicely written, thank you for your incredible insight.
Salman, thank you 🙂
Sir, how will the market depth data be relied upon? When clients or trading systems use the disclosed quantity feature, not the entire quantity is shown. In such a case, isn’t there a chance that the wrong assumptions are made looking at just the market depth?
Valid point, but there is no way one can identify disclosed quantity. By the way, level 3 helps you identify contract availability. Given this, the disclosed quantity, if any, will only make the liquidity situation better.
Hi Karthik! Newbie here, under the ‘The 20 Market Depth (level 3 data) Window’ section, you’ve said – If you are entirely new to this, I’d suggest you read this blog to understand what the level 3 data is all about.
Are you referring to this chapter as the blog or have a separate blog elsewhere, in which case I do not see a link to it. Can you help?
‘Read this blog’ is hyperlinked 🙂
Amazing featute for the reatil traders. Way to go team for bringing such innovative and pro Tools to the world at such decent costs.
Happy learning and trading 🙂