4.1 – Background
The Call Ratio Back Spread is an interesting options strategy. I call this interesting keeping in mind the simplicity of implementation and the kind of pay off it offers the trader. This should certainly have a spot in your strategy arsenal. The strategy is deployed when one is out rightly bullish on a stock (or index), unlike the bull call spread or bull put spread where one is moderately bullish.
At a broad level this is what you will experience when you implement the Call Ratio Back Spread-
- Unlimited profit if the market goes up
- Limited profit if market goes down
- A predefined loss if the market stay within a range
In simpler words you can get to make money as long as the market moves in either direction.

Usually, the Call Ratio Back Spread is deployed for a ‘net credit’, meaning money flows into your account as soon as you execute Call Ratio Back Spread. The ‘net credit’ is what you make if the market goes down, as opposed to your expectation (i.e market going up). On the other hand, if the market indeed goes up, then you stand to make an unlimited profit. I suppose this should also explain why the call ratio spread is better than buying a plain vanilla call option.
So let’s go ahead and figure out how this works.
4.2 – Strategy Notes
The Call Ratio Back Spread is a 3 leg option strategy as it involves buying two OTM call option and selling one ITM Call option. This is the classic 2:1 combo. In fact the call ratio back spread has to be executed in the 2:1 ratio meaning 2 options bought for every one option sold, or 4 options bought for every 2 option sold, so on and so forth.
Let take an example – assume Nifty Spot is at 7743 and you expect Nifty to hit 8100 by the end of expiry. This is clearly a bullish outlook on the market. To implement the Call Ratio Back Spread –
- Sell one lot of 7600 CE (ITM)
- Buy two lots of 7800 CE (OTM)
Make sure –
- The Call options belong to the same expiry
- Belongs to the same underlying
- The ratio is maintained
The trade set up looks like this –
- 7600 CE, one lot short, the premium received for this is Rs.201/-
- 7800 CE, two lots long, the premium paid is Rs.78/- per lot, so Rs.156/- for 2 lots
- Net Cash flow is = Premium Received – Premium Paid i.e 201 – 156 = 45 (Net Credit)
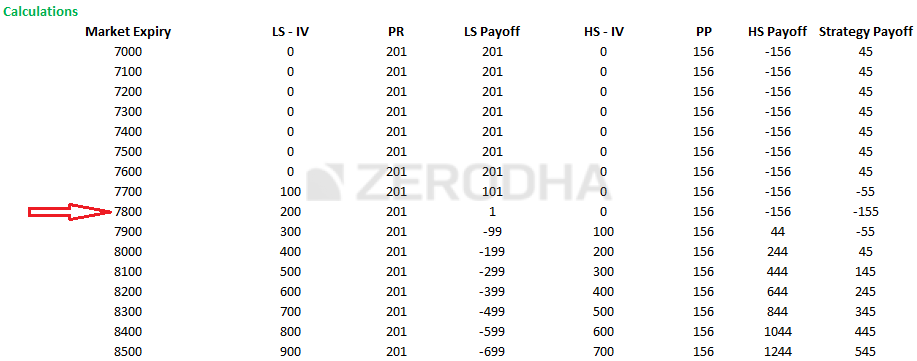
With these trades, the call ratio back spread is executed. Let us check what would happen to the overall cash flow of the strategies at different levels of expiry.
Do note we need to evaluate the strategy payoff at various levels of expiry as the strategy payoff is quite versatile.
Scenario 1 – Market expires at 7400 (below the lower strike price)
We know the intrinsic value of a call option (upon expiry) is –
Max [Spot – Strike, 0]
The 7600 would have an intrinsic value of
Max [7400 – 7600, 0]
= 0
Since we have sold this option, we get to retain the premium received i.e Rs.201
The intrinsic value of 7800 call option would also be zero; hence we lose the total premium paid i.e Rs.78 per lot or Rs.156 for two lots.
Net cash flow would Premium Received – Premium paid
= 201 – 156
= 45
Scenario 2 – Market expires at 7600 (at the lower strike price)
The intrinsic value of both the call options i.e 7600 and 7800 would be zero, hence both of them expire worthless.
We get to retain the premium received i.e Rs.201 towards the 7600 CE however we lose Rs.156 on the 7800 CE resulting in a net payoff of Rs.45.
Scenario 3 – Market expires at 7645 (at the lower strike price plus net credit)
You must be wondering why I picked the 7645 level, well this is to showcase the fact that the strategy break even is at this level.
The intrinsic value of 7600 CE would be –
Max [Spot – Strike, 0]
= [7645 – 7600, 0]
= 45
Since, we have sold this option for 201 the net pay off from the option would be
201 – 45
= 156
On the other hand we have bought two 7800 CE by paying a premium of 156. Clearly the 7800 CE would expire worthless hence, we lose the entire premium.
Net payoff would be –
156 – 156
= 0
So at 7645 the strategy neither makes money or loses any money for the trader, hence 7645 is treated as a breakeven point for this trade.
Scenario 4 – Market expires at 7700 (half way between the lower and higher strike price)
The 7600 CE would have an intrinsic value of 100, and the 7800 would have no intrinsic value.
On the 7600 CE we get to retain 101, as we would lose 100 from the premium received of 201 i.e 201 – 100 = 101.
We lose the entire premium of Rs.156 on the 7800 CE, hence the total payoff from the strategy would be
= 101 – 156
= – 55
Scenario 5 – Market expires at 7800 (at the higher strike price)
This is an interesting market expiry level, think about it –
- At 7800 the 7600 CE would have an intrinsic value of 200, and hence we have to let go of the entire premium received i.e 201
- At 7800, the 7800 CE would expire worthless hence we lose the entire premium paid for the 7800 CE i.e Rs.78 per lot, since we have 2 of these we lose Rs.156
So this is like a ‘double whammy’ point for the strategy!
The net pay off for the strategy is –
Premium Received for 7600 CE – Intrinsic value of 7600 CE – Premium Paid for 7800 CE
= 201 – 200 – 156
= -155
This also happens to be the maximum loss of this strategy.
Scenario 6 – Market expires at 7955 (higher strike i.e 7800 + Max loss)
I’ve deliberately selected this strike to showcase the fact that at 7955 the strategy breakeven!
But we dealt with a breakeven earlier, you may ask?
Well, this strategy has two breakeven points – one on the lower side (7645) and another one on the upper side i.e 7955.
At 7955 the net payoff from the strategy is –
Premium Received for 7600 CE – Intrinsic value of 7600 CE + (2* Intrinsic value of 7800 CE) – Premium Paid for 7800 CE
= 201 – 355 + (2*155) – 156
= 201 – 355 + 310 – 156
= 0
Scenario 7 – Market expires at 8100 (higher than the higher strike price, your expected target)
The 7600 CE will have an intrinsic value of 500, and the 7800 CE will have an intrinsic value of 300.
The net payoff would be –
Premium Received for 7600 CE – Intrinsic value of 7600 CE + (2* Intrinsic value of 7800 CE) – Premium Paid for 7800 CE
= 201 – 500 + (2*300) – 156
= 201 – 500 + 600 -156
= 145
Here are various other levels of expiry, and the eventual payoff from the strategy. Do note, as the market goes up, so does the profits, but when the market goes down, you still make some money, although limited.
4.3 – Strategy Generalization
Going by the above discussed scenarios we can make few generalizations –
- Spread = Higher Strike – Lower Strike
- Net Credit = Premium Received for lower strike – 2*Premium of higher strike
- Max Loss = Spread – Net Credit
- Max Loss occurs at = Higher Strike
- The payoff when market goes down = Net Credit
- Lower Breakeven = Lower Strike + Net Credit
- Upper Breakeven = Higher Strike + Max Loss
Here is a graph that highlights all these important points –
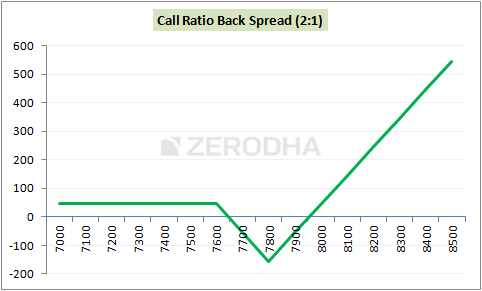
Notice how the payoff remains flat even when the market goes down, the maximum loss at 7800, and the way the payoff takes off beyond 7955.
4.4 – Welcome back the Greeks
I suppose you are familiar with these graphs by now. The following graphs show the profitability of the strategy considering the time to expiry and therefore these graphs help the trader select the right strikes.
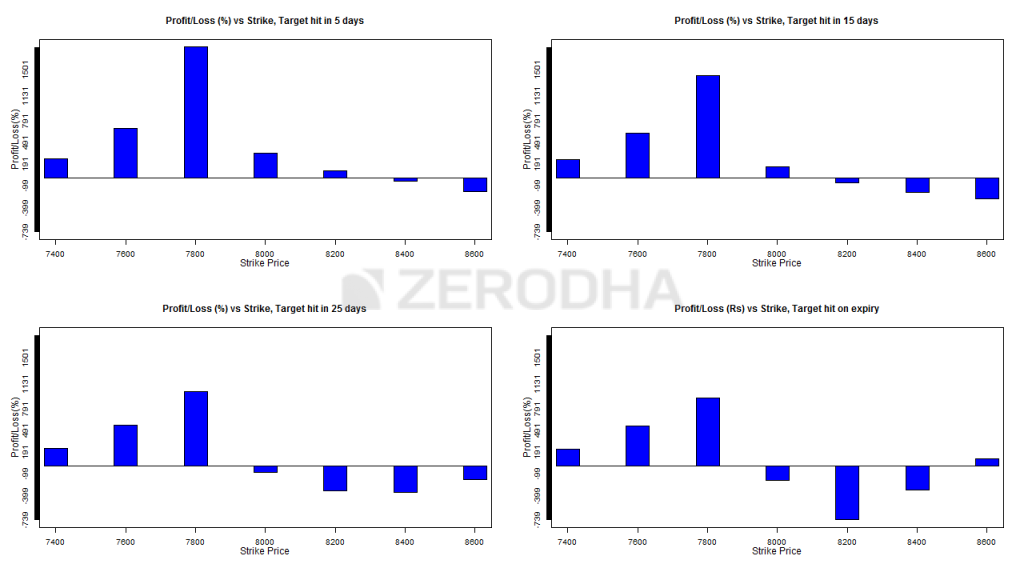
Before understanding the graphs above, note the following –
- Nifty spot is assumed to be at 8000
- Start of the series is defined as anytime during the first 15 days of the series
- End of the series is defined as anytime during the last 15 days of the series
- The Call Ratio Back Spread is optimized and the spread is created with 300 points difference
The thought here is that the market will move up by about 6.25% i.e from 8000 to 8500. So considering the move and the time to expiry, the graphs above suggest –
- Graph 1 (top left) and Graph 2 (top right) – You are at the start of the expiry series and you expect the move over the next 5 days (and 15 days in case of Graph 2), then a Call Ratio Spread with 7800 CE (ITM) and 8100 CE (OTM) is the most profitable wherein you would sell 7800 CE and buy 2 8100 CE. Do note – even though you would be right on the direction of movement, selecting other far OTM strikes call options tend to lose money
- Graph 3 (bottom left) and Graph 4 (bottom right) – You are at the start of the expiry series and you expect the move in 25 days (and expiry day in case of Graph 3), then a Call Ratio Spread with 7800 CE (ITM) and 8100 CE (OTM) is the most profitable wherein you would sell 7800 CE and buy 2 8100 CE.
You must be wondering that the selection of strikes is same irrespective of time to expiry. Well yes, in fact this is the point – Call ratio back spread works best when you sell slightly ITM option and buy slightly OTM option when there is ample time to expiry. In fact all other combinations lose money, especially the ones with far OTM options and especially when you expect the target to be achieved closer to the expiry.
Here are another bunch of charts; the only difference is that the move (i.e 6.25%) occurs during the 2nd half of the series –
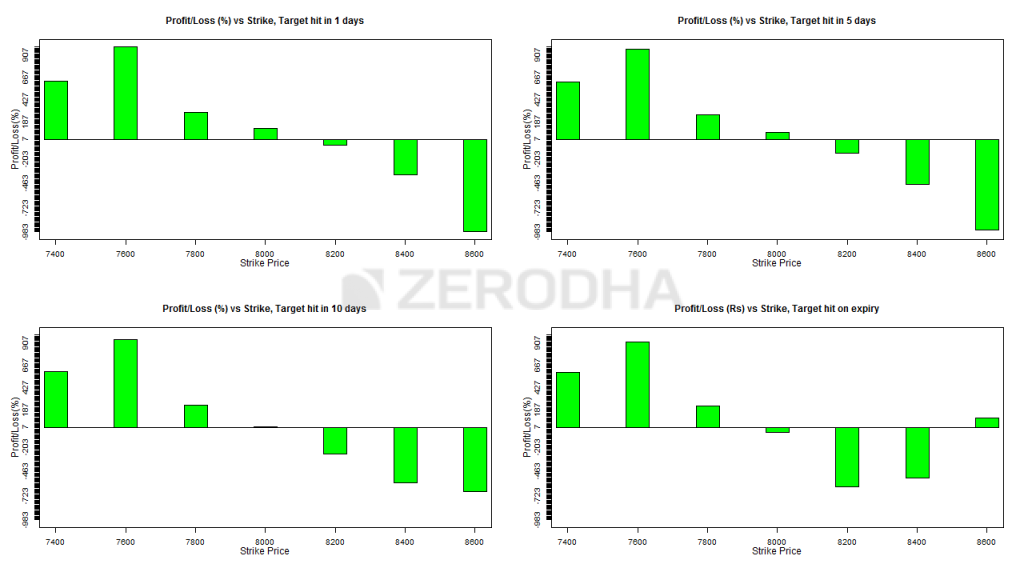
- Graph 1 (top left) & Graph 2 (top right) – If you expect the move during the 2nd half of the series, and you expect the move to happen within a day (or within 5 days, graph 2) then the best strikes to opt are deep ITM and slightly ITM i.e 7600 (lower strike short) and 7900 (higher strike long). Do note, this is not the classic combo of an ITM + OTM spread, instead this is an ITM and ITM spread! In fact all other combinations don’t work.
- Graph 3 (bottom right) & Graph 4 (bottom left) – If you expect the move during the 2nd half of the series, and you expect the move to happen within 10 days (or on expiry day, graph 4) then the best strikes to opt are deep ITM and slightly ITM i.e 7600 (lower strike short) and 7900 (higher strike long). This is similar to what graph 1 and graph 2 suggest.
Again, the point to note here is besides getting the direction right, the strike selection is the key to the profitability of this strategy. One needs to be diligent enough to map the time to expiry to the right strike to make sure that the strategy works in your favor.
What about the effect of volatility on this strategy? Well, volatility plays a key role here, have a look at the image below –
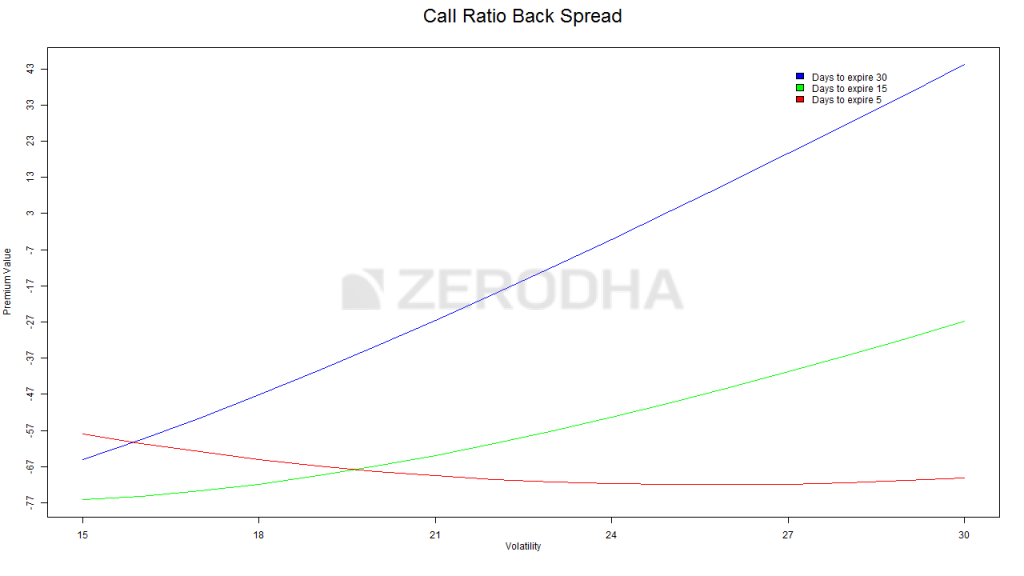
There are three colored lines depicting the change of “net premium” aka the strategy payoff versus change in volatility. These lines help us understand the effect of increase in volatility on the strategy keeping time to expiry in perspective.
- Blue Line – This line suggests that an increase in volatility when there is ample time to expiry (30 days) is beneficial for the Call ratio back spread. As we can see the strategy payoff increases from -67 to +43 when the volatility increase from 15% to 30%. Clearly this means that when there is ample time to expiry, besides being right on the direction of stock/index you also need to have a view on volatility. For this reason, even though I’m bullish on the stock, I would be a bit hesitant to deploy this strategy at the start of the series if the volatility is on the higher side (say more than double of the usual volatility reading)
- Green line – This line suggests that an increase in volatility when there are about 15 days time to expiry is beneficial, although not as much as in the previous case. As we can see the strategy payoff increases from -77 to -47 when the volatility increase from 15% to 30%.
- Red line – This is an interesting, counter intuitive outcome. When there are very few days to expiry, increase in volatility has a negative impact on the strategy! Think about it, increase in volatility when there are few days to expiry enhances the possibility of the option to expiry OTM, hence the premium decreases. So, if you are bullish on a stock / index with few days to expiry, and you also expect the volatility to increase during this period then thread cautiously.
Key takeaways from this chapter
- The Call Ratio Backspread is best executed when your outlook on the stock/index is bullish
- The strategy requires you to sell 1 ITM CE and buy 2 OTM CE, and this is to be executed in the same ratio i.e for every 1 sold option, 2 options have to be purchased
- The strategy is usually executed for a ‘net Credit’
- The strategy makes limited money if the stock price goes down, and unlimited profit if the stock price goes up. The loss is pre defined
- There are two break even points – lower breakeven and upper breakeven points
- Spread = Higher Strike – Lower Strike
- Net Credit = Premium Received for lower strike – 2*Premium of higher strike
- Max Loss = Spread – Net Credit
- Max Loss occurs at = Higher Strike
- The payoff when market goes down = Net Credit
- Lower Breakeven = Lower Strike + Net Credit
- Upper Breakeven = Higher Strike + Max Loss
- Irrespective of the time to expiry opt for slightly ITM + Slightly OTM combination of strikes
- Increase in volatility is good for this strategy when there is more time to expiry, but when there is less time to expiry, increase in volatility is not really good for this strategy.
Download Call Ratio Back Spread Excel Sheet
Thanks sir for this wonderful strategy . I am having two points here to ask.
1) Can we select the strike prices such that the spread and net credit are more or less same. So that the max. loss will be minimum. (Spread-net credit)? Is it practically possible to select premiums like that?
2) the pay off you have mentioned is adjusted against the time decay. It is more of concern when time to expiry is more.
Once again the topic is covered in a very simple way and easy to understand and grasp. .
Spread and Credit cannot be same. Net Credit is always lesser than the spread.
Time decay is not a good thing for this strategy, the only way it would works is when markets go higher.
What shall be practical minimum value for Max loss (spread- credit) so that it becomes worth taking position?
This depends on your risk appetite 🙂
1. Sir can you send payoff excel so that pay off calculation will be easy. [email protected] is id.
2. Does it gives profit intraday if upper and lower strike is crossed in intraday or time value also matters?
Thanks
Pawan
The excel can be downloaded at the end of the chapter, the link is provided.
You may experience an profit intraday, although holding this to expiry makes more sense.
Can we buy put instead of selling call?? I personally modified this strategy this way at zerodha and it worked well for me in volatile market. The beauty and versatality of option strategy is that you can always improvise…dont we??
Of course you can always improvise. Options are like white canvas, your imagination is the only limiting factor for what you can create on it.
Hi sir can I use this strategy for election result which is on may23 .
If the situation demands, then maybe you should 🙂
OK, I was asking that the charts shown here and in P/L calculation for month end etc, whether time decay is considered or not? If not then our P/L will be different.
Oh ok…time decay is considered since the chart depicts the payoff at expiry.
Hey karthik!!
Thank you very much to you and zerodha for varsity content!! Best on internet I must say!!
I can’t understand what graphs are conveying? i.e., target hits in 5, 10, 15, 25 and last day of expiry. Ofcourse they are showing the profits percentage but why they are above and below the x-axis. I’m totally confused. Please let me out of this confusion.
Thanks, Harsh.
Target hits in 5, 10, 15, 25 —- > these are the number of days in which the profit is supposed to hit.
Sir, How much margin for selling an itm option overnight.. Also is it possible to do this intra day.. I mean every day in a month.. We don’t keep risk of overnight news shocks and also margin requirements? Please enlighten
The margins will be similar to futures margin. Check our margin calculator here – https://zerodha.com/margin-calculator/SPAN/
There is no directional risk here for this strategy as either ways you make some money…the problem will be if the stock stays where it is. Also, this strategy is not really suitable for intraday.
Hey Karthik,
i just had a small doubt regarding the profitability graphs. There is a line that says “The following graphs show the profitability of the strategy:. So the graph for 7800 strike means- a call ratio back spread with a short 7800 strike Call and 2 long 8100 Calls? Just a little confused here
Absolutely!
Hi kartik
As I learn in option theory chapter, that today is Dec, then Dec. Is current month, Jan. Is mid month and Feb. Is far month. But in nifty we see good volumes in March, April,… Contracts. Is it possible to buy March, April,… Contracts when current month is Dec. ????
Can you please post a screen shot?
Why nifty has trade in April contract
These are quarterly contracts, here is an extract from NSE –
The Exchange shall introduce long term option contracts on NIFTY. The options cycle shall be as under.
The 3 serial month contracts would continue to exist.
The following 3 quarterly months of the cycle March / June / September / December would be available.
After these, 5 following semi-annual months of the cycle June / December would be available, so that at any point in time there would be options contracts with atleast 3 year tenure available
Thanks
That means if I have 6 month view on nifty I can buy quarterly contact and for 3 months we follow as above
Yes.
Sir please check the pic attached and suggest whether we can invest in this case or not. As per my calculations it was showing always profit… Is it true??
There is no strategy that will always give you a profit 🙂
My guess is you have forgotten to multiply the 520 CE by 2…remember you have to buy 2 call option for every 1 sold option!
I have chosen 2 sell -3 buy strategy instead of 1 sell -2 call.
It should be in the same ratio – 2 sell 4 buy.
In this article itself it is mentioned as “4.2 – Strategy Notes
In fact the call ratio back spread has to be executed in the 2:1 ratio meaning 2 options bought for every one option sold, or 3 options bought for every 2 option sold, so on and so forth.” And if this is typo error, whats wrong if we have strategy in 3:2.
My bad, will make the necessary changes.
Karthik I think you forget to calculate IV for 2 call option in your excel sheet for G23 to G29 cell correct me if I am wrong!!!
Will check and get back soon!
Sir
What happens if i implement the strategy at the starting of month and square off say after 10days. Will my P&L will be same as per payoff graph?
The payoff is only upon expiry…if you happen to close the position earlier your P&L will be slightly different.
Hi kartik
Can you please tell me what will be the value of nifty upon expiary in January
I wish I knew this myself 🙂
What if option expires otm ,then sensex exercise charges will washout all gain.
There is nothing like exercise charges.
I think he was alluding to the high STT that is charged when long options get exercised. However, it’s only done for ITM long Options not OTM long Options…
You may want to check this – https://tradingqna.com/t/no-more-stt-trap-on-exercised-in-the-money-options/18977
sir,good,what if we close the sold option (bcoz of margin pressure)&leave long calls&try.enlighten
In that case the existing long position would be ‘naked’, which will come with its usual set of risk and reward characteristics.
i am saying if option expires as ITM,then sensex STT/tax service charges are too high which will wash out all gain.
Not really. It really depends on how much ITM it is. For example if you have 7500CE and market expires at 7510, then yes your profits get washed off with these charges…but if the market is at 7520 or 7525 then you still take home quite a bit.
could not get this.
7510, 7520 why should make such a difference. In both cases it is ITM ?
Assume you paid a premium of Rs.10 of 7500 CE. If the market exprires at 7510 then you will not make any money as the 10 points you make goes towards adjusting for STT and related charges. However if its 7520, then you have 10 points remaining after adjusting for transnational expenses.
Long Strangle is not better than this strategy coz it gives profit in both direction?
Long strangle also gives profit in both direction. It shall have very good movement in any direction then it is profitable.
Well, long strangle/straddle are both direction independent. Whereas this one is biased towards a bullish outcome.
sir,i think all these selling option stategies works well with stock option rather index clarify.whare can we look historical charts of nifty&commodities(10years)
My experience says it works well on both indices and stocks.
Hi ,
first of all thanks for this great article..Can you please send the excel of Put Ratio Back Spread please..Humble request.
Thankfully
Zerodha Client
Ankit, will include this when the chapter is ready.
Thanks in advance looking forward for the same eagerly..
Hopefully soon 🙂
sir.where can we look historical charts of commodities nifty etc of last 10 years
Kite & Pi.
Dear Karthik, Thanks a lot for the chapter humble request for you to please make an excel of put ratio back spread as soon as you can..Sorry for being pushy but really require it at this time of the session and the fall as the protection trade…Thanks a lot email is [email protected] ..God bless
Will try my best Ankit, but it looks little tight!
Hello Dear KARTHIK,YOU ARE DOING A GREAT JOB KEEP IT UP, YES PUT RATIO BACK WILL BE HELPFUL.
Very soon, please stay tuned 🙂
sir.
,thanks,smalldoubt,where can we look histirical price data in NSE SITE (option prices of last 1 month) sorry for silly question clarify
Check this Narsimha – http://www.nseindia.com/products/content/derivatives/equities/historical_fo.htm
sir,thanks.we are desperate to hear about BACK TESTING&EXPERT ADVISOR whan can we expect that module
Soon. Meanwhile please go through this – http://zerodha.com/z-connect/tradezerodha/pi-tradezerodha/eas-for-auto-buysell-signals-pi
kartik
cam we used put back spread and call back spread as combination
You can, but I’m not sure what kind of Payoff you are likely to get. Please plot it on excel as a combined payoff and check.
I have done already u can see in the image it pay on either side on expiry
Sorry, dint notice that. This looks good.
Combining Put and call back spread: will it not be equal to 1 long straddle and 2 long strangle?
Both are bi directional strategy.
Well, the best way to validate that is by actually tracking the payoff.
sorry, it will be equivalent to 1 short straddle and two long strangles.; Right?
Dear mayur,
Can you please mail the file at [email protected]. Thanks a lot brother,,,, I was having excel difficulty in plotting the same..
Boy, Dont fall for condors and or butterflies stratgies. Those are very complicated. Stick to basic strategies and only go for two leg strategies.
Sir how much money margin is requiersd i mean to say.. Only for 45 points credit is required or for entire all three options
In this example yes.
Here is the question , if i am out right bullish on index/stock and targets will be met with a day or 2, why call ratio back spread ? When option trader is implementing more than 2 legs option stratgey, its clear he is not fully sure of market movements.
There is nothing like ‘fully sure’ in the market, hence risk averse traders depend upon strategies such as this.
Sir my Question is How to calculate stock strike price . please give me the simple example
Why do you need to calculate strike price? NSE will do that for you based on their strike creation logic.
Hi Karthik, how do we calculate and plot profitability charts to deduce best strikes.
No need to plot, I’s suggest you identify the strikes keeping the Greeks in perspective.Check this chapter – http://zerodha.com/varsity/chapter/re-introducing-call-put-options/
Hi Karthik,
Graphs are not appearing. Its been replaced by a placeholder. Could you please take a look?
Thanks in advance,
~Abhijit
Seems to be working fine, can you please refresh the page and confirm? Thanks.
What would be the effect it we change ratio to 2:1 to Some other Ratio??
And Could basis of change ratio depend on??
Well you are change it to any number but have the maintain the 2:1 ratio. The higher the number of lots, the higher is the degree of gains/loss.
Hi Karthik,
For a interday trader, do you think its better to go with naked options or use any of the strategies from this module?
Thank You
Intraday I’d suggest naked options…unless its event driven.
Hi Karthik,
Can you please provide more information(or resources to study) on the effect of volatility and option greeks on the strategies discussed in this chapter. For example i didnt understand how you are able to generate the images shown in the section “4.4 – Welcome back the Greeks” of this chapter. So please tell me where can I find more info on these.
Thanks!!
All the graphs are generated based on B&S model. Once you build the model you can tweak a variables/against others to get any desired output/graphs.
I understand that B&S model will take some parameters as input and compute the option greeks values(Please correct me if i am wrong). But in section “4.4 – Welcome back the Greeks” of this chapter, you have shown a graph between strike vs profit Loss %. Please tell me how you were able to plot this graph.
Also please let me know if there are any tools to build the B&S model.
Thanks
Yup, these graphs were developed using the B&S model. Also, if i’m not wrong these were developed using ‘R’ software.
I tried to google on how these graphs can be generated using B&S model, but i couldn’t find any helpful resource. Can you please give me any reference on how to use the B&S model to generate these graphs.
Also i tried searching for the “R” software. As far as i understand it is a programming language. Is my understanding correct?
If you are using “R” programming language, please provide the references for this as well.
Thanks!!
Yes, R is a statistical package. All about R here – https://www.r-project.org/about.html
Cannot visualise your graphs on the iPad. Where are these graphs available for us to make a decision.
You need to develop the payoffs on excel.
Which is the software/website wherein these graphs would be available for reference?
Hopefully, we will have one on Zerodha sometime soon 🙂
Mr. Karthik,
“4.4 – Welcome back the Greeks”
Assuming Nifty moves from 8000 to 8500, Graph-1 shows 7800 CE as the most profitable strike. But, As per our strategy we will be losing money as we have short 7800 CE.
In that case what shall be the best strike to choose to get good profit from Call Ratio Back Spread strategy.
Can you clarify.
Sorry, I’m unable to get the context here. Can you kindly elaborate?
In 4.2 Strategy Notes:
You have chosen to sell one lot 7600 CE and buy 7800 CE, when we expect Nifty to move from 7743 to 8100.
In 4.4:
Nifty at 8000 and assuming it to hit 8500 the most profitable strike is 7800 CE as per the stats. But when we plot this strategy when Nifty is at 8000, we have to Sell one lot of 7800 CE and Buy 2 lots of 8100 CE.
The graph shows 7800 CE (1 lots) as most profitable strike, which we have short.
In that case 7800 CE will give us loss as it will react more than two lots of 8100 CE.
I am slightly confused to understand.
We need to consider time as well..and not really look at this at an individual strike level bur rather at a strategy level. So please look at the time to expiry and see which graph suits the situation.
Considering i am at the first half of the month.
As mentioned “7800 CE (ITM) and 8100 CE (OTM) is the most profitable wherein you would sell 7800 CE and buy 2 8100 CE”
But the graph shows 7800 CE as the most profitable strike (which we have short)
Raj – You will have to see it as a strategy as a whole, and not at individual strikes.
Dear Karthik,
If we have to implement multileg strategy, exactly how to do it on Z pi platform. Do we have to implement one by one. In such case, will not the platform identify them as separate trades? Can you please throw light one this.
Regards
We do not that yet, you will have to place order for each leg of the trade.
Images are not available on this page
Its loading very well here. Which images are you talking about?
2 questions
1) if we buy call option if we hold it till expiry is there any extra charges like STT.
2) if we short call option or put option can we squared off trade before expiry?
1) If the option turns ITM, then yes. Check this – http://zerodha.com/z-connect/queries/stock-and-fo-queries/stt-options-nse-bse-mcx-sx
2) Yes, you can.
Hello sir,
What if we buy a put option instead of selling a call option at that specific strike.
Our overall expense would increase but our profitability would also increase if the market reverses.
What other difference would it make???
You should look at selling Call options (as an alternate to buying puts) when the premiums have shot up significantly. Naturally, buying PUTS would also be expensive at this stage.
Sir I have 1 sell option and 2 buy options of call for yes bank stock. Do I get the profit / loss based upon premium for 1 lot shares or 3 lot shares..? Max loss here is 12 rs. Whether its 12 * 1 lot shares or 3 lot shares.
If you have executed this as a strategy, then you will have to consider the P&L for the entire lot, which included 3 positions.
Hi,
“Welcome back the Greeks” Diagrams are not visible.
-MS
Can you refresh your browser and check again, please?
Hello, they are not visible. Even after refreshing the browser.
How does it matter if target is hit in 5 days or 15 days… dont we have to wait till expiry to square off the trade anyways ?
Not really, you can sq off the position whenever you want. Have explained in the comments earlier.
But if you square off 10 days before the expiry then premium wont be equal to intrinsic value… it will have time value also.. so profit and loss will be different wont it ?
Yes, it would be. When you are trading before expiry, you are essentially trading the premium or the difference between your buy and sell price of the premium.
Hi I see little mistake in the excel sheet, looks like column PP is not calculated twice so it is showing only 1 leg debit so the chart itself is not showing correctly. Can you correct it
Premium Paid for both the lots is 156, which is what is in the Excel sheet.
Don’t see any errors, Vijay
Hi Karthik/Faisal,
You guys are awesome and you know it already.
I have a query:
I prepared 2 cases for March expiry at current levels.
Case 1: standard Call-Ratio-Back-Spread
Case 2: Instead of 2 lot I went long with 1 lot.
What I observed is that, in case 2:
Maximum loss decreased, breakeven span for loss reduced, profits increased. In fact everything seems positive.
Please enlighten.
not able to attach snap.
Case 1:
Underlying Nifty
Spot Price 10094
Lower Strike (LS), Sell, ITM 9900
Higher Strike (HS), Buy, OTM 10200
Credit (LS) 250
Debit (HS) 2*61
Net Credit 128
Case 2:
Underlying Nifty
Spot Price 10094
Lower Strike (LS), Sell, ITM 9900
Higher Strike (HS), Buy, OTM 10200
Credit (LS) 250
Debit (HS) 61
Net Credit 189
Sushant, while case 1 is a standard ratio spread, what you have in case 2 i.e sell ITM Call and buy OTM Call is called a ‘Bear Call Spread’. Essentially this is a variant of bull call/Put spreads. Works best if you expect the stock/index to fall. I’d suggest you plot the payoff graph and visualize the P&L to understand this better.
As per the chapter we have to maintain 2:1or ( 2n:n ).
Are there strategies which has different ratios such as (m:n) where m&n can be any number ?
No, as far as I know, most of the options strategies have a predefined ration within which you have to execute the trades.
Hi Karthik none of the images in section 4.4 is visible. Only Zerodha watermark can be seen. Can you please look into this?
Can you please check again? It seems to be working fine!
Sir
Section 4.4 images are not showing.
Can you please refresh and check again? It is working fine for me.
Hi Karthik,
Thanks a lot for Varsity.
I wanted to know that instead of waiting till expiry for this strategy to work, if I trade the options based on the premiums at any time before expiry to book profit, will the profit/loss graph remain the same or it may change based on other factors like volatility, delta etc which in turn will alter the premiums.
Thanks.
The P&L will vary, Rishab and it largely depends on the option greeks.
Okay.
Does that mean that even though my view is bullish and the stock/index does move upwards, I can still make a loss if other Greeks don’t work out in my favor ? (Before expiry)
Also, all option strategies will be surely profitable only if my view of the stock/index remains correct till expiry of the contract ?
Yes, there are instances where the stock moves in your direction but other factors drag the premiums lower. So you need to be completely aware of the greeks influences on the options.
Okay.
One more thing. During the contract period before expiry, the spot value will keep changing which may change the moneyness of the options bought/sold. So, do we need to keep updating them accordingly or we should hold them based on the initial spot price ?
I hope I am not irritating you too much with my questions!
Rishab, its always a good idea to keep the sheet updated. Moneyness of the option is dynamic and has a great impact on option premiums. It is best to be aware of the current market situation.
Okay Sir. Thanks.
Welcome!
Hello sir, I was randomly checking payoff structure for ashok leyland today sir,
spot price = 145
strike 142.5CE MAY = 4
strike 140CE MAY = 5.95
if I apply the above strategy then net cash flow will be debit of 2.05 (4 * 2 – 5.95)
I double checked the option chain for premium values. Even for Maruti twice the premium for slightly ITM is higher than deep ITM option sir.
Yes, but you may not really want to write an ITM option, especially when you are so close to expiry.
ok sir.
Hello Sir, is there any delta limit that has to be maintained while executing this strategy? net delta works out to be 0.2, is it okay or should I increase the spread to change the delta value?
If you are looking at Delta neutral, then it should be in and around 0…so something like -0.1 to 0 to +0.1 is ok. 0.2 is slightly skewed towards long side.
Images in the section 4.4 are not visible. Please do the needful.
Can you refresh the browser once and reload the images?
I have refreshed but still not working. Below image is not working:
https://zerodha.com/varsity/wp-content/uploads/2015/12/Image-3_start-of-the-series.png
But rest of the images are working fine like below one can be seen correctly.
https://zerodha.com/varsity/wp-content/uploads/2015/12/Image-2_Payoff-graph.png
Will check this, Sumit. Thanks.
Hi,
The attached strike price graphs are not visible/empty. Please look into this
Can you please refresh the browser once? Thanks.
The payoff graphs are still not visible. I am using Mac OS and chrome browser. Please look into it.
I’m really not sure why, I just got this checked on a Mac, and it seems to be working fine. Can you please try a browser hard refresh? Thanks.
Hi,
What do you think about this practice trade.
Wipro spot 282
Sell 275 CE @ 13.65
Buy 285 CE@ 8.30
As wipro will post result on july 20 so i am expecting directional move on any side instead of range bound. And although volatility is bit high but i am expecting volatility to increase due to event .i have already drawn p/l on excel so closing beyond 280-290 range level will be profitable.
I’d suggest you track volatility closely, my guess is that it will drop post the event 🙂
sir,
shouldn’t the premium increase with increase in volatility even though there are still 5 days to expiry.in that case the possibility of call options transitioning to ATM from OTM increase or you mean to say that irrespective of the strike theta simply supersedes the volatility impact and hence the premium decreases.pls clarify sir!!
The three variable i.e premium, theta, and volatility act simultaneously. If there are more days to expiry, then with the increase in volatility, the premium increases. If there are less (fewer) days to expiry, then the impact of an increase in volatility has a lesser impact on the premium. What matters here is the decay in time i.e the theta. To understand their dynamics, peg 1 of the variables like I have pegged time in this explanation.
Hi ,
Considering you execute this strategy and and market rises. Here the OTM options make money . As ITM options were sold will we lose money faster here due to high delta value?
Hence the 1:2 ratio.
For intraday is it ok if we go with 1:1 ? If we go with 1:2 then it becomes net debit. And if the market is range bound then p&L is showing negative.
Also for intraday trading do we have to calculate the intrinsic value in the excel sheet
Sure, Shyam, as long as you keep an eye on the SL 🙂
In the current market scenario it looks like breakeven is at 11500 if we sell an 11200 ITM CE and buy 11400 OTM CE. Profit will be when nifty is at 11550. Loss will be when market is range bound betwen 11300 and 11500.
Can we sell a ITM option and buy a ATM option instead of buying a OTM option?
You can replace the OTM with ATM, this will increase the cost but reduce the breakeven and the overall profitability of the strategy. Please make sure you are comfortable with the risk and reward. Good luck.
Hi Karthik,
Can we exit from all positions (Buy and Sell options) without waiting for expiry of Option ?
Thanks in advance
Yes, you can.
dear sir,
unable to see the pictures in
‘ welcome back the greeks ‘
Can you do a hard refresh and check again? Thanks.
SIr ,
can you as per your line below.
1.how to judge if volatility is on higher side ?? or know how much higher it is from general mean
2. does volatility vary of each strike different or same as underlying ( how to know change in Volatility ) ??
“I would be a bit hesitant to deploy this strategy at the start of the series if the volatility is on the higher side (say more than double of the usual volatility reading)”
1) YOu can compare the current vol with historical vol to get a sense of where the volatility stands for now. This is a rough technique, but works
2) Yes, it does
Whether one should wait till the expiry to workout the strategies or can we square off in between if the target is achieved.
You can square off anytime you want.
Hi sir,
Could you please confirm is it possible to use the SL and SLM option in kite for Call or Put options.
You can use SL order type to place your Stoplosses. SLM is not possible for stock options.
However, you can use both for Nifty and Banknifty options
Sir,
In call ratio back spread strategy, is there any chance that the max loss may increase in any circumstances. I mean is it guarantee that the maximum loss will be Max Loss = Spread – Net Credit.
Or it may fail if any adverse happens/ whatever changes in the greeks?
Kindly clarify as i am eager to apply this strategy.
Also i request you to add a window in kite for one click execution of Option strategy instead of putting seperate orders for both legs.
Not really, Nithin. The max loss is already predefined in this strategy. Sensibull is working on this feature.
There is some error in excel sheet provided. For higher strike PP ( premium paid ), it should be for 2 lots. Instead it was accounted only for one lot. When the price goes down intrinsic values goes down so it is 0 and its ok. At the same time the premium paid should also be doubled. Please correct. It would be useful for others.
I’ve multiplied the premium with 2, so that takes care. Check cell D9.
Dear Karthik,
All the figures/graphs under the topic ” 4.4 – Welcome back the Greeks ” are not visible. Can you please update the graphs.
Thank you Sir.
Seems to be working fine for me, Ron. Can you do a hard refresh of your browser and check again? Thanks.
Hi Karthik,
What is the benefit of implementing “Call Ratio Back Spread” when we get additional benefit of unlimited profit on downside as well by implementing “Long Straddle/Strangle”? Leaving the technicalities like this is preferred when movement in one direction is opined and the other is when it’s bidirectional. But i still don’t see the benefit of letting go the unlimited profit on downside as well by implementing this strategy.
I can see the only benefit is net credit when this strategy is implemented but again margin needs to be maintained for shorting.
Vishal, you implement this, when you are bullish, unlike long straddle/strangle where you are neutral about markets. The good part, as you said is the net credit on the lower side, in case you are wrong about the bullish outlook.
Hi Karthik
My question is net credit will happen only if ITM (1 selling) is higher combined both the OTM?
1) For eg selling 1 lot of 10500 CE ITM 332.30*75=24922
2) Buy 2 LOTS OF 10950 CE OTM 86*150=12900
Hence net credit will be 24922-12900=12,022
Am i right ?
That’s right, you should receive far higher than what you pay for. This is when net credit happens.
In addition to the above question, say for eg i will execute the above strategy at 10: AM in the morning will I be able to square it off after 5 minutes, and get the net credit as profit.
Yes, you can square off the position anytime you want.
Dear Karthik,
The last 3 graphs in this chapter is not visible. Kindly look into it.
Thanks and Regards,
Rajneesh
Seems to be working, Rajneesh. Can you try doing a hard refresh on your browser?
Hello sir, why you have not included chapter on, front ratio spread, i.e. buy less and sell more options. Is it not worthy or just because it is a strategy of unlimited risk(theoretically).???
Let me check, Amit.
Sir, did you???
Front spread is the exact opposite of Call Ratio back spread. The good part about this is the profitability is known across a large range (like call ratio back spread). This gives enough buffer for the downside risk. Use this when you expect the stock/index to remain in a range or go down.
Hello sir,
What if you are in a situation where the strategy turns out to be net debit instead of net credit.
eg.- spot price – 10,800
LS- (ITM)- 10,700 and premium= 296.30
HS (OTM)10,900 and premium= 167.30. and also I want you know how calculate or know the optimized spread.
Please help me in this.
How to calculate or get the optimized spread?*
Unfortunately, there is no formula for this. You will have to tweak this with few strikes.
In such cases, it would be best to select a few higher/lower strike to ensure the strategy gives you a credit. However, don’t force fit the strategy.
Hi Karthik, really great tutorials. Really the effort and explanation is appreciable.
Some how I am not able to view graphs after section 4.4 – Welcome back the Greeks
Thanks, Shukla. Can you try hard refreshing your browser?
Call ratio back spread
From 7600 to 7800 there will be lose always ??
What would happen if we cant buy two lot from the lower strike premium received so should we increase the spread size or should we spend some extra amount to buy the spread which we want to buy??
Gautam, the higher the spread the lower the profitability. So you really need to find a balance between the spread and profitability. Btw, why won’t be you be able to buy the lower strike? If liquidity is good, there shouldn’t be any problem, right?
u didnt understand the ques
lets say nifty 11600 ce 200 premium
and nifty 11800 ce 105 so here u see 105*2 =210 i didnt receive the premium in this case so what should i do then
Sorry, I’m still not able to get your query. Can you please elaborate? Thanks.
What should i do if i am not able to buy 2 lot with the premium i recived by selling a lower call option
Suppose i receive 100rs as premium by selling
And now i want to buy 2 lot which is 60rs per lot . Which will cost 120
. What should be done then
Ah, in that case, the credits (from selling the higher strike) don’t match the debit (required for buying options)…so you will have to fund the difference. There is no other way.
Hey Karthik,
I didn’t understand why would we consider Volatility in the call ratio back spread when we are going to hold till expiry and as we are holding till expiry only the intrinsic value would get traded and not the Premiums?
Please correct me:)
The strategy is net long, which means you have to ensure you buy when the volatility is low because the premiums are on the lower side.
Thank you Karthik. 🙂
You are amazing……….!!!!!!!!!!!
Lol 🙂
Thanks for the kind words!
Hey Karthik,
Suppose we are in the first part of the month and the target gets achieved in a day, so would we have to hold the trade till the expiry because to collect the premiums?
And if yes then what if for some another reason after the target is achieved the market drops then what would happen?
:))
No, you can sell it anytime before the expiry of the trade. No need to wait till expiry.
So would I be able to pocket the premiums when I short the option?
Yes, you will receive the credit of the premium for the option you’ve written, Ram.
Sorry Karthik I am not able to understand when the intrinsic value is traded and when the premiums are traded?
Like if one could sell a option and pocket the premium and buy it back instantly what would get traded the premiums or the intrinsic value? 🙂
Its the premium which always gets traded. Just that the value of the premium is derived from the intrinsic value of the option.
Hi Kartik,
Suppose banknifty is trading at 30600. If I make two positions like sold CE 31000 and sold PE 29500 just one day before expiry. And on the expiry day if spot value remains in between these two strikes, will I be making money?
Looks like, Amol. I’d suggest you try plotting the payoff on Excel to visualize and understand the strategy’s behavior better or you could try https://sensibull.com/.
Hello karthik,what is the meaning of the context “volatility is on the higher side ” please do clarify my doubt.
It simply means that today’s volatility is higher compared to historical volatility.
Hey Karthik,
Normally what is the average IV on Nifty stocks?
It varies across the stocks, Ram.
Thank You My Superhero!!!
sabka malik ek – the markets 🙂
Hi,
Ref; call ratio back strategy:
Pl check calculation for expiry at higher strike @7800 – double whammy point, loss should be RS 201+78×2 = 357. Pl do correction in chart and calculation. Thanks.
For 7600CE, 201 is the premium received, intrinsic value is 200, so this actually results in a net gain of 1. You’ve sold 2 lots of 7800CE at 78, so thats 156 in loss. Total loss is 156-1 = 155.
Am I the only one who can’t seem any images post Section 4.4 – Welcome back the Greeks?
Can you try doing a hard refresh on your browser?
Sir,
I am sorry as i may have missed it but from where do we get the graphs involved in selecting the strike prices?
Do you mean the option chain? It is available on Kite, click on the context menu available when you load a strike on the Kite’s Marketwatch.
Hi Karthik , Just great learning
I was working on the Nifty Bank and checking the strategy .
For me to get a net Credit i actually required a very big variance
Spot : 17477
Premium for 18700 CE : 603.75
Premium for 17300 CE : 1294.15
Nett Credit : 88
With such a big spread , can we actually make any money in this strategy
For any lower spread we are not getting any nett credit
Am i playing it wrong , or this strategy is best avoided for Bank Nifty or i am picking the wrong strikes
Cheers Aman
Underlying Index: BANKNIFTY 17477.00 As on Mar 23, 2020 12:34:25 IST
LTP Strike Price
1,419.95 17100
1,354.80 17200
1,294.15 17300
1,234.95 17400
1,163.00 17500
1,110.65 17600
1,056.05 17700
1,004.05 17800
956.65 17900
895.25 18000
845.05 18100
802.2 18200
751.05 18300
718.15 18400
686.3 18500
655 18600
603.75 18700
578.55 18800
551.3 18900
521.45 19000
490.85 19100
The problem is not getting the credit, it is about getting protecting it 🙂
If the market rebounds and starts making a comeback, you could be in trouble with this position.
The problem is not getting the credit, it is about getting protecting it 🙂 .. I am sorry this is not clear to me
I just want to know for this spread to work what is a favourable situation and which instrument is more suitable as Bank Nifty case which i tried , i could not use data to verify the hypothesis .
The payoff graph explains this well. You make a profit of mkt moves in any direction. You lose money if the market stay within the range.
Hello Karthik!
How do we plot volatility, payoff and time to expiry graphs? Can you please help with some resource?
Thanks!
You need to do this with a program, Arjun. Something like R or Python helps
Ok I cant see the graphs in sections welcome back the greeks even after performing hard refresh.
Ah, strange because it looks fine on my system.
Hello Karthik,
Would appreciate if you could kindly answer the flwg queries :
1. Does the ratio always have to be 2:1…. or can 3:1 could also be considered.?
2. Is having a Net Credit (rather than zero or negative) at the start of the strategy the key to profits?
3. As can be seen… the max loss occurs (at expiry) at the Long Strike Price (i.e 7800 ). Is there
a way to keep this loss to a minimum or mitigate this loss (during these volatile times) by initiating
a counter trade.?
This is indeed otherwise ‘an interesting options strategy’ as indicated in the tutorial.
Unlimited profits if the market rises… A limited profit when it falls…and a pre-defined loss when flat.
Thanks.
1) Can be in the ratio of 2:1…so 4:2 or 6:3
2) Not a key, but good if its that way
3) Hmm, you’ll have to offset this with writing options within that strike, gets a little messy though
Good luck!
Sir ,
How do we calculate the call-ratio-back-spread for a Stock underlaying . what detail has to be edited , is Option chain details available to download on nse or has to be typed manually on the excel sheet ?
You just have to look at the premium and do the calculations accordingly. I think you can use the same excel sheet.
Hi Mr. Karthik,
In the above chapter, in graph 1 and graph 2 saying, if I expect the move in next 5 days, then I have to select 7800CE ITM and 8100 CE OTM for most profitable trade and also you mentioned selecting other far OTM strikes call options tend to lose money. On what basis you are telling this, It is showing in the graph that is ok. Can you explain me the deep subject how the greeks are acting and why we are selecting only the specific strikes for a profitable trade?
I have the same doubt in the previous chapters as well with Bull call spread and bull put spread. If you can explain me with one case I can corelate with rest of them.
Thank you
Chandra, all greeks are explained in great detail in this module. The graphs are derived out of the B&S model. Which part is confusing you? If you can explicitly state that then maybe I can help.
Hi Mr. Karthik,
I understood the theory about the greeks. I appreciate your efforts as it is very easy to understand.
I just want to know how I can get loss selecting far OTM strikes If I expect the move in 5 days? Far OTM strikes will have less delta and also vega. If the move is in the expected positive direction, delta will increase and and effect of theta will be less compared to near by strikes and also I may get to buy the strike at lesser price. I mean if I really expect the move in 5 days and square off my position. I am a novice trader with no practical knowledge. Please take sometime to explain me this. let me know if I miscalculated this spread.
Thank you
Chandra, yes, if you are expecting the price move in 5 days also assuming you are early in the series, then you are better off by buying an OTM option…but not far OTM. There are times when the price moves but may not translate to an increase in premium for far OTM. The reasons for this could be many – the speed at which the market moves, volatility, and of course theta. So stick to slightly OTM instead of far OTM.
Got it.
Thank you.
Sir I am not able to see Welcome to Greeks all graph.
zerodha written on every page.
Kindly see to it Sir
Thank U
Can you try refreshing the page, Abdul?
Namaste sir,
Under Back to Greeks heading, while discussing volatslity, one statement says “Blue line suggests that an increase in volatility when there is ample time to expiry (30 days) is beneficial for the Call ratio back spread”. Later in the para it is mentioned that “For this reason, even though I’m bullish on the stock, I would be a bit hesitant to deploy this strategy at the start of the series if the volatility is on the higher side (say more than double of the usual volatility reading)” . I am bit confused sir. Kindly clarify.
Thanks and Regardss.
I think I replied to this query, can you please check the comments? Thanks.
Ok Sir,
Will check.
Regards.
Good luck!
Sir,
I could see two comments where this point is touched. What I understood from your clarification is that we should not DEPLOY this strategy when the volatality high (because premiums would be high). Instead deploy it when the volatality is low and take advantage of low premiums and high volatality later after deployment. Whether this is ok Sir. Regards.
Absolutely!
Respected sir,
Thanks a lot.
I am not into Options trading till now. But slowly getting the touch and feel of the intricacies involved from Z Varsity. You have become my Guru Dhronacharya sir. I could learn right from scratch till this stage without spending even a single paise. No need to attend any Webinar or Workshop. That is the power of ZV. Kindly accept my PRANAAMS for your untiring effort in imparting us invaluable education about stock markets and also for answering all our doubts however Silly they may be. Warm regards sir.
Hey, thanks so much for your kind words Premkumar. It is a privilege for us. Hope you continue to learn and grow 🙂
Hey,
Can we use these strategies if we do not want to wait till expiry. Can we square off prior to expiry and earn through increase/decrease in premium as the case may be and still attain the desired outcome as explained?
Yes, you can initiate this for few days and not really wait for the expiry.
Hello Zerodha Team,
While reading welcome Greek Ratio
I am not able to see Welcome to Greeks all graph.
zerodha written on every page.
While I am refreshing the page, so many times it could’n seen.
Please reply as soon as possible, to solve problem.
WITH BEST REGARDS
ADESH K.
Can you try a hard refresh of the page?
I restart my computer still I can’t able to see graph.
Hmm, I think this is a browser issue. Please hard refresh your browser.
Kartik ji
I am trying both mobile and Laptop, its not show graphs.
Sometime graph shows on mobile for a moment, and its not work properly.
I’m not sure Adesh, it seems to be working perfectly fine on couple of systems here.
Karthik, Graph is not coming in chrome and firefox.
Can you please try and hard refresh your browser?
graph is coming when i download the PDF file. Cheers
sir ,
How to place multiple legs order in kite ?
Hi Karthik,
Thank you for preparing this material and making it available without any cost. I have a few doubts regarding this strategy. While trying this out, on most of the stock/index options the premiums for Slightly ITM and Slightly OTM options are pretty close. As a result, there is a Net Debit instead of Credit.
1. Since, this leads to a Net Debit. Wouldn’t this result in losses when the underlying price goes down, though the position will be slightly hedged? And will return profits only when the price increases?
2. Is it advisable to use this strategy in such a scenario? If No? What kind of strategies will be better?
1) Yup, hence you need to time this a bit and initiate the position when the premiums are properly aligned for the desired payoff
2) No. You can try other strategies like straddles/strangles.
sir ,
please reply.
Can confirm. The images are broken. That’s how they look. https://i.imgur.com/tTwg6D2.jpg
Maybe you don’t see the issue because you are logged into WordPress. Try visiting this page in incognito.
Strange. I just looked at the same chapter in incognito, can see all image. Did you do a hard refresh on the browser?
Yes. I seemed to have found the issue.
This is the source code of one of the images with the issue
The issue is that for my current monitor resolution, it loads this image https://zerodha.com/varsity/wp-content/uploads/2015/12/Image-3_start-of-the-series.png which doesn’t exist.
but for you, it probably loads this image https://zerodha.com/varsity/wp-content/uploads/2015/12/Image-3_start-of-the-series-1024×576.png
That’s why I and many other peoples see the broken link and you see the right image. It’s because of the different display resolutions. I think deleting and re-uploading images will probably fix it. If it doesn’t work, maybe you can ask someone from your development team to fix it.
Thanks for investigating this, Varun. I’ll try to re-upload the images.
Again posting my last comment in a Pastebin (since WordPress removed part of the message).
https://pastebin.com/raw/CyfxhisS
Comment with goes for moderation 🙂
all the graph are missing towards the end. selection of strikes
Hello Karthik
I am bit confused with P/L graphs. For ex. when you say target hits in 5 days and option is bought in first half of the series. Why does it matter when target hits as options has to be square of only on expiry. And lets say target hits in 5 days but later underlying goes down. your square of anyway will happen on spot price of expiry? so how does it help me if target hits in 5 days or 10 days?
Secondly, in P/L calculations; have you assumed that market steadily increased at the rate we intent to(6.25% in your calculation)? May be this answers my first question. 🙂
Thanks
Uday
Uday, when you trade options, you essentially trade the premiums vary and hence you get to trade the premium at whichever point you want. There is no need to wait for expiry. So, I’d suggest you think about it from this perspective.
I see… meaning when target hits, i do square of the options trade other way & cash in P&L as from change in premium.. Got it… thanks.
Yup, good luck Uday!
thanks
Hi Karthik !
First of all a deep appreciation for writing such a beautiful content .
I was about to implement this strategy for Sun pharma July expiry by selling 1 Sun Pharma 470 Ce(36.10) and Buying 2 Sun pharma 490 Call(2*8.25) with the net credit coming to be 19.6.After Calculation on the Excel Sheet what is provided above ,the loss is coming at higher strike only (490),Can I Consider my calculation to be correct?
Thanks.
Thanks, Sunnan.
Yes, this seems to be correct to me.
Sell one ITM and buy two OTM options.
However, I have observed that, the cost of buying two OTM options is more than the premium we receive by selling one ITM which makes is a debit spread.
I have checked the prices for Index and Stock options.
Eg: ITM premium is Rs.100, OTM premium is 70*2=Rs.140, gives a net debit of Rs 40
Am I missing something?
That’s possible. The only way to deal with this is by going to the next strike where the premium is lesser and hopefully, this results in a net credit.
Thanks !
Sir, Kindly update the graphs. The graphs aren’t visible.
I can see them Jithin. Don’t see an issue.
Hi Sir, Thanks for the easy-to-understand study material. I am very new to this options learning. So, please excuse if my question is very basic.
How do you get this “time to expiry chart” for selecting right strikes?
Thanks
Sagar, you can check Sensibull for this. Else, you can plot it on Excel quite easily. I’ve explained the method to do so in the chapter itself.
Greek graphs are not visible in desktop version but they are visible in mobile version please rectify the problem.
Which app are you looking at Vijay?
Hello sir,
I have one doubt.I think the number of days taken to achieve the target does not really matter if we intend to hold the position (Call ratio back spread)till expiry.Am I right? If I am right then what do the bar graphs discussed in this chapter convey?Do they tell the profitability of this strategy when we intend to square off our position before expiry by just trading the premiums?
Thats right, it does not matter if you decide to hold to expiry.
Just trying to understand the volatility impact again.
In the chapter you say with 30 days left, having a high volatility is beneficial, however u also say though you bullish you will be hesitant to deploy this at start of series if volatility is high. Didn’t get this.
Are you trying to say that because there 30 days left, the chances of the premiums to move up reverse are high if there is high volatility . Greater swings possible ?
If that is true than the time to expiry 5 days, shouldn’t it be beneficial ?
If you can try and explain this chart and concept again probably with a example
Its just that high volatility implies higher premium and hence not so conducive for the buyers.
Sir,
Section 4.4 on this page – “Welcome back to the Greeks”. Graphs are not visible.
Regards
Can you please do a hard refresh to the browser?
Even after Hard Refresh, graphs not visible on Chrome Browser or Edge Browser on Windows PC.
They are visible on the mobile version (on safari or chrome browser on mobile phone) but not visible where full desktop version website opens (such as Ipad’s Safari or Chrome Browser.)
P.S. – Graphs are also visible on Varsity Mobile App.
Kindly Look into it Sir.
Regards
Thanks, Sharan. Will check this again.
In the example you said spread that best works for this strategy is 300 points. Now this is based on the underlying being around 7800 spot value.
What if we are dealing with stock thats lets say is 75 spot value. Can we do a proportionate adjustment to get to the two strike values.
300 is ~ 4% of 7800, so is it ok to say that the difference between the strikes should be around that much?
Yes, you can do that. Best if to evaluate based on the current price and market circumstance. Use the 4% and a generic guideline.
Hello Karthik,
Huge fan of your teaching method! I soo wish my MBA faculty would had explained us like this. Massive respect!
Images after 4.4 (Welcome back to the Greeks) is not getting loaded. I tried using other browsers as well (Primary Chrome). Is there any pdf version which you have saved it for this same? I tried to connect with the main pdf saved at the start of the module but its with different example.
Thanks for the kind words. Many folks have complained the same, but it seems to work perfectly to many others. Unless we can replicate the issue, it is hard to fix 🙁
Sir
What if there will be net debit instead of net credit.
Example-
Sun pharma spot today-510
Premiums for OTM 520 CE-25 ,ITM 500 CE-34
Net cost=34-2*25=-16
No issue, the trade is still on if the overall strategy is in play.
Sir but whole P&L scenario will change
Thats right. The expiry P&L represents the worst and best case, if you close before expiry, your outcome will be within these outcomes. I think you can use Sensibull to check the outcome.
Sir
In the case of net debit,strategy goes completely wrong.
Just like in above example of sun pharma,
P&L-
Expiry below 500 Loss-(34-2*25)=-16
Expiry bw 500 to 556 also gives loss
Expiry above 556 only will give profit.
So the strategy will fail in case of net debit and as much as I hv observed there will be net debit in case of set up of this strategy.(That is selling 1 slightly ITM CE and buying 2 slightly OTM call)
Jitu, you can try these strategies on Sensibull. They have a nice strategy builder using which you can visualize the expected P&L at and before expiry.
Karthik,
If we are holding this strategy upto expiry and we are expecting the 6.25% move anytime before the expiry. Thn even in 2nd series case, instead of deep ITM and slight ITM call, if we sell 1 slight ITM call and buy 2 slight OTM call, the strategy should work fine. ???
I cannot shrug off this doubt as to why then deep ITM leg is required?
It should work, there is no problem with that. Its just that deep ITM completely finances the purchase of two OTMs, else this can result in a cash outflow.
IMO, this strategy is not at all suitable for amateur users, it is not easy to play this as it seems. The at expiration diagram is very misleading. The Greeks are very complicated and in order to profit from this one needs perfect estimation of volatility and Timings.
1. When one is deploying this strategy he/she is basically buying a volatility skew by selling slight ITM higher IV and buying 2 OTM with comparatively lower volatility then ITM strike. It might not always be the case so one has to make sure the skew works in the long volatility favor. This gives one an edge.
2. Holding this trade to expiration is risky as Theta cost is on the higher side and also Vega reduces significantly. So one needs to scalp gamma in order to over come the cost of theta and make trade profitable. However, biggest challenge in gamma scalping is the changing gamma, because as underlying move lower gamma can become negative.
3. As mentioned in point 1. This is a long volatility strategy hence vega is positive. But know that, underlying price and IV have inverse relationship. When underlying fall sharp IV will shoot up, when underlying rise IV will decline. If the underlying moves below the lower strike the vega becomes negative in the phase of potentially rising IV which will hurt the trade. If the underlying moves up and rises into positive vega turf there is always risk of IV declining.
4. So, it remains for us to see if the volatility skew between the strike is enough to compensate for the potential vega move as underlying changes.
It is advisable to trade this strategy only when you expect a comparatively smaller change in IV but a greater potential change in realized volatility, also when you have a good volatility skew between the strikes. This increases the chance of profits.
Thats right. This strategy is long volatility and also long underlying. Gamma scalping is not only complicated but also expensive, you’d spend a ton on money just to maintain neutrality. One should not deploy this if the view is not bullish on the underlying.
in continuation to above comment.
a scenario where IV is less but realized volatility(historical) is higher is EXTREMELY BULLISH environment. so if one is outrightly bullish one can use this strategy but again, beware of the Greeks…. !!
True, I agree with you.
@karthikrangappa
As stock options are physically settled.
What if i implement call ratio back spread and it went outrightly bullish ?
All become In the money right?
Should i take physical delivery ??
The decision to take delivery or not should be decided based on what you expect out of the stock right?
My question is if I let it expire IN THE MONEY, as the market is out rightly bullish
how many legs are physically delivered ?
Whether it is only lot or two lots of ATM which are physically delivered in CALL RATIO BACK SPREAD ?
In this, case, 1 lot will be physically settled, and the other 2 will be offset.
Hello sir,
the graphs are not visible after the para 4.4 “welcome to the greeks” instead only ZERODHA is written in place of Graphs..
Ah, let me check this Sumit.
The charts have kind of disappeared on this page. Bringing to your attention.
We are looking into this.
hiii sir … good afternoon
sir can i use call ratio back spread in usd inr options
please help me sir
Yes, you can use.
I have a doubt sir? what does it actually mean by collecting premium while writing options . like.., if today i write an option and i collect premium and if tomorrow i square off my position will i still retain that premium amount? or will it vary based on cnc and mis
No, when you sell the option you collect premium. When you buy options, you pay premium. The difference is what you make when you sell and buy.
Today 28TH SEP if i use below strategy:
NIFTY – EXPIRY 29 OCT
SPOT: 11111.4
SELL CALL – 11050 @ 282.9 X 1 LOT
BUY CALL – 11200 @ 202.8 X 2 LOT.
I WILL LOOSE MONEY ONLY BETWEEN 11131 AND 11269. LIKELINESS OF MARKETS STAYING IN THIS RANGE IS VERY LESS FOR PERIOD OF 1 MONTH GIVEN HIGH VOLATILITY. ANYTIME IN 1 MONTH I CAN CHOOSE TO EXIT POSITIONS AND EARN PROFITS. LOOKS SIMPLE IF I HAVE ENOUGH MARGINS IN MY ACCOUNT.
Yup, but you also need the movement in the underlying in your favour.
Hello, Kartik
First of all, thank you for providing the fantastic material in easy to understand language.
I have read all the previous module they are excellent.
Just 1 doubt regarding option strategies, in light of the new rule of SEBI to a compulsory delivery based settlement instead of a cash settlement,
1) can I hold options till expiry to maximise profit?
2) do I need to square off my position before expiry?
3) What if I failed to square off my position?
Please provide details about it.
Thanks
1) Yes, you can, but the margin requirements shoot up, you may want look into that
2) Not required
3) It will get settled based on the moneyness of the option
Cannot see the charts/graphs in call ratio back spread strategy
There is an issue with this I guess. Unable to replicate this on our end.
Why are the volatility charts not showing up?
Volatility charts?
One additional point – How does the volatility play differently when comparing call ratio back spread and put ratio back spread. Is increase in volatility favorable in both these strategies? My knowledge tells me that high volatility is a friend when going about selling strategies as premium is already fairly high and converse is true for the buying strategies?
Thanks.
Thats right, increase in vol benefits both these strategies on the long side, the other way round if you are shorting this.
Hi Karthik, In a paper trading of the call ratio back spread, I bought Oct 12050 CE, 2 lots for Rs. 81, sold Oct 11800 CE for Rs. 194. Net credit Rs. 32. BE points are 11833, 12267. Today (Oct. 26th), Nifty ended at 11767. It is below the lower be. However, instead of profit, the loss is Rs. 1823. Please inform the reason for the loss despite breach of the lower BE.
Kumar, the P&L is based on the expectation that the position is held to expiry. To see the range of P&L before the expiry, its best to check the graph on Sensibull.
Sir, none of the images (graphs) from 4.4 Welcome back the Greeks are loading. Only a photo with “ZERODHA” written on it is being displayed. Tried in both in Chrome & Firefox. Also opened image in new tab : https://zerodha.com/varsity/wp-content/uploads/2015/12/Image-5_volatility.png ; https://zerodha.com/varsity/wp-content/uploads/2015/12/Image-4_2nd-half-of-the-series.png . But still not displaying.
Not sure, Atish. It seems to be fine on mine and several other systems.
Suppose I execute an option strategy on Monday for Thursday’s weekly expiry in Bank Nifty. Let’s say I am executing a bull call spread strategy where BnF is trading at 27534. I buy one ATM call and sell one OTM call. My max profit is 7k and max loss is 5.4k (as shown in Opstra). Breakeven is at 27717, meaning if BnF falls below 27717 I start making losses and my max loss is at 27500. Let’s say on Tuesday BnF closes below 27500 and I make an MTM loss of 5.4k. What will happen on Wednesday and on the expiry day that is Thursday if BnF keeps falling, Will I incur a loss of 5.4k for the next two days i.e Wednesday and Thursday or my max loss will be capped at 5.4k somehow?
Thats right, your loss will be capped to 5.4K.
But how? What will happen on the subsequent days?
Meaning?
In the above situation, I have already lost 5.4k on Tuesday which is supposed to be my maximum loss, I didn’t square off my position and the market is still falling. What will happen on Wednesday? Will I lose more money? If not then how?
The loss will be equal to the max loss provided you hold all the legs to expiry. However, it could vary a few percentage points before during the series.
Thanks Karthik.
In Option strategies is always good to carry the trade till end , means what if i want to PUT SL , is there any kind of calculation to get our of trade with combined SL. just trying figure out how pro traders come out such trades with hitting SLs when they trade in big quantity.
Well, it is only a matter of practice. With practice, you will know how to calibrate your trades better.
Thanks sir for this wonderful strategy..
Post section 4.4 , Graph is not visible, could you please make it visible to understand clearly..
Checking on this, Sachin.
The graph is not shown. Only Zerodha is written on it. Moreover, it will be very good if graphs for selecting strikes according to theta is providing in all the strategies.
Checking on this.
Dear Karthick,
I had read Strike Selection much time But I still in Confusion because of the graph can you please explain how to calculate the P/L.
What exactly is the confusion?
breaking higher Break even is somewhat harder then breaking lower break even… so can this also combined as limited profit bearish strategy.
Profits are all capped, so in a sense, yes!
Dear Sir,
The Excel Sheet provided by u have one mistake in HS Payoff Column formula, In HS Payoff Formula Premium paid is not multiplied by 2, I think as we are buying 2 lots we should double the premium paid.
Please clarify sir,
That’s right, 78 is the premium for 1 lot, hence we have considered 156.
Hi Karthik
Sorry to bother you again. Can you please let me know which option strategy is good to hedge future contract. Let’s say I’m long Nifty future contract and would like to hedge this position with an options contract. Is it better to follow the simple rule of buying a put ( long put ) which I guess is expensive to hedge.
I’m not asking for a particular strategy but you can please give me a general rule of thumb when hedging long future contracts. Like for example credit option strategy or debit ? call Backspread ? I just want to know what should I look for when I want to hedge futures contract.
Many thanks
When you hedge, you only need to look at hedging delta i.e. directional risk. The problem when you choose far month is that you are also paying for time to expiry. Hedge is better when you keep it simple – Short futures, long Call 🙂
Actually the graphs are not displayed in the analysis of the strikes.
In a 30 day series. if my target is hit in first 5 days, am i supposed to square off?
Yup, or you trail your SL and ride your profits.
Hi, all images in section 4.4 – Welcome back the Greeks is missing. Could we please get it?
Hi sir,
Above mentioned payoffs are regarding option’s expiry. In case i square- off before expiry, will above stratergy work in same way? Or there wiill be dfferent calculations for premium change before expiry? I mean , is above stratergy is only applicable, when you hold option till expiry?
Your P&L will slightly vary. I’d suggest you check possible P&L before expiry on Sensibull.
hello sir
sir if we implement this strategy today and expect move till 5 feb then expiry is far away from here then how to determine profit loss here because the scenarios we discussed were focusing on expiry date and at the mid the options behave different because of theta and volatility .
The P&L will be slightly different for these strategies if you were to close before expiry. I’d suggest you look at the Sensibull site to visualize this.
Hi,
Most stocks showing negative credit when taking near strike prices , will this strategy bullish stocks? What is the max spread i can consider for profitability?
Usually, it is good if you can try and manage this within 200 to 300 point spread. Traders do this for credit if that’s not happening, then maybe it is not worth the setup unless you are extremely bullish.
hello sir,
sir i am confused in how to determine the spread size ?
200-300 points is usually a good spread.
Hi Karthik,
The images under section 4.4 are not visible. Can you please check?
Thanks
hello sir,
sir i was just exploring this strategy in excel sheet by different strikes, sir surprising when i used 1:1 options for this ,then profitability was better ?
Possible, it also depends on the premium available in the market.
morning sir ,
sir what to do when VIX shoot up and premiums are high?
then break even is shifting to far strike prices which seems sceptic to achieve ?
Then you need to look at option selling strategies provided you expect the premium to cool off over the next few sessions.
Hi Karthik,
First of all I would like to thank you for sharing your precious knowledge with us. I learn lot of things from this platform. After reading about all strategies on varsity, I was trying different strategies in sensibull platform like bear call ladder, call ratio break spread and put ratio break spread. As you say these are the net credit strategies but with all possible combinations of different strike prices and expiry dates, I didn’t get single strategy where it was net credit. Its always net debit. For example. Nifty spot is 14924. For 25th February expiry, 14800 CE (ITM) premium is 551.5, 14900CE (ATM) premium is 499 and 15000CE (OTM) premium is 443 so its net debit of 29288 rupees. Why is so ? If we have a bullish view, should we go for this even if its net debit ? Is there any additional factor to be look upon ?
I understand, sometimes, the premiums are positioned such way that it won’t result in a net credit. You can go with a net debit as well, but ensure the net debit is way lower compared to a naked call buy position, else there is no specific advantage compared to naked call buy.
graphs are removed ? i dont see the pictures
Looks like some issue with it, Sridha. Not sure how to fix it.
hello sir…..i am not able to see last 3 graphs
Some issue with it, Raj.
This strategy looks good. With respect to margin in practical need clarification.
1.After initiating the strategy the market direction is moving in our favor, Also getting margin shortage message from Zerodha. Hence not able to hold the position comfortably. Please share the details on the margin requirement if prices are moving high in our favour.
2.In Zerodha margin calculator have checked the margin requirement as same when we initiate this strategy in ATM and even in ITM margin is same, but why getting margin shortage message when the price movements happening in our favour.
Thanks.
1) Unfortunately the margin increases as we move closer towards expiry, Ramesh. The only way to reduce is by adding more puts, but that increases the cost of the strategy
2) As the prices moves, so does the margins.
Sir, some of the graphs are not displayed from section 4.4 onwards. Request you to kindly paste those graphs. Thanks.
Thanks for your reponse Karthik. But have couple of questions in mind.
1. Got the margin requirement shortage message with more number of days left to expiry. Please can you share the approximate increase in margin requirement say if stock price increase by 3% or 10% and number of days left to expiry more than 20 days. Zerodha margin calculator will be helpful little bit but your insights will help me more.
2. One more questions arises when the margins increase and in case funds shortage arises. Will the position be squared off(maximum at how much % shortage in margin amount) or daily interest penalty will be applied on the margin shortage.
1) This is a call taken by RMS, I’d suggest you write to the support for this
2) The position will be squared off, Ramesh.
Ok fine.. Thanks for your response..
Good luck, Ramesh.
Hi Sir,
If I compare this stratergy with simple option trade.
Buy OTM at 7800CE.
Spot price :7743
Premium:78*2=156 (2 lots)
On expiry:
Breakeven :7878
Max loss :156
Max profit:unlimited.
Where will be the advantage of this stratergy compared to above example.
That’s right, but for which you need to be absolutely sure that the market will go up.
Mr KarthiK,
I have been going through your Course Material for the last 3 days and must admit that you do have lot of patience seeing the good and simple way you deal with the subject and with patience you will reply to innumerable questions posed by readers and users. Why I was reading these as a Sr Citizen I am interested in Options. Seeing whether I can learn anything from here as there is a constant problem of making some money and losing money with Naked Options purchasing and selling with out any real strategy.
After reading your articles and readers Q & A, I know I am not suitable for this as there are many variables in the equation to deploy a strategy and that too in a market which is dynamic and changes at the slightest news. I normally buy and sell options on the same day with one or two lots only of Index Options to be on conservative basis. If any strategy which is simpler and easy to implement to cut down the losses is there you may please highlight it so that I can concentrate on it rather than reading all the strategies and get confused thoroughly.
Thanks for the kind words, and I’m glad you liked the content. Option is a complex instrument to deal with. The variables at play are the same regardless of the quantity you trade with. I’d suggest you give this enough time before you get comfortable with options, maybe you can paper trade for a while. As far as simplicity of strategies are concerned, the simplest is buying and selling of plain vanilla options.
Dear Mr Karthik,
Nice you replied very quickly. The problem is some times with Plain Villas why I am incurring losses in some instances is due to averaging the things expecting the market will go up or down with what I am averaging. But it does not happen most of the times and options will expire as they are only for a trading for 4 to 5 days only.
Is there any other simple technique without averaging and waiting for turning the tide of market. The variables like VIX, Delta, Theta, etc etc are and directional things of Technical things are very complex and we have to learn them and practice for long time to get a mastery on them. My age is not suitable for that now.
With Best wishes
P Narasimha Rao
It would involve timing the market to ensure you get the perfect bounce in option premium, but this is easier said than done. My personal advice, please don’t trade options (considering your age), its not worth it. Rather I’d suggest you take short directional bets on stocks and hold for few days/weeks.
Hi sir,
If I expect the move in second half within 5 days you were telling to take Deep ITM and slightly ITM that’s fine. But why does nearby OTM strikes make loss? If there is upside expected movement, delta will dominate theta in this short time which results in profit in this startegy. There won’t be much theta decay right? please let me know where is the point I am missing here? why can’t I take near by OTM options
Chandu, there are two aspects – the drag from Theta is slightly on the higher side closer to expiry. Plus, in case of volatility drops, then the drag on the premium will be high. Hence safer to stick to ITM.
Due to some peculiar problems I am having due to my last company working I am trying to make some money. I invested in lot of shares and Mutual Funds in equity and debt and it gave me good profit to me but to make some more money in Options I am trying to get some money.
I’d suggest you stick to MFs and positional trades rather than options. It is very easy to lose all the capital at once with options.
Thank you for this guide Karthik, it was extremely helpful.
For selection of an optimal strike (ITM & OTM) you had generated 4 graphs, can you share some input on how we can generate the profit v/s strike price data on our own (for multiple scenarios of days left to expiry)?
Is it generated by putting in the relevant information into a Greeks calculator (expiry date, spot, strike etc.) one by one and using the generated call and put premiums to figure out profit? Is this approach correct or am I way off track?
Thats right, this was generated by using B&S as the base model and a code to generate the graphs.
Sir,
In scenario 1, net cash flow will be negative right? because we are buying 2 lots of OTM and selling one lot of ITM so it should be -111 assuming lot size is 75
Yes, this is mostly a debit strategy.
the greek graphs aren’t available(there is a blank space there in place of the graphs), is that a glitch or something
Can you try doing a hard refresh? Also try another browser?
I am unable to see the greek graphs, tried with different browsers, also tried hard refresh. could you please check? thank you
Not sure what can be done, Anand. Let me check again 🙁
thanks Karthik, could you please share the PDF file on the Call Ratio Back Spread, so i can resume my understanding on the topic. Thank you
You can download the PDF here – https://zerodha.com/varsity/module/option-strategies/
I am customer of Zerodha great modules for study but in this chapters the pics of graphs are absent, plz correct it
Checking, thanks.
“4.4 – Welcome back to the Greeks”, under this section all the graphs are not visible. Instead of the information in graph only “ZERODHA” is being displayed. it is request please take a look at this as it unfeasible to understand the written content without graphs.
Checking on this.
Hello Sir,
Which is a more suitable strategy, the call ratio /put ratio back spread or bear/bull call ladder?
The ratio back spreads are usually cheaper to implement?
So which is more generally used?
Also when I initiate these positions I have to add each position one by one and exit each position one by one correct?
Is there not a button to initiate and square off all three at the same time?
This depends on the market condition. There is no one strategy fits all situation kind of thing, Jatin.
Also when I initiate these positions I have to add each position one by one and exit each position one by one correct?
Is there not a button to initiate and square off all three at the same time?
Jatin, check this https://support.zerodha.com/category/trading-and-markets/sentinel/articles/baskets-sentinel
hello sir, you’re the best guru out there can you help me with one doubt the net profit would be multiplied with the 3 lots or 1 lot I’m confused. regards
3 lots. Its always with the number of lots that you have.
Hi Sir,
As you said, closer to expiry high volatility will have negative impact on OTM option premium but should it not be opposite as high volatility will increase the probability of OTM option expiring in the money hence premium increases?
Can you please share the entire context in which this is stated? Thanks.
In the above chart, you explained Red line in which increase in vol will have negative impact on OTM premium.
In scenario 3 we sell 7600CE and spot is 7645 having diff. of 45 , why we substracted 45 from 201 , as we need to add this to premium received on 7600ce sell as any spot above 7600 should be profit for us
Plz explain , or correct me where I went wrong
To factor in the price that we pay as a premium and arrive at the breakeven, Akaash.
Namaste Sir,
Should I execute this position as a net debit or should I avoid it?
Usually net debits occur when you sell ITM and buy ATM or 1 strike above OTM.
Often many stocks have illiquid strikes later on so it becomes difficult to implement.
Simran, beware of dealing with illiquid strikes. The point of spreads is to avoid directional risks, but in order to avoid that, you dont want to get caught with liquidity risk.
Sir! When there are very few days to expiry, how does increase in volatility has a negative impact on the strategy? How does increase in volatility when there are a few days to expiry enhances the possibility of the option to expiry OTM? I didn’t understand this. I’d be grateful if you can explain it in a little more detail.
Its just that with the increase in volatility, there is a huge possibility of option swinging both ways, hence the premium increases.
Sir! In the last paragraph of this chapter you’ve written “increase in volatility when there are a few days to expiry enhances the possibility of the option to expire OTM, hence the premium decreases”. But in the aforementioned reply you’re saying the premium increases. If the premium increases, then the 2 lots of OTM options we’ve bought would increase in value. How would that not be good for the strategy?
Prashant, my bad. For some reason I thought I’m replying to a comment related to call option buy 🙂
Yes, with increases in volatility, option going OTM also increases, hence decline in premium. This is kind of counter intuitive.
Chapter 4.4 onwards images are not loading. can you please check that? Thank you!
Sir, you have mentioned buying n selling of ITM call if trade initiated in second half but in key points u have mentioned that choose itm n slight otm irrespective of time to expiry, pl explain m confused
ITM or slightly OTM, both are ok.
Sir Call ratio back spread is resulting in net debit in some of the stock options. For example today Dabur closed at 590. 585 CE was trading at Rs 19 and 595 CE was trading at Rs 13.8. If we sell I lot of 585 CE and buy 2 lots of 595 CE, it results in a net debit of Rs 8.6 instead of a net credit. Same was the case with Deepak Nitrite today. What should we do in such scenarios?
Yes, hence you need to select options and strikes where the premiums are positioned attractively to result in a net credit.
How do we approach all these strategies. They are so confusing….
Can it be simplified and curtailed into practically related one
Eg bullish has these strategies
Bearish has these
These are sl and these are profits to be taken
I’ll try and put up a summary page 🙂
Hi, the graphs under the greek section are not visible anymore.
Hi, I wanted to convey that images under “Welcome back to the Greeks” are not visible. Only the Zerodha logo is visible. Please look into it.
Thanks!
I will do, meanwhile can you please try and use another browser to check if it is loading? Thanks.
Hi Karthik
Instead of 2:1, can 3:1 call ratio back spread be implemented. I checked the scenario and it seems to work- atleast theoretically on paper. Only that Breakeven point for HS will be ‘HS+Max Loss/2’ instead of ‘HS+Max Loss’ in case of 2:1 spread.
What other implications might there be?
The payoff will remain the same, Harsh.
SIt the graphs in the “Welcome back the greeks” section are not visible kindly update that.
Will check this. Meanwhile, can you try using another browser?
Benefitting a lot. Thank you.
Please put comments in a downloadable PDF for all modules.
Happy learning, Shiv 🙂
Dear Karthick Sir,
Good Mrng. In this strategy while calculating the Pay-offs., Whn the Market expires in the Lower strike or below., we havent taken Intrinsic Value of the Higher strikes., but in case of Market expiring in the Middle of the breakeven or slightly above we have taken the Intrinsic Value of the Higher strikes..(Plz refer the Scenario 5). please share some inputs on that.
Please do check the excel, all scenarios are covered.
Hi karthick sir, What is the difference between ratio spread and Ratio back spread ?
They are similar, not much difference.
sir i have some confusion in this strategy only . whenever i think to execute this strategy i always find the spread is narrow and premiums are higher like in banknifty spread is of 200- 300 and credit is received around 500 when i figure out the max loss it always show in minus for instance for max loss i substract credit from spread in this case 200- 500 it is – 300 . sir plz clarify .
Satish, hence ensures that other variables are also in your favour, like volatility and time. Spreads can be tight, but if these things are in your favor, then the odds of being profitable on the trade is higher.
Have learnt alot from varsity and extremely grateful and thank you from all my heart giving free educations worth lakhs for free
I have been studying this very carefully and just found an error which might help others ….In the calculation table above the HS-IV after 7900 has not taken into correction the two lots, although the other parts are right, urge you to please check
Hey Varun, glad you liked the content and thanks for pointing that out. I’ll check the same.
Hi Karthik Rangappa.
I had a general doubt regarding the last three strategies (Bull call spread, Bull put spread, and call ratio back spread):
1. when I expect targets to hit in 5 days from the day I initiate the trade in first half of the series, does P&L calculation stays same as explained in scenario 1, 2, 3…?
I personally feel it won’t be same because from the knowledge I gained from your Option strategy module, the buyer’s P&L is just the appreciation in premiums and not Max( spot – strike, 0 ) i.e. Intrinsic value.
Also, when you say “You are at the start of the expiry series and you expect the move over the next 5 days”, does it implies I can initiate my position anywhere in between 1st and 15th of the expiry and wait 5 more days for my target?
Prashant, the Max( spot – strike, 0 ) i.e. Intrinsic value calculation is applicable only if you hold the positions till expiry. If you decide to close the position before expiry, then its the difference in your bus and sell value of the premium which your P&L. You can read this chapter for more info – https://zerodha.com/varsity/chapter/options-m2m-and-pl/
Yes, that’s right. You can initiate anytime with an expectation to see your target hit in the next 5 days.
Sir,
Please review the calculation sheet, since I doubt there’s some error
Sure, let me check. Where do you think is the issue?
Q- Can I apply call ration back spred strategy for month expiry how time decay work and does this strategy work for monthly expiry and also how theta works in this monthly and also guide for how many days is better to execute this strategy from expiry…! Thank you
Rushikesh, yes you can. In fact this chapter is explained keeping monthly expiry in perspective.
Hi! Amazing article!
I have something to ask- All the payoff graphs you have shown are considering that we will be holding our position till expiry. So no matter what, as long as
1. Our market outlook turns out to be true by expiry
2. Option Greeks and volatility favors us
I will be in profit/loss as per payoff. Right?
And to check payoff graph in series, I am using Sensibull. So is that fine or is there any other platform for these things?
Yes, thats right. All these strategies are basis the assumption that you hold to expiry. I’d recommend Sensibull, and clearly I’m biased towards it 🙂
Now at this point, I am done with option theory and these 3 strategies. So my question is, assuming I have understood the theory pretty well, how should I go for option trading. Like many people hardly hold positions till expiry. So, if I want to hold positions only for say 2-3 days or so the what should be my ideal steps. As a newbie, let me know even if it is good choice to go for this or should I first practice by holding positions till expiry.
I hope you get what I am trying to say…
You can experiment with USD INR options, the contract size is low and even if you lose, the loss wont be much. Get comfortable with the logistics, like how to place orders, limits, SL, baskets, margins, premiums etc. Once you do, start developing a point of view and identify trades. Good luck!
Thank you for such great advice!
I couldn’t get the point that when there is less time to expiry and volatility increase there is good chance that option will expire OTM so premium decrease. How can this be like that? If volatility is increased the chances of option contract to expire ITM are also high and hence increase in premium. In fact this is what I read in option theory module.
Chapter 19. Vega: Here is exact sentence from there- “Therefore irrespective of Calls or Puts when volatility increases, the option premiums have a higher chance to expire in the money. ”
Please correct me if I am wrong or missing some angle here!
But with less time to expiry, theta is acting rapidly. YOu need to consider that as well.
Thank you for filling gap!
Happy learning!
Hi Karthik,
Thanks for this strategy, I’ve calculated the net credit for the 200 spreads and 300 spreads, pls check and help me to understand
1. 200 spreads (ITM and OTM)
I’ve calculated this strategy in nifty for understanding, pls find the below data
Underlying Nifty
Spot Price 17311
Lower Strike (LS), Sell,ITM 17200
Higher Strike (HS), Buy, OTM 17400
Credit (LS) 311.45
Debit (HS) 367.9
Net Credit -56.45
with the 200 spreads difference the net credit is in negative, so in this case what should I do should I look for 300 spread?
2. 300 spreads(ITM and OTM)
Underlying Nifty
Spot Price 17320
Lower Strike (LS), Sell,ITM 17200
Higher Strike (HS), Buy, OTM 17500
Credit (LS) 318.85
Debit (HS) 296
Net Credit 22.85
3.so my understanding is before the initiating this strategy we need to calculate the net credit max profit and max loss, if the net credit is positive we can initiate the trade
4.If not then we need to look for the 300 points spread ? Correct me if I’m wrong
5.The Payoff calculation is upon the expiry, if my target is achieved, then my profit would be the difference the premium that I bought and the premium I received ? (is this correct)
3) Yes. Another thought is to initiate the trade slightly early in the series where the ATM premium is slightly higher. Of course, you need to evaluate the risk as well.
4) Yes
5) Absolutely.
Karthik, can you please elaborate this point “where the ATM premium is slightly higher.” that means we can buy the ATM and OTM combo ?
It means the ATM premium is high, hence you get to collect higher premium and therefore offset the purchase of OTMs with the premium received.
Got it karthik, thanks a lot 🙂
Sure! Happy learning.
Thank you so much for this education. I have a question on volatility please. Which volatility should I consider? The ones specific to the strikes we choose or the India VIX? Please clarify. (Have gone through the Greeks 3 times so far it still has to sit on my mind properly)
You can consider the strike-specific volatility, Shahul.
Thanks sir for this always best strategy . I am having some points to ask.
(i) In this article, it is mentioned that this strategy not works when your view of hitting target should be near to expiry. Why ? Is because of Theta ? As u said near to expiry theta effect is huge
(ii) Suppose on Monday, at the time of closing, my view is bullish for this week expiry then should I implement this strategy i.e., Slightly ITM and slightly OTM ?
(iii) If my view on particular month expiry is bullish then should I implement this strategy i.e., Slightly ITM and slightly OTM if I implement this in 1st half or in 2nd half
(iv) If my target is achieved in particular day only then should I implement this strategy i.e., Slightly ITM and slightly OTM ?
1) Yes the premium decay is higher closer to expiry
2) If you are bullish, then maybe slightly OTM is fine
3) Again, slightly OTM is fine
4) If you have a target for the day, then naked option is better bet
Sir,
(i) What are the disadvantage of this strategy
(ii) If you know any trader that makes mistake while implementing this strategy. Please tell me that mistake so that I will avoid this.
(iii) Anything that u know: Trader forget while implementing this strategy. Pls tell me that
Thank you
I’ve discussed all that I know about this strategy in this chapter 🙂
Hi Karthik,
You said when there are few days to expiry and Volatility is expected to increase, there is a Possibility of OTM Strike to expire worthlessly,
But as per the previous module u have said when volatility is expected to increase Call option premium increase ,so can u explain why it is not applicable for when there is few days to expiry
Because while volatility tends to increase the premium, the time value declines thereby eroding the premiums.
The Call Ratio Back Spread is optimized and the spread is created with 300 points difference
The thought here is that the market will move up by about 6.25% i.e from 8000 to 8500. So considering the move and the time to expiry, the graphs above suggest –
Graph 1 (top left) and Graph 2 (top right) – You are at the start of the expiry series and you expect the move over the next 5 days (and 15 days in case of Graph 2), then a Call Ratio Spread with 7800 CE (ITM) and 8100 CE (OTM) is the most profitable wherein you would sell 7800 CE and buy 2 8100 CE. Do note – even though you would be right on the direction of movement, selecting other far OTM strikes call options tend to lose money.
Dear Sir,
Now Nifty is at 16200. What should be the strike selection in relation to the call ratio back spread?
Ashutosh, you can consider strikes with 200-300 points difference.
Thank you so much Karthik Ji. We all are grateful to you for such brilliant educational and selfless service. You are awesome.
You have mentioned various other strategies like box, butterfly, strip, color etc.. Where are they?
I can not thank you enough for your great service. Hats off and may God shower His blessings on you and yours.
What else you are planning? “ये दिल मांगे मोर”!🙂🙏
Thanks for the super kind words 🙏.
I’ve covered most of the strategies in this module itself. Will try and do butterflies soon 🙂
“increase in volatility when there are few days to expiry enhances the possibility of the option to expiry OTM, hence the premium decreases”
With increase in voltaility premium should increase, right? If there is more volatility there is a chance for option to expire ITM, right?
Yes, but then you should also consider the time to expiry in consideration.
Thanks a lot, Sir!🙏🙏
sir I have a question, the net credit is getting negative?
Then the spread and premium are not condusive. Try looking of other strikes.
then should i increase spread?
Try it, make a paper trade and see how it goes before you actually go ahead and take the trade!
ok thanks sir
Sure, happy reading 🙂
Resp. Sir;
Please tell me about the logistics for all the strategies. As far my understanding, if buying and selling is involved, sell comes first. Please comment.
Thanks for the lesson sir.
Can you please elaborate the logic behind why and how do these 5,10,15, expiry day graphs are generated?
For eg: If we take a trade in 1st half and it reaches target in 5 days, why does ITM strike making money and ATM & OTM strikes are -ve ? What is the logic behind it and how the profit is calculated?
Please help someone.
Nikhil, these graphs were developed using R software. I got these from a fellow trader and used these with his permission.
Dear Sir
Please explain strike selection wrt weekly expiry.
Similar approach as with monthly strikes, Ashutosh. Only the timeline shrinks.
sir can you please tell me what calculation in used in effect of time graphs or we just have to memorised them btw thankyou soo much sir for sharing this knowledge with us
You can keep these as reference charts, Shubhashish.
Sir can you please tell me what is the difference between Bull call ratio spread and Bull Call ratio back spread. Because in Bull Call ratio spread we Buy 2 ATM or ITM Calls and Sell 1 OTM Call. And Bull Call ratio spread is Debit strategy.
The difference is mainly in terms of the number of positions you add to the leg, which kids of skews the payoff.
Hi Sir,
I couldn’t understand why we shouldn’t use bull call ratio spread in case of a moderately bullish scenario. I’m asking this because compared to Bull call spread(the one with 2 legs), the pay off chart in Sensibull shows less fall in premium if the underlying goes down in case of the 3 legged bull call ratio spread. (I have compared this on the same day, so assuming other factors haven’t changed)
Also in case a big gap down were to happen, it also serves as an insulation, compared to the 2 legged strategy. So is there a particular reason not to use this in a moderately bullish scenario. If I were to expect a 100 to 200 point move, can I use this strategy?
Thank You for answering all my questions. And your explanations are so good, that I couldn’t put it down.
So you need evaluate this from a cost perspective as well. A 3-legged strategy is always more expensive to the trader than a 2-legged one.
Thank You Sir. And one more request. I also read some chapters in your risk management and psychology. What I’m having a hard time understanding with these strategies is the real life scenario of journey from entry to exit. Of course the journey is not going to be smooth and is going be a roller coaster ride. So I kindly request you to add some chapters regarding this especially in relation to stop loss if you can or if you have already added something similar, please let me know.
Sure, Sathish. I’ll try and look into this.
Hi Karthik sir,
How do we apply these trades since the expiry is weekly(Nifty) now?
Everything remains the same, only the number of days shrink.
Page 40, Second Paragraph (1. Blue line…)
The graph says as volatility increases the net premium increases for the strategy favour then why in the end line it says ” I would be a bit hesitant to deploy this strategy at the start of series if volatility is on higher side”
(I mean it contradicts itself)
(ALSO THANKS FOR THE AMAZING FEEDBACK, I’M ABSOLUTELY THRILLED READING ALL THE CONTENT)
Let me recheck this, Himanshu.
Can do this strategy otm for monthly contracts? At almost 0 debit credit. If yes, explain
Sorry, can you post your query with more context?
Hi Karthick,
Thanks for providing the outstanding explanation.
It would be great if you can update the sheet with real market data to give a practical view.
Whenever I try to align with strategy nothing fits in, seems like the hypothetical values used in excel is the cause.
Would be really helpful if you can help to update the sheet either for nifty or BN for one lot only with current sopt price of BN – 40608 or Nifty – 17359, I have tried but it always shows something difference than expected….
Thanks
Lalit, it will be tough for me to update the sheet regularly. The objective here was to ensure the subject is clearly explained, using which the readers can apply the concept to any market condition.
Hi there! So, it’s opposite of Bull Call Ratio Spread where one buys one ITM Call and Sells two OTM Calls. Am I right?
Yup, thats right.
How much capital is required for the implementation of this strategy ( ex. 1 lot of otm ce buy , 1 lot of slight otm ce buy and 1 itm ce sell )
Margins keep changing, Shubham. You can check the latest margins here – https://zerodha.com/margin-calculator/SPAN/
Sir,
In the option strategy module, I have learnt till “Call ratio back spread” and found that the strategies (that I learnt till date) are all based on expiry. Now, I would like to know the below:
(i) Whether this strategies can be applied similarly with square-off before expiry too in terms of premium pay off?
(ii) If not, is there any strategies that are well know for square off before expiry?
(iii) We have seen few strategies where “Net credit” is there. That means it should similarly block margin like ones for writing options and protocols will also follow similarly. Please confirm.
(iv) In case of these spread strategies/ multiple option bookings (sell & buy), during the expiry does it still have to be settled physically or is it cash settled. As per you have mentioned in one area, I guess this should be cash settled. Kindly confirm.
1) Yes, you can sq off before expiry but your P&L will be slightly different
2) All these strategies can also be used for squaring off before expiry.
3) The overall margins will reduce a bit
4) Yes, all stock options that are ITM will be settled physically, unless the two ITM options net off against each other.
Hi sir,
But to gain profit in the strategy, we need a way too big upside movement like more than 150 points, isn’t the probability way too low and even then how will we profit as our sold CE premium will also increase which will also give us loss.
What do you suggest, is this strategy a good one? Or bear call ladder is better. Isn’t it better to trade a long straddle instead of this as there is unlimited profit in both the side.
Also should we execute this strategy on expiry day or not?
Please confirm sir
So with options, you can’t tag a strategy as good or bad. They are all unique and find their use under different market circumstances. You just need to constantly evaluate the opportunities based on Greeks and premium and intuitively develop the thought of figuring out which strategy to apply under which market condition.
Why would you be a bit hesitant to deploy this strategy at the start of the series if the volatility is on the higher side? Is this a typo in the above text. If not please help me to understand.
Its just that the premiums will be on the higher side if the volatility is high.
“Blue Line – This line suggests that an increase in volatility when there is ample time to expiry (30 days) isbeneficial for the Call ratio back spread. As we can see the strategy payoff increases from -67 to +43 when the volatility increase from 15% to 30%. this means that when there is ample time to expiry, besides being right on the direction of stock/index you also need to have a view on volatility. For this reason, even though I’m bullish on the stock, I would be a bit hesitant to deploy this strategy at the start of the series if the volatility is on the higher side.”
this is line from effects of greek (volatility), my doubt is if if volatility is higher, then net strategy premium will also be higher, and as you said it will be beneficial for strategy, as max loss and upper breakeven will be smaller, but then you said you would be bit hesitant to initiate trade if volatility is on higher side. please explain.
i think if volatility is on higher side then we should enter the trade.
How are the P&L graphs vs Strike graphs for various target hit days is generated? Any tool which can generate these graphs?
These graphs were generated using R softwrare, Jayesh.
Hii Mr. Karthik, Thanks for all your effort for making it easy to understand.
I’ve one doubt, in this chapter you’ve considered 30 days as days for option expiry, bcos back in those days only monthly F&O expiry was available. But since, currently we’ve weekly expiry i.e. 4 expiry sessions per month. How should we work upon selection of strikes ?
And also, what should be the “Time for expiry” defined as ? Will it be 7 days or 14 or 21 days ?
Please clarify.
Vaishak, the concepts remain the same…selection of strikes (OTM, ATM, ITM) still would depends on the movement in the underlying that you expect plus the time to expiry, and of course the volatility. Its just that, the timelines shrink with weekly expiry.
The Call Ratio Back Strategy is exciting but I wonder why it doesn’t work in stocks? I used Sensibull Strategy Builder just recently to get a more practical overview of how the strategy works.
I found some very crucial data points and I’d like to share as well as confirm if we are on the same page.
1. I found that the strategy is a net debit for all the stocks (I studied it on RIL, Tata Motors, LT, Tata Consumer, HDFC Bank, Adani Ports and a few more).
2. The strategy is still very good as it limits the downside risk in a stock position. A big loss is only expected to be booked if the stock doesn’t move at all.
3. I’d still upvote the strategy as it has, though theoretically, unlimited upside potential.
There’s only one question confusing my ming regarding this strategy.
Why is it better for an index position?
And can it be used in a highly volatile environment?
1) Most of the times, depends on the premium, which in turn depends on the volatility.
2) Yes, as seen by the pay off charts
3) Sure 🙂
sir all this strategy works if i hold the contracts till end of the expiry but what if i just want to trade option premiums. will these strategy work.
The P&L discussed here is keeping expiry in perspective. Your P&L will be slightly different if you do not hold to expiry. You can visualize the P&L on Sesibull I guess.
Hello sir,
IN this chapter you mentioned one example of using ‘call ratio back spread’ for 7600-7800 strikes for respective premiums of 201 and 78*2 which equals to 45 net credit and spread you used is 200. In imaginary conditions this can be possible but i investigated many strike combinations of slightly ITM and slightly OTM strikes for this strategy but nothing seems to work since in real life example of current nifty strikes one can not find ITM and OTM combinations with positive net credit. Listed below are few strikes of nifty.
Nifty spot = 20930
20700 premium = 445
20800 premium = 375
20900 premium = 310
21000 premium = 251
21100 premium = 200
21200 premium = 156
These are few examples of current premiums. I calculated net credit using 200 and even 300 spread but net credit is always negative. For example 445-251*2 = -57. Sir is there any way we can find strike combination for this strategy with positive net credit.
Thanks in advance.
Actually you can use all of this and play around on Sensibull platform, Rajbir. That kind of makes it easy to visualize.