
11.1 – Hedging, what is it?
One of the most important and practical applications of Futures is ‘Hedging’. In the event of any adverse market movements, hedging is a simple work around to protect your trading positions from making a loss. Let me to attempt giving you an analogy to help you understand what hedging really is.
Imagine you have a small bit of vacant barren land just outside your house, instead of seeing it lie vacant and barren you decide to lawn the entire plot and plant few nice flowering plants. You nurture the little garden, water it regularly, and watch it grow. Eventually your efforts are paid off and the lawn grows lush green and the flowers finally start to blossom. As the plants grow and flowers start to bloom it starts to attract attention of the wrong kind. Soon you realize your little garden has become a hot destination for a few stray cows. You notice these stray cows merrily gazing away the grass and spoiling the nice flowers. You are really annoyed with this and decide to protect your little garden? A simple work around is what you have in mind – you erect a fence (maybe a wooden hedge) around the garden to prevent the cows from entering your garden. This little work around ensures your garden stays protected and also lets your garden flourish.
Let us now correlate this analogy to the markets –
- Imagine you nurture a portfolio by picking each stock after careful analysis. Slowly you invest a sizable corpus in your portfolio. This is equivalent to the garden you grow
- At some point after your money is invested in the markets you realize that the markets may soon enter a turbulent phase which would result in portfolio losses. This is equivalent to the stray cow grazing your lawn and spoiling your flower plants
- To prevent your market positions from losing money you construct a portfolio hedge by employing futures. This is equivalent to erecting a fence (wooden hedge) around your garden
I hope the above analogy gave you got a fair sense of what ‘hedging’ is all about. Like I had mentioned earlier, hedging is a technique to ensure your position in the market is not affected by any adverse movements. Please don’t be under the impression that hedging is done only to protect a portfolio of stocks, in fact you can employ a hedge to protect individual stock positions, albeit with some restrictions.
11.2 – Hedge – But why?
A common question that gets asked frequently when one discusses about hedging is why really hedge a position? Imagine this – A trader or an investor has a stock which he has purchased at Rs.100. Now he feels the market is likely to decline and so would his stock. Given this, he can choose to do one of the following –
- Take no action and let his stock decline with a hope it will eventually bounce back
- Sell the stock and hope to buy it back later at a lower price
- Hedge the position
Firstly let us understand what really happens when the trader decides not to hedge. Imagine the stock you invested declines from Rs.100 to let us say Rs.75. We will also assume eventually as time passes by the stock will bounce back to Rs.100. So the point here is when the stock eventually moves back to its original price, why should one really hedge?
Well, you would agree the drop from Rs.100/- to Rs.75/- is a 25% drop. However when the stock has to move back from Rs.75/- to Rs.100/- it is no longer a scale back of 25% instead it works out to that the stock has to move by 33.33% to reach the original investment value! This means when the stock drops it takes less effort do to so, but it requires extra efforts to scale back to the original value. Also, from my experience I can tell you stocks do not really go up that easily unless it is a raging bull market. Hence for this reason, whenever one anticipates a reasonably massive adverse movement in the market, it is always prudent to hedge the positions.
But what about the 2nd option ? Well, the 2nd option where the investor sells the position and buys back the same at a later stage requires one to time the market, which is not something easy to do. Besides when the trader transacts frequently, he will also not get the benefit of Long term capital tax. Needless to say, frequent transaction also incurs additional transactional fees.
For all these reasons, hedging makes sense as he is virtually insulates the position in the market and is therefore becomes indifferent to what really happens in the market. It is like taking vaccine shot against a virus. Hence when the trader hedges he can be rest assured the adverse movement in the market will not affect his position.
11.3 – Risk
Before we proceed to understand how we could hedge our positions in the market, I guess it is important to understand what is that we are trying to hedge. Quite obviously as you can imagine, we are hedging the risk, but what kind of risk?
When you buy the stock of a company you are essentially exposed to risk. In fact there are two types of risk – Systematic Risk and Unsystematic Risk. When you buy a stock or a stock future, you are automatically exposed to both these risks.
The stock can decline (resulting in losses for you) for many reasons. Reasons such as –
- Declining revenue
- Declining profit margins
- Higher financing cost
- High leverage
- Management misconduct
All these reasons represent a form of risk, in fact there could be many other similar reasons and this list can go on. However if you notice, there is one thing common to all these risks – they are all company specific risk. For example imagine you have an investable capital of Rs.100,000/-. You decide to invest this money in HCL Technologies Limited. Few months later HCL makes a statement that their revenues have declined. Quite obviously HCL stock price will decline. Which means you will lose money on your investment. However this news will not impact HCL’s competitor’s (Tech Mahindra or Mindtree) stock price. Likewise if the management is guilty of any misconduct, then Tech Mahindra’s stock price will go down and not its competitors. Clearly these risks which are specific to the company affect only the company in question and not others. Such risks are often called the “Unsystematic Risk”.
Unsystematic risk can be diversified, meaning instead of investing all the money in one company, you can choose to diversify and invest in 2-3 different companies (preferably from different sectors). When you do so, unsystematic risk is drastically reduced. Going back to the above example imagine instead of buying HCL for the entire capital, you decide to buy HCL for Rs.50,000/- and maybe Karnataka Bank Limited for the other Rs.50,000/-. Under such a circumstance, even if HCL stock price declines (owing to the unsystematic risk) the damage is only on half of the investment as the other half is invested in a different company. In fact instead of just two stocks you can have a 5 stock or 10 or maybe 20 stock portfolio. The higher the number of stocks in your portfolio, higher the diversification and therefore lesser the unsystematic risk.
This leads us to a very important question – how many stocks should a good portfolio have so that the unsystematic risk is completely diversified. Research has it that up to 21 stocks in the portfolio will have the required necessary diversification effect and anything beyond 21 stocks may not help much in diversification.
The graph below should give you a fair sense of how diversification works –
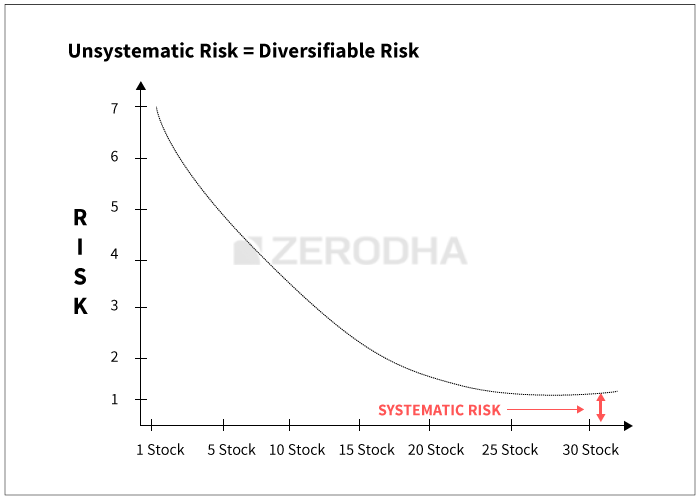
As you can notice from the graph above, the unsystematic risk drastically reduces when you diversify and add more stocks. However after about 20 stocks the unsystematic risk is not really diversifiable, this is evident as the graph starts to flatten out after 20 stocks. In fact the risk that remains even after diversification is called the “Systematic Risk”.
Systematic risk is the risk that is common to all stocks. These are usually the macroeconomic risks which tend to affect the whole market. Example of systematic risk include –
- De-growth in GDP
- Interest rate tightening
- Inflation
- Fiscal deficit
- Geo political risk
Of course the list can go on but I suppose you got a fair idea of what constitutes systematic risk. Systematic risk affects all stocks. So assuming you have a well diversified 20 stocks portfolio, a de-growth in GDP will certainly affect all 20 stocks and hence they are all likely to decline. Systematic risk is inherent in the system and it cannot really be diversified. However systematic risk can be ‘hedged’. So when we are talking about hedging, do bear in mind that it is not the same as diversification.
Remember, we diversify to minimize unsystematic risk and we hedge to minimize systematic risk.
11.4 – Hedging a single stock position
We will first talk about hedging a single stock future as it is relatively simple and straight forward to implement. We will also understand its limitation and then proceed to understand how to hedge a portfolio of stocks.
Imagine you have bought 250 shares of Infosys at Rs.2,284/- per share. This works out to an investment of Rs.571,000/-. Clearly you are ‘Long’ on Infosys in the spot market. After you initiated this position, you realize the quarterly results are expected soon. You are worried Infosys may announce a not so favorable set of numbers, as a result of which the stock price may decline considerably. To avoid making a loss in the spot market you decide to hedge the position.
In order to hedge the position in spot, we simply have to enter a counter position in the futures market. Since the position in the spot is ‘long’, we have to ‘short’ in the futures market.
Here are the short futures trade details –
Short Futures @ 2285/-
Lot size = 250
Contract Value = Rs.571,250/-
Now on one hand you are long on Infosys (in spot market) and on the other hand we are short on Infosys (in futures price), although at different prices. However the variation in price is not of concern as directionally we are ‘neutral’. You will shortly understand what this means.
After initiating this trade, let us arbitrarily imagine different price points for Infosys and see what will be the overall impact on the positions.
| Arbitrary Price | Long Spot P&L | Short Futures P&L | Net P&L |
|---|---|---|---|
| 2200 | 2200 – 2284 = – 84 | 2285 – 2200 = +85 | -84 + 85 = +1 |
| 2290 | 2290 – 2284 = +6 | 2285 – 2290 = -5 | +6 – 5 = +1 |
| 2500 | 2500 – 2284 = +216 | 2285 – 2500 = -215 | +216 – 215 = +1 |
The point to note here is – irrespective of where the price is headed (whether it increases or decreases) the position will neither make money nor lose money. It is as if the overall position is frozen. In fact the position becomes indifferent to the market, which is why we say when a position is hedged it stays ‘neutral’ to the overall market condition. As I had mentioned earlier, hedging single stock positions is very straight forward with no complications. We can use the stock’s futures contract to hedge the position. But to use the stocks futures position one must have the same number of shares as that of the lot size. If they vary, the P&L will vary and position will no longer be perfectly hedged. This leads to a few important questions –
- What if I have a position in a stock that does not have a futures contract? For example South Indian Bank does not have a futures contract, does that mean I cannot hedge a spot position in South Indian Bank?
- The example considered the spot position value was Rs.570,000/-, but what if I have relatively small positions – say Rs.50,000/- or Rs.100,000/- is it possible to hedge such positions?
In fact the answer to both these questions is not really straight forward. We will understand how and why shortly. For now we will proceed to understand how we can hedge multiple spot positions (usually a portfolio). In order to do so, we first need to understand something called as “Beta” of a stock.
11.5 – Understanding Beta (β)
Beta, denoted by the Greek symbol β, plays a very crucial concept in market finance as it finds its application in multiple aspects of market finance. I guess we are at a good stage to introduce beta, as it also finds its application in hedging portfolio of stocks.
In plain words Beta measures the sensitivity of the stock price with respect to the changes in the market, which means it helps us answer these kinds of questions –
- If market moves up by 2% tomorrow, what is the likely movement in stock XYZ?
- How risky (or volatile)is stock XYZ compared to market indices (Nifty, Sensex)?
- How risky is stock XYZ compared to stock ABC?
The beta of a stock can take any value greater or lower than zero. However, the beta of the market indices (Sensex and Nifty) is always +1. Now for example assume beta of BPCL is +0.7, the following things are implied –
- For every +1.0% increase in market, BPCL is expected to move up by 0.7%
- If market moves up by 1.5%, BPCL is expected to move up by 1.05%
- If market decreases by 1.0%, BPCL is expected to decline by 0.7%
- Because BPCL’s beta is less than the market beta (0.7% versus 1.0%) by 0.3%, it is believed that BPCL is 30% less risky than markets
- One can even say, BPCL relatively carries less systematic risk
- Assuming HPCL’s beta is 0.85%, then BPCL is believed to be less volatile compared HPCL, therefore less risky
The following table should help you get a perspective on how to interpret beta value for stock –
| If Beta of a stock is | Interpretation |
|---|---|
| Less than 0, Ex : -0.4 | A -ve sign indicates the stock price and markets move in the opposite direction. If market moves up by 1%, then –ve beta stock of -0.4 is expected to decline by 0.4% |
| Equal to 0 | It means the stock is independent of the market movement. The variation in the market is not likely to affect the movement in the stock. However, stocks with 0 beta is hard to find |
| Higher than 0 lesser than 1, Ex : 0.6 |
It means the stock and the market move in the same direction; however the stock is relatively less risky. A move of 1% in the market influences the stock to move up by 0.6%. These are generally called the low beta stocks. |
| Higher than 1, Ex : 1.2 | It means the stock moves in the same direction as the markets; however the stock tends to move 20% more than the market. Meaning, if the market increases by 1.0%, the stock is expected to go up by 1.2%. Likewise if the market declines by 1% the stock is expected to decline by 1.2%. These are generally called the high beta stocks. |
As of January 2015, here is the Beta value for a few blue chip stocks –
| Stock Name | Beta Value |
|---|---|
| ACC Limited | 1.22 |
| Axis Bank Limited | 1.40 |
| BPCL | 1.42 |
| Cipla | 0.59 |
| DLF | 1.86 |
| Infosys | 0.43 |
| LT | 1.43 |
| Maruti Suzuki | 0.95 |
| Reliance | 1.27 |
| SBI Limited | 1.58 |
11.6 – Calculating beta in MS Excel
You can easily calculate the beta value of any stock in excel by using a function called ‘=SLOPE’. Here is a step by step method to calculate the same; I have taken the example of TCS.
-
- Download the last 6 months daily close prices of Nifty and TCS. You can get this from the NSE website
- Calculate the daily return of both Nifty and TCS.
- Daily return = [Today Closing price / Previous day closing price]-1
- In a blank cell enter the slope function
- Format for the slope function is =SLOPE(known_y’s,known_x’s), where known_y’s is the array of daily return of TCS, and known_x’s is the array of daily returns of Nifty.
- TCS 6 month beta (3rd September 2014 to 3rd March 2015) works out to 0.62
You can refer to this excel sheet for the above calculation.
11.7 – Hedging a stock Portfolio
Let us now focus back to hedging a portfolio of stocks by employing Nifty futures. However before we proceed with this, you may have this question – why should we use Nifty Futures to hedge a portfolio? Why not something else?
Do recall there are 2 types of risk – systematic and unsystematic risk. When we have a diversified portfolio we are naturally minimizing the unsystematic risk. What is left after this is the systematic risk. As we know systematic risk is the risk associated with the markets, hence the best way to insulate against market risk is by employing an index which represents the market. Hence the Nifty futures come as a natural choice to hedge the systematic risk.
Assume I have Rs.800,000/- invested across the following stocks –
| Sl No | Stock Name | Stock Beta | Investment Amount |
|---|---|---|---|
| 01 | ACC Limited | 1.22 | Rs.30,000/- |
| 02 | Axis Bank Limited | 1.40 | Rs.125,000/- |
| 03 | BPCL | 1.42 | Rs.180,000/- |
| 04 | Cipla | 0.59 | Rs.65,000/- |
| 05 | DLF | 1.86 | Rs.100,000/- |
| 06 | Infosys | 0.43 | Rs.75,000/- |
| 07 | LT | 1.43 | Rs.85,000/- |
| 08 | Maruti Suzuki | 0.95 | Rs.140,000/- |
| Total | Rs.800,000/- | ||
Step 1 – Portfolio Beta
There are a few steps involved in hedging a stock portfolio. As the first step we need to calculate the overall “Portfolio Beta”.
-
-
- Portfolio beta is the sum of the “weighted beta of each stock”.
- Weighted beta is calculated by multiplying the individual stock beta with its respective weightage in the portfolio
- Weightage of each stock in the portfolio is calculated by dividing the sum invested in each stock by the total portfolio value
- For example, weightage of Axis Bank is 125,000/800,000 = 15.6%
- Hence the weighted beta of Axis Bank on the portfolio would be 15.6% * 1.4 = 0.21
-
The following table calculates the weighted beta of each stock in the portfolio –
| Sl No | Stock Name | Beta | Investment | Weight in Portfolio | Weighted Beta |
|---|---|---|---|---|---|
| 01 | ACC Limited | 1.22 | Rs.30,000/- | 3.8% | 0.046 |
| 02 | Axis Bank Limited | 1.40 | Rs.125,000/- | 15.6% | 0.219 |
| 03 | BPCL | 1.42 | Rs.180,000/- | 22.5% | 0.320 |
| 04 | Cipla | 0.59 | Rs.65,000/- | 8.1% | 0.048 |
| 05 | DLF | 1.86 | Rs.100,000/- | 12.5% | 0.233 |
| 06 | Infosys | 0.43 | Rs.75,000/- | 9.4% | 0.040 |
| 07 | LT | 1.43 | Rs.85,000/- | 10.6% | 0.152 |
| 08 | Maruti Suzuki | 0.95 | Rs.140,000/- | 17.5% | 0.166 |
| Total | Rs.800,000/- | 100% | 1.223 | ||
The sum of the weighted beta is the overall Portfolio Beta. For the portfolio above the beta happens to be 1.223. This means, if Nifty goes up by 1%, the portfolio as a whole is expected to go up by 1.223%. Likewise if Nifty goes down, the portfolio is expected to go down by 1.223%.
Step 2 – Calculate the hedge value
Hedge value is simply the product of the Portfolio Beta and the total portfolio investment
= 1.223 * 800,000
= 978,400/-
Remember this is a long only portfolio, where we have purchased these stocks in the spot market. We know in order to hedge we need to take a counter position in the futures markets. The hedge value suggests, to hedge a portfolio of Rs.800,000/- we need to short futures worth Rs.978,400/-. This should be quite intuitive as the portfolio is a ‘high beta portfolio’.
Step 3 – Calculate the number of lots required
At present Nifty futures is trading at 9025, and with the current lot size of 25, the contract value per lot works out to –
= 9025 * 25
= Rs.225,625/-
Hence the number of lots required to short Nifty Futures would be
= Hedge Value / Contract Value
= 978,400 / 225625
= 4.33
The calculation above suggests that, in order to perfectly hedge a portfolio of Rs.800,000/- with a beta of 1.223, one needs to short 4.33 lots of Nifty futures. Clearly we cannot short 4.33 lots as we can short either 4 or 5 lots, fractional lot sizes are not available.
If we choose to short 4 lots, we would be slightly under hedged. Likewise if we short 5 units we would be over hedged. In fact for this reason, we cannot always perfectly hedge a portfolio.
Now, let as assume after employing the hedge, Nifty in fact goes down by 500 points (or about 5.5%). With this we will calculate the effectiveness of the portfolio hedge. Just for the purpose of illustration, I will assume we can short 4.33 lots.
Nifty Position
Short initiated at – 9025
Decline in Value – 500 points
Nifty value – 8525
Number of lots – 4.33
P & L = 4.33 * 25 * 500 = Rs.54,125
The short position has gained Rs.54,125/-. We will look into what could have happened on the portfolio.
Portfolio Position
Portfolio Value = Rs.800,000/-
Portfolio Beta = 1.223
Decline in Market = 5.5%
Expected Decline in Portfolio = 5.5% * 1.233 = 6.78%
= 6.78% * 800000
= Rs. 54,240
Hence as you can see, one hand the Nifty short position has gained Rs.54,125 and on the other hand the long portfolio has lost Rs.54,240/-. As a net result, there is no loss or gain (please ignore the minor difference) in the net position in the market. The loss in portfolio is offset by the gain in the Nifty futures position.
With this, I hope you are now in a position to understand how you could hedge a portfolio of stocks. I would encourage you to replace 4.33 lots by either 4 or 5 lots and run the same exercise.
Finally before we wrap up this chapter, let us revisit two unanswered questions that we posted when we discussed hedging single stock positions. I will repost the same here for your convenience –
- What if I have a position in a stock that does not have a futures contract? For example South Indian Bank does not have a futures contract, does that mean I cannot hedge a spot position in South Indian Bank?
- The example considered, the spot position value was Rs.570,000/-, but what if I have relatively small positions – say Rs.50,000/- or Rs.100,000/- is it possible to hedge such positions?
Well, you can hedge stocks that do not have stock futures. For example assume you have Rs.500,000/- worth of South Indian Bank. All you need to do is multiply the stocks beta with the investment value to identify the hedge value. Assuming the stock has a beta of 0.75, the hedge value would be
500000*0.75
= 375,000/-
Once you arrive at this, directly divide the hedge value by the Nifty’s contract value to estimate the number of lots required (to short) in the futures market, and hence with this you can hedge the spot position safely.
As far as the 2nd question goes – no, you cannot hedge small positions whose value is relatively lower than the contract value of Nifty. However you can hedge such positions by employing options. We will discuss the same when we take up options.
Key takeaways from this chapter
-
- Hedging allows you to insulate your market position against any adverse movements in the market
- When you hedge your loss in the spot market it is offset by gains in the futures market
- There are two types of risk – systematic and unsystematic risk
- Systematic risk is risk specific to macroeconomic events. Systematic risk can be hedged. Systematic risk is common to all stocks
- Unsystematic risk is the risk associated with the company. This is unique to each company. Unsystematic risk cannot be hedge, but can be diversified
- Research suggests, beyond 21 stocks unsystematic risk cannot be diversified any further
- To hedge a single stock position in spot we simply have to take a counter position in the futures market. But the extent of spot value and futures value have to be same
- Market beta is always +1.0
- Beta measures the sensitivity of stock
- Stock with Beta of less than 1 is called low beta stock
- Stocks with Beta higher than 1 is called a high beta stock
- One can easily estimate the stock beta in MS Excel by employing the ‘Slope’ function
- To hedge a portfolio of stocks we need to follow the following steps
- Calculate individual stock beta
- Calculate individual weightage of each stock in the portfolio
- Estimate the weighted beta of each stock
- Sum up the weighted beta to get the portfolio beta
- Multiply the portfolio beta with Portfolio value to get the hedge value
- Divide the hedge value by Nifty Contract Value to get the number of lots
- Short the required number of lots in the futures market
- Remember a perfect hedge is difficult to construct, for this reason we are forced to either under hedge or over hedge.
Hello Sir,
Neat and clean explanation as always. Thanks for this stuff. I am eagerly waiting for the options module. 🙂
Thanks 🙂 The first chapter on option will be out soon!
Hello Karthik, I had one question how to place a stop loss when trading on indicators of super trend, and which indicator I can use with super trend to filter false signals
You could give MACD a try!
Hi Karthik. I have a few questions. Here’s the first one: With the single stock situation…when the stock price declines, shorting the stock futures makes sense, because of the (a) long-term capital tax benefit, (b) difficulty in timing the market and (c) savings on unnecessary transaction costs. But, when the stock price rises (which is how we’re hoping to make a profit), taking a contrary position in futures will neutralize the gains. So, at which points, should we enter and exit the contrary futures position to lock in the profits?
Hi Vidhyalakshmi,
Generally, Hedging is done when you expect news driven volatility in the market. eg. Before the union budget release, Before the annual reports etc. Once you sense that the volatility is done and news is discounted in the price, you can unhedge them again.
Absolutely, I would agree with you.
Can I not accomplish the same objective more simply by exiting my spot position and getting back in when I think that the volatility is done?
What is the point of hedging – it is again anyway about timing 🙂
Hmm, you can if you know when to initiate and enter back into the position.
Nice Jagdeesh 🙂
For the hedge to be effective you need to ensure your view on markets is reasonable. If you initiate a hedge and the market falls then the hedge works in your favor…else if the market goes up you obviously will not lose money but you will certainly not benefit from the market raise. For this reason, before you hedge make sure you are ready for this trade off. For example we are now looking at a possibility of a US fed rate increase. If that happens markets may react and tank a bit further. So at this stage you need to decide your stance – do you want to take the risk or insulate yourself. Do remember this is a event based hedge so as Jagadesh mentioned remove the hedge once the event is through.
Thank you very much, Jagdeesh, Karthik! I just have a couple of more questions. (1.) You mentioned earlier that the Nifty sort of eliminates unsystematic risk; so rather than go through the trouble of picking a diversified portfolio of individual stocks, is it okay to just buy NiftyBees…which would also make calculations for the hedge value a lot simpler? (2.) I’ve started trading index futures recently (with decent success thanks to you!) and I was wondering if my calculation of support and resistance levels should be based on the particular Nifty future (usually far month) or the current Nifty index?
Glad to know about the success bit 🙂
Anyway, it does make sense to pick up Niftybees…it automatically represents a diversified portfolio. However do remember the performance of the Niftybees will be just as much as the market (obviously). Also for S&R calculation, I would advice you so that on the Nifty Index as opposed to far month contract.
Okay, last two questions 🙂 (1) The predictive analysis (PA) column in Pi…can we use it as a confirmation of our directional view of a future…how often does it predict the price on the right side? (2) The site says that the predictive analysis column is only activated in the last 30 mins. But that’s not the case. In fact, the PA price is adjusted as the day progresses. Has there been a change in the way the feature was originally designed to be used?
The PA column on Pi just tries to predict the closing prices for the day (which is the weighted average of the last 30 mins)….even though the PA columns is functional, it makes sense to look at it for the last 30 mins…so dont use this as a confirmation for your directional. Regarding the accuracy bit, I dont think I can comment as I don’t use this feature myself…but I’m certain it gives out a good ballpark on the closing values. Also, please feel free to ask as many questions as you want, there is no restriction on that 🙂
Dear Sir,
Just wish to thank you and team Zerodha for making such a wonderful platform where everyone can learn stock market in simple/easy to understand manner.
Thanks Nilesh 🙂