11.1 – The Valuation Ratio
Valuation, in general, is the estimate of the ‘worth’ of something. In the context of investments, ‘something’ refers to the price of a stock. When making an investment decision, irrespective of how attractive the business appears, what matters finally is the business’s valuation. Valuations dictate the price you pay to acquire a business. Sometimes, a mediocre business at a ridiculously cheap valuation may be a great investment option instead of an exciting business with an extremely high valuation.
The valuation ratios help us develop a sense of how the market participants value the stock price. These ratios help us understand the attractiveness of the stock price from an investment perspective. The point of valuation ratios is to compare the price of a stock viz a viz the benefits of owning it. Like all the other ratios we had looked at, a company’s valuation ratios should be evaluated alongside the company’s competitors.

Valuation ratios are usually computed as a ratio of the company’s share price to an aspect of its financial performance. We will be looking at the following three important valuation ratios:
- Price to Sales (P/S) Ratio
- Price to Book Value (P/BV) Ratio and
- Price to Earnings (P/E) Ratio
Continuing with the Amara Raja Batteries Limited (ARBL) example, let us implement these ratios to see how ARBL fares. The stock price of ARBL is a vital input used to calculate the valuation ratios. As I write this chapter on 28th of Oct 2014, ARBL trades at Rs.661 per share.
We also need the total number of shares outstanding in ARBL to calculate the above ratios. If you recollect, we have calculated the same in chapter 6. The total number of shares outstanding is 17,08,12,500 or 17.081Crs
Price to Sales (P/S) Ratio
In many cases, investors may use sales instead of earnings to value their investments. The earnings figure may not be true as some companies might be experiencing a cyclical low in their earning cycle. Additionally, due to some accounting rules, a profitable company may seem to have no earnings at all, due to the huge write-offs applicable to that industry. So, investors would prefer to use this ratio. This ratio compares the stock price of the company with the company’s sales per share. The formula to calculate the P/S ratio is:
Price to sales ratio = Current Share Price / Sales per Share
Let us calculate the same for ARBL. We will take up the denominator first:
Sales per share = Total Revenues / Total number of shares
We know from ARBL’s P&L statement:
Total Revenue = Rs.3482 Cr
Number of Shares = 17.081 Cr
Sales per share = 3482 / 17.081
Therefore the Sales per share = Rs. 203.86
This means for every share outstanding, ARBL does Rs.203.86 worth of sales.
Price to Sales Ratio = 661 / 203.86
= 3.24x or 3.24 times
A P/S ratio of 3.24 times indicates that, for every Rs.1 of sales, the stock is valued Rs.3.24 times higher. Obviously, the higher the P/S ratio, the higher is the valuation of the firm. One has to compare the P/S ratio with its competitors to get a fair sense of how expensive or cheap the stock is.
Here is something that you need to remember while calculating the P/S ratio. Assume there are two companies (Company A and Company B) selling the same product. Both companies generate a revenue of Rs.1000/-each. However, Company A retains Rs.250 as PAT and Company B retains Rs.150 as PAT. In this case, Company A has a profit margin of 25% versus Company B’s, which has a 15% profit margin. Hence, Company A’s sales are more valuable than Company B. Hence, if Company A is trading at a higher P/S. The valuation may be justified because every rupee of sales Company A generates, a higher profit is retained.
Whenever you feel a particular company is trading at a higher valuation from the P/S ratio perspective, do remember to check the profit margin for cues.
Price to Book Value (P/BV) Ratio
Before we understand the Price to Book Value ratio, we need to understand the term ‘Book Value’ means.
Consider a situation where the company has to close down its business and liquidate all its assets. What is the minimum value the company receives upon liquidation? The answer to this lies in the “Book Value” of the firm.
The “Book Value” of a firm is simply the amount of money left on the table after the company pays off its obligations. Consider the book value as the salvage value of the company. Suppose the book value of a company is Rs.200Crs, then this is the amount of money the company can expect to receive after it sells everything and settles its debts. Usually, the book value is expressed on a per-share basis. For example, if the book value per share is Rs.60, then Rs.60 per share is what the shareholder can expect if the company decides to liquidate. The ‘Book Value’ (BV) can be calculated as follows:
BV = [Share Capital + Reserves (excluding revaluation reserves) / Total Number of shares]
Let us calculate the same for ARBL:
From ARBL’s balance sheet, we know:
Share Capital = Rs.17.1 Crs
Reserves = Rs.1345.6 Crs
Revaluation Reserves = 0
Number of shares: 17.081
Hence the Book Value per share = [17.1+1345.6 – 0] / 17.081
= Rs.79.8 per share
This means if ARBL were to liquidate all its assets and pay off its debt, Rs.79.8 per shares is what the shareholders can expect.
Moving ahead, if we divide the stock’s current market price by the book value per share, we will get the price to the firm’s book value. The P/BV indicates how many times the stock is trading over and above the firm’s book value. Clearly, the higher the ratio, the more expensive the stock is.
Let us calculate this for ARBL. We know:
The stock price of ARBL = Rs.661 per share
BV of ARBL = 79.8 per share
P/BV = 661/79.8
= 8.3x or 8.3 times
This means ARBL is trading over 8.3 times its book value.
A high ratio could indicate that the firm is overvalued relative to the company’s equity/ book value. A low ratio could indicate the company is undervalued relative to the equity/ book value.
Price to Earning (P/E) Ratio
The Price to Earnings ratio is perhaps the most popular financial ratio. Everybody likes to check the P/E of a stock. Because of the popularity, the P/E ratio enjoys, it is often considered the ‘financial ratio superstar’.
The P/E of a stock is calculated by dividing the current stock price by the Earning Per Share (EPS). Before we proceed to understand the PE ratio, let us understand what “Earnings per Share” (EPS) stands for.
EPS measures the profitability of a company on a per-share basis. For example, assume a certain company with 1000 shares outstanding generates a profit of Rs.200000/-. Then the earnings on a per-share basis would be:
=200000 / 1000
= Rs.200 per share.
Hence the EPS gives us a sense of the profits generated on a per-share basis. Clearly, higher the EPS, better it is for its shareholders.
If you divide the current market price with EPS, we get the Price to Earnings ratio. The P/E ratio measures the market participants’ willingness to pay for the stock, for every rupee of profit that the company generates. For example, if the P/E of a certain firm is 15, it simply means that the company earns the market participants for every unit of profit the company earns, the market participants are willing to pay 15 times. Higher the P/E, more expensive is the stock.
Let us calculate the P/E for ARBL. We know from its annual report –
PAT = Rs.367Crs
Total Number of Shares = 17.081 Cr
EPS = PAT / Total Number of shares
= 367 / 17.081
= Rs.21.49
Current Market Price of ARBL = 661
Hence P/E = 661 / 21.49
= 30.76 times
This means for every unit of profit generated by ARBL; the market participants are willing to pay Rs.30.76 to acquire the share.
Now assume, ARBL’s price jumps to Rs.750 while the EPS remains at Rs.21.49, the new P/E would be:
= 750/21.49
= 34.9 times
While the EPS stayed flat at Rs.21.49 per share, the stock’s P/E jumped. Why do you think this happened?
Clearly, the P/E Ratio jumped because of the increase in the stock price as we know the company’s stock price increases when the expectations from the company increase.
Remember, P/E Ratio is calculated with ‘earnings’ in its denominator. While looking at the P/E ratio, do remember the following key points:
- P/E indicates how expensive or cheap the stock is trading at. Never buy stocks that are trading at high valuations. Personally, I wouldn’t say I like to buy stocks that are trading beyond 25 or at the most 30 times its earnings, irrespective of the company and the sector it belongs to
- The denominator in P/E ratio is the ‘Earnings’, and the earnings can be manipulated.
- Make sure the company is not changing its accounting policy too often – this is one way the company tries to manipulate its earnings.
- Pay attention to the way depreciation is treated. Provision for lesser depreciation can boost earnings.
- If the company’s earnings are increasing but not its cash flows and sales, something is clearly not right.
11.2 – The Index Valuation
Like a stock, the stock market indices such as the BSE Sensex and the CNX Nifty 50 have their valuations measured by the P/E, P/B and Dividend Yield ratios. The stock exchanges usually publish the Index valuation daily. The index valuations give us a sense of how cheap or expensive the market is trading at. To calculate the CNX Nifty 50 P/E ratio, the National Stock Exchange combines the market capitalization for all the 50 stocks and divides that amount by the combined earnings for all the 50 stocks. Tracking the Index P/E ratio gives a sense of the market’s current state as perceived by the market participants. Here is the historical chart of Nifty 50 P/E ratio* –
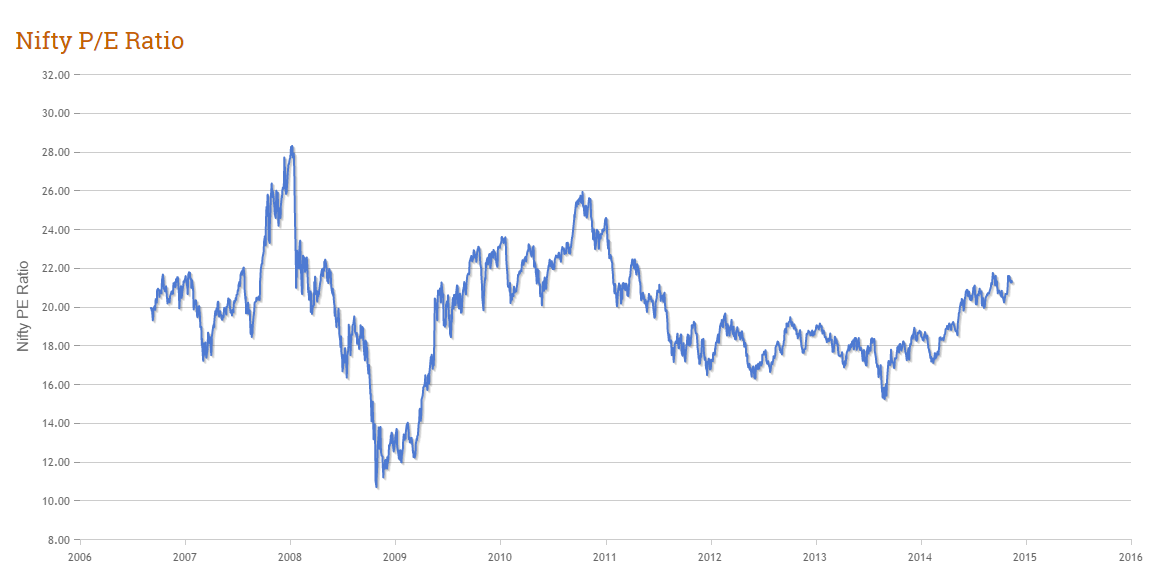
* Source – Creytheon
From the P/E chart above, we can make a few important observations –
- The peak Index valuation was 28x (early 2008), what followed this was a major crash in the Indian markets
- The corrections drove the valuation down to almost 11x (late 2008, early 2009). This was the lowest valuation the Indian market had witnessed in the recent past
- Usually the Indian Indices P/E ratio ranges between 16x to 20x, with an average of 18x
- As of today (2014) we are trading around 22x, which is above the average P/E ratio
Based on these observations, the following conclusions can be made –
- One has to be cautious while investing in stocks when the market’s P/E valuations are above 22x
- Historically the best time to invest in the markets is when the valuations are around 16x or below.
One can easily find out the Index P/E valuation daily by visiting the National Stock Exchange (NSE) website.
On NSE’s home page click on Products > Indices > Historical Data > P/E, P/B & Div > Search
In the search field, enter today’s date, and you will get the latest P/E valuation of the market. Do note; the NSE updates this information around 6:00 PM every day.
Here is a snapshot of the search result –

Clearly, as of today (13th Nov 2014), the Indian market is trading close to the higher end of the P/E range; history suggests that we need to be cautious while taking investment decisions at this level.
Key takeaways from this chapter
- Valuation, in general, is the estimate of the ‘worth’ of something.
- Valuation ratios involve inputs from both the P&L statement and the Balance Sheet.
- The Price to Sales ratio compares the company’s stock price with the company’s sales per share.
- Sales per share is simply the Sales divided by the Number of shares.
- Sales of a company with a higher profit margin are more valuable than the sales of a company with lower profit margins.
- If a company is going bankrupt, the ‘Book Value’ of a firm is simply the amount of money left on the table after the company pays off its obligations.
- Book value is usually expressed on a per-share basis.
- The Price/BV indicates how many times the stock price is trading over and above the firm’s book value.
- EPS measures the profitability of a company on a per-share basis
- The P/E ratio indicates market participants’ willingness to pay for a stock, keeping the company’s earnings in perspective.
- One has to be cautious about earning manipulation while evaluating the P/E ratio.
- The Indices have a valuation which can be measured by the P/E, P/B or Dividend Yield ratio.
- It is advisable to exercise caution when the Index is trading at a valuation of 22x or above.
- A valuation gets attractive when the index is trading at 16x or below.
- NSE publishes the index valuations on their website daily
Just out of curiosity, checked P/E multiples for Auto sector for past 6 months. It’s showing whopping figures of around 46-47. Does this mean that the sector is overheated ?
Also, can you please clarify the meaning of dividend yield & how to analyse/interpret this no.?
You need to view the PE of 46-47 wrt to its historical PEs to get a sense of how cheap or expensive the current PE is. I have explained about Index PE’s here in section 11.2, maybe it could be of help.
Hi, how to calculate the Enterprise value? And please add valuation ratios related to EV.
I’ve explained this in the DCF chapter.
Kathik, I assume Working capital and Net working capital are the same. In this module you have calculated Working capital as CA-CL. However many times I have seen that there are many variations used by people like NWC=(Cash+Inventory+Accounts receivables)-CL, some people say use certain percentage of cash, some completely exclude cash and liquid investments etc. Could you clarify on this?
Cash is most certainly a liquid asset, it should not be ignored. Stick to CA-CL to get a sense of the working capital situation of a company.
Hello Sir,
I really appreciate your efforts, willingness to educate retail investors in simple language. Tata Steel PE ratio is very low, around 5 to 6. Should, I consider this an investment opportunity? If yes, why other investors are not buying it and stock is at low price today?
P/E is just one of the many variables that help you understand the companies business. If it is a low PE, then there must be a reason for it. Request you to look at other things as well – revenue, operating margins, PBT, PAT, Debt, Leverage, ROE before making any investment decisions. Also, it is always good to compare it with its peers. Good luck.
Thanks Sir…I will check other information as suggested by you before taking any decision.
Great, good luck.
Dear Sir,
As I was analyzing some data, I observe that PE for tata steel as mentioned in rediff.com is 4.98 while it is mentioned as 11.44 on google finance web. EPS also varies. Would you please, guide what should be followed. EPS data also varies in both web. Also, would be great if you can elaborate forward PE.
Any financial ratio for a company can be calculated based on standalone numbers or consolidated numbers. Tata Steel’s standalone PE is 4.9x, while the consolidated PE is around 11.4x. Same goes with EPS. There is standalone and consolidated.
Forward PE requires you to estimate forward EPS. For example if a company has made Rs.500 this year and it has 100 shares outstanding in the market then its current EPS is Rs.5 per share. Going forward if you believe the same company will make a profit of Rs.600 in the next financial year, then the ‘Forward EPS’ will be Rs.6 per share.
Thank you very much sir, for explanation. I am fresh to the stock market and repeatedly reviewing Varsity contents. As I am reviewing things, questions are poping up. I hope you don’t mind.
Could you please elaborate on the P/B ratio, as to its relevance for different industries and specifically as to why it is preferably used for studying capital intensive industries or financial firms
This is a blog post on its own, but let me make a quick attempt –
Book Value = Total Shareholders Equity / Number of shares.
Total Shareholders Equity = Reserves (Which includes retained earnings) + Shareholders Equity. Reserves of the company is a solid measure of how cash rich the company is. So in a sense Book Value tells us the strength of the company from a ‘cash’ perspective.
Now industries such as capital intensive sectors and financial services are all highly leveraged..(they run on high debt)..so P/B in such circumstances gives a measure of the inherent strength of the company…note the P/B should be viewed along with other ratios to get a complete understanding of the business.
Sir, in the PE section, you mentioned that we should not buy shares trading at high valuations. Can you explain why you said so?
If valuations are high the obviously the stock price is high. If the stock price is high then there is no margin of safety. Hence one should buying stocks at high PE/valuations.
is nifty currently trading at high valuations?current PE ratio is 22.66.
Compared to the historical average PE of 18, yes we are at trading at slightly higher valuation.
I have a doubt regarding PE ratio, as stated above and as per theory it shows the willingness of an investor what he wants to pay for every unit of profit earned. So when an investor is wiling to pay higher amount isn’t it showing a good sign?? Why are we taking higher PE as caution when investors are willing to still buy at that point?
Is it because the price is increasing more in comparison to EPS???
Answered it earlier.
But then everything has a price, when it goes beyond a certain point its pure greed (or maybe foolishness). Hence too high a PE is not really desirable.
hi Karthik,
where can i find list of companies which is about to issue bonus/dividend ?
thanks in advance.
The decision to issue bonus / dividends are taken when the company’s management meet for their AMG, hence you need to keep track of companies conducting AGM and the outcome of the meeting. Check this – http://www.moneycontrol.com/company-facts/infosys/board-meetings/IT#IT
If we know the future eps of a company then how to calculate it’s share price..?
Suppose, If ABC FY16 eps is 3.8 and FY17 eps is 6.8 and current stock price is 60, then how can we know the share price of coming year?
There is nothing that will tell you the share price of the stock in the coming year, they are all just intelligent guesses 🙂
Estimating EPS will only give you a sense of current valuation.
Hi,sir
i want to read annual reports and check financial ratios of all sector’s stock.
Ill pick one stock from all sectors and check ratios and send mail
please check and correct it if it is wrong calculations
Regards
Suresh
Suresh – unfortunately my schedule will not permit me to go through individual sheets. If you have any specific query, please do post it here and I’ll be more than happy to share a response.
Hi Karthik,First Of All,Hats off to your efforts on putting all the possible contents of studying Stocks markets in Zerodha Varsity.
Can you let us know how to Calculate Forward PE,For Ex if you Take Pidlite Current PE is 45 and Forward PE is 29(have read this in a report) which looks Attractive,Is there a Simple to Calculate Forward PE as this seems to one of the Key valuation while entering a Quality Stock.
PE is calculated as a Current Price / EPS. If you divided current price over current year EPS, you get PE. Now you can forecast next year EPS (usually via a financial model)…divide this by current price and you get forward PE.
Can you please explain this statement with example-
“In many cases, investors may use sales instead of earnings to value their investments. The earnings figure may not be true as some companies might be experiencing a cyclical low in their earning cycle. Additionally due to some accounting rules, a profitable company may seem to have no earnings at all, due to the huge write offs applicable to that industry.”
Company like Symphony which manufactures air coolers may have a cyclical earnings. Months like December-Jan-Feb will be cyclical low as people wont be buying air coolers…but sales in months like April-May-June maybe high.
Apart from financial ratio analysis what other analysis can be done from this type of data or other data for a company? Two things which I was able to find out were Altman Z Score and logistic regression to assign credit score and probability of default respectively. Please suggest a reference which explains this in simple and lucid manner (like you do) as I am not having a background in finance.
The financial statements are best used to access the financial position of the company and arrive at the value of the business. Something like a DCF analysis would be a good output here. DCF is explained later in this module.
Apart from DCF analysis are there any other methods of analysis or scoring that you know of? I need this methods with their explanations. If you are aware of this please suggest a good reference.
Apart from DCF for valuations, there is the comparable method, ratios analysis, and statistical method. Not sure of a free resource that talks about these things.But you should check this – http://aswathdamodaran.blogspot.in/ , probably the best authority on Valuations.
On money control website for every stock there is mention of P/E and P/C on quote page adjacent to each other. I understand P/E is price to earning ratio. I find that some of the good value investment stocks (like TCS) the difference between these two ratios is very less, and difference high for stocks which may not be recommended based on their valuations (like Nestle).
Can you explain what is P/C?
P/C is Price/Cash Flow.
Higher the cash flow, the lower will be P/C, which is a good sign.
Sir,
I am looking for nifty chart of last 20 years, line chart, but it is difficult to find. Can you please tell me any website for the same?
Also can you upload excel file with formula for fundamental analysis, that you have mentioned in your modeule? Or may I request a small module for excel, how to use it for calculation? I tried to Google but it is not as simple as your modules. Your modules are very simple and easy to understand.
Check this – https://in.tradingview.com/
All the excel sheets are included in the chapter itself, feel free to download them. I’ve been thinking of a module on ‘Excel for Finance’, but guess it will be at a much later stage.
thank you so much for the website, its really nice.
i couldnt find excel sheets, can you please provide link or page no?
Thanks. I’m sorry the excel are not put up here, this is because the calculation are simple and its done straight in the narration itself.
i mean excel sheet in which formula is already added, so that i can just put values and get the data. no need to calculate everytime. can you upload such excel sheet?
Will try to so that sometime soon.
Hi Nithin,
Tata chemicals PAT 780.16 cr, Shares 254.82 cr, EPS is coming 3.06 , they are reporting 30.6, why so?
Regards,
MSP
Are you sure you’ve converted the numbers to crores? Request you to double check.
Hi Karthik,
Tata chemical numbers in balance sheet in cr only, i suppose, we needn’t to covert further.
Regards,
MSP
Here you go –
Tata Chem PAT = 780.16 Cr
Share Capital = 254.82 Cr
Face Value = 10
Number of shares = (254.82*10^7)/10
= 254820000
EPS = 780.16Cr/254820000
= 30.616
Hi Karthik,
Thanks, got it, my mistake.
Regards.
MSP
Welcome!
Hi,
While going through some article on Fundamental Analysis, they mention about PEG ratio, which is P/E divided by Growth.
Like to know how do we calculate the growth for the company, to derive the PEG ratio.
The numerator is PE and the denominator is ‘Annual Growth rate of EPS’.
Where can we find historical PE, PB ratios and DIV yield data for NSE stocks ? NSE website giving data only for Indices ?
Check out Ratestar – http://www.ratestar.in/company/JK-Paper-Ltd-132162
Hi Karthik,
This is with reference Sales/share Maruti
Maruti 2015-2016 Balance sheet mentions share capital 15.10 cr, Face value of Maruti is Rs.5, hence i diveided 15.10 cr by 5, which is giving value 3.02 cr, when i divide sales of 59083.cr sales by 3.02, i am getting value of 19564.07cr, which doesn’t seems to be correct.
Please suggest.
Regards,
MSP
I guess you have not converted the Crore amount properly. You are missing a step somewhere.
Hi Karthik,
Found , its my mistake, its 151 cr.
Thanks.
Regards,
MSP
Hi Karthik,
Maruti 2015-2016, consolidated balance sheet shows 151 cr share capital, is it possible company like Maruti has only 151 cr share capital ?
Regards,
MSP
Hi,
What can the preferable P/BV ratio be for a company?
No standard values for any financial metrics. You will have to look at each metrics in the backdrop of industry averages.
How to calculate industry average?
Am I have to add all companies total earnings PAT and divide it by by total outstanding shares of all companies to get industry AVERAGE EPS?
Depends on what average you need to calculate. If its earnings, then take the earnings of all companies and calculate the average. Check this with the company’s earning you are interested in. This will give you a sense.
How can I know what accounting principle has been followed by the company?
could you just give about accounting principles ?
And will company mention in the annual report about the write offs?
Of course, annual report is an exhaustive report and contains all the necessary information you’d need.
Hi,
How to Analyse Stock by PE X PB Ratio? What is the good level ( OverValued /UnderValued), how to compare the stock of different company with PE X PB Ratio?
Its best of you look at these ratios on a standalone basis. Each stock is different and you should compare it to the industry to get a sense on over valued and under valued level.
Karthik, just wanted to know if this is a good time to invest. The PE for the index is above 23.
Depends on your time frame….if you are investing for a very long time, it should not matter. However, if you are investing for a short time, I’m not sure if its a good time.
Can you ladvise where we can get historical earnings data for nifty index. (Not p/e availabe in nse site)
Not sure where index earnings are reported.
Sir, Can you please suggest me some books or materials to understand Macro Economics…
Thanks….
Look for this – Macroeconomics Simplified: Understanding Keynesian and Neo-classical Macroeconomic Systems.
sir 2nd book is not available in amazon.Neo-classical Macroeconomic Systems
Helllo sir,
It seems that yoiu are using craytheon.com for data….is it worth paying all that money. Is the data good?
I used it only for this article. So cant really comment 🙂
so from where do u get the data?…is there any free source on the net to get data for Indian companies?
Annual reports are the best source for corporate data.
The EPS given in the profit and loss statement is 21.51. Can we use that as well to calculate P/E ratio or we need to calculate from scratch like you did and got the number as 21.49 as EPS?
Thanks
You can certainly consider that, Jinal.
where can i find list of companies which is about issue dividend?
No place which consolidates this information, Hemanshi. I guess your best bet is Moneycontrol.
Right now nifty 50 P/E ratio is very high about 26.8 but P/B is moderate 3.5,is it time to exit from market, or still it’s a good opportunity as P/B ratio is lucrative…
Haha, I dont know Ritesh 🙂
Hi Kartik,
How did you calculate Number of shares: 17.081??. In the note 2 it is written as 17,08,12,500.
Number of shares = ShareCapital / Face vaue.
Why is revaluation reserve excluded from Book Value of Assets?
Hmm, I’m not sure, need to do some research on this.
The reason for not considering the revaluation reserve is that it consists the capitalised profits arising out of revaluation of assets nd liabilities which don’t comprise of real cash nd are not treated as free reserves because these are used in long term to set off the loss in value of assets ,that’s why Revaluation Reserve is not considered while calculating Shareholder’s Funds for P/BV Ratio.
Thanks for the information, Karan. That makes sense and saves me some research time 🙂
So recap reserve gains (or losses) can be used offset losses or gains? Do you recollect any recent examples of this?
The part where you explained what is book value you said “the amount of money the company can expect to receive after it sells everything and SETTLES ITS DEBTS” but in the formula no where did you mention deduction of debts. And shouldn’t the amount for which the assets are sold should be added. Can you please explain why so?
Thank you
Well, you do have a point. You can maybe reduce the debt from the numerator. Let me do some research around this.
I need to know why is there is so much difference between P/E ratio of KSCL (Kaveri Seed Company Ltd.) given by Zerodha (~42) and money control (~21.5). I checked a few other sources. The range of P/E ratio for KSCL is in the 20s. Can you explain what methodology Zerodha uses to calculate P/E ratios and why is there such a vast difference in this particular case?
We get these numbers from Smallcase and Smallcase use consolidated figures. Can you double check if you are comparing the consolidate numbers and not really standalone numbers?
Hi Karthik,
I have checked many sources (NDTV profit, economic times, value research, money control, edelweiss). All these sources show P/E ratio for KSCL between 21.5 to 24.5, with edelweiss specifically mentioning that it is based on consolidated numbers. Also, it is worth mentioning that none of the others have mentioned that it is based on standalone numbers.
I also did check Bloomberg which shows a P/E of ~42, the same as Zerodha is showing. But, I think that such a wide variation in numbers with both based on consolidated earnings is hardly reasonable. Can you please help me figure out what’s wrong here?
Thanks,
Hardeep
I get that, Hardeep. Here is what I’d suggest you do – pick up the latest annual report of this company, check the EPS and divide that number from the latest share price. You will get the PE. Make sure you take the consolidated number.
From Jan 2009 to Oct 2015, Lupin limited has been a very good investment but after that, its share price is constantly falling.
Imagine, going back in time in 2015, could we tell by looking at annual reports that the price would fall from that point? Which financial ratios of previous reports could prove that company would perform badly in future (now present) ?
No, that would have been a tough call. However, if you were tracking the macros surrounding the pharma sector, maybe you could have.
The number of shares in P/S ratio are publicly owned stocks or the overall stocks of the company ?
Its better to consider the overall number of shares. Gives you a more conservative estimate.
Sir, I have query regarding dividend yield. The dividend yield for ONGC (on 2 april 2018) as per Zerodha kite is 5.10 %, money control
is 3.36. Why there is so much difference.
I guess this could be a difference due to consolidated and standalone numbers.
Hi Karthik
I did the ratio analysis for the Auto LCV and HCV sector involving- Tata Motors, Eicher Motors, Ashok Leyland, Ford Motors and SML Isuzu. Eicher motors is quite ahead in all the 3 ratio analysis- profitability ratio, leverage ratio and operating ratios. However the P/E ratio (according to morningstar) is 42.8 which is of course very expensive. So i wanted to ask you, how do we move forward from here? Should we still go ahead and pick Eicher motors because the business and management is great, or should we pick a stock with average numbers like Ashok Leyland which is not so expensive.
Ideally, you should pick the one with great financials and management. If you think the PE is high, then do wait for a correction in the market, you will get opportunities to buy stocks at attractive prices. Do not compromise on your portfolio and money. Good luck and stay profitable.
Hi Karthik
Thanks a lot for that advice. 🙂
The next step that I am doing is equity research, and I have decided to pick Eicher Motors for that. When I am trying to see the growth in revenue and PAT, the data is not even. As in, I think there was a shift in the accounting standard? Because till 2014 the data is till December, and after that it’s till March. So when I am looking at the growth can I just straightway use the data, or should I make adjustments to it?
You need to compare this with same time period. But are you sure about this? All Indian companies operate on March to April financial year cycle.
I checked morning Star and money control both. They have data till 2014 for December, and then straight 2016 for March.
Hmm, need to check this in that case.
Greetings Sir!
Sir could you please let me know, why do we consider Total Revenue while calculating Sales per Share in case of Price to Sales Ratio.
Thank you
That gives you a good sense of the price of a share per unit of sales. However, you can even use Revenue from operations for this.
Sir, is it not better we always choose Operating Revenue? There could be a possibility that this ratio gets distorted because a company has other income as major part of its revenue.
Hmm, a company which has other income as a major is a dicey investment in the first place, I think 🙂
Yes sir. Thank you 🙂
Hello Sir,
(1) Do all these ratios (P/S, P/BV, and P/E Ratios) tell about overvaluation or undervaluation of a stock ONLY or tell something else too?
(2) If yes, then utility-wise or function-wise, what key differences are there among them?
(3) Which one is more useful and be used reliably to decide the same parameter i.e. Over/Under Valuation?
(Should we use P/E ratio, the financial ratio superstar, more often? I see P/S, P/BV ratios being mentioned and used less in scrip details).
1) Yes, these ratios talk about valuations for the given stock price and fundamentals
2) It gives you a sense of price wrt to various fundamental parameters
3) They all matter, if you ask me: 😉
Sir, I have query regarding EPS. Is the EPS publish only at end of each quarter and at end of financial year. ?
Roshan, as and when earning numbers are available, EPS numbers will be available.
Thanks sir, but when usually these numbers are available to investors . Is there any fixed time period like every quarter / annually like that.. regards.
No, Rohan. This depends on the company…there is no set calendar for quarterly result release.
Thanks sir..
Good morning sir, how / where I can get monthly EPS of companies. Thanks.
EPS is not updated on a monthly basis, gets updated when the quarterly results come out.
Thanks sir..
Hi sir thankyou so much for this great job..
What will we do if PE is negative like (-2). ??
PE cannot go negative, Kunal.
I found it easy to understand these ratios after going though all 3 chapters. However I think its little difficult to remember each and every individual ratio and effect of those ratios for a beginner person like me. So I wanted to what are some of main ratios (Very important) that we need to keep tab on ?
Each ratio is different, Omkar. Btw, no need to really remember these ratios. You can always Google for it 🙂
Hi Sir took ABRL its year 2018 ending p/e is 810/17.08=47.43 and quarterly mar 2018 p/e is 810/6.43=125.97 it difference because of eps & eps difference because of PAT.so in annual result 2018 PAT is 471.32 cr and quarter mar 2018 is 109.80 so my question is :(a)which p/e result is choose quarterly or annual basis. (b)is it any parameter for p/e annual between 0-30 and quarterly 100-300 assumed. (c)i took financial result from bse.com so there net profit is PAT and equity is number of share is right.is best to took financial result from use.com (d) why they have bast difference in p/e in quarterly and annual result which on choose to evaluate price.
a) You can consider annual or quarterly. If you are considering quarterly, look for projected EPS for future quarters
b) Not sure what exactly you mean by this. Can you provide more info?
c) I’d suggest you look for the data from the companies annual report or website
d) The company may have had a great year/quarter.
I am a client of Zerodha. please tell me how to calculate previous years P/E ratio of any stock. Is it related to market cap, then how to calculate previous years market cap.
For this, you need to look at the previous year’s price and divide it over the last year’s EPS.
Sir,
How to calculate previous years market cap of any stock.
For that you will need the outstanding shares of the previous year vs the daily closing price.
Please prepare a chapter on “How to evaluate Management”
Ok. Will try and do that.
Hey Karthik,
Are retained earnings reserves?
The company can opt to send this to reserves.
Thanks
sir,
sir what about
Enterprise Value to EBDITA Ratio?
Growth Adjusted Price to Earnings Ratio (PEG Ratio)?
I’ll probably have to include notes on these in a supplementary chapter. Will try and do that, Vaibhav.
Hello,
If we want to calculate the P/E of previous year then we have to take current price of stock, or last year price of stock?
You can take the current price and the lastest earning per share data.
Hey Karthik ! I have a question for you. Suppose the company is really liquidating and there are some revaluation reserves appearing in the reserves & surplus section. Now when the company liquidated it’s assets they receive an amount higher than the book value of assest (for say land). In such a case the revaluation reserves are realised in cash right ? Then shouldn’t we consider them while computing BV/share ?
Yes, but how do you discount for the circumstances under which these assets were liquidated? These are extreme situation right? This means the company is already messed up and all the proceeds are shared in order of the capital structure of the firm.
So what you are saying is the BV/share is just a nominal figure and in reality the shareholders are going to receive some other amount. Am I right ?
Not really, you divide the cash and cash equivalent by the number of outstanding shares. So it is a real deal 🙂
Thanks for the reply Karthik !
Welcome!
Hi Karthik Sir,
At investopedia I found book value per share = (total assets – total liabilities) / number of shares outstanding.
and Here book value = ( Share Cap. + Reserves ) / Total Number of Shares.
are both formula correct?
Thanks
– Rohan Singh
The Investopedia formula is generic and from a Balance Sheet perspective (which is also fine), but I have considered only the net worth (Share cap + reserves) for calculating the book value. Both are fine, depends on how specific your valuation criteria is.
Does retained earnings come under surplus for book value calculation?
Retained earnings flow into Reserves and Surplus, which is used for BV calculations.
Hey Karthik,
As of 13th Nov 2014, Nifty PE was around 22 and as of now (30 October 2018), Nifty PE is 24.
What’s your expert opinion to beginners like me about the prevailing Market Condition.
Does this long times takes for Market Correction or?
Thanks. 🙂
Rohan, I don’t really look too much into the index valuations. However, I think the correction has made some of the stock very attractive. If you are new, I’d suggest you start building a portfolio at these levels.
price to earning ratio of a business is 10, price to book value ratio of this business is 5,book value per share is 15 and outstanding number of shares are 10000, what would be the return on equity of this business ?
Here is the formula for you to quickly calculate –
ROE = PAT / Avg Shareholder Equity.
thank you dear karthik sir from bottom of heart for zerodha varsity. change my whole perception about market. thank you zerodha team.
Dr.Mehul, thanks so much for the kind words. Your appreciation means a lot to us. Happy learning!
Hi Karthik,
You said too make sure that the company is not changing its accounting policy too often to manipulate its earnings.
So how can we know if the compny is changing its accounting policy?
In the annual report, the company’s auditors issue something called as the Áuditor’s certificate, this will have the details.
Thank you.
Welcome, Ram!
Dear Sir, Please guide me as I’m not able to find the indicator for PE ratio or PB ratio on Kite under studies. is it available with any other name?
Nasim, these are fundamental indicators and are not available on Kite. However, you can check fundamental data by clicking on the widget, check this – https://zerodha.com/z-connect/tradezerodha/kite/kite-3-0-everything-just-got-better
Sir
Plz explain basic meaning of face value.
Manish, this is the notional value assigned to a share.
Hello Karthik,
Excellent work done on varsity. I have a doubt you said the best time to invest in the market is when the valuation is around 16x, I checked the historical data of Nifty 50 index and found that the last time the index reached that level was way back in 2013. Currently it is valued at 28 which is overvalued and all time high. But I dont think the index will reach 16 in near future 16 is too low . Don’t you think your advice of investing at 16 must be revised considering current market scenario. Also do you recommend investing at minor correction like we saw in the month of Sept18 and Oct18. Whats your take on it ? Thank You.
Akshay, I think its best to take the valuation upto date and check the average again. I’m guessing from 16, it may have moved upto 18-20 range. Btw, these valuations is best for overall portfolio construction. You maybe want to look at stock specific data to get individual stock’s valuation.
what is ideal Price to Book Value (P/BV) Ratio ?
There is nothing like an idea P/BV. This really depends on the stock/sector etc.
Hi Karthik,
Great work done by you on fundamental analysis.
Hats off.
As it’s said that portfolio shall contain max 15 stocks.
How to construct the portfolio?
Glad you liked the content, Yuvraj. I’d suggest you read the module here – https://zerodha.com/varsity/module/risk-management/ to figure out more about the portfolio construction.
Thanks Karthik
Why it’s recommended to do trading with Nifty 50 stocks? Is it due to option chain analysis?
Is it advisable to invest in Nifty 50 stocks for long term with CAGR 16% to 19% expectations?
Nifty 50 stocks are the most liquid stocks, hence its advisable to trade these stocks. For long term investment, maybe you should check other parameters and not just the liquidity of the stock.
Why does shares of certain companies like pnb , canbk having book value of less then one . This means the book value per share is greater then stock price .but you mentioned that book value can be referred as salvage value i.e in worst case shareholders should be able to receive the amount of book value per share then why does stock trade at less then book value sometime of good companies as well.
This is because of future growth prospects. Remember, when you buy a share, you are actually paying for the growth.
is there any other valuation model other than DCF?
or dcf is the most reliable valuation model?
There is a relative valuation, Gaurav. Then you can value based on enterprise value, PE, and stuff.
Hi Karthik,
Is there a need to revise the Index valuation limits. The current P/E ratio for Nifty 50 is 28.60, which according to the 2014 limits is way high.
What limits should we use as of today?
Thanks,
Nikhil
PE is driven by the markets, cannot intervene and set this manually.
Very nice explained sir but I have a doubt so many ratios what if some ratios of a particular company are good and some are not compared to other company of same sector….how should we decide please clarify
The module on financial modelling will also have relative valuation techniques, Mahesh.
Thanks for your immediate reply sir…I couldn’t find financial modelling module sir…can you plz share me the link
I’m yet to do that, maybe I’ll start in 2-3 months from now.
Hi Karthik,
I have been reading your blogs posted on Varsity for the past few days and they been a mind-opener to me. Just awesome! However, I would like to ask you about the future of markets in the short term – currently, because of the coronavirus, all the equity markets including oil, forex, commodities are way down. I hope this actually helps in market value corrections. My questions to you are:
1. What is your take on the market after this pandemic situation clears? Would it be that the markets would feel a surge in valuation or would it take a brief period of time to return to normalcy? A brief explanation would be very helpful for a young investor like me to jot down notes on behavioral economics and finance markets as a whole.
2. About the PE ratio section, please rectify if I am wrong. Is it okay for a company to distribute a large number of shares or is it better to a limited no. of shares? Because under EPS, if the no. of shares increase then the earnings per share reduces. If I am right, won’t these affect dividends distributed and EPS at the same time?
Thank you!
I think folks who have witnessed 2008 have always thought they’ve seen it all. But I think what we are witnessing in the market today is way worse.
Here is why I think – in 2008, the problem was ‘financial’ in nature. It started with banks extending cheap retail loans, offering excess leverage, misselling of products, and of course leverage on leverage.
Investment banks securitized these cheap retail loans and sold it to institutions. These institutions further repacked these loans and resold it. The product was called, ‘Mortgage-backed securities’.
MBS were sold all over the world – US, UK and a few other developed markets were the epicentres of this market. Eventually, when the real estate prices fell, people defaulted, and as you can imagine, the dominos started to fall…and the rest is history.
India did not have the MBS problem. I think we need to thank our regulators and conservative bankers for this. However, markets in India too crashed because we were (are) connected to the world economy. So the crash in India was a function of global meltdown and not because of a local problem.
But today, the problem is very different. The world has come to a standstill, thanks to this virus of an unknown origin. No one has a clue on what to expect, how long It will last, and the extent of the economic damage it will cause.
The problem with this is the fact that we cannot really quantify the extent of the damage. In 2008, this was not the problem – there was a $ range for the MBS and related market, so in a sense, the max damage (although massive), was kind of known.
When the market develops a sense of max damage, a bottom is formed. As the story unfolds, new data comes out, new max damage is estimated, then another bottom is formed.
Today, we don’t know the max damage. For now, looks like the fall has been arrested, but I don’t know for how long.
About PE – limited number of shares:)
Thank you, Karthik! That was great. The Big Short and the Inside Job were really great movies in explaining CDOs and MBS. They really put on quite a show. You were correct about the financial damage. It had a dollar value, more precisely put – a value.
I know I am in no position to say this but I really think you must write a book on Fundamental Analysis. Many youngsters like me look for mentors or advisors like you. You really know how to create a ‘study’ material. Zerodha’s varsity has taught me lots. And your response to comments is really generous. I hope we can connect on any social media like LinkedIn so that you could mentor me 🙂 . I look forward to that day.
Many thanks to you Karthik!!!
Thanks for the kind words 🙂
Everything that I know is put up here. This is a book of sorts. As far the mentoring is concerned, I don’t think I’m capable of doing that 🙂
The eps,eps growth ratio,pe ratio and everything will get disturbed when there are corporate actions like stock splits or stock bonuses,how to deal with that?
Thats true. Happens always. There is nothing much you can do about it.
If the P/E ratio of a company is very low, like between 2-5 does this mean the company valuations are very cheap or is the company sinking?
It could mean either. Hence you need to study the company from an overall perspective.
sir,
Can you please upload a model excel template which contains all the financial ratios with formula? It will be useful for us to calculate the ratios of other companies.
Will do that in in the module on Financial modelling.
What do u feel about efficiency of using advanced ratios like altman z score,pitroski score,peg ratio for screening of companies through websites like screener.in?how useful are they for analysing companies after shortlisting them?
I’ve not really used these ratios, so can’t really comment.
Sir,
The formula you gave to calculate Book value of a share is BV = [Share Capital + Reserves (excluding revaluation reserves) / Total Number of shares], but in the annual reports of companies like ITC has items like Equity Share capital, Other Equity, Attributable to owners of the parent and Non-controlling interests.
Can you please reframe the formula to calculate the book value? Also please explain me what these terms mean?
Thank you.
Kumar, a company can issue shares of different types – with voting tights, without voting rights, debt converted to equity etc. So when a company considers BV, it has to account for all types of equity holders. Hence the denominator shows these values. I’d suggest you look at the shareholding pattern reported in the annual report to get a sense of this classification.
Hi Kartik,
Thanks a lot for sharing the knowledge.
I understood all the ratios. Just one thing , as we find all the ratios on screener too. So, one should just add all these ratios
in default settings on screener and analyse them or should calculate by taking actual numbers from company’s website.
I am asking if screener.com also make same adjsutment while calculating then it will save time of one.
What you suggest
Ah, I’m really not sure about that. You need to check with screener.com’s support for this 🙂
Sir can you tell me why you have taken total revenue instead of revenue from operation while calculating price to sales ratio. Because, name of formula is price to sales. So, according to this we should take only revenue from operation.
You can take either, but yes, sticking to operating revenues is better.
I have been watching stock of adani green energy since few week sir.. at this stage where most of the stocks have gone undervalued, this stock has reached P/E of 400+. Have you ever seen such kind of P/E. Is this really possible because of sentiment of market or there could be something hidden which i as an investor should look.. your advice sir.. thanks in advance
I’m not sure if any stock deserves such PE. Btw, you need to check why the PE is so high? I’m not sure if such valuations are justifiable.
Thanks sir
Welcome!
Currently the Nifty is trending at 28+ P/E. So are markets heading towards a crash?
Wish I could answer that 🙂
hi, where can I get all the ratios mentioned in the all 3 modules of ratio.Is there any website that provides all the ratio mentioned?
thank you.
Do check screener.in or Tijori finance.
Thanks for teaching all the ratio so clearly. Finally after countless futile attempts made everywhere else, I understand them. I was checking the Index P/E after reading the last part of the chapter and as of today, the P/E ratio is 28x, the same as 2008. It helped me to take the decision of whether to put in money or hold. Thanks Karthik 🙂
Happy to note that, Andy. Hope you continue liking the content here on Varsity 🙂
Hi karthik,
I really enjoyed financial ratio chapters.Being a non-financial background initially i was too afraid to study financial statements but now going through your modules i feel confident to study these statement and take decisions. thank you so much for such priceless content you have created .Really appreciated.:-) Eagerly Waiting for your financial modelling module .
Thanks
Happy learning Sandip 🙂
Hi sir,
what is the Indian Indices P/E ratio range in today’s date ? How will i come to know about the range and which is the lowest point and highest point etc. is there any specific calculation for this ?
You can check the lastest PE value and the historical data here – https://www1.nseindia.com/products/content/equities/indices/historical_pepb.htm
Hey Karthik!
Which is more preferable to buy? A stock which has a high P/S ratio or a low P/S Ratio?
Depends on the sector and size of the company. You should not generalize this.
It’s highly unlikely that the P/E levels will be similar to what you have mentioned when you wrote this in 2014. PE reached 34 and as of now is around 32. Nifty50 growing slower than PE – EPS falling fast leading to higher PE.
Well, that’s the nature of the markets, keeps changing 🙂
Sir, where can I find AVERAGE of P/E ratio and other ratios for INDICES ?
Since Currently P/E Ratio for nifty is showing at 32x and therefore I need to look at the average of past years.
You can download the historical PE from NSE website and calculate the average, this is the quickest way according to me.
Ok Sir. Will do that.
and sir is that anyway I can get an e-mail or any notification whenever you response back on the query ?
We are working on the notification bit, Sunny.
Ok Sir. Will wait for it.
Hii Karthik Sir,
Can you be able to share a template of your excel sheet if its not personal for you.
I’ll take this up in the financial modelling module.
Hi Karthik,
Thank you so much, for your efforts to make this module to understand the learner better even if the learner from a non-financial background like me,
here I have a query here, today 1st of Nov’2020 the nifty is trading P/E ratio nearly 32, and past one year low is 18, let me know the 16 is a non wrinten standard to take a fresh positions, or is there any methods to identify the same.
Thanks in advance
Thanks for the kind words, Yuvaraj.
There are no written standards for these things, you will have to develop a sense of what’s happening in the market and take a call as you go along.
By any chance, does the annual report mention or contain a financial ratios section?
Yes, it will have basic financial ratios.
Brilliant post on Index PEs. I am reading this on 16th Nov, 2020 and the current NIFTY P/E is 34 – was interesting to evaluate the current trend and this part has been very very insightful. Great work!
Happy reading!
HI Karthik, I’m going through Mangalam organics Ltd AR and I see this.
authorized shares = 120,000,000
Issued, Subscribed and Paid up shares = 85,644,400
while calculating EPS which values should I use? and what about the unsubscribed shares. Are these unsubscribed shares are under promoters?
Basic would be 85644400, diluted would be the authorized shares.
valuable lessons
Which one should I consider? basic or diluted shares for calculating EPS?
If you want a conservative approach, I’d suggest diluted.
Hi Karthik, for calculating sales per share we use total revenue. But in total revenue there might be revenue component of investments. we should not count revenue from investments/other sources for calculating sales per share right? if we are using total revenue it is calculating revenue for share right.
YOu need to exclude that and take revenue from operations.
Sir as of Saturday December Nifty index P/E is at 36.46 way above the average should I be cautious
And it is thought as for every rupee of profit market participants are paying 36times the CMP
That’s right. I’d be a little cautious at this point, but given the raging bull market we are in, I won’t be surprised if the markets have more legs!
Sir what is equity/book value
I’m not sure, I’ve heard of Price to Book, which is basically the share price as a multiple of book value.
Thank you so much for your amazing and excellent knowledge to share with us.
If market is at all time high, then it’s always be necessary that it will crash??
Thanks
It will but the question is when? which I guess no one can answer 🙂
Hi Karthik,
These are my views and understanding of current markets:
For recent times I believe average Nifty pe should be around 26 to 30.
And the best time to time to invest in the markets should be when valuations are around 26.
Currently, Nifty pe is way beyond its avg valuation (38.88 on 07-Jan-21) and one should be very cautious while investing.
1. pls, let me know if my views are sound.
2. Also I would like to know what are your views for the current markets and its valuations?
I have similar views, but the market is a master of deception 🙂
Hi Karthik,
I am really thankful for the knowledge you shared in this varsity platform. The way you explained all the concepts, can be easily understood and applied by anyone who can read simple English and understand basic mathematics. I really benefitted from reading these concepts and applying them while investing.
One help I can request is if possible if you can provide good books for each area of these different modules, that will be much helpful for those who want to take this knowledge to next level. Why I am suggesting this is, I tried searching internet to know some books on the stock market, but there are lot many and every different person provides different books and also those are not in an organized fashion. As a beginner all books can not be read, so those books which can be helpful to build on the knowledge provided in the varsity will be much helpful and appreciated.
Thanks,
Anil
since last few months p/e ratio of nifty 50 on nse is constantly more than 30 before that it was in between 18-30. so in this case what should we do? wait for it to come under the range of 16-18 or invest now.
Its just that the landscape of the market has changed:)
Hi Karthik,
Thanks for the valuable information. I have few questions , can you please let me know your thoughts when you find time
1) You mentioned like “Make sure the company is not changing its accounting policy too often – this is one way the company tries to manipulate its earnings.” . Would like to understand more, Is there any article in varsity which talks about accounting policy and the way company changes it ?
2) Majority of the top well established companies most likely will be trading at the premium price so it may have high PE ratios beyond 25 or so. Are those companies are risky bet to park our money for long term provided those are having the proven track records of running the business ?
1) No Ashok, we dont have that on Varsity. Moreso, with the Indian accounting standards in place, this may no longer be an issue
2) Not really, these companies always command a premium and hence 25 PE is ok.
Karthik,
I have a dilemma here
Nestle is Running at 80 PE as of today .
Is it Ok to buy stocks with high PE like Nestle ? what would be the best case scenario to buy nestle ?
If Earnings are increasing 12% every year is it worth buying Nestle ?
How will the 12% earnings growth impact the share price ?
when Earnings grow , how will the multiple be maintained ? will it increase or decrease ?
is there a need to increase the PE multiple in accordance to the early earnings of 12% year on year ?
Good quality stocks have always traded at heavy premium. I’d suggest you pay more attention to how the business is doing now and its expected value in the future. Look at PE as one of the variables to make a decision, but not the only variable.
Read HUL in place of Nestle in the above post
Response is still the same 🙂
Hi Team,
For valuation is PEG ratio also used. PEG Ratio is PE ratio divided by earnings growth. Is it really important to check that as well ?
All ratios are good to know, Sandeep.
Hi Karthik,
1. Why do we need to analyze the Index Valuation (P/E, P/B & Dividend yeild), when purchasing a particular stock from that specific index?
2. Won’t there be situations where the Index P/E is greater (eg: 26) & Stock P/E is less (eg: 12) and vice-versa? What conclusion should we come to about this?
3. Instead of Index P/E, can we check Sector P/E to which the particular stock belongs to? We can get much clear picture on analyzing Sector Valuation vs Stock Valuation, right?
What’s your view on this?
1) Just to get an overall perspective on the market. For instance, you may not want to invest in stocks when the market is overvalued.
2) Yes, this happens. Idea is to get a perspective on where the market is valued at, this is good to know information. But when investing, what really matters is the valuation of the stock you’re buying
3) Yup, this too.
Dear Sir,
What about PEG ratio, EV and several ratios with EV.
I have seen this multiple times but not sure how to utilize them.
Could you explain this in your module?
I will in the module related to Financial Modelling.
Hey Karthik, hats off to your efforts for putting together such invaluable content.
I was wondering if you could elaborate more on “One has to be cautious while investing in stocks when the market’s P/E valuations are above 22x”
Acknowledging that this article dates back quite a few years and that any P/E ratio below 30 is admissible if everything else is looking good….I couldn’t help but notice that the average P/E ratio of sensex (rolling) is on the rise. So curious to know on how you would calculate a threshold P/E of Sensex given today’s market dynamics?
Sharvil, yes, pretty much all the companies have a higher PE these days, thanks to the bull market we are in. But frankly, even today investing in such overvalued companies is not comforting. However, if you are riding the price momentum, then that’s a different issue.
Hello Sir,
I hope you are well.
I have seen multiple places that list companies having a PEG ratio of 0.
What exactly does that mean?
COuld mean 2 things –
1) Negative earnings
2) Data not uploaded
Hello Sir,
I hope you are doing well.
I have a couple of questions and I hope you could answer them.
1) When looking at the BV and even calculating P/BV it is extremely rare to find a stock that trades below its book value. Even during the Covid crash, I was not able to find good companies that traded under its BV. So how useful is P/BV as a metric.
2) I have two companies in the same industry. Company A has an EPS of 10, B has one of 4. Company A has a PAT margin of 5%, while B has a margin of 15%. Do you give a higher weightage to EPS or PAT margin?
3) You have mentioned that you do not like to invest in companies that have a PE ratio above 25-30. So let’s say you invested in a company that had a PE ratio of 25-30. After 6-8 months, the price rises, and its PE becomes 45. Do you stay invested in the company or exit and find a cheaper company?
1) You will find these in bear markets easily, India has not seen one since Mid 2013 I guess
2) Both are important, very hard to isolate one over the other. Add this information to other metrics and take a call on all the available data
3) I think that thought does not hold true in bull markets 🙂
Hello Sir,
Currently, Nifty 50 PE is 28, it was 41 in Feb.
Should one enter the market and invest in just or wait for it to reduce to below 20. It was 20 during Covid, and last time it was below 201 was in March 2016.
Ketan, its very hard to take this call. I’d suggest you focus on individual stocks instead 🙂
Hello Sir,
Sir EPS is PAT/no of shares.
EPS does not consider Profit margin, the debt the company holds etc.
So how important of a metric is it? A company has a large amount of debt which results in higher assets which result in larger PAT, in turn, a higher EPS.
This is confusing to understand
Well, there are many metrics that are important while evaluating a company and EPS is just one of them. Please consider all that’s important and not really give one metric more importance over another.
Hello Sir,
Like for each metric, is there a reasonable standard to understand if the company is out performing its peers or not?
Like example you mentioned you don’t like to invest in a company above 25-30 PE.
Are there other examples of this?
There are many, Santhosh. For example, all sorts of profit margins help you understand this. But things like PE etc are market-driven, which does not really help you accessing the fundamental performance the company.
“P/E of a certain firm is 15, it simply means that the company earns the market participants for every unit of profit the company earns, the market participants are willing to pay 15 times.”why is it so?whom are referred as market participants here and why do they need to pay?please explain
Market participants are people like you and me who have an interest in transacting in the market.
WHERE TO FIND( WHICH WEBSITE) FORWARD P/E AND FORECASTED EPS FOR NEXT 2 TO 3 YEARS FOR INDIAN STOCKS?
You can look at tickertape.
It is advisable to exercise caution when the Index is trading at a valuation of 22x or above.
A valuation gets attractive when the index is trading at 16x or below.
is this valid even for the year 2021 and 2022?
This is valid, but it is also scary to say don’t buy considering the way markets are moving 🙂
Hi Karthik,
Will overvalued stocks appreciate faster than undervalued stocks?
Cant generalize that, Kauseelan.
Hello karthik
thank you for you’re learnings but can you explain why the market cap of company is not consider in the valuvation ratios because the market cap of say how valuable a company is what if there was a ratio of market cap to earnings or revenue will that be a good ratio ?
Thank you
Market cap is one of the many metrics available, Harsha. But market cap is not a ratio like others I’ve explained.
Good evening Karthik sir,
I just wanted to say thank you very much for explaining the intricacies of stock markets, derivatives and all for novices like me and that too in very simple and lucid language.
I have tried to learn stocks from a number of sources including paid ones. All I can say is nobody explains the basic concepts in such a lucid and easy language as you do. I sincerely believe this entire varsity module is a treasure cherish for all.
Thank you once again sir. I consider myself very lucky to have found this treasure and be able to learn a thing or two from it.🙂🙂🙂
Hey Ankur, thanks so much for the kind words. Happy learning 🙂
hi Kartik
as u have stated in earlier chpt that total outstanding shares are the number of shares that is there with the market participant, but how come u have taken a number in rupees while calculating in book value
BV = [Share Capital + Reserves (excluding revaluation reserves) / Total Number of shares]
U stated that share capital is 17. 1 cr which is a number( then why u expressed in rupees )
Number of shares * Face value = Rupee value of all the shares.
Hi Karthik,
Thank you for putting such effort on educating us.
I have a question with book value, as many companies have lot of land and real estate reserves. Are they valued with the price appreciation over the period of time or they are as it is in books?
How can I see the P/E , P/B and P/S chart in Zerodha?
Thanks in advance
Check out Tijori Finance for that.
Hi Karthik, How fundamental evaluation of banks is different from other companies ? What I mean is what all ratios doesn’t matter for banks which we use for other sector companies and vice-versa ?
Book value matters when it comes to evaluating Banks and NBFC, Manish.
Thanks a lot karthik and zerodha for such a great initiative which are helping a lot of people.
Happy learning 🙂
Hi Karthik
I’m not able to check the ratios on the NSE website. Can you please share the link
These ratios are not available on NSE. Please check portals like Tijori or screener.
Thank you Karthik for the quick reply
Did they remove these ratios recently?
I have found one website where these ratios are available https://trendlyne.com/equity/PE/NIFTY50/1887/nifty-50-price-to-earning-ratios/
They as in; who are you referring to?
I mean NSE website, I had seen some articles those has mentioned one old link, but that link is not working now
Ah ok. Raju, I’d suggest you check once with NSE team itself.
In all the 3 chapters of ratio, we haven’t come across dividend yield ratio calculation.Is this because it doesn’t fit into these categories or any other reason?
Yeah, its mainly because of how ratios are categorized in this chapter.
Hello Kartik, Well designed modules, I really like the learning through Varsity. I’m sure as the market participants will increase in the country and worldwide footfall on Varsity will spike. Simple reason is reduction of intricacy in learning and thanks for that to you and team 🙂 Indeed, As mentioned by you at one of the platform that beauty and real treasure of Varsity is comments!
Well my question is about The Index Valuation segment.
My understanding on concept is: Increase in Nifty PE means people are willing to pay more for the per unit of earning of the indexed companies.
You mentioned in 2014
“One has to be cautious while investing in stocks when the market’s P/E valuations are above 22x”
Post 2014 nifty traded below the PE of 22 last in Jan 2015 (Except few instances) and also touched PE of ~42 in Feb 2022 which was maximum. In fact, Nifty never return below 20 until now (Except once June 2022 / 19.54).
Question:
– How we can perceive this phase of Jan 2015 to Feb 2022?
– Shall we hold ourselves that Nifty PE is going beyond it average range (20-25) or we shall part of this rally?
– Or Nifty Average PE safe range changes as it moves up and down? If yes, how we can aware about the same? any parameter?
I mean I am facing problem to interpret as mentioned and unable to get answers of aforementioned questions. Please help me to understand this.
Pro
We need to evaluate the Nifty PE range expansion itself and come to terms with new averages, thats the only way. Else, it will be very difficult to wait for perfect opportunities and wait for execution triggers 🙂
How we will get to know if P/BV is overvalues or undervalued?
You compare it with peers and also compare it with its own historical values to get a sense of how cheap or expensive the valuation is.
Sir
I want to calculate roce and earning yield, but earnings yield change everyday how to calculate it, some websites give different values, which website i should consider.
Thats not the way to look at it, Asthik. As price changes, so does the earning yield, quite obviously. What you need to look for is the yield at which you are comfortable buying or selling the stock at. That obviously means that you may have to wait for the price to move to your desired level.
in your P/E section, you wrote “if the P/E of a certain firm is 15, it simply means that the company earns the market participants for every unit of profit the company earns, the market participants are willing to pay 15 times.” The sentence needs to be corrected, currently it doesn’t make sense.
Will fix the typos, but PE is just that – what are you willing to pay for given current earning of the company.
Summary Interest Coverage Ratio:
low interest coverage ratio could mean a higher debt burden and a greater possibility of bankruptcy or default.
Debt to Equity Ratio:
Higher debt to equity (more than 1) indicates higher leverage and hence one needs to be careful. Lower than 1 indicates a relatively bigger equity base with respect to the debt.
Debt to Asset Ratio:higher the percentage the more concerned the investor would be as it indicates higher leverage and risk.
Financial Leverage Ratio Do remember higher the number, higher is the company’s leverage.
Fixed Assets Turnover-Higher the ratio, it means the company is effectively and efficiently managing its fixed assets
growing company, the company may invest in fixed assets and hence the fixed assets value may increase year on year
Working Capital Turnover-working capital is a positive number, it implies that the company has working capital surplus and Higher the working capital turnover ratio the better it is, as it indicates the company is generating better sales in comparison with the money it uses to fund the sales.
Total Assets Turnover-higher total asset turnover ratio compared to its historical data and competitor data means the company is using its assets well to generate more sales.
Inventory Turnover Ratio
the product is really popular the inventory turnover would be high. This is exactly what the ‘Inventory Turnover
Inventory Number of days-
short inventory number of day’s number implies, thethe company’s products are fast moving.
Accounts Receivable Turnover Ratio-Naturally a high number indicates that the company collects cash more frequently.
Price to Sales (P/S) Ratio-higher the P/S ratio, the higher is the valuation of the firm. Compare compitive same product value ,
Price to Book Value (P/BV) Ratio-higher the ratio, the more expensive the stock is.high ratio could indicate that the firm is overvalued relative to the company’s equity/ book value. A low ratio could indicate the company is undervalued relative to the equity/ book value.
Price to Earning (P/E) Ratio-should be below 20 or 25
The Index Valuatio
Indian Indices P/E ratio ranges between 16x to 20x, with an average of 18x
Historically the best time to invest in the markets is when the valuations are around 16x or below.
http://www.nseindia.com/
On NSE’s home page click on Products > Indices > Historical Data > P/E, P/B & Div > Search
NSE updates this information around 6:00 PM every day.
Indices have a valuation which can be measured by the P/E, P/B or Dividend Yield ratio.
P/E
Conventionally, a PB ratio of below 1.0, is considered indicative of an undervalued stock. Some value investors and financial analysts also consider any value under 3.0 as a good PB ratio.
Dividend Yield ratio.2% to 6% are generally considered to be a good dividend yield
low Net profit margin would indicate higher costs and increased competition.
Asset Turnover
Higher the ratio, it means the company is using its assets more efficiently. Lower the ratio, it could indicate management or production problems.
Higher the financial leverage, along with increased amounts of debt, will indicate the company is highly leveraged, and hence the investor should exercise caution. The resulting figure is expressed as several times per year.
I’m unable to figure your query, can you pls be more explicit?
net worth and book value are one and the same?
Yeah, roughly the same.