Technical Analysis – Intro

Technical Analysis
Hello Traders,
If you already have a basic understanding of Technical Analysis (TA), please skip this blog. But understanding this is essential before proceeding to learn about the AmiBroker Plugin.
How do you decide on buying/selling?
There are people who trade just based on their gut, but it is important to have a system for making an analysis before deciding to buy/sell a stock. If your analysis is based on the general economy, financial statements, competitor analysis, etc., we call it Fundamental Analysis.
For example, you predict that interest rates are going down, because of which you assume that the number of cars that will be sold next year will be higher. Based on this fundamental analysis, you decide to buy Maruti stocks. The issue with fundamental analysis is that it takes a long while to play out. For example, in the above case, you would probably have to wait for a couple of years for the price to appreciate based on your analysis. Also, because you are making a decision based on the information that you receive, you can’t be sure that you know most. There are always people who have more information than you, not an ideal scenario as your odds of winning go down.
Technical Analysis
Technical Analysis (TA) today is the most popular method of stock analysis used by traders/investors across the world. Unlike Fundamental Analysts, Technical Analysts believe that all information is already reflected in the price of the stock. Investor/Trader reaction to price movements leads to recognizable price chart patterns.
To give you an analogy, palmistry works on similar principles. Valmiki is supposed to have studied over a million palms before writing a book on palmistry millions of years ago. For example – we have a lifeline on our palm and the longer it is the longer we are supposed to live. How does a palmist come to this conclusion? Valmiki studied a million palms and found that the probability of a person living longer is higher if the life line is longer, hence the palmist takes a bet based on the fact that the probability is higher.
Similarly, in Technical Analysis you look at the price patterns on the chart and based on the analysis of past price data, you take a bet on the direction of the stock for the future. Technicians (people who follow TA) employ many techniques.
Let me explain the simplest one for you. I have pulled the following chart from Wikipedia:
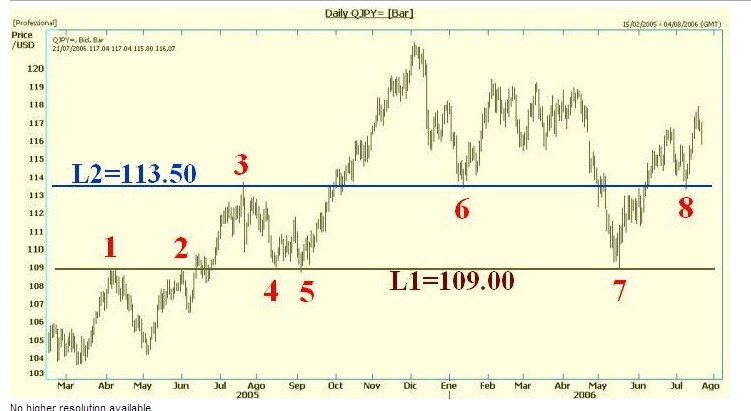
Sample Chart
The above chart basically shows the movement of the stock for 18 months. Let’s analyze the same:
- If we start from the left, you will see that once the stock goes to 109, it comes down all the way to 105. Because the stock had trouble crossing 109, we call it as a resistance.
- As you will see at Point 2, the same price again acts as a resistance and the stock goes down to 107 after hitting 109. But just after Point 2, the stock manages to cross the resistance of 109 and a breakout happens. A breakout is basically when a resistance is taken out and there is a sudden price increase.
- As you will see the price moves from 109 to 113.5 swiftly after which it again comes down. So Point 3 becomes a new resistance. After hitting the resistance at 3, the stock comes down back to 109 at 4.
- Since 109 was a resistance when the stock was moving upwards, it now acts as a support on the way down. The way it took a while to break 109 upwards, it will not break 109 very easily downwards. A technician following the above principle of resistance/support line, will basically buy anytime a breakout happens above the resistance line and sell whenever a breakdown happens below the support line.
Technical Analysis is an ocean of various such studies. Some of them are candlestick charting, Elliot wave analysis, moving averages, etc. The internet is the best resource for a person looking at honing his skills on technical analysis as there are various websites/blogs that discuss/educate you on this.
One of the most important requirement for a Technician is a charting platform – a platform that can show a chart similar to the one above. It is also important that the charting platform comes with the ability to add various indicators such as RSI, Moving Averages, Volume, etc.
Zerodha Trader, our software-based trading platform, comes with the NEST Plus (Starter) charting tool pre-loaded completely free of cost. Check out this blog to see how to use the Starter Pack.
Once you get proficient with Technical Analysis, you will want to have a charting platform that can do much more than what the charting tool on the NEST Starter Pack can do. This is where AmiBroker comes into the picture.
Please read the next blog on the “Basics of AmiBroker”
Happy Trading,
Nithin
Hi Nitin, When is Zerodha starting cross currency trading…..its almost 4 months now. and no news on when it will get activated.
Hi Everyone, I have been studying TA from Zeordha’s Varsity section.
Under indicators (MACD) section, it says, IF SIGNAL (SMA 9) LINE IS ABOVE THE MACD (12-26), ONE SHOULD TAKE LONG POSITION AND IF SIGNAL LINE IS BELOW MACD, ONE SHOULD TAKE SHORT POSITION.”
When I matched the SIGNAL LINE AND MACD CROSSOVER, it did not coincide with the price behavior. That is, Signal line above MACD line but stock was not in uptrend. It moved sideways. I understand that MACD is a trend indicator but how do I know that the crossover will result in trend or whipsaws.
Please help
Manoj, you can learn more about MACD and post your queries here.
Thank you for providing the right forum.
Hello Sir,
Need Crude Oil Past Months or Years 5 Minute,15 Minute to Weekly Chart Data
I need Software for Technical analysis of MCX crude Oil.
In Any Technical analysis software allow to seen Crude Oil last 1 to 5 years of data (Not EOD But 5 Minute to 15 Minute , 1 our Candle of Last 1 To 5 Years) with all time frames like 5 minutes candle charts to Daily & Weekly chart with applying all strategies defined by us.
Or Just like Back Testing of any strategies which I try to test of Last 5 Years of data of Crude Oil.
Zerodha Provide only current series of data in Crude Oil.
So, If I want Last 3 Month or 12 month Chart Data with 5 min to 1 hour candle stick with any indicator apply to chart……
Please Suggest Us sir any good software …
Suraj, we will be soon giving continuous futures data (but daily chart) for commodities. You can maybe ask globaldatafeed or truedata if they offer this.
Hello,
Thanks for replying us…. Many software provider & broker not allowed that kind of softwares….
I just suggest you if Possible Last 3 Months Crude Oil Future Data provide by Zerodha than it’s helpful to Small investor to check many different strategies check at least last 3 months Test with 15 minute, 30 minute, 1 hour And 4 hour chart….
Now, I am enjoying good service given by Zerodha, Good Plat form , Good team…. Good online that kind of quick comment reply support… And happy to part of Zerodha team… Thanks sir for supporting here….
Yeah Suraj, we intend to give continuous futures charts for maybe upto 1 hour candle.
I use MarketXLS for this and it works great for me.
what about the trend lines and evrything and all
Check this Shlok: http://zerodha.com/varsity/module/technical-analysis/
[…] you would have read in the previous blog: Technical Analysis – Intro, we give you technical analysis tools on Zerodha Trader – our trading platform. But there is a […]
I got a failure notice when I mail to india@Zerodha
TKS
Can’t be can you check again? [email protected]
It working now I could RTD data to excel.
Thanks
using nest trader I could not link the prices to excel sheet, what to do?
Send an email to [email protected], someone will call you back and help you out on this.
@Renju, if you have learnt TA from the book, I think it is about time you practiced it and put some money into play. You will automatically start improving your skills when you trade with real money. http://www.traderslaboratory.com
http://www.aussiestockforums.com
http://www.thechartist.com.au
http://www.systems4trading.com , do check out the following websites and there are many more such websites where people discuss on their strategies and this should help you design one for yourself.
Happy Trading..
hai guys
is there any possilbe way to learn technical analysis..i have only knowledge of technical anlaysis acquired from books.
i would be grateful if somebody can make a comment..
Technicial analaysis is the basic need of every trader, yours tips is very usefull to all
Technicial analaysis is the basic need of every trader, yours tips is very usefull to all
Good information all traders….
It will help me to trade efficiantly.
Very good informations. Expecting more.
Technical anlysis simplifies the doubts about the movement of market and the stock but since there are many theories, a tested strategy will help make trading decisions.
This helps
Very Informative..