5.1 – Futures Calendar spread
All else equal, the futures contract is always supposed to trade at a premium to the spot. This, as we know, can be attributed to the interest rate factor (cost of carrying) in the Futures pricing formula. We have discussed this earlier in the Futures module. Any variation in this equation leads to an arbitrage opportunity.
For a quick low-level recap on that, consider this scenario where there is arbitrage opportunity between Spot and Futures –
Futures trade at a lower price – Assume the spot price is at 100, and the fair value of its future is at 105. The fair value of the future can be calculated using the futures pricing formula. The ‘no-arbitrage spread’ is the difference between spot and Future’s fair value, i.e. 105 – 100 = 5
Given this, for whatever reasons (read as market mispricing) assume the future is trading at 98, this leads to a spread of 7 (105-98) between the spot and future, which can be captured.

All one has to do is buy the future at 98, and simultaneously sell the spot at 100. We know upon expiry, the futures and the spot will converge, and therefore the spread gets captured.
If you are unable to understand the above clearly, I will encourage you to read the chapter from the Futures module (link posted above).
Likewise, if the futures trade at a higher price (over and above its fair value), then one can capture the spread by selling the futures and buying the spot.
We have learnt this before, and this is quite straight forward. However, when it comes to the USDINR contract, for practical reasons such as arbitrage trades involving spot and futures cannot be executed. This is because the USDINR spot market is not really accessible to the retail.
So how does one trade the spreads in the currency segment? Well, this is fairly easy – as opposed to spot-future spread, one has to identify the spread between two different futures contracts expiring over two different dates. This is also known as the ‘Calendar Spread’.
In a calendar spread, you decide whether the spread between two futures contract is considered normal or otherwise. All else equal, the long-dated futures contract will always trade at a premium over the ‘short term’ dated futures contract. For example, the August month futures contract is expected to trade at a premium when compared to July month. Therefore a certain amount of spread between these two contracts is deemed ‘normal’. However, there could be situations where the spread goes beyond normal (either higher or lower), and this is when opportunities arise.
As of today the USD INR July Futures is trading at 67.3075, and the August contract is trading at 67.6900.
The spread is calculated as the difference between the two futures contract –
67.6900 – 67.3075
= 0.3825
Now assume, for whatever reason you think this spread of 0.3825 high, and it should ideally be 0.2000 as opposed to 0.3825. This means you have an arbitrage opportunity here, and you stand to make –
0.3825 – 0.2000
= 0.1825
To capture the spread, you are required to buy the July Futures and simultaneously sell the Aug futures –
Long July Futures at 67.3075
Short August Futures at 67.6900
When you set up a trade wherein you are long current expiry and short further term expiry; it is also called a “Future Bull Spread”. Likewise, a ‘Futures Bear spread’ is when you are required to short the current month expiry and go long on the further month expiry.
Anyway, once you set up the ‘Future Bull Spread’, you will have to monitor the trade and close the position when the spread converges to 0.2000 or lower. You will profit when one of the following things happen –
- When the July (long) leg rises and Aug (short) leg falls
- When the long leg raises, and the short leg remains unchanged
- When the long leg raises, and short leg rises, albeit at a lower rate.
- When the short leg falls faster than the long leg
- When the long leg remains unchanged and short leg falls
Will the spread converge? If yes, then when will it converge? Why should it converge? Will one of the above situations really pan out? Well, the answer to this really depends on how well you know the spread, and for you to know the spread really well, you need to backtest it. Techniques of backtesting are perhaps a topic for another day; however, I’d like to show you how easy it is to buy sell the spread from your trading terminal.
5.2 – Executing the spread
How would it be if you could directly buy or sell the spread? For example, in the above case, we concluded 0.3825 is an overpriced spread, to capture this spread you execute two orders, i.e. buy July Futures and sell August futures.
Executing these trades has some inefficiency mainly in terms of execution risk – by the time you buy/sell both the contracts, the prices could move, and thereby the spread may no longer look attractive.
Given this, it would be really convenient to buy the spreads directly and not really deal with two different contracts. If you are a Zerodha customer, you have access to NEST trader, from which you can trade the spread directly. Of course, in the future, this will also be available in both Pi and Kite.
Here is a series of snapshots which will help you trade the spreads directly.
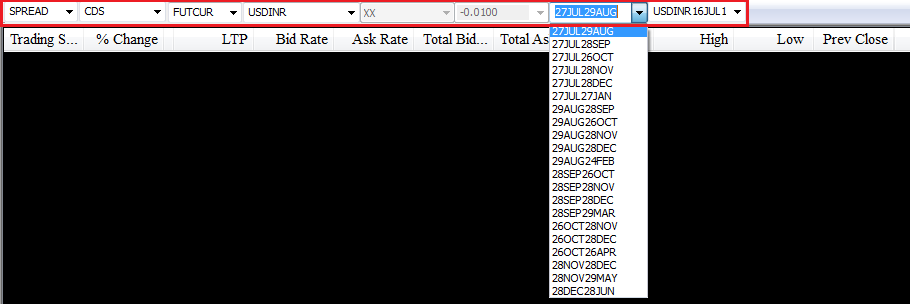
Look at the part highlighted in red, as you may have realized; this snapshot is from the market watch. Starting from the left –
- We select ‘Spread’ from the dropdown, which specifies that we are looking at spread contracts.
- After selecting spreads, we choose CDS from the dropdown to indicate currency derivatives as the segment.
- FUTCUR indicates that within CDS spreads; we are interested in Future contracts.
- USDINR indicates that we are interested in the USDINR contracts.
- The full view of the dropdown menu is visible here, as you can see, there are many different spreads available. However, we are only interested in the July-August spread, which is what we have selected.
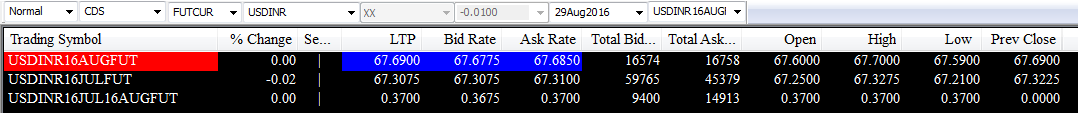
Once we configure the above-market watch, we submit this to load the spread, here is how it looks like –

I’ve highlighted the spread’s last traded price. As you can see, this particular spread instrument denotes the spread between July and August contract.
Note – the spread should be trading at 0.3825 and not really 0.3700 right? Why do you think there is a price difference?
I’ll try and explain this from as per my own understanding, and I could be wrong; therefore, comments are more than welcome! Also, we are digressing a bit here, so try not to lose focus on the main topic, i.e. how to trade the spreads.
Have a look at the snapshot below –
The market watch has July, August and the July-August spread contract loaded.
Forget about the spread contract, for now, assume you want to set up a Future Bull Spread (buy July, sell Aug) contract, then you essentially –
Buy July contract at the Ask Rate – 67.3100
Sell Aug contract at the Bid Rate – 67.6775
Spread = 67.6775 – 67.3100 = 0.3675
Now, if you were to set up a Future Bear Spread, then you essentially –
Buy August contract at Ask Rate – 67.6850
Sell July contract at Bid Rate – 67.3075
Spread = 67.6850 – 67.3075 = 0.3775
As you can see, there are two spreads possible based on what you intend to do, i.e. future bull/bear spread.
Now the question is – which price should the spread reflect? Would it be that of the Future Bull Spread or the Future Bear spread?
I guess that the spread trades close to the average of the two spreads. In this case, the average is 0.3725, and the actual market spread is 0.3700. Why 0.3700 and not really 0.3725? I’d attribute this to one of the two things – the latest quote has not been captured by the terminal or lack of liquidity.
A different explanation here could be that the spread itself is mispriced!
Anyway, back to the main topic, i.e. buying/selling the spread. Once the spread instrument is loaded, all you need to do is select the instrument from your market watch and press F1 or F2 for buying and selling respectively.
This is what you see upon invoking the buy order window –
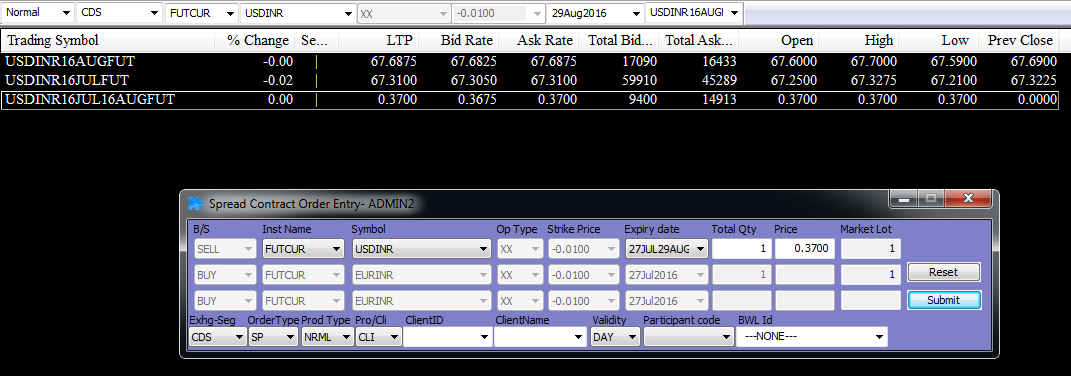
The window is pre-populated with the spread details; you may want to edit the quantity bit to suit your lot size requirement. Press submit to place the order.
As simple as that!
5.3 – USD INR Stats
I thought it would be interesting to study some statistics on the USD INR pair; I downloaded the USD INR spot data from the RBI site.
Let us start by looking at the long term chart of the USD INR over the last 8 years (July 2008 to July 2016) –
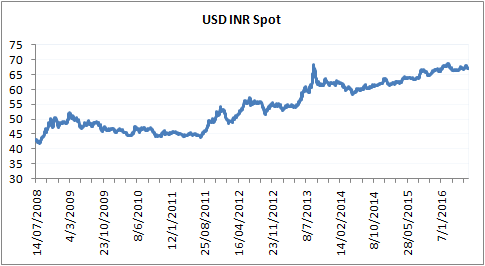
Clearly, the US Dollar has strengthened against the Indian Rupee over the last 8 years. Quite intuitive as our economy has literally stagnated over these years. ☺
Have a look at the daily return plot of the USD INR –
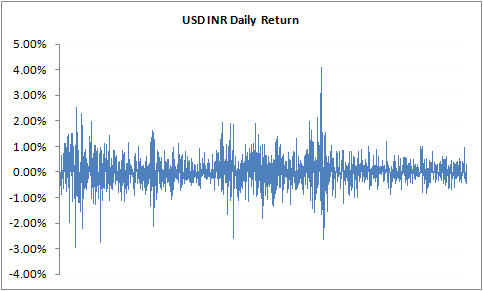
We can observe a few interesting parameters from this –
The average daily return of USD INR is about 0.025%. The maximum and minimum daily return stands at +4.01% and -2.962%, contrast this with Nifty 50’s maximum and minimum daily return of +3.81% and -5.92%, you will realize that the USD INR pair is a lot less volatility compared to Nifty 50 or in fact any other indices. This fact is further manifested in the volatility numbers –
- Daily Standard deviation (last 8 years) – 0.567%
- Daily standard deviation (2015) – 0.311%
- Annualized standard deviation (2015) – 4.94%
These numbers are clearly much lower compared to the Nifty 50’s daily volatility and annualized volatility number of 0.82% and 15.71% respectively.
Further, I also ran a correlation function on Nifty 50 and USD INR, before I tell you the answer I want you to guess what this correlation would be like.
For those of you who don’t know what correlation is, here is a quick explanation –
Correlation between two variables gives us a sense of how two variables move concerning each other. Correlation is measured as a number which varies between -1 to +1. For example, if the correlation between the two variables is +0.75, then it tells us two things –
- The plus preceding the number tells us that they both are positively correlated, i.e. they move in the same direction.
- The actual number gives us a sense of the strength of this movement. In a loose sense, the closer it is to +1 (or -1) the higher is the tendency for the two variables to move in tandem.
- A correlation of 0 suggests that the two variables are not related to each other.
From the above, we know a correlation of +0.75 suggests that the two variables move not only in the same direction but also tend to move together closely. Note, the correlation does not suggest the extent of the move; all suggest is that the move in the same direction is likely to happen. For example, if Stock A moves 3%, and the correlation between stock A and stock B is +0.75, then it does not mean that Stock B will also move by 3%, all that the correlation suggests is that Stock B will move up positively, just like Stock A.
But, there is another twist here – suppose stock A and Stock B are correlated at 0.75, and the daily average return of Stock A and Stock B is 0.9% a 1.2%. It can be said that on any given day, if Stock A moves above its daily average return of 0.9%, then stock B is also likely to move higher than its daily average return of 1.2%.
Likewise, a correlation of -0.75 indicates that the two variables move in opposite directions (indicated by the -ve sign). Suppose stock A moves up by +2.5%, then under a correlation, we know that Stock B is likely to come down, but by what degree will it come down isn’t known.
While we are at it, one more point on correlation. This bit is only for those interested in the maths of correlation. The correlation data makes sense only if the data series is ‘stationary around the mean’. What does this mean? – Well, it simply means that the data set should be sticking close to the average values. Take another look at the graph of the daily returns of the USD INR, reposting the same for your convenience –

The daily average return here is 0.025%. If you notice the daily returns, it is mean reverting in nature, meaning even if the returns shoots up, or comes down, it eventually sticks back to the average value. A data series which exhibits such property is said to be “stationary around the mean”. Stock/commodity/currency returns are invariably stationary, but the Stock/commodity/currency prices are not stationary as they tend to trend.
Confusing? Well, the key point that you need to remember here is that when you run a correlation test, make sure you run it on the daily returns (as they are stationary) and not really on the daily prices (as they tend to trend).
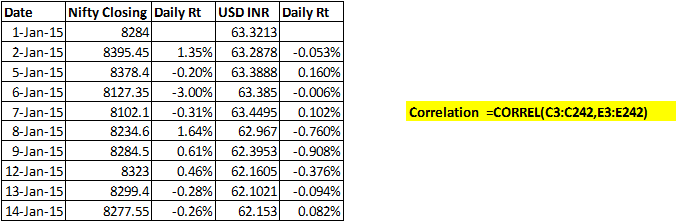
Calculating the correlation between two variables is quite easy, in fact, has just 2 steps –
- Calculate the daily returns
- Use the ‘=Correl’ function in excel.
Press enter, and you get the correlation between the two variables.
Remember the correlation between stock A and Stock B is the same as the correlation between Stock B and Stock A.
I hope you’ve had a decent understanding of correlation, its time I repost the question asked earlier.
If you were to guess the correlation between USDINR and Nifty 50, what would it be? Forget about the number, can you at least guess whether they are positively correlated or negatively correlated?
Let us try and deduce this – If the markets (as a representation of the whole economy) are doing good, then the markets tend to attract investments from overseas. This means dollars are coming into the country. The dollars get sold to get converted to Rupee. Essentially this translates to dollars being sold for Rupees, naturally the Rupee strengths. This means the USDINR goes down while the Nifty 50 increases. The same logic can be applied when you look at it from the other way, i.e. market going down while USDINR increases.
This means Nifty 50 and the USDINR should be inversely correlated. In fact, this is true, and the correlation value is -0.12267 (2015 data).
You can download the excel sheet.
In the next chapter, we will briefly look into other currency contracts and the role of Technical Analysis while trading currencies. With this discussion, we will wrap up currencies and start exploring the world oh commodities!
Key takeaways from this chapter
- The classic future – spot arbitrage is not really accessible to the retail market. Hence traders tend to look at calendar spreads.
- In a calendar spread you simultaneously buy and sell contracts belonging to two different expires.
- A future Bull spread is when you buy near month futures and sell the further month expiry.
- Futures bear spread when you sell near month futures and buy the further month expiry.
- You can directly trade the spread from your trading terminal; these are called the ‘Spread contracts’
- The USD INR pair tends to have lower volatility when compared to Nifty 50
- The USD INR and Nifty 50 are inversely correlated
Futures bear spread is when you sell near month futures and sell the further month expiry. – Is this statement correct ?
Sell near month and buy further month.
Please get this changed under ” Key takeaways from this chapter ” -:)
All done! Thanks 🙂
Dear Karthik, Just like USDINR is traded on NSE, does the same pair get traded in some other international exchange like US/UK etc. If yes, can one look at the same data and see whether the market is viewing the pair in the same way across various markets ? Thanks
They do, outside India its largely a ‘Market making’ environment. But the spreads outside India mimic the contract that gets traded on NSE.
contrast this with Nifty 50’s maximum and minimum return of +3.81% and +5.92%, It should be -5.92% I think.
Thanks, will make the correction.
Very nice modules, eagerly awaiting for next chapters. When will the spreads, 2L, 3L, BSE index, VIX available in kite, any timelines please?
Just like calendar spreads for currency are there any credit/debit option spreads also available in any product. What about U.S. market?.
It’s very painful that I can’t write the stock/index options due to high margins and no margin benefits are there for manual spread order.
Cant comment on a timeline for this, but I know this will happen sometime soon. I’m certain option spreads are available in US.
is that Kabali? 🙂
Yup 🙂