6.1 – The other currency pairs
We focused on the USD INR pair extensively over the last few chapters, and we now look into the other currency pairs that are traded in the Indian markets, namely the EUR INR, GBP INR, and JPY INR. The functioning of the other currency pairs is very similar to the USD INR. Think about it this way – you know how the Nifty 50 contracts work, then you pretty much know or are capable of knowing how Bank Nifty works.
Given this, the agenda for this chapter is to quickly run through the contract specifications of the other three crosses available for us to trade. In the 2nd part of this chapter, we’ll dwell on some of the common trading techniques, mainly employing technical analysis. With this, we will conclude our discussion on currencies and start looking into commodities.
So let’s get started.

EUR INR
Globally the EUR USD is one of the most actively traded currencies. However we do not have that contract yet in India, but RBI has given the exchanges a nod to list these crosses as well. So I guess it is a matter of time before we have the EUR USD pair along with GBP USD, JPY USD etc. But for now, we do have EUR INR to trade.
The EUR, as we know, is the currency of the European Union. Unlike other currencies, the EURO is backed by the economy of many European countries and not just one economy.
The EUR INR contract structure is quite similar to the USD INR contract. Here are the key details that you need to know –
| Particular | EUR INR | Remarks |
|---|---|---|
| Lot Size | € 1,000 | In equity derivatives lot is the number of shares, but here it’s a Euro amount |
| Underlying | The rate of Indian Rupee against 1 EUR | |
| Tick Size | 0.25 Paise or in Rupee terms INR 0.0025 | |
| Trading Hours | Monday to Friday between 9:00 AM to 5:00 PM | |
| Expiry Cycle | Upto 12 month contracts | Note, equity derivatives have an expiry upto 3 months. |
| Last trading day | Contracts trade till 12:30 PM, 2 days before the last working day. | Equity derivatives continue to trade till 3:30 PM of the expiry day. |
| Final Settlement day | Last working day of the month | |
| Margin | SPAN + Exposure | Usually, SAPN is about 1.5%, and exposure is around 1%. Hence roughly about 2.5% is the overall margin requirement. |
| Settlement Price | RBI Reference rate on the day of Final settlement | The closing price of spot |
So as you see, the contract specifications are similar to that of the USD INR pair. The only difference is that the lot size in EUR INR is € 1,000 as opposed to $1,000 in USD INR.
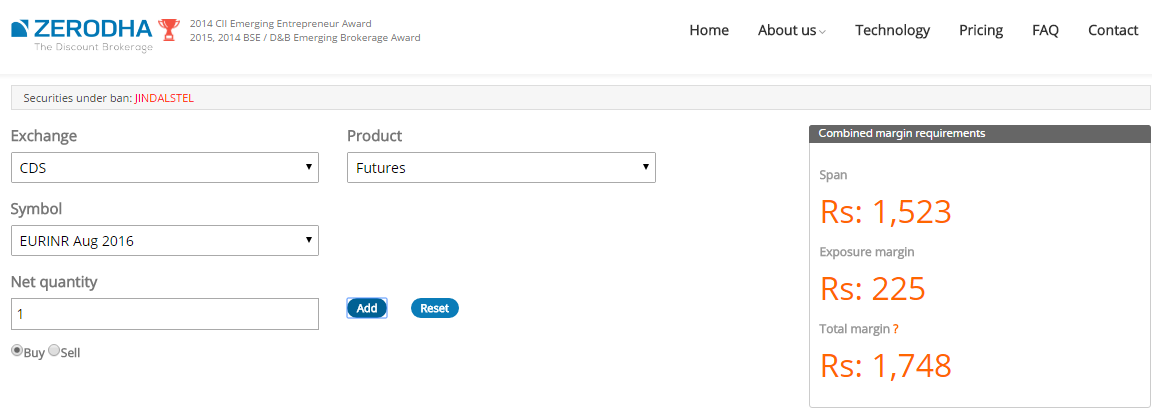
Let’s see how this would impact the margins; here is the snapshot of the EUR INR futures –
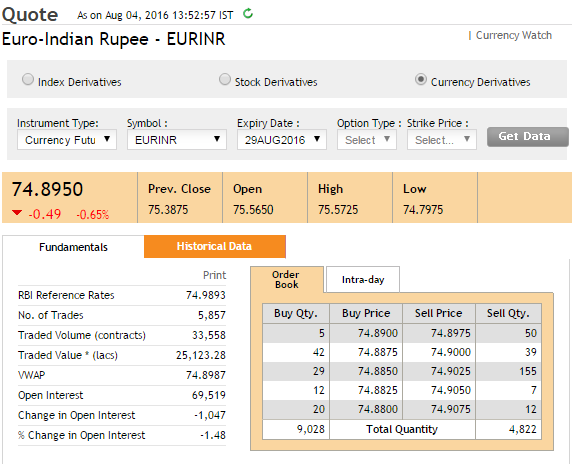
As you can see, the last traded price of the contract is 74.8950, with this we can estimate the contract value –
Contract Value = Lot size * Contract price
= 1000 * 74.8950
=74,895.0
Assuming the margin is approximately 2.5%, the margin should be in the vicinity if Rs.1,870/-, in fact, one can use the margin calculator on Zerodha to get the exact value of the margin required.
So the margins are slightly higher than the USD INR pair, but still way lower compared to what is required for any equity derivative contract.

GBP INR
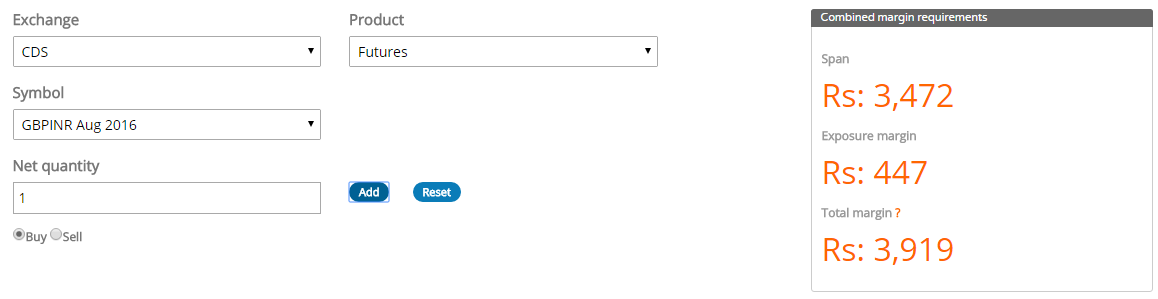
The GBP INR contract is probably the 2nd most popular currency contract after the USD INR pair. On the contract specification side of things, everything remains the same except for the lot size and the underlying. The underlying is the exchange rate of 1 GBP in Indian Rupees. The lot size is £1,000, which makes the contract value approximately Rs.89,345/- considering the futures are trading at 89.3450 as of 5th August 2016.
As you see below, the margin required for this slightly higher compared to the other two contracts we’ve already discussed–
By the way, did you know in the international markets that the GBP USD pair is also called the ‘Cable’?. So, when you hear a currency trader says he is short cable, he means he is short GBP USD cross.

JPY INR
The JPY INR contracts are a bit tricky compared to the other currency contracts. The lot size is not the usual 1000 units, but 100000 and the underlying here is the exchange rate for 100 Japanese Yen in Indian Rupees.
So when we look at this –
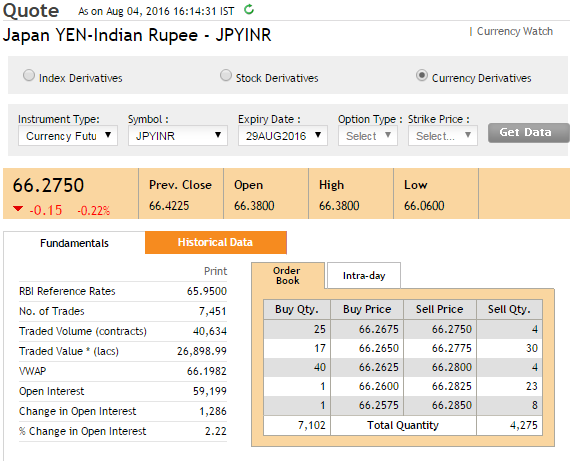
We are essentially looking at the rate of 100 Japanese Yen, stated in Indian Rupees. In other words, it costs Rs.66.2750 to buy 100 Japanese Yen. Since the lot size is 100,000 the contract value is –
= (100000 *66.2750) / 100
= Rs.66,275/-
The P&L for one pip(tick) movement of the currency will be 0.0025*1000= Rs 2.5 which is the same for all INR pairs
The margin required for the JPY INR contract is Rs.2,808/-,, which translates to about 4.2%.
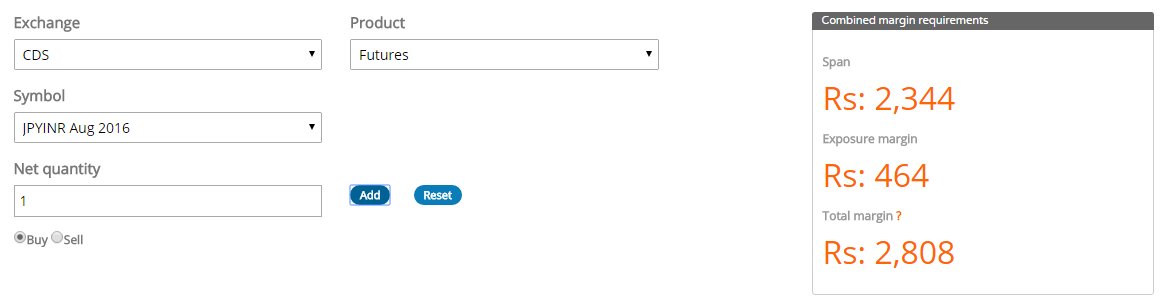
Clearly, the margins required for JPY INR contract is the highest in the currency segment, and I guess this is because this contract could be the most volatile (owing to lower liquidity). Of course, this is just a casual observation, and I’d encourage you to calculate the actual value on Excel to get a perspective on the volatility of JPY INR.
Spread contracts are available on all the currency pairs across all the expiries. Here is the snapshot of the same form NSE’s website –
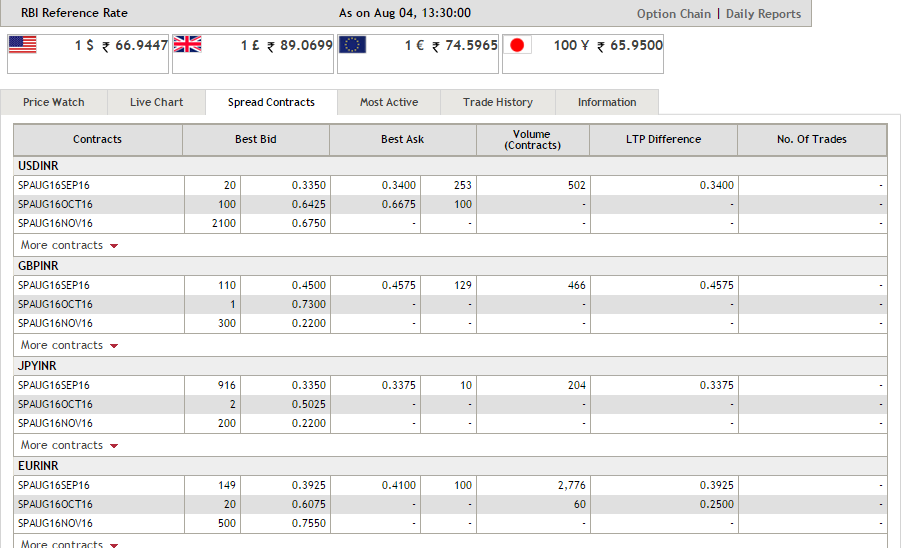
But as you can see, the spread contracts (apart from USD INR) are not really liquid.
Finally, if you were to select contracts to trade based on liquidity, here is what I’d suggest you look at, in order of preference–
- USD INR Futures
- USD INR ATM Options
- GBP INR Futures
- EUR INR Futures
- JPY INR Futures
With this, I’m assuming that you are clear with the logistics involved in currency trading. We now focus on developing some basic trading approach.
6.2 – The test for seasonality
There is often a lot of debate on the seasonality involved in currencies. By seasonality I mean things like “USD INR always goes down in December” or something like “USD INR always goes up a week before expiry”. In fact, many people base their trades based on this expectation without actually validating for seasonality. Given this, we thought we should check for the seasonality in currencies, and needless to say, we picked the USD INR spot data to run the required test.
** Warning**
The following discussion can get a bit technical, and this is not meant for regular Varsity readers. If you want a direct answer for whether any seasonality exists in the USD INR pair, then the straight forward answer is – no, there is the seasonality of any sort across any time frame. With this conclusion, you can jump directly to the next section. However, if you have a statistical approach to things, then you may want to read through. Of course, I’ll try my best to keep it brief.
Also, this section is contributed by our good friend Prakash; any queries regarding this should be directed to [email protected].
Seasonality in any time series can be checked by employing a statistical test called “Holt-Winters test”. A typical Holt-Winters method has 3 components –
- Level
- Trend
- Seasonality
Level: this indicator measures the average change in USD INR on a YOY basis
Trend: This indicator measures the average change in USD INR on a month on month basis
Seasonality: This indicator measures if there is any seasonal impact on price change. For example – USD INR almost always rises in January, and almost always falls in April etc.
There are two possibilities for components (level, trend, and seasonality)
- Additive
- Multiplicative
I guess the details of this are beyond the scope of this discussion.
Holt-Winters test for seasonality:
In Holt-Winters test, we check for seasonality in a time series by building a forecast model (let us call it Model 1) and study its residuals. Model 1 does not have any seasonality component inbuilt. We then build another forecast model with a seasonality component (Model 2) and check for the errors of this model.
We compare the errors of both the models and compare to check if model 2 gives us a better forecast when compared to Model 1. We do this by employing ‘Chi-Square’ test to determine if accuracies are better. If Model 2 is statistically better than Model 1, then we conclude that there is some seasonal pattern in data. However, if the accuracies are the same for both models or if Model 1 has better accuracy, there is no seasonality in data.
Seasonality results for USD INR
Check for weekly seasonality:
Model 1 (without seasonality component): The best model is (M, N, N) with coefficients 0.9999
This model indicates that weekly data has only a level component and no trend component. The coefficient of “level” is 0.9999, i.e. next week’s price is about 0.9999 times this week’s price.
For readers who are aware of the Random Walk Theory will be able to appreciate these parameters. The model is suggesting that every week USD INR price movement is a random walk.
Model 2 (with seasonality component): The best model is (M, N, M) with coefficients 0.7 and 0.0786
This model indicates that weekly data have a level and seasonality component. The interpretation is that next week’s price is 0.7 times of this week’s price and the remaining price is contributed by seasonality.
Conclusion: Chi-square test concluded that there is a 100% chance that model 2 accuracy is the same as model 1 accuracy, i.e. forcing a seasonality model on USD INR isn’t increasing its accuracy.
This can only happen when there is no seasonality in the data. As the data is prepared for weekly analysis, we can conclude that there is no seasonality on weekly a basis.
Monthly seasonality:
Model 1: The best model is (A, N, N) with coefficients 0.9999
Like in the case of a weekly model, model on monthly data also suggests a random walk.
Model 2: The best model is (A, N, A) with coefficients 0.9999 and 0.0001
This model indicates that next month closing price is almost the same as this month’s closing price with a small impact of seasonality.
Conclusion: Chi-square test concluded that there is a 20% chance that model 2 accuracy is better than model 1 accuracy. In statistical terms, such improvement in accuracy might happen due to randomness, like the window period you choose, the sample data etc.
Typically in statistics, the norm is to look for at least 95% chance that model 2’s accuracy is better than model 1’s to conclude there is seasonality in data. So in the case of USD-INR, we can conclude that there is neither monthly nor weekly seasonality.
The last 8 years USD INR spot data for this is taken from RBI’s website.
So the next time you hear someone make a random statement like “the USD INR pair almost always goes down before Christmas”, then you know he is just trying to sound smart with no real insights. ☺
6.3 – Classic TA
Think about conducting a fundamental analysis of a company, for example – Hindustan Unilever Limited. Typically, you would study its business, financial statements, corporate governance, study its peers, and perhaps build a financial model to identify if the stock is worth investing in. Fundamental analysis is a straight forward affair when it comes to equities. However when you look at currency pairs, USD INR for example, they’re a lot more fundamental dimensions – the macroeconomics of the USA which is dependent on multiple domestic and international factors and the macroeconomics of India which is again dependent on multiple domestic and international factors. Once you understand these, you need to weigh each one of these against another and build a relative view.
This is no easy task, and not many are capable of doing this. It would help if you were an economist with a trader’s mindset to pull off quality fundamental analysis on currency pairs. Perhaps, this is the reason why Technical Analysis (TA) is so much more popular when it comes to trading currencies and commodities. As you are probably aware, Technical Analysis assumes that the price that you see on the screen discounts everything, including all the complex fundamental views that are panning out at the moment. With this assumption, you go ahead and analyze the charts and develop a viewpoint.
TA on currencies and commodities works just like it does on equities. If you are not conversant on how to use Technical Analysis, I’d strongly suggest you read through this module on TA.
I’ll post few snapshots of TA based trade setups –
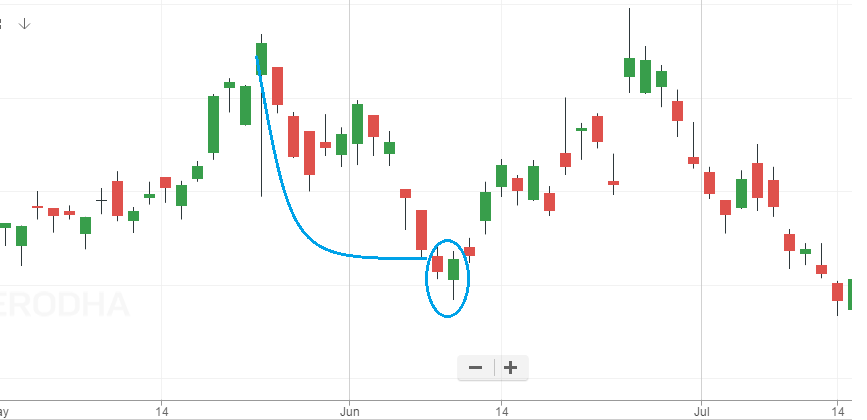
The two encircled candles form a classic candlestick pattern called ‘Piercing pattern’. The piercing pattern suggests the trader go long on the USD INR pair. As you can see, the trade panned out well without triggering the stop loss.
Here is a bearish Marubozu on GBP INR –
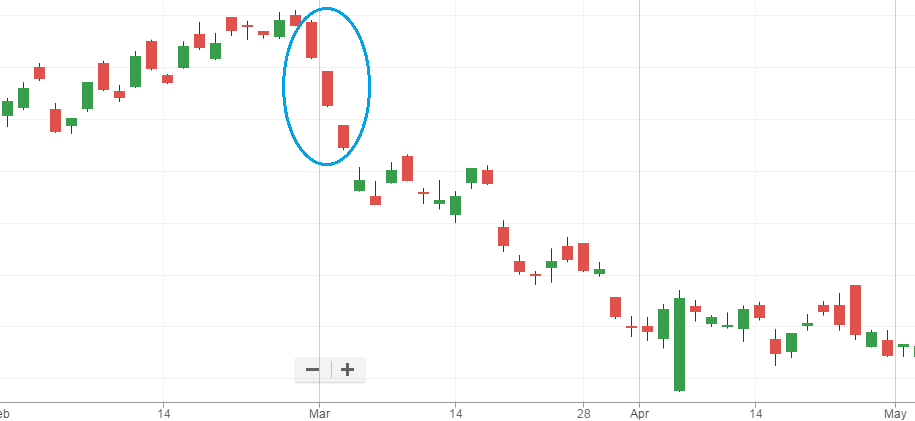
The bearish Marubozu suggests you short the underlying with an expectation that the asset will continue to slide down.
Naturally, the trade setups can be endless. I know many people are under the belief that currency and commodities require one to know a different set of technical analysis, but this is not true. TA works the same way on any time series data, be it – stocks, commodities, currencies, or bonds.
And with this, I would like to end our discussion on Currencies and would like to start our discussion on the 2nd part of this module, i.e. commodity trading.
Key takeaways from the chapter
- The underlying for EUR INR is the spot rate of 1 Euro in Indian Rupees.
- The lot size for EUR INR is €
- The underlying for GBP INR is the spot rate of 1 GBP in Indian Rupees. GBP INR is the 2nd most traded contract in the currency segment.
- The lot size for GBP INR is £.
- Internationally GBP USD is also referred to as the ‘Cable’.
- JPY INR has the highest margin requirement in the currency segment, perhaps due to the higher volatility.
- Lot size in JPY INR is 100000.
- The underlying in JPY INR is the rate of 100 Japanese Yen in Indian Rupees.
- As opposed to popular belief, there is no seasonality in the USD INR pair – either every week or every month.
- TA can be applied to currencies just like the way it can be applied to stocks.
Hello Karthik – Thanks for the lucid language used. I am a bit confused. My query is – As per your screen shot of margin in GBP INR section, you have inputted the quantity as 1. Is it actually 1 or it means (1 * £1,000) 1,000 units ? Also, as per the 1st NSE screen shot used, Buy Qty in Order book tab is showing as 5. Is it actually 5 or it means (5 * € 1,000) 5,000 units at 74.89. Thanks
1 here means 1 lot, 1 lot in turn refers to 1000. Similarly, 5 refers to 5 lots, or 5000.
Got it..!! Thanks for the clarification.
Welcome!
When will eurusd trading start in zerodha
Working on it, Rohit. Hopefully soon.
USDINR are Nifty are inversely related , what about other currency pairs?
I would guess they are, have not checked for this. If you happen to check this, please do share the results with all of us 🙂
What about cross currency pair trading , how can we do that with zerodha ? After the recent RBI guideline is it legal yet to trade with cross currency pair, from india ? I want to trade in a 27×7 market to remove the gap Up/Down risk, is there any legal way to do that from india ?
RBI has given the exchanges a nod for cross currency pairs, I’m guessing we will have it going sometime later this year. Please remember to trade these pairs only on recognized exchanges like NSE and not on other platforms.
Thanks for the reply ..
In this point I have two question
1>After launching the pair can we able to trade it 24×7 or it will have some time like 9 am to 7 pm IST , because my main moto is to remove the gap Up/Down risk at the time of market opening ?
2>Till now is it legal to trade these pair from india via any international forex broker (like alpari) because they give 24×7 market access ?
1) No it is highly unlikely that it would be made available 24×7
2) Nope
Hi Sir, I recently opened my account in zerodha. I sell 1 lot of usdinr @67.60 and covered this position @67.49. what would be profit ? ze brokerage charged rs.75.06. How?
Your profit will be 67.6 – 67.49 = 0.11
0.11 * 1000 = 110.
Brokerage will be 20+20 for buy and sell, the rest would be applicable charges. Btw, you should check the brokerage calculator – https://zerodha.com/brokerage-calculator
Thanks for reply sir, I checked the brokerage calculator it shows rs. 17.9026 (13.509 brokerage+appliable charges) but I have been charged rs. 75.06 (49.22 brokerage + applicable charges) on 1 lot. I did two more trade of 1 lot and on every trade i have been charged rs. 75.06 as total brokerage. Please tell why brokerage charged is different from brokerage shown in the calculator?
Request you to please speak to the support team for this.
Hi Karthik Sir,
I was trying to approach currency trading using “tradingview” charts as they are NYSE close charts which means there is no gap up/down problem while visualizing and placing support and resistance levels. My question actually is just a concern regarding to trade management. What will be a worse case scenario if I follow “tradingview” charts for stops and targets but trade on NSE. How do you see this approach??
You will have to correlated it to the Indian markets and identify the corresponding S&R levels. You can track the international markets and get a sense of where the markets are moving, but from a trade management perspective you will have to deal with Indian markets.